Screener based on Profitunity strategy for multiple timeframes
Screener based on Profitunity strategy by Bill Williams for multiple timeframes (max 5, including chart timeframe) and customizable symbol list. The screener analyzes the Alligator and Awesome Oscillator indicators, Divergent bars and high volume bars.
The maximum allowed number of requests (symbols and timeframes) is limited to 40 requests, for example, for 10 symbols by 4 requests of different timeframes. Therefore, the indicator automatically limits the number of displayed symbols depending on the number of timeframes for each symbol, if there are more symbols than are displayed in the screener table, then the ordinal numbers are displayed to the left of the symbols, in this case you can display the next group of symbols by increasing the value by 1 in the "Show tickers from" field, if the "Group" field is enabled, or specify the symbol number by 1 more than the last symbol in the screener table. 👀 When timeframe filtering is applied, the screener table displays only the columns of those timeframes for which the filtering value is selected, which allows displaying more symbols.
For each timeframe, in the "TIMEFRAMES > Prev" field, you can enable the display of data for the previous bar relative to the last (current) one, if the market is open for the requested symbol. In the "TIMEFRAMES > Y" field, you can enable filtering depending on the location of the last five bars relative to the Alligator indicator lines, which are designated by special symbols in the screener table:
⬆️ — if the Alligator is open upwards (Lips > Teeth > Jaw) and none of the bars is closed below the Lips line;
↗️ — if one of the bars, except for the penultimate one, is closed below Lips, or two bars, except for the last one, are closed below Lips, or the Alligator is open upwards only below four bars, but none of the bars is closed below Lips;
⬇️ — if the Alligator is open downwards (Lips < Teeth < Jaw), but none of the bars is closed above Lips;
↘️ — if one of the bars, except the penultimate one, is closed above the Lips, or two bars, except the last one, are closed above the Lips, or the Alligator is open down only above four bars, but none of the bars are closed above the Lips;
➡️ — in other cases, including when the Alligator lines intersect and one of the bars is closed behind the Lips line or two bars intersect one of the Alligator lines.
In the "TIMEFRAMES > Show bar change value for TF" field, you can add a column to the right of the selected timeframe column with the percentage change between the closing price of the last bar (current) and the closing price of the previous bar ((close – previous close) / previous close * 100). Depending on the percentage value, the background color of the screener table cell will change: dark red if <= -3%; red if <= -2%, light red if <= -0.5%; dark green if >= 3%; green if >= 2%; light green if >= 0.5%.
For each timeframe, the screener table displays the symbol of the latest (current) bar, depending on the closing price relative to the bar's midpoint ((high + low) / 2) and its location relative to the Alligator indicator lines: ⎾ — the bar's closing price is above its midpoint; ⎿ — the bar's closing price is below its midpoint; ├ — the bar's closing price is equal to its midpoint; 🟢 — Bullish Divergent bar, i.e. the bar's closing price is above its midpoint, the bar's high is below all Alligator lines, the bar's low is below the previous bar's low; 🔴 — Bearish Divergent bar, i.e. the bar's closing price is below its midpoint, the bar's low is above all Alligator lines, the bar's high is above the previous bar's high. When filtering is enabled in the "TIMEFRAMES > Filtering by Divergent bar" field, the data in the screener table cells will be displayed only for those timeframes that have a Divergent bar. A high bar volume signal is also displayed — 📶/📶² if the bar volume is greater than 40%/70% of the average volume value calculated using a simple moving average (SMA) in the 140 bar interval from the last bar.
In the indicator settings in the "SYMBOL LIST" field, each ticker (for example: OANDA:SPX500USD) must be on a separate line. If the market is closed, then the data for requested symbols will be limited to the time of the last (current) bar on the chart, for example, if the current symbol was traded yesterday, and the requested symbol is traded today, when requesting data for an hourly timeframe, the last bar will be for yesterday, if the timeframe of the current chart is not higher than 1 day. Therefore, by default, a warning will be displayed on the chart instead of the screener table that if the market is open, you must wait for the screener to load (after the first price change on the current chart), or if the highest timeframe in the screener is 1 day, you will be prompted to change the timeframe on the current chart to 1 week, if the screener requests data for the timeframe of 1 week, you will be prompted to change the timeframe on the current chart to 1 month, or switch to another symbol on the current chart for which the market is open (for example: BINANCE:BTCUSDT), or disable the warning in the field "SYMBOL LIST > Do not display screener if market is close".
The number of the last columns with the color of the AO indicator that will be displayed in the screener table for each timeframe is specified in the indicator settings in the "AWESOME OSCILLATOR > Number of columns" field.
For each timeframe, the direction of the trend between the price of the highest and lowest bars in the specified range of bars from the last bar is displayed — ↑ if the trend is up (the highest bar is to the right of the lowest), or ↓ if the trend is down (the lowest bar is to the right of the highest). If there is a divergence on the AO indicator in the specified interval, the symbol ∇ is also displayed. The average volume value is also calculated in the specified interval using a simple moving average (SMA). The number of bars is set in the indicator settings in the "INTERVAL FOR HIGHEST AND LOWEST BARS > Bars count" field.
In the indicator settings in the "STYLE" field you can change the position of the screener table relative to the chart window, the background color, the color and size of the text.
***
Скринер на основе стратегии Profitunity Билла Вильямса для нескольких таймфреймов (максимум 5, включая таймфрейм графика) и настраиваемого списка символов. Скринер анализирует индикаторы Alligator и Awesome Oscillator, Дивергентные бары и бары с высоким объемом.
Максимально допустимое количество запросов (символы и таймфреймы) ограничено 40 запросами, например, для 10 символов по 4 запроса разных таймфреймов. Поэтому в индикаторе автоматически ограничивается количество отображаемых символов в зависимости от количества таймфреймов для каждого символа, если символов больше чем отображено в таблице скринера, то слева от символов отображаются порядковые номера, в таком случае можно отобразить следующую группу символов, увеличив значение на 1 в настройках индикатора поле "Show tickers from", если включено поле "Group", или указать номер символа на 1 больше, чем последний символ в таблице скринера. 👀 Когда применяется фильтрация по таймфрейму, в таблице скринера отображаются только столбцы тех таймфреймов, для которых выбрано значение фильтрации, что позволяет отображать большее количество символов.
Для каждого таймфрейма в настройках индикатора в поле "TIMEFRAMES > Prev" можно включить отображение данных для предыдущего бара относительно последнего (текущего), если для запрашиваемого символа рынок открыт. В поле "TIMEFRAMES > Y" можно включить фильтрацию, в зависимости от расположения последних пяти баров относительно линий индикатора Alligator, которые обозначаются специальными символами в таблице скринера:
⬆️ — если Alligator открыт вверх (Lips > Teeth > Jaw) и ни один из баров не закрыт ниже линии Lips;
↗️ — если один из баров, кроме предпоследнего, закрыт ниже Lips, или два бара, кроме последнего, закрыты ниже Lips, или Alligator открыт вверх только ниже четырех баров, но ни один из баров не закрыт ниже Lips;
⬇️ — если Alligator открыт вниз (Lips < Teeth < Jaw), но ни один из баров не закрыт выше Lips;
↘️ — если один из баров, кроме предпоследнего, закрыт выше Lips, или два бара, кроме последнего, закрыты выше Lips, или Alligator открыт вниз только выше четырех баров, но ни один из баров не закрыт выше Lips;
➡️ — в остальных случаях, в то числе когда линии Alligator пересекаются и один из баров закрыт за линией Lips или два бара пересекают одну из линий Alligator.
В поле "TIMEFRAMES > Show bar change value for TF" можно добавить справа от выбранного столбца таймфрейма столбец с процентным изменением между ценой закрытия последнего бара (текущего) и ценой закрытия предыдущего бара ((close – previous close) / previous close * 100). В зависимости от величины процента будет меняться цвет фона ячейки таблицы скринера: темно-красный, если <= -3%; красный, если <= -2%, светло-красный, если <= -0.5%; темно-зеленый, если >= 3%; зеленый, если >= 2%; светло-зеленый, если >= 0.5%.
Для каждого таймфрейма в таблице скринера отображается символ последнего (текущего) бара, в зависимости от цены закрытия относительно середины бара ((high + low) / 2) и расположения относительно линий индикатора Alligator: ⎾ — цена закрытия бара выше его середины; ⎿ — цена закрытия бара ниже его середины; ├ — цена закрытия бара равна его середине; 🟢 — Бычий Дивергентный бар, т.е. цена закрытия бара выше его середины, максимум бара ниже всех линий Alligator, минимум бара ниже минимума предыдущего бара; 🔴 — Медвежий Дивергентный бар, т.е. цена закрытия бара ниже его середины, минимум бара выше всех линий Alligator, максимум бара выше максимума предыдущего бара. При включении фильтрации в поле "TIMEFRAMES > Filtering by Divergent bar" данные в ячейках таблицы скринера будут отображаться только для тех таймфреймов, где есть Дивергентный бар. Также отображается сигнал высокого объема бара — 📶/📶², если объем бара больше чем на 40%/70% среднего значения объема, рассчитанного с помощью простой скользящей средней (SMA) в интервале 140 баров от последнего бара.
В настройках индикатора в поле "SYMBOL LIST" каждый тикер (например: OANDA:SPX500USD) должен быть на отдельной строке. Если рынок закрыт, то данные для запрашиваемых символов будут ограничены временем последнего (текущего) бара на графике, например, если текущий символ торговался последний день вчера, а запрашиваемый символ торгуется сегодня, при запросе данных для часового таймфрейма, последний бар будет за вчерашний день, если таймфрейм текущего графика не выше 1 дня. Поэтому по умолчанию на графике будет отображаться предупреждение вместо таблицы скринера о том, что если рынок открыт, то необходимо дождаться загрузки скринера (после первого изменения цены на текущем графике), или если в скринере самый высокий таймфрейм 1 день, то будет предложено изменить на текущем графике таймфрейм на 1 неделю, если в скринере запрашиваются данные для таймфрейма 1 неделя, то будет предложено изменить на текущем графике таймфрейм на 1 месяц, или же переключиться на другой символ на текущем графике, для которого рынок открыт (например: BINANCE:BTCUSDT), или отключить предупреждение в поле "SYMBOL LIST > Do not display screener if market is close".
Количество последних столбцов с цветом индикатора AO, которые будут отображены в таблице скринера для каждого таймфрейма, указывается в настройках индикатора в поле "AWESOME OSCILLATOR > Number of columns".
Для каждого таймфрейма отображается направление тренда между ценой самого высокого и самого низкого баров в указанном интервале баров от последнего бара — ↑, если тренд направлен вверх (самый высокий бар справа от самого низкого), или ↓, если тренд направлен вниз (самый низкий бар справа от самого высокого). Если есть дивергенция на индикаторе AO в указанном интервале, то также отображается символ — ∇. В указанном интервале также рассчитывается среднее значение объема с помощью простой скользящей средней (SMA). Количество баров устанавливается в настройках индикатора в поле "INTERVAL FOR HIGHEST AND LOWEST BARS > Bars count".
В настройках индикатора в поле "STYLE" можно изменить положение таблицы скринера относительно окна графика, цвет фона, цвет и размер текста.
Cerca negli script per "screener"

Screener for 40+ instrumentsAs you probably know in TradingView there is a limit of 40 instruments in one custom screener.
I created a script that will allow you to scan more symbols.
The idea of it is pretty simple. You have to add a screener a few times on your screen with a different set of symbols. Then select column width (as % of your chart width) and # of the screener right to left.
Script will plot #1 screener next to the right border. For #2 and all next tables, the script will compute the needed offset and will draw it on the left. This way it will look like one table and not a few separate indicators.
I created a script with an RSI screener, but you can create more complicated examples with it.
Off course, that's not a silver bullet solution but might work for some of you.
Disclaimer
Please remember that past performance may not be indicative of future results.
Due to various factors, including changing market conditions, the strategy may no longer perform as well as in historical backtesting.
This post and the script don’t provide any financial advice.

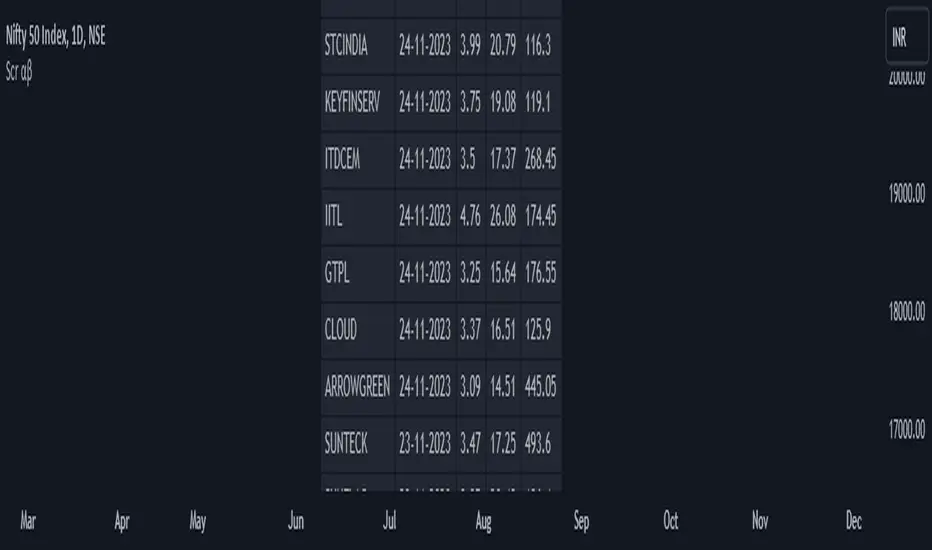
Screener: Alpha & BetaThis is a Live Screener for my previous Alpha & Beta indicator, which filters stocks lively based on the given values.
Use 5min timeframe for Live Intraday.
The default stocks in the screener is selected based on high beta value from F&O listed stocks. It may include other stocks also.
User can input stocks of your choice either through the menu or through the Pine editor.
The maximum number of stocks inputs is only 40. The indicator includes only 20 stocks by default.
More number of stocks can be added but it makes the screener slower to load.
Open the indicator in a sperate tab or window to avoided the loading lag.
It is recommended to choose only 10 to 20 stocks based on the weightage from each sectors.
Beta values are dynamic. It changes from day to day based on the trend and sector.
Update the sock list weekly or twice a week or monthly.
Use investing.com screener(preferably) or TradingView screener for shortlisting beta stocks.
Remember that majority of indicators fails in a sideways market, also every indicator is not 100% accurate.
MOST + Moving Average ScreenerScreener version of Anıl Özekşi's Moving Stop Loss (MOST) Indicator:
USERS MAY SCREEN MOST WITH 11 DIFFERENT TYPES OF MOVING AVERAGES + THEY CAN ALSO SCREEN SIGNALS WITH THAT 11 MOVING AVERAGES INSTEAD OF USING MOST LINE.
Adjustable Moving Average Types:
SMA : Simple Moving Average
EMA : Exponential Moving Average
WMA : Weighted Moving Average
DEMA : Double Exponential Moving Average
TMA : Triangular Moving Average
VAR : Variable Index Dynamic Moving Average aka VIDYA
WWMA : Welles Wilder's Moving Average
ZLEMA : Zero Lag Exponential Moving Average
TSF : True Strength Force
HULL : Hull Moving Average
TILL : Tillson T3 Moving Average
About Screener Panel:
Users can explore 20 different and user-defined tickers, which can be changed from the SETTINGS (shares, crypto, commodities...) on this screener version.
The screener panel shows up right after the bars on the right side of the chart.
-In this screener version of MOST, users can define the number of demanded tickers (symbols) from 1 to 20 by checking the relevant boxes on the settings tab.
-All selected tickers can be screened in different timeframes.
-Also, different timeframes of the same Ticker can be screened.
IMPORTANT NOTICE:
Screener shows the results in 3 different logic:
1st LOGIC (Default Settings):
BUY AND SELL SIGNALS of MOST and MOVING AVERAGE LINE
Most Buy Signal: Moving Average Crosses ABOVE the MOST LINE
Most Sel Signal: Moving Average Crosses BELOW the MOST LINE
Tickers seen in green are the ones that are in an uptrend, according to MOST.
The ones that appear in red are those in the SELL signal, in a downtrend.
The numbers before each Ticker indicate how many bars passed after MOST's last BUY or SELL signal.
For example, according to the indicator, when BTCUSDT appears (3) in GREEN, Bitcoin switched to a BUY signal 3 bars ago.
2nd LOGIC (Moving Average & Price Flips Screener Mode):
This mode can only be activated by checking the 'Activate Moving Average Screening Mode' box on the settings menu.
MOST line will be disappeared after checking the box.
Buy Signal: When the Selected Price crosses ABOVE the selected Moving Average.
Sell Signal: When the Selected Price crosses BELOW the selected Moving Average.
Tickers seen in green are the ones that are in an uptrend, according to Moving Average & Price Flips.
The ones that appear in red are those in the SELL signal, in a downtrend.
The numbers before each Ticker indicate how many bars passed after the last BUY or SELL signal of Moving Average & Price Flips.
For example, according to the indicator, when BTCUSDT appears (3) in GREEN, Bitcoin switched to a BUY signal 3 bars ago.
3rd LOGIC (Moving Average Color Change Screener Mode):
Both 'Activate Moving Average Screening Mode' and 'Activate Moving Average Color Change Screening Mode' boxes must be checked in the settings tab.
Moving Average Line will turn out into two colors.
Green color means the moving average value is greater than the previous bar's value.
Red color means the moving average value is smaller than the previous bar's value.
Buy Signal: After the Selected Moving Average turns GREEN from red.
Sell Signal: After the Selected Moving Average turns RED from green.
-Screener shows the information about the color changes of the selected Moving Average with default settings.
If this option is preferred, users are advised to enlarge the length to have better signals.
Tickers seen in green are the ones that are in an uptrend, according to Moving Average Color.
The ones that appear in red are those in the SELL signal, in a downtrend.
The numbers before each Ticker indicate how many bars passed after the last BUY or SELL signal of Moving Average Color Change.
For example, according to the indicator, when BTCUSDT appears (3) in GREEN, Bitcoin switched to a BUY signal 3 bars ago.

Screener - Mean Reversion Channel█ OVERVIEW
This is Screener script for Mean Reversion Channel Indicator
█ Description & How To Use
The screener works by scanning through up to 40 symbols and list down symbols that are currently within Overbought/Oversold Zone as defined by Mean Reversion Channel indicator.
The Overbought/Oversold Zone are further categorized and sorted by:
Strong : Indicated by "(Strong)" next to the symbol name
Normal : Indicated by the absence of "(Strong)" or "(Weak)" next to the symbol name
Weak : Indicated by "(Weak)" next to the symbol name
Notes: Refer to chart above to see how the Zone are categorized.
Notes: If the screener displays "Nothing Interesting". It simply means none of the screened assets are within the Overbought/Oversold Zone.
█ Features
- Scan up to 40 symbols at a time (By default, no asset is define. Once configured all the symbols you required, remember to save as default to save you from pain of configuring it again in the future)
- Options to scan by zones
- Custom Timeframe
█ Limitation
Due to multiple use of security() function required to call other symbols, expect the screener to be slow at certain times
█ Disclaimer
Past performance is not an indicator of future results.
My opinions and research are my own and do not constitute financial advice in any way whatsoever.
Nothing published by me constitutes an investment recommendation, nor should any data or Content published by me be relied upon for any investment/trading activities.
I strongly recommends that you perform your own independent research and/or speak with a qualified investment professional before making any financial decisions.
Any ideas to further improve this indicator are welcome :)
Credit: QuantNomad for his script idea on custom screener

Screener Price Percentage ChangeA screener that displays price percentage change in actual chart timeframe and the default Daily, Weekly and Monthly.
The actual time frame also displays last value percentage change.
For example, if actual timeframe is "Monthly, it is going to display also the last "previous Monthly percentage price change.
Can select 3 more assets to display.
Full control of Panel position and size.
A modified version of @Mohamed3nan
Para el Shiaks

Multiple Screeners with AlertsI already published few version of my custom screeners. Unfortunately, because of TradingView's security function call limit you can't use more than 40 stocks in 1 screener.
Fortunately, you can compute multiple values in your function and screen few indicators at once.
In this script I show how you can compute 5 indicators at the same time for 40 instruments. I display then in different labels.
Every label consist of list of instruments satisfying current indicator conditions and a value for it. It can be absolute value as for RSI or -1/1 representing Bullish/Bearish event.
Also you can create 1 alert with result of all screeners inside.
In this example I took 5 indicators with following conditions:
RSI - "RSI < 30" or "RSI > 70"
TSI - "TSI < -30" or "RSI >30"
ADX - "ADX > 40"
MACD - "MACD Bullish Cross" or "MACD Bearish Cross" (1 and -1 in screener)
AO - "AO Crosses 0 UP" or "AO Crosses 0 DOWN" (1 and -1 in screener)
Params
- bars_apart - this parameter define how may bars apart you labels are on your chart. If you see labels overlapping, increase this number.
- Parameters for all used indicators
- 40 symbol inputs for instruments you want to use in this screener
Alerts
You can create an alert from it easily by selecting screener name from the list and then selecting "Any alert() function call".
No additional configuration is required, message and alert on close is generated in the code.
You should better change default name for your alert. Sometimes because of big amount of inputs you might receive an error.
Disclaimer
Please remember that past performance may not be indicative of future results.
Due to various factors, including changing market conditions, the strategy may no longer perform as good as in historical backtesting.
This post and the script don’t provide any financial advice.

Psych Level ScreenerThis Script is intended for Pine Screener and is not designed as a indicator!!!
Pine Screener is something TradingView has recently added and is still only a Beta version.
Pine Screener itself is currently only available to members that are Premium and above.
What it does:
This screener will actively look for tickers that are close to Pysch level in your watchlist.
Psych level here refers to price levels that are round numbers such as 50,100,1000.
Users can specify the offset from a psych level (in %) and scanner will scan for tickers that are within the offset. For example if offset is set at 5% then it will scan for tickers that are within +/-5% of a ticker. (for $100 psych level it will scan for ticker in $95-105 range)
Once scan is completed you will be able to see:
- Current price of ticker
- Closest psych level for that ticker
- % and $ move required for it to hit that psych level
- Ticker's day range and Average range (with % of average range completed for the day)
- Ticker volume and average volume
Setting up:
www.tradingview.com
Above link will help you guide how to setup Pine screener.
Use steps below to guide you the setup for this specific screener:
1. Open Pine Screener (open new tab, select screener the "Pine")
2. At the top, click on "Choose Indicator" and select "Psych Level Screener"
3. At the top again, click "Indicator Psych Level Screener" and select settings.
4. Change setting to your needs. Hit Apply when done.
a)"% offset from Psych Level" will scan for any stocks in your watchlist which are +/- from the offset you chose for any given psych level. Default is 5. (e.g. If offset is 5%, it will scan for stocks that are between $95-$105 vs $100 psych level, $190-$210 for $200 psych level and so on)
b) ATR length is number of previous trading days you want to include in your calculation. Moving Average Type is calculation method.
c) Rvol length is number of previous trading days you want to include in your calculation.
5. On top left, click "Price within specified offset of Psych. Level" and select true. Then select "Scan" which is located at the top next to "Indicator Psych Level Screener". This will filter out all the stock that meets the condition.
6. At the end of the column on the right there is a "+" symbol. From there you can add/remove columns. 30min/1hr/4hr/1D Trend are disabled by default so if this is needed please enable them.
7. You can change the order of ticker by ascending and descending order of each column label if needed. Just click on the arrow that comes up when you move the cursor to any of the column items.
8. You can specify advanced filter settings based on the variables in the column. (e.g., set price range of stock to filter out further) To do so, click on the column variable name in interest, located above the screener table (or right below "scan") and select "manual setup".
How to read the column:
Current Price: Shows current price of the ticker when scan was done. Currently Pine Screener does NOT support pre/post-hours data so no PM and AH price.
Psych Level: Psych level the current price is near to.
% to Psych Level: Price movement in % necessary to get to the Psych level.
$ to Psych Level: Price movement in $ necessary to get to the Psych level.
DTR: Daily True Range of the stock. i.e. High - Low of the ticker on the day.
ATR: Average True Range of stock in the last x days, where x is a value selected in the setting. (See step 3 in Previous section)
DTR vs ATR: Amount of DTR a ticker has done in % with respect to ATR. (e.g., 90% means DTR is 90% of ATR)
Vol.: Volume of a ticker for the day. Currently Pine Screener does NOT support pre/post-hours data so no PM and AH volume.
Avg. Vol: Average volume of a ticker in the last x days, where x is a value selected in the setting. (See step 3 in Previous section)
Rvol: Relative volume in percentage, measured by the ratio of day's volume and average volume.
30min/1hr/4hr/1D Trend: Trend status to see if the chart is Bullish or Bearish on each of the time frame. Bullishness or Bearishness is defined by the price being over or under the 34/50 cloud on each of the time frame. Output of 1 is Bullish, -1 is Bearish. 0 means price is sitting inside the 34/50 cloud. Currently Pine Screener does NOT support pre/post-hours data so 34/50 cloud is based on regular trading hours data ONLY.
Some things user should be aware of:
- Pine Screener itself is currently only available to TradingView members with Premium Subscription and above. (I can't to anything about this as this is NOT set by me, I have no control) For more info: www.tradingview.com
- The Pine Screener itself is a Beta version and this screener can stop working anytime depending on changes made by TradingView themselves. (Again I cannot control this)
- Pine Screener can only run on Watchlists for now. (as of 03/31/2025) You will have to prepare your own watchlists. In a Watchlist no more than 1000 tickers may be added. (This is TradingView rules)
- Psych level included are currently 50 to 1500 in steps of 50. If you need a specific number please let me know. Will add accordingly.
- Unfortunately this screener does not update automatically, so please hit "scan" to get latest screener result.
- I cannot add 10min trend to the column as Pine Screener does NOT support 10min timeframe as of now. (03/31/2025)
- This code is only meant for Pine Screener. I do NOT recommend using this as an indicator.
- Currently Pine Screener does NOT support pre/post-hours data. So data such as Price, Volume and EMA values are based on market hours data ONLY! (If I'm wrong about this please correct me / let me know and will make look into and make changes to the code)
Other useful links about Pine Screener:
Quick overview of the Screener’s functionality: www.tradingview.com
what do you need to know before you start working? : www.tradingview.com
These links will go over the setting up with GIFs so is easier to understand.
-----------------------------------------------------------------------------------------------------------------
If there are other column variables that you think is worth adding please let me know! Will try add it to the screener!
If you have any questions let me know as well, will reply soon as I can!
Have a good trading day and hope it helps!

Your CRYPTO Screener - MACD 0 LAG editionHello traders
What's good?
1 - Quick introduction
This script is to demonstrate a proof-of-concept - showing you again what you thought wasn't possible might become (with some tricks) in the realm of possibles !!!.
I get requests for people who want a custom screener because the native TradingView Stocks/Forex/Crypto screeners don't allow to plug external indicators. (example: www.tradingview.com
This is entirely true and I have also good news for you, we can hack the system one more time. As Hackerman would say, "IT"S HACKING TIME !!!" (ref : KUNG FURY . (#geek #reference #done #for #today)
What if you could build your own personalized screener based on your custom indicator? "No Dave stop smoking, that's not possible, go back to eating your baguette". Say no more, let me present you my new script called YOUR CRYPTO Screener (MACD 0 LAG)
2 - What is a MACD ZERO LAG?
We'll all agree this indicator is NOT in the TradingView screeners so I'm not cheating here :)
A MACD ZERO LAG is a MACD that .... suspens.... wait for it.... DOES NOT lag.
The traditional MACD is based on exponential moving averages and as moving averages are lagging, then the MACD is lagging also. I'll spare you all the maths behind the MACD ZERO LAG but in short, this is a way more reactive indicator than the traditional MACD
I shared before the version that I personally use for my own trading : MACD 0 LAG nTREND coloring
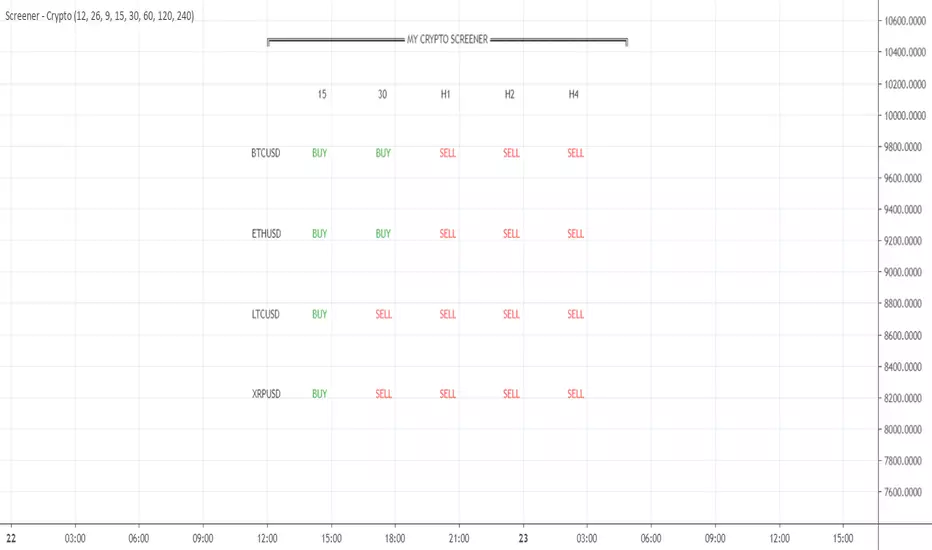
3 - Crypto Screener specifications
If I could do a screener as complete as the native one, this would be wonderful but ... we cannot and this is due to technical reasons. To call indicators from different timeframes, I have to use the security function. And we're limited to 40 security calls per indicator.
That explains why I selected 4 crypto assets and 5 timeframes and the MACD zero lag output for each asset/timeframe - which gives a total of 4 * 5 * 2 = 40
You'll be able to select from the interface the 5 timeframes that you want for your screener
In this script, you'll get a :
- BUY whenever the MACD ZERO LAG for your asset/timeframe is green.
- SELL whenever the MACD ZERO LAG for your asset/timeframe is red.
4 - Can you hack it even more?
If you want to add other timeframes or assets, you can either, change the code or add the indicator on another chart.
I made the source code generic enough so that you can update it yourself easily
Example:
Chart 1 will list BTCUSD, ETHUSD, LTCUSD, and XRPUSD in m5/m15/m30/H1/H4 and Chart2 could list BTCUSD, ETHUSD, LTCUSD and XRPUSD in H6/H8/H12/Daily, etc...
Once again the sky (and your computer RAM capacity) is the limit
5 - Can you super hack it even more?
1/ This script is only a proof-of-concept that you can build your own custom screener. Imagine having the Algorithm Builder and being able to connect it in a single click to a custom screener using your own configuration :)
How coooooooooooooooool would that be!!!
This screener version will be available on my website in a few weeks along with all the tools I'm spamming you about since the beginning of July (#shameless #self-advertising)
2/ For a nicer scripter, let's keep in mind that TradingView just enabled Webhooks this week. This will allow my company to offer custom screeners design and hosted on your own website. Those screeners will be for sure nicer than the indicator version
That's it for today and for this week
I won't even touch the laptop this weekend and will enjoy life a bit
Love you all
Dave
____________________________________________________________
Be sure to hit the thumbs up. Building those indicators take a lot of time and likes are always rewarding for me :) (tips are accepted too)
- If you want to suggest some indicators that I can develop and share with the community, please use my personal TRELLO board
- I'm an officially approved PineEditor/LUA/MT4 approved mentor on codementor. You can request a coaching with me if you want and I'll teach you how to build kick-ass indicators and strategies
Jump on a 1 to 1 coaching with me
- You can also hire for a custom dev of your indicator/strategy/bot/chrome extension/python
BEST Ultimate Engulfing ScreenerHello traders
Continuing deeper and stronger with the screeners serie. I keep getting requests private messages and requests saying that screeners aren't possible with TradingView.
My answer is always... "Reallyyy ??" (I never find a better answer than that...)
I'll publish a few screeners just for everyone to understand what can be done with Pinescript. We don't have to wait for TradingView to allow screener based on custom indicator - we can build our own ^^
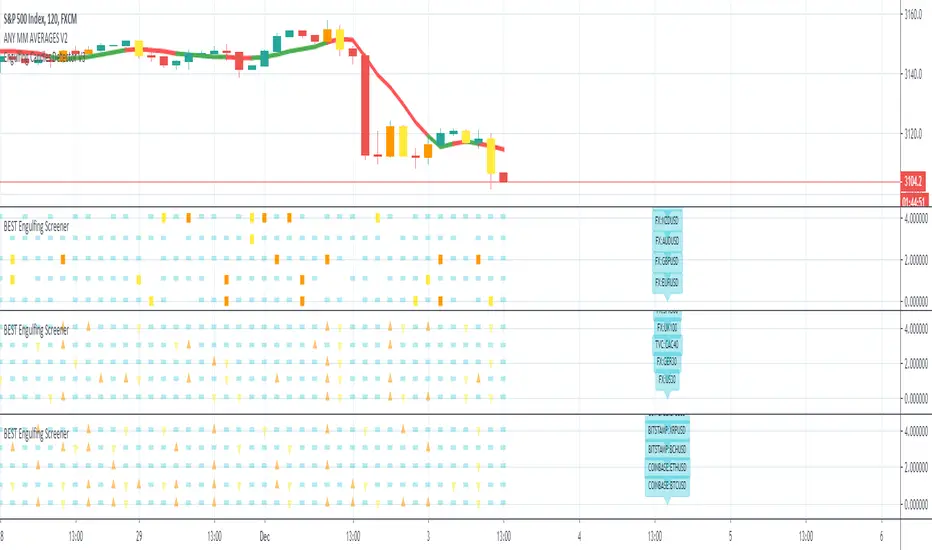
I - What is an engulfing pattern
Let's start with a screener to check for a very famous candlestick pattern called engulfing
Engulfing candles tend to signal a reversal of the current trend in the market. This specific pattern involves two candles with the latter candle ‘engulfing’ the entire body of the candle before it.
The engulfing candle can be bullish or bearish depending on where it forms in relation to the existing trend
Source and more info here
These engulfing candles indicate a strong shift in direction, and when combined with observation of the price-trending direction that precedes it, this shift creates the opportunity for a trading strategy.
II - How did I set the screener
I added an optional filter being Price vs SMA. The idea is to select only the engulfing whenever the price also breaks an SMA - this usually translates a stronger move - but could sometimes give the signal too late (#meh #trading #ain't #easy)
The visual signals are as follow:
- square: whenever the engine detects an engulfing and an SMA breakout
- triangle: the engine only detects an engulfing
- dash: none of the above
Then the colors are:
- orange when bullish
- yellow when bearish
- aqua/dash when none of the above
Cool Hacks
"But sir... what can we do with only 5 instruments for a screener?" I agree not much but...
even if I allow only 5 instruments per indicator - nothing prevents you from adding multiple times the same indicator and changing the selected instruments for each. I also show why the SPX500 gave a yellow triangle (bearish engulfing) and how to match it with the screener.
=> imgur.com
Wishing you all the BEST trading
Dave
Linear Regression Channel Screener [Daveatt]Hello traders
First and foremost, I want to extend a huge thank you to @LonesomeTheBlue for his exceptional Linear Regression Channel indicator that served as the foundation for this screener.
Original work can be found here:
Overview
This project demonstrates how to transform any open-source indicator into a powerful multi-asset screener.
The principles shown here can be applied to virtually any indicator you find interesting.
How to Transform an Indicator into a Screener
Step 1: Identify the Core Logic
First, identify the main calculations of the indicator.
In our case, it's the Linear Regression
Channel calculation:
get_channel(src, len) =>
mid = math.sum(src, len) / len
slope = ta.linreg(src, len, 0) - ta.linreg(src, len, 1)
intercept = mid - slope * math.floor(len / 2) + (1 - len % 2) / 2 * slope
endy = intercept + slope * (len - 1)
dev = 0.0
for x = 0 to len - 1 by 1
dev := dev + math.pow(src - (slope * (len - x) + intercept), 2)
dev
dev := math.sqrt(dev / len)
Step 2: Use request.security()
Pass the function to request.security() to analyze multiple assets:
= request.security(sym, timeframe.period, get_channel(src, len))
Step 3: Scale to Multiple Assets
PineScript allows up to 40 request.security() calls, letting you monitor up to 40 assets simultaneously.
Features of This Screener
The screener provides real-time trend detection for each monitored asset, giving you instant insights into market movements.
It displays each asset's position relative to its middle regression line, helping you understand price momentum.
The data is presented in a clean, organized table with color-coded trends for easy interpretation.
At its core, the screener performs trend detection based on regression slope calculations, clearly indicating whether an asset is in a bullish or bearish trend.
Each asset's price is tracked relative to its middle regression line, providing additional context about trend strength.
The color-coded visual feedback makes it easy to spot changes at a glance.
Built-in alerts notify you instantly when any asset experiences a trend change, ensuring you never miss important market moves.
Customization Tips
You can easily expand the screener by adding more symbols to the symbols array, adapting it to your watchlist.
The regression parameters can be adjusted to match your preferred trading timeframes and sensitivity.
The alert system is already configured to notify you of trend changes, but you can customize the alert messages and conditions to your needs.
Limitations
While powerful, the screener is bound by PineScript's limitation of 40 security calls, capping the maximum number of monitored assets.
Using AI to Help With Conversion
An interesting tip:
You can use AI tools to help convert single-asset indicators to screeners.
Simply provide the original code and ask for assistance in transforming it into a screener format. While the AI output might need some syntax adjustments, it can handle much of the heavy lifting in the conversion process.
Prompt (example) : " Please make a pinescript version 5 screener out of this indicator below or in attachment to scan 20 instruments "
I prefer Claude AI (Opus model) over ChatGPT for pinescript.
Conclusion
This screener transformation technique opens up endless possibilities for market analysis.
By following these steps, you can convert any indicator into a powerful multi-asset scanner, enhancing your trading toolkit significantly.
Remember: The power of a screener lies not just in monitoring multiple assets, but in applying consistent analysis across your entire watchlist in real-time.
Feel free to fork and modify this screener for your own needs.
Happy trading! 🚀📈
Daveatt

Custom Screener with Alerts V2 [QuantNomad]TradingView just recently announced the alert() function that allows you to create dynamic alerts from both strategies and studies.
So I decided to update custom screener I published before. It was based on alerts from orders in strategies, that was the only way to create dynamic alerts in PineScript at that point.
With the alert() function code become cleaner and more readable.
It works for up to 40 symbols at the same time.
You can create an alert from it easily by selecting screener name from the list and then selecting "Any alert() function call".
No additional configuration is required, message and alert on close I set up in the code.
I created as an example a screener that tracks both overbought (RSI > 70) and oversold stocks (RSI < 30).
To create your own screener you have to change only screenerFunc().
By design it should output 2 values:
cond - True/False Boolean variable. Should this instrument be displayed in the screener?
value - Additional numeric value you can display in your screener. I display RSI level for selected stocks for example.
Link to the old screener:
Disclaimer
Please remember that past performance may not be indicative of future results.
Due to various factors, including changing market conditions, the strategy may no longer perform as good as in historical backtesting.
This post and the script don’t provide any financial advice.
MA Dist% Screener [Pineify]MA Distance Screener: Multi-Asset Market Scanner for TradingView
Screen multiple symbols and multiple timeframes on TradingView with the MA Distance Screener. Compare asset prices to flexible moving average types. Visual table view, custom assets, timeframes, and MA types. Supercharge your TradingView screener, optimize your workflow, and catch opportunities across assets in real time.
Key Features
Screen up to 10 custom symbols simultaneously across four configurable timeframes.
Choose from multiple Moving Average types: EMA, SMA, WMA, HMA, RMA, VWMA for flexible market context.
Visualize real-time % distance between price and moving average per asset/timeframe in a clean, color-coded table.
Highly customizable: Set your own symbol list, timeframes, MA length and type.
Alerts for symbol/MA deviations—instantly see overbought/oversold status with intuitive background coloring.
Optimized for crypto, FX, and traditional assets – all asset types supported.
How It Works
The MA Distance Screener acts as a dynamic multi-symbol, multi-timeframe scanner. For each selected symbol and timeframe, it calculates the percentage distance between the latest close price and the selected type of moving average (EMA/SMA/etc.). This is achieved by making secure `request.security` calls per asset/timeframe combination, retrieving updated values for each matrix cell. The computed distance (%) is displayed in a color-coded table: a positive value signals price above the MA (potential trend strength), while negatives indicate price below the MA (potential weakness or retracement). Custom colors highlight extreme overbought/oversold readings for quick visual cues.
Trading Ideas and Insights
Quickly spot assets showing the largest deviation from their moving averages – ideal for mean reversion or trend-following entries.
Identify clusters of assets and timeframes lining up in overbought or oversold states; optimize entries with multi-timeframe confirmation.
Scan the market in one glance—reduce chart-hopping and never miss an opportunity when multiple assets align for signals.
The ability to scan distance-to-MA across assets and periods gives traders a statistical edge, surfacing hidden pivots, breakouts, and mean-reversion trades that single-chart analysis may miss.
How Multiple Indicators Work Together
At its core, this screener allows the trader to configure what gets scanned—pick your top 10 assets and favorite 4 timeframes. With each matrix cell, the selected MA (e.g., 14-period EMA) is recalculated, and the current price's distance (%) from that value is computed. By offering six distinct moving average algorithms (EMA, SMA, RMA, HMA, WMA, VWMA), traders can choose their preferred method, adapting the screener for trend, swing, or mean-reversion style. All values are visualized in a single table, creating a true "market dashboard" effect for real-time cross-asset assessment.
Unique Aspects
True cross-asset, cross-timeframe screening in a unified table—rare for Pine Script indicators.
Full flexibility—customizable list of assets, timeframes, and MA parameters to suit any market/trading plan.
Intuitive color-coding and table display eliminates guesswork, enabling “at-a-glance” screening and rapid decision-making.
Efficient, optimized Pine v6 codebase—minimal lag even with 40+ concurrent streams.
How to Use
Add the indicator to your TradingView chart (overlay: off, use a clean chart).
In the settings panel, enter up to 10 symbols (tickers) you want to screen—crypto, stocks, FX, or indices.
Set the 4 timeframes to scan (e.g., 1m, 5m, 15m, 1h), plus your preferred moving average length and type.
Review the results in the pop-up table, where each cell shows "% Distance" from MA for each symbol/timeframe.
Monitor table background/text color for overbought vs. oversold cues.
Customization
Symbol List: Track any asset by typing its TradingView ticker.
Timeframes: Full freedom to select 4 timeframes per scan, from 1min to monthly.
MA Config: Choose period length and MA algorithm (classic or exotic types).
Color Themes: Easily spot signals with dynamic color backgrounds and customizable thresholds.
Conclusion
The MA Distance Screener is a must-have tool for systematic traders, portfolio managers, and retail chartists seeking a true multi-asset edge. With real-time cross-checking against multiple moving averages and timeframes, it empowers faster, more confident decision-making, while reducing chart fatigue and missed setups.
Unlock new insights, catch broad and hidden opportunities, and optimize your market workflow—all in a single TradingView panel.

Ultimate Screener TemplateHello Traders
With the Ultimate Strategy Template , I shared a template to connect any indicator to this template and get backtesting results in less than a few minutes
Now sharing another template ... many traders ask me to develop for them a screener/scanner based on a custom indicator on TradingView.
The current TradingView screeners are great but don't allow for much customization; as we can only select pre-defined filters
I don't know when we'll be able to natively screen among hundreds of assets with a custom indicator... then.... I created this template for the time being.... which should
A whole new world
The Ultimate Screener Template screens over 38 securities.
What's very cool is that you'll only need to create 1 alert to scan over 38 securities: Explanation with this image here
I totally understand that not all TradingView accounts have a lot of alarms; with this template, you can multiply the number of custom alerts you're initially allowed to.
What if I need to set alerts on more than 38 securities?
Pretty straightforward... you can create alerts only if the indicator is added to your chart first.
So if you need let's say 100 securities, add this indicator 3 times on your chart (38*3 > 100) and then... edit the securities for your 3 indicators
How to update your Screener settings
Alert mode
As per Pinescript reference , this template allows setting the alert frequency
Possible values are:
- alert.freq_all (all function calls trigger the alert)
- alert.freq_once_per_bar (the first function call during the bar triggers the alert)
- alert.freq_once_per_bar_close (the function call triggers the alert only when it occurs during the last script iteration of the real-time bar when it closes).
All-time-high and All-time-low
This template shows how to capture ATH and ATL alerts across many securities
I used the functions from Quantnomad:
Whenever a new ATH or ATL is made, the screener will send a personalized alarm with a personalized text based on the security triggering this alarm
The code is pretty straightforward and shows you the part you'll need to update to transform your favorite custom indicator into a powerful screener.
If anything is unclear in the code, please leave a comment and I'll respond as soon as possible
All the best
Dave
Ultimate EMA ScreenerHello traders
Very busy preparing a few stuff for Black Friday but wanted to remind that I still know Pinescript and how to step up my game :)
My master @RicardoSantos once again showed me how to push the pinescript limits one step/dimension further. Kudo also to my client (Judy) for this amazing idea.
I inspired myself from his script () to display multiple assets in the same panel - without breaking the chart scaling.
In that case, I'm comparing 5 EMAs relatively to each other and display:
- a square if they're stacked properly
- a triangle if two of them are stacked properly
- a dash otherwise
For those interested, the conditions are in the f_securitys function.
I posted in the past a few screeners using labels but we're limited to 50 labels per script. There isn't such limitation when using the plotshape function - giving us more complete screeners. #uhuuuu
I'll post a few more examples this week with different trading strategies/combinations. The possibilities here are (close to) limitless.
I'm using the security built-in function to call external assets (here different forex pairs) and we're limited to 40 security calls per script.
But nothing preventing us from duplicating the same script a few times and calling different assets each time :) If you'd like to display 10 forex pairs, you only need to add that script on your chart twice and select 5 pairs for the first panel, 5 other pairs for the second panel.
You're welcome <3
All the BEST
Dave

Cleaner Screeners LibraryLibrary "cleanscreens"
Screener Panel.
This indicator displays a panel with a list of symbols and their indications.
It can be used as a screener for multiple timess and symbols
in any timeframe and with any indication in any combination.
#### Features
Multiple timeframes
Multiple symbols
Multiple indications per group
Vertical or horizontal layouts
Acceepts External Inputs
Customizable colors with 170 presets included (dark and light)
Customizable icons
Customizable text size and font
Customizable cell size width and height
Customizable frame width and border width
Customizable position
Customizable strong and weak values
Accepts any indicator as input
Only 4 functions to call, easy to use
#### Usage
Initialize the panel with _paneel = cleanscreens.init()
Add groupd with _screener = cleanscreens.Screener(_paneel, "Group Name")
Add indicators to screeener groups with cleanscreens.Indicator(_screener, "Indicator Name", _source)
Update the panel with cleanscreens.display(_paneel)
Thanks @ PineCoders , and the Group members for setting the bar high.
# local setup for methods on our script
import kaigouthro/cleanscreen/1
method Screener ( panel p, string _name) => cleanscreens.Screener ( p, _name)
method Indicator ( screener s , string _tf, string name, float val) => cleanscreens.Indicator ( s , _tf, name, val)
method display ( panel p ) => cleanscreens.display ( p )
init(_themein, loc)
# Panel init
> init a panel for all the screens
Parameters:
_themein (string) : string: Theme Preset Name
loc (int) : int :
1 = left top,
2 = middle top,
3 = right top,
4 = left middle,
5 = middle middle,
6 = right middle,
7 = left bottom,
8 = middle bottom,
9 = right bottom
Returns: panel
method Screener(p, _name)
# Screener - Create a new screener
### Example:
cleanscreens.new(panel, 'Crpyto Screeners')
Namespace types: panel
Parameters:
p (panel)
_name (string)
method Indicator(s, _tf, name, val)
# Indicator - Create a new Indicator
### Example:
cleanscreens.Inidcator('1h', 'RSI', ta.rsi(close, 14))
Namespace types: screener
Parameters:
s (screener)
_tf (string)
name (string)
val (float)
method display(p)
# Display - Display the Panel
### Example:
cleanscreens.display(panel)
Namespace types: panel
Parameters:
p (panel)
indication
single indication for a symbol screener
Fields:
name (series string)
icon (series string)
rating (series string)
value (series float)
col (series color)
tf (series string)
tooltip (series string)
normalized (series float)
init (series bool)
screener
single symbol screener
Fields:
ticker (series string)
icon (series string)
rating (series string)
value (series float)
bg (series color)
fg (series color)
items (indication )
init (series bool)
config
screener configuration
Fields:
strong (series float)
weak (series float)
theme (series string)
vert (series bool)
cellwidth (series float)
cellheight (series float)
textsize (series string)
font (series int)
framewidth (series int)
borders (series int)
position (series string)
icons
screener Icons
Fields:
buy (series string)
sell (series string)
strong (series string)
panel
screener panel object
Fields:
items (screener )
table (series table)
config (config)
theme (theme type from kaigouthro/theme_engine/1)
icons (icons)

Any Screener (Multiple)I suppose it's time to publish something relatively useful :). Here's the first try, Any Screener.
This script is an advanced version of the Alphatrend - Screener that I've coded as a humble "thank you" to Kıvanç Özbilgiç (KivancOzbilgic), who always inspired me.
INTRODUCTION
I developed this version with a unique method because I couldn't find an example with the following features:
It presents the valid signal status of multiple indicators for 15 different symbols in the form of a report.
It indicates how many bars have passed after the signal has occurred.
It indicates the signal direction with dynamic colors and chars.
It can also be used for data (just indicator value) that is only intended to be displayed as text. (Default color is grey).
Long and short signals can optionally be ploted on the chart.
It includes advanced configuration settings.
USAGE OF PANEL
The screener panel is simple to use. On the far left, assets are listed. The names of the indicators appear at the top. In the column with the name of each indicator, the signals of that indicator appear as green or red. The green ones represent the long signals (uptrend) and the red ones represent the short signals (down trend). The numbers in square brackets indicate how many bars have passed after the last signal has occurred. (For example: According to the indicator at the top, when the green bullish triangle and 21 appeared on allign of BTCUSDT, Bitcoin switched to buy signal 21 bars ago. A tip : If the signal distance is 0, the signal occurred at the current bar. It is recommended to wait for the bar to close before entering the trade). Signal distance is an essential output for both manual and algorithmic trading. Users often require mentioned data the most during real time trading.
THE SCRIPT
There are two sections in the script; indicators and screener.
SECTION 1 : "INDICATORS"
In the indicator section, you'll find efficient details about switch methods, normalization, avoid pyramyding (in momentum oscillators) etc. On the other hand, I intended to present a "how to example" of a multiple screener, so it has to include more than one indicator.
OTT : Optimized Trend Tracker is developed by dear Anıl Özekşi, known as the "Old Fisherman" :). In my opinion, it is a pretty cool trend-following indicator that offers a mathematical elegance. This indicator aim to detect the current market trend direction, the indicator detect an up-trending market when the support line is superior to the OTT, and a down trending market when the support line is inferior to the OTT. It has three parameters; moving average type, length and percentage. In this version when the percentage parameter is set to 0.0, OTT turns into the selected moving average. And the signals are generated by the crossing of the closing price. It means, this screener is able to compile and present status of moving averages as well. Also VAR (VIDYA) and EVWMA has been re-designed, both moving averages no longer start at zero at the beginning of the chart (That was a big problem for backtests).
PSAR : J. Welles Wilder's Parabolic Stop And Reversal is an important trend following indicator. PSAR detects an up-trending market when below the market price and a down-trend when above. It can work in harmony with OTT according to the parameter combinations.
OSCILLATORS : Also optional three momentum oscillators have been added. MFI (Money Flow Index), RSI (Relative Strength Index) and STOCH (Stochastic %k). All three oscillators are widely used in markets and quite successful in explaining price movements by using different sources. Oscillators generate long and short signals based on oversold and overbought parameters.
VOLATILITY & TREND : There are three optional indicators. ADX (Average Directional Index), BBW-N (Normalized Bollinger Bandwidth) and REG-N (Normalized value of standard error of linear regression). These three indicators don't generate any long or short signals. Instead, they are used to measure the strength of trends and volatility. Therefore, only the numerical results (0-100) are displayed in screener panel and it is grey. (Note : The second length parameter of ADX has the same value with the first one. Bollinger Bandwith's multiplier is 2.0. REG-N is a variable that developed by Paul Kirshenbaum for Kirshenbaum Bands.)
SECTION 2 : "SCREENER"
The second section processes the main idea. This Screener model is based on generating an integer direction variable from boolean signals. The direction value serves multiple purposes: calculating the distance of signal, determining the color based on the direction, and creating "clean" data for the security function. The final step is to present the obtained data as text to the user.
HOW CAN I "SCREEN" MY CONDITIONS?
That's piece a cake, delete the Section 1 in the script :). If you change totally 11 variables according to your own strategy, you can create your new screener! The method is explained at lines 169-171.
SINCERELY THANKS
To allanster for patiently answering my primitive questions,
And to KivancOzbilgic for mind blowing suggestions (especially while we're drinking Raki) :)...
DISCLEIMER
This is just an indicator, nothing more. The script is for informational and educational purposes only. The use of the script does not constitute professional and/or financial advice. The responsibility for risks associated with the use of the script is solely owned by the user. Do not forget to manage your risk. And trade as safely as possible. Good luck!
Linear Regression & RSI Multi-Function Screener with Table-LabelHi fellow traders..
Happy to share a Linear Regression & RSI Multi-Function Custom Screener with Table-Labels...
The Screener scans for Linear Regression 2-SD Breakouts and RSI OB/OS levels for the coded tickers and gives Summary alerts
Uses Tables (dynamica resizing) for the scanner output instead of standard labels!
This Screener cum indicator collection has two distinct objectives..
1. Attempt re-entry into trending trades.
2. Attempt Counter trend trades using linear regression , RSI and Zigzag.
Briefly about the Screener functions..
a. It uses TABLES as Labels a FIRST for any Screener on TV.
b. Tables dynamically resize based on criteria..
c. Alerts for breakouts of the UPPER and the LOWER regression channels.(2 SD)
d. In addition to LinReg it also Screens RSI for OB/OS levels so a multifunction Screener.
e. Of course has the standard summary Alerts and programmable format for Custom functions.
f. Uses only the inbuilt Auto Fib and Lin Reg code for the screener.(No proprietary stuff)
g. The auto Zigzag code is derived(Auto fib).
Question what are all these doing in a single screener ??
ZigZag is very useful in determining Trend Up or Down from one Pivot to another.
So Once you have a firm view of the Current Trend for your chosen timeframe and ticker…
We can consider few possible trading scenarios..
a. Re-entry in an Up Trend - Combination of OS Rsi And a Lower Channel breach followed by a re-entry back into the regression channel CAN be used as an effective re-entry.
b. Similarily one can join a Down Trend on OB Rsi and Upper Channel line breach followed by re-entry into the regression channel.
If ZigZag signals a range-bound market, bound within channel lines then the Upper breakout can be used to Sell and vice-versa!
In short many possibilities for using these functions together with Scanner and Alerts.
This facilitates timely PROFITABLE Trending and Counter trend opportunities across multiple tickers.
You must give a thorough READ to the various available tutorials on ZigZag / Regression and Fib retracements before attempting counter trend trades using these tools!!
A small TIP – Markets are sideways or consolidating 70% of the time!!
Acknowledgements: - Thanks a lot DGTRD for the Auto ZigZag code and also for the eagerness to help wherever possible..Respect!!
Disclaimer: The Alerts and Screener are just few tools among many and not any kind of Buy/Sell recommendations. Unless you have sufficient trading experience please consult a Financial advisor before investing real money.
*The alerts are set for crossovers however for viewing tickers trading above or below the channel use code in line 343 and 344 after setting up the Alerts!
** RSI alerts are disabled by default to avoid clutter, but if needed one can activate code lines 441,442,444 and 445
Wish you all, Happy Profitable Trading!

Multi timeframes RSI Screener & indicator by noop42Since my previous x4 multi timeframes Stochastic RSI script seems to have been appreciated, I decided to make a 2nd version of this tool which focuses on the RSI indicator only.
Default parameters
RSI length : 14
Timeframes: 5, 15, 60, 240
OB/OS zones : 70 & 30
Repaint mode: enabled
Display lines: enabled
Display screener: enabled
Convergence warnings: timeframes 1, 2 & 3
Details
Repaint mode : Disabling it makes the indicator wait for the current candle to close before to change its value
Display lines: Allows you to disable RSI lines drawings, in order to move the screener on your main chart for example.
Display screener: Allows you to disable the screener, in order to use RSI lines only
OB/OS convergences warnings : Allows you to select which timeframe(s) must be taken into consideration for convergence signals (Selected timeframes can be distinguished in the screener, followed by a * char in the timeframes column)
Note The Stochastic RSI version of this tool is available here

QuantNomad - Simple Custom Screener in PineScriptQuite often I need to run screeners with the custom condition, but unfortunately, in TradingView it's impossible.
I created an example script to show how you can create a simple custom screener in Pine Script on your own.
It's not very good, it requires some manual adjustments, it can be improved in some ways, but I think it might work for some tasks.
What do you think? Do you have a better way to implement custom screeners in TradingView?
To run your own conditions you need to implement them in:
customFunc() function and for every ticker you want to include in your search add 2 lines like these with newly defined variable:
s1 = security('BTCUSD', '1', customFunc())
and
scr_label := s1 ? scr_label + 'BTCUSD\n' : scr_label
I'm not sure that it will work well for more than a few dozen tickers.
But I hope it will be helpful for you.
And remember:
Past performance does not guarantee future results.
RSI Divergence Screener [Pineify]RSI Divergence Screener
Key Features
Multi-symbol and multi-timeframe support for advanced market screening.
Real-time detection and visualization of bullish and bearish RSI divergences.
Seamless integration with core technical indicators and custom divergences.
Highly customizable parameters for precise adaptation to personal trading strategies.
Comprehensive screener table for swift asset comparison and analysis.
How It Works
The RSI Divergence Screener leverages the power of Relative Strength Index (RSI) to systematically track momentum shifts across cryptocurrencies and their respective timeframes. By monitoring both fast and slow RSI calculations, the screener isolates divergence signals—key reversal points that often precede major price moves.
The indicator calculates two RSI values for each selected asset: one with a short lookback (Fast RSI) and another with a longer period (Slow RSI).
It runs a comparative algorithm to find divergences—whenever Fast RSI deviates significantly from Slow RSI, it flags the signal as bullish or bearish.
All detected divergences are dynamically presented in a table view, allowing traders to scan symbols and timeframes for optimal trading setups.
Trading Ideas and Insights
Spot early momentum reversals and preempt major price swings via divergence signals.
Combine multiple symbols and timeframes for cross-market trending opportunities.
Identify high-probability scalping and swing trading setups informed by RSI divergence logic.
Quickly compare crypto asset strength and trend exhaustion across short and long-term horizons.
How Multiple Indicators Work Together
This screener’s edge lies in its synergistic use of multi-setting RSI calculations and customizable input groups.
The dual-RSI approach (Fast vs. Slow) isolates subtle trend shifts missed by traditional single-period RSI.
Safe and reliable divergences arise only when the mathematical difference between Fast RSI and Slow RSI meets predefined thresholds, minimizing false positives.
Divergences are contextualized using tailored color codes and backgrounds, rendering insights immediately actionable.
You can expand analysis with additional moving average filters or overlays for further confirmation.
Unique Aspects
First-of-its-kind screener dedicated solely to RSI divergence, designed especially for crypto volatility.
Efficient screening of up to eight assets and multiple timeframes in one compact dashboard.
Intuitive iconography, color logic, and table layouts optimized for rapid decision-making.
Advanced input group design for fine-tuning indicator settings per symbol, timeframe, and source.
How to Use
Select up to eight cryptocurrency symbols to screen for divergence signals.
Assign individual timeframes and source prices for each asset to customize analysis.
Set Fast RSI and Slow RSI lengths according to your preferred strategy (e.g., scalping, swing, or trend following).
Review the screener table: colored cells highlight actionable bullish (green) and bearish (red) divergences.
Confirm trade setups with additional indicators or price action for robust risk management.
Customization
Symbols: Choose any crypto pair or ticker for dynamic divergence tracking.
Timeframes: Scan across 1m, 5m, 10m, 30m, and more for full market coverage.
RSI lengths: Configure Fast and Slow RSI periods based on volatility and trading style.
Visuals: Tailor table colors, fonts, and alert backgrounds per your preference.
Conclusion
The RSI Divergence Screener is a versatile, original TradingView indicator that empowers traders to scan, compare, and act on divergence signals with speed and precision. Its multi-symbol design, robust logic, and extensive customization options set a new standard for market screening tools. Integrate it into your crypto trading process to capture actionable opportunities ahead of the crowd and optimize your technical analysis workflow.

Multiple Symbol Trend Screener [Pineify]Multiple Symbol Trend Screener Pineify – Ultimate Multi-Indicator Scanner for TradingView
Empower your trading with deep market insights across multiple symbols using this feature-rich Pine Script screener. The Multiple Symbol Trend Screener Pineify enables traders to monitor and compare trends, reversals, and consolidations in real-time across the biggest equity symbols on TradingView, through a synergistic blend of popular technical indicators.
Key Features
Monitor up to 15 symbols and their trends simultaneously
Integrates 7 professional-grade indicators: MA Distance, Aroon, Parabolic SAR (PSAR), ADX, Supertrend, Keltner Channel, and BBTrend
Color-coded table display for instant visual assessment
Customizable lookback periods, indicator types, and calculation methods
SEO optimized for multi-symbol trend detection, screener, and advanced TradingView indicator
How It Works
This indicator leverages TradingView’s Pine Script v6 and request.security() to process multiple symbols across selected timeframes. Data populates a dynamic table, updating each cell based on the calculated value of every underlying indicator. MA Distance highlights deviation from moving averages; Aroon flags emerging trend strength; PSAR marks potential trend reversals; ADX assesses trend momentum; Supertrend detects bullish/bearish phases; Keltner Channel and BBTrend offer volatility and power insights.
Set up your preferred symbols and timeframes
Each indicator runs its calculation per symbol using its parameter group
All results are displayed in a table for a comprehensive dashboard view
Trading Ideas and Insights
Traders can use this screener for cross-market comparison, directional bias, entry/exit filtering, and comprehensive trend evaluation. The screener is excellent for swing trading, day trading, and portfolio tracking. It enables confirmation across multiple frameworks — for example, spotting momentum with ADX before confirming direction with Supertrend and PSAR.
Identify correlated movements or divergences across selected assets
Spot synchronized trend changes for basket trading ideas
Filter symbols by volatility, strength, or trend status for precise trade selection
How Multiple Indicators Work Together
The screener’s edge lies in its intelligent correlation of popular indicators. MA Distance measures the proximity to chosen moving averages, ideal for spotting overbought/oversold conditions. Aroon reveals the strength of new price trends, PSAR indicates reversal signals, and ADX quantifies the momentum of these trends. Supertrend provides a directional phase, while Keltner Channel & BBTrend analyze volatility shifts and band compressions. This amalgamation allows for a robust, multi-dimensional market snapshot, capturing details missed by single-indicator tools.
By displaying all key metrics side-by-side, the screener enables holistic decision-making, revealing confluence zones and contradiction areas across multiple tickers and timeframes.
Unique Aspects
Original implementation combining seven independent trend and momentum indicators for each symbol
Rich customization for symbols, timeframes, and all indicator parameters
Intuitive color-coding for quick reading of bullish/bearish/neutral signals
Comprehensive dashboard for instant actionable insights
How to Use
Load the indicator onto your TradingView chart
Go to the script’s settings and input your preferred symbols and relevant timeframes
Set your desired parameters for each indicator group: Moving Average type, Aroon length, PSAR values, ADX smoothing, etc.
Observe the results in the top-right table, then use it to filter candidates and validate trade setups
The screener is suitable for all timeframes and asset classes available on TradingView. Make sure your chart’s timeframe matches the one used in the scanner for optimal accuracy.
Customization
Choose up to 15 symbols to monitor in a single dashboard
Customize lookback periods, indicator types, colors, and display settings
Configure alerting options and thresholds for advanced trade automation
Conclusion
The Multiple Symbol Trend Screener Pineify sets a new standard for multi-asset screening on TradingView. By elegantly merging seven proven technical indicators, the screener delivers powerful trend detection, reversal analysis, and volatility monitoring — all in one dashboard. Take your trading to new heights with in-depth, customizable market surveillance.

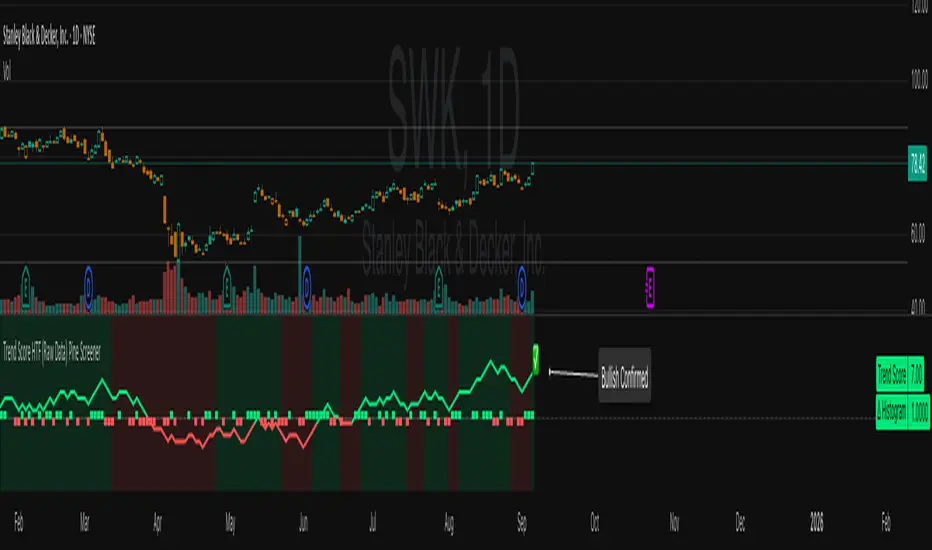
Trend Score HTF (Raw Data) Pine Screener📘 Trend Score HTF (Raw Data) Pine Screener — Indicator Guide
This indicator tracks price action using a custom cumulative Trend Score (TS) system. It helps you visualize trend momentum, detect early reversals, confirm direction changes, and screen for entries across large watchlists like SPX500 using TradingView’s Pine Script Screener (beta).
⸻
🔧 What This Indicator Does
• Assigns a +1 or -1 score when price breaks the previous high or low
• Accumulates these scores into a real-time tsScore
• Detects early warnings (primed flips) and trend changes (confirmed flips)
• Supports alerts and labels for visual and automated trading
• Designed to work inside the Pine Screener so you can filter hundreds of tickers live
⸻
⚙️ Recommended Settings (for Beginners)
When adding the indicator to your chart:
Go to the “Inputs” tab at the top of the settings panel.
Then:
• Uncheck “Confirm flips on bar close”
• Check “Accumulate TS Across Flips? (ON = non-reset, OFF = reset)”
This setup allows you to see trend changes immediately without waiting for bar closes and lets the trend score build continuously over time, making it easier to follow long trends.
⸻
🧠 Core Logic
Start Date
Select a meaningful historical start date — for example: 2020-01-01. This provides long-term context for trend score calculation.
Per-Bar Delta (Δ) Calculation
The indicator scores each bar based on breakout behavior:
If the bar breaks only the previous high, Δ = +1
If it breaks only the previous low, Δ = -1
If it breaks both the high and low, Δ = 0
If it breaks neither, Δ = 0
This filters out wide-range or indecisive candles during volatility.
Cumulative Trend Score
Each bar’s delta is added to the running tsScore.
When it rises, bullish pressure is building.
When it falls, bearish pressure is increasing.
Trend Flip Logic
A bullish flip happens when tsScore rises by +3 from the lowest recent point.
A bearish flip happens when tsScore falls by -3 from the highest recent point.
These flips update the active trend direction between bullish and bearish.
⸻
⚠️ What Is a “Primed” Flip?
A primed flip is a signal that the current trend is about to flip — just one point away.
A primed bullish flip means the trend is currently bearish, but the tsScore only needs +1 more to flip. If the next bar breaks the previous high (without breaking the low), it will trigger a bullish flip.
A primed bearish flip means the trend is currently bullish, but the tsScore only needs -1 more to flip. If the next bar breaks the previous low (without breaking the high), it will trigger a bearish flip.
Primed flips are plotted one bar ahead of the current bar. They act like forecasts and give you a head start.
⸻
✅ What Is a “Confirmed” Flip?
A confirmed flip is the first bar of a new trend direction.
A confirmed bullish flip appears when a bearish trend officially flips into a new bullish trend.
A confirmed bearish flip appears when a bullish trend officially flips into a new bearish trend.
These signals are reliable and great for entries, trend filters, or reversals.
⸻
🖼 Visual Cues
The trend score (tsScore) line shows the accumulated trend strength.
A Δ histogram shows the daily price contribution: +1 for breaking highs, -1 for breaking lows, 0 otherwise.
A green background means the chart is in a bullish trend.
A red background means the chart is in a bearish trend.
A ⬆ label signals a primed bullish flip is possible on the next bar.
A ⬇ label signals a primed bearish flip is possible on the next bar.
A ✅ means a bullish flip just confirmed.
A ❌ means a bearish flip just confirmed.
⸻
🔔 Alerts You Can Use
The indicator includes these built-in alerts:
• Primed Bullish Flip — watch for possible bullish reversal tomorrow
• Primed Bearish Flip — watch for possible bearish reversal tomorrow
• Bullish Confirmed — official entry into new uptrend
• Bearish Confirmed — official entry into new downtrend
You can set these alerts in TradingView to monitor across your chart or watchlist.
⸻
📈 How to Use in TradingView Pine Screener
Step 1: Create your own watchlist — for example, SPX500
Step 2: Favorite this indicator so it shows up in the screener
Step 3: Go to TradingView → Products → Screeners → Pine (Beta)
Step 4: Select this indicator and choose a condition, like “Bullish Confirmed”
Step 5: Click Scan
You’ll instantly see stocks that just flipped trends or are close to doing so.
⸻
⏰ When to Use the Screener
Use this screener after market close or before the next open to avoid intraday noise.
During the day, if a candle breaks both the high and low, the delta becomes 0, which may cancel a flip or primed signal.
Results during regular trading hours can change frequently. For best results, scan during stable periods like pre-market or after-hours.
⸻
🧪 Real-World Examples
SWK
NVR
WMT
UNH
Each of these examples shows clean, structured trend transitions detected in advance or confirmed with precision.
PLTR: complicated case primed for bullish (but we don't when it will flip)
⚠️ Risk Disclaimer & Trend Context
A confirmed bullish signal does not guarantee an immediate price increase. Price may continue to consolidate or even pull back after a bullish flip.
Likewise, a primed bullish signal does not always lead to confirmation. It simply means the conditions are close — but if the next bar breaks both the high and low, or breaks only the low, the flip will be canceled.
On the other side, a confirmed bearish signal does not mean the market will crash. If the overall trend is bullish (for example, tsScore has been rising for weeks), then a bearish flip may just represent a short-term pullback — not a trend reversal.
You always need to consider the overall market structure. If the long-term trend is bullish, it’s usually smarter to wait for bullish confirmation signals. Bearish flips in that context are often just dips — not opportunities to short.
This indicator gives you context, not predictions. It’s a tool for alignment — not absolute outcomes. Use it to follow structure, not fight it.