Implied and Historical VolatilityAbstract
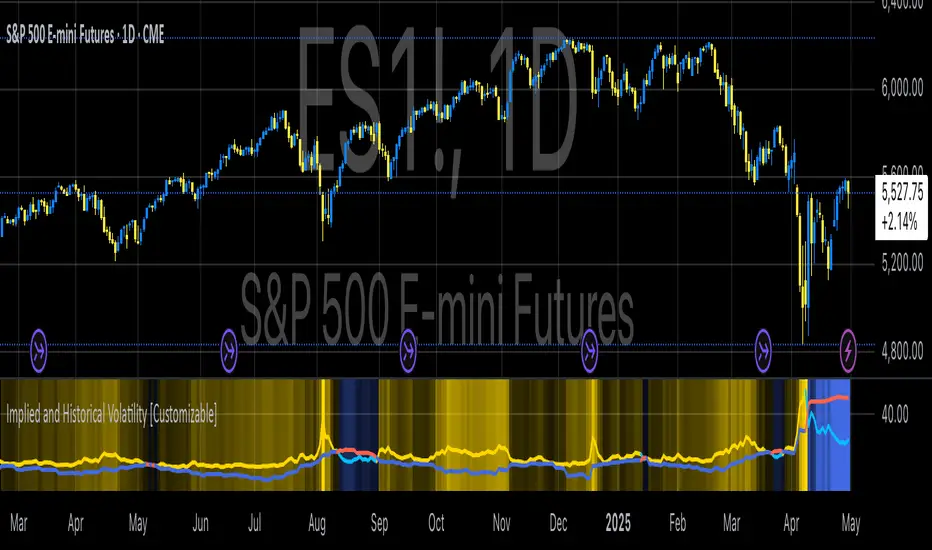
This TradingView indicator visualizes implied volatility (IV) derived from the VIX index and historical volatility (HV) computed from past price data of the S&P 500 (or any selected asset). It enables users to compare market participants' forward-looking volatility expectations (via VIX) with realized past volatility (via historical returns). Such comparisons are pivotal in identifying risk sentiment, volatility regimes, and potential mispricing in derivatives.
Functionality
Implied Volatility (IV):
The implied volatility is extracted from the VIX index, often referred to as the "fear gauge." The VIX represents the market's expectation of 30-day forward volatility, derived from options pricing on the S&P 500. Higher values of VIX indicate increased uncertainty and risk aversion (Whaley, 2000).
Historical Volatility (HV):
The historical volatility is calculated using the standard deviation of logarithmic returns over a user-defined period (default: 20 trading days). The result is annualized using a scaling factor (default: 252 trading days). Historical volatility represents the asset's past price fluctuation intensity, often used as a benchmark for realized risk (Hull, 2018).
Dynamic Background Visualization:
A dynamic background is used to highlight the relationship between IV and HV:
Yellow background: Implied volatility exceeds historical volatility, signaling elevated market expectations relative to past realized risk.
Blue background: Historical volatility exceeds implied volatility, suggesting the market might be underestimating future uncertainty.
Use Cases
Options Pricing and Trading:
The disparity between IV and HV provides insights into whether options are over- or underpriced. For example, when IV is significantly higher than HV, options traders might consider selling volatility-based derivatives to capitalize on elevated premiums (Natenberg, 1994).
Market Sentiment Analysis:
Implied volatility is often used as a proxy for market sentiment. Comparing IV to HV can help identify whether the market is overly optimistic or pessimistic about future risks.
Risk Management:
Institutional and retail investors alike use volatility measures to adjust portfolio risk exposure. Periods of high implied or historical volatility might necessitate rebalancing strategies to mitigate potential drawdowns (Campbell et al., 2001).
Volatility Trading Strategies:
Traders employing volatility arbitrage can benefit from understanding the IV/HV relationship. Strategies such as "long gamma" positions (buying options when IV < HV) or "short gamma" (selling options when IV > HV) are directly informed by these metrics.
Scientific Basis
The indicator leverages established financial principles:
Implied Volatility: Derived from the Black-Scholes-Merton model, implied volatility reflects the market's aggregate expectation of future price fluctuations (Black & Scholes, 1973).
Historical Volatility: Computed as the realized standard deviation of asset returns, historical volatility measures the intensity of past price movements, forming the basis for risk quantification (Jorion, 2007).
Behavioral Implications: IV often deviates from HV due to behavioral biases such as risk aversion and herding, creating opportunities for arbitrage (Baker & Wurgler, 2007).
Practical Considerations
Input Flexibility: Users can modify the length of the HV calculation and the annualization factor to suit specific markets or instruments.
Market Selection: The default ticker for implied volatility is the VIX (CBOE:VIX), but other volatility indices can be substituted for assets outside the S&P 500.
Data Frequency: This indicator is most effective on daily charts, as VIX data typically updates at a daily frequency.
Limitations
Implied volatility reflects the market's consensus but does not guarantee future accuracy, as it is subject to rapid adjustments based on news or events.
Historical volatility assumes a stationary distribution of returns, which might not hold during structural breaks or crises (Engle, 1982).
References
Black, F., & Scholes, M. (1973). "The Pricing of Options and Corporate Liabilities." Journal of Political Economy, 81(3), 637-654.
Whaley, R. E. (2000). "The Investor Fear Gauge." The Journal of Portfolio Management, 26(3), 12-17.
Hull, J. C. (2018). Options, Futures, and Other Derivatives. Pearson Education.
Natenberg, S. (1994). Option Volatility and Pricing: Advanced Trading Strategies and Techniques. McGraw-Hill.
Campbell, J. Y., Lo, A. W., & MacKinlay, A. C. (2001). The Econometrics of Financial Markets. Princeton University Press.
Jorion, P. (2007). Value at Risk: The New Benchmark for Managing Financial Risk. McGraw-Hill.
Baker, M., & Wurgler, J. (2007). "Investor Sentiment in the Stock Market." Journal of Economic Perspectives, 21(2), 129-151.
Cerca negli script per "sentiment"
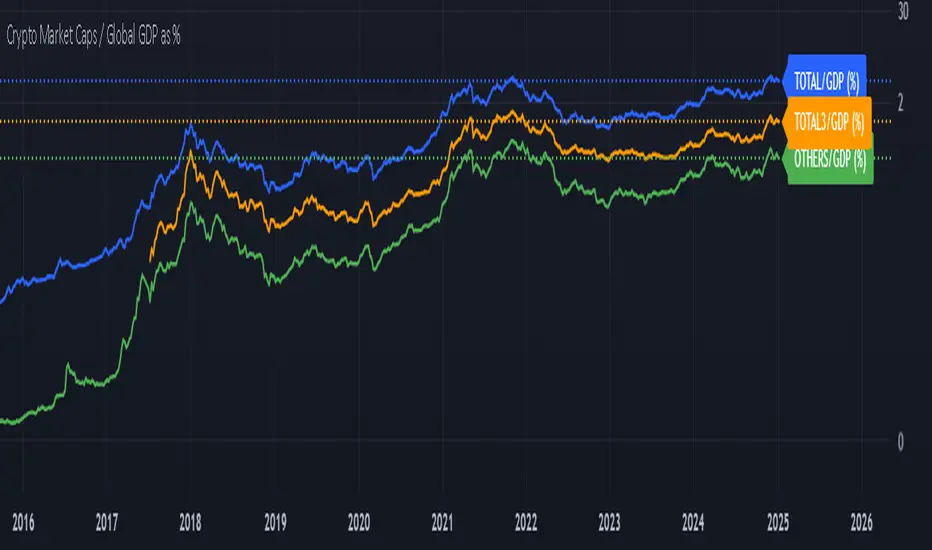
Crypto Market Caps / Global GDP %This indicator compares the total market capitalization of various crypto sectors to the global Gross Domestic Product (GDP), expressed as a percentage. The purpose of this indicator is to provide a visual representation of the relative size of the crypto market compared to the global economy, allowing traders and analysts to understand how the market is growing in relation to the overall economy.
Key Features
Crypto Market Caps -
TOTAL: Represents the total market capitalization of all cryptocurrencies.
TOTAL3: Represents the market capitalization of all cryptocurrencies, excluding Bitcoin and Ethereum.
OTHERS: Represents the market capitalization of all cryptocurrencies excluding the top 10.
Global GDP -
The indicator uses a combination of GDP data from multiple regions across the world, including:
GDP from the EU, North America (NA), and other regions.
GDP data from Asia, Latin America (LATAM), and the Middle East & North Africa (MENA).
Percentage Representation -
The market caps (TOTAL, TOTAL3, OTHERS) are compared to the global GDP, and the result is expressed as a percentage. This allows you to easily see how the size of the cryptocurrency market compares to the entire global economy at any given time.
Plotting and Visualization
The indicator plots the market cap to global GDP ratio for each category (TOTAL, TOTAL3, OTHERS) on the chart.
You can choose which plots to display through user inputs.
The percentage scale makes it easy to compare how much of the global GDP is represented by different parts of the crypto market.
Labels can be added for additional clarity, showing the exact percentage value on the chart.
How to Use
The indicator provides a clear view of the cryptocurrency market's relative size compared to the global economy.
Higher values indicate that the crypto market (or a segment of it) is becoming a larger portion of the global economy.
Lower values suggest the crypto market is still a smaller segment of the global economic activity.
User Inputs
TOTAL/GlobalGDP: Toggle visibility for the total market capitalization of all cryptocurrencies.
TOTAL3/GlobalGDP: Toggle visibility for the market cap of cryptocurrencies excluding Bitcoin and Ethereum.
OTHERS/GlobalGDP: Toggle visibility for the market cap of cryptocurrencies excluding the top 10.
Labels: Enable or disable the display of labels showing the exact percentage values.
Practical Use Cases
Market Sentiment: Gauge the overall market sentiment and potential growth relative to global economic conditions.
Investment Decisions: Help identify when the crypto market is becoming more or less significant in the context of the global economy.
Macro Analysis: Combine this indicator with other macroeconomic indicators to gain deeper insights into the broader economic landscape.
By providing an easy-to-understand percentage representation, this indicator offers valuable insights for anyone interested in tracking the relationship between cryptocurrency market cap and global economic activity.
WD Gann: Close Price X Bars Ago with Line or Candle PlotThis indicator is inspired by the principles of WD Gann, a legendary trader known for his groundbreaking methods in time and price analysis. It helps traders track the close price of a security from X bars ago, a technique that is often used to identify key price levels in relation to past price movements. This concept is essential for Gann’s market theories, which emphasize the relationship between time and price.
WD Gann’s analysis often revolved around specific numbers that he considered significant, many of which correspond to squared numbers (e.g., 1, 4, 9, 16, 25, 36, 49, 64, 81, 100, 121, 144, 169, 196, 225, 256, 289, 324, 361, 400, 441, 484, 529, 576, 625, 676, 729, 784, 841, 900, 961, 1024, 1089, 1156, 1225, 1296, 1369, 1444, 1521, 1600, 1681, 1764, 1849, 1936). These numbers are believed to represent natural rhythms and cycles in the market. This indicator can help you explore how past price levels align with these significant numbers, potentially revealing key price zones that could act as support, resistance, or reversal points.
Key Features:
- Historical Close Price Calculation: The indicator calculates and displays the close price of a security from X bars ago (where X is customizable). This method aligns with Gann's focus on price relationships over specific time intervals, providing traders with valuable reference points to assess market conditions.
- Customizable Plot Type: You can choose between two plot types for visualizing the historical close price:
- Line Plot: A simple line that represents the close price from X bars ago, ideal for those who prefer a clean and continuous representation.
- Candle Plot: Displays the close price as a candlestick chart, providing a more detailed view with open, high, low, and close prices from X bars ago.
- Candle Color Coding: For the candle plot type, the script color-codes the candles. Green candles appear when the close price from X bars ago is higher than the open price, indicating bullish sentiment; red candles appear when the close is lower, indicating bearish sentiment. This color coding gives a quick visual cue to market sentiment.
- Customizable Number of Bars: You can adjust the number of bars (X) to look back, providing flexibility for analyzing different timeframes. Whether you're conducting short-term or long-term analysis, this input can be fine-tuned to suit your trading strategy.
- Gann Method Application: WD Gann's methods involved analyzing price action over specific time periods to predict future movements. This indicator offers traders a way to assess how the price of a security has behaved in the past in relation to a chosen time interval, a critical concept in Gann's theories.
How to Use:
1. Input Settings:
- Number of Bars (X): Choose the number of bars to look back (e.g., 100, 200, or any custom period).
- Plot Type: Select whether to display the data as a Line or Candles.
2. Interpretation:
- Using the Line plot, observe how the close price from X bars ago compares to the current market price.
- Using the Candles plot, analyze the full price action of the chosen bar from X bars ago, noting how the close price relates to the open, high, and low of that bar.
3. Gann Analysis: Integrate this indicator into your broader Gann-based analysis. By looking at past price levels and their relationship to significant squared numbers, traders can uncover potential key levels of support and resistance or even potential reversal points. The historical close price can act as a benchmark for predicting future market movements.
Suggestions on WD Gann's Emphasis in Trading:
WD Gann’s trading methods were rooted in several key principles that emphasized the relationship between time and price. These principles are vital to understanding how the "Close Price X Bars Ago" indicator fits into his overall analysis:
1. Time Cycles: Gann believed that markets move in cyclical patterns. By studying price levels from specific time intervals, traders can spot these cycles and predict future market behavior. This indicator allows you to see how the close price from X bars ago relates to current market conditions, helping to spot cyclical highs and lows.
2. Price and Time Squaring: A core concept in Gann’s theory is that certain price levels and time periods align, often marking significant reversal points. The squared numbers (e.g., 1, 4, 9, 16, 25, etc.) serve as potential key levels where price and time might "square" to create support or resistance. This indicator helps traders spot these historical price levels and their potential relevance to future price action.
3. Geometric Angles: Gann used angles (like the 45-degree angle) to predict market movements, with the belief that prices move at specific geometric angles over time. This indicator gives traders a reference for past price levels, which could align with key angles, helping traders predict future price movement based on Gann's geometry.
4. Numerology and Key Intervals: Gann paid particular attention to numbers that held significance, including squared numbers and numbers related to the Fibonacci sequence. This indicator allows traders to analyze price levels based on these key numbers, which can help in identifying potential turning points in the market.
5. Support and Resistance Levels: Gann’s methods often involved identifying levels of support and resistance based on past price action. By tracking the close price from X bars ago, traders can identify past support and resistance levels that may become significant again in future market conditions.
Perfect for:
Traders using WD Gann’s methods, such as Gann angles, time cycles, and price theory.
Analysts who focus on historical price levels to predict future price action.
Those who rely on numerology and geometric principles in their trading strategies.
By integrating this indicator into your trading strategy, you gain a powerful tool for analyzing market cycles and price movements in relation to key time intervals. The ability to track and compare the historical close price to significant numbers—like Gann’s squared numbers—can provide valuable insights into potential support, resistance, and reversal points.
Disclaimer:
This indicator is based on the methods and principles of WD Gann and is for educational purposes only. It is not intended as financial advice. Trading involves significant risk, and you should not trade with money that you cannot afford to lose. Past performance is not indicative of future results. The use of this indicator is at your own discretion and risk. Always do your own research and consider consulting a licensed financial advisor before making any investment decisions.

NWOG with FVGThe New Week Opening Gap (NWOG) and Fair Value Gap (FVG) combined indicator is a trading tool designed to analyze price action and detect potential support, resistance, and trade entry opportunities based on two significant concepts:
New Week Opening Gap (NWOG): The price range between the high and low of the first candle of the new trading week.
Fair Value Gap (FVG): A price imbalance or gap between candlesticks, where price may retrace to fill the gap, indicating potential support or resistance zones.
When combined, these two concepts help traders identify key price levels (from the new week open) and price imbalances (from FVGs), which can act as powerful indicators for potential market reversals, retracements, or continuation trades.
1. New Week Opening Gap (NWOG):
Definition:
The New Week Opening Gap (NWOG) refers to the range between the high and low of the first candle in a new trading week (often, the Monday open in most markets).
Purpose:
NWOG serves as a significant reference point for market behavior throughout the week. Price action relative to this range helps traders identify:
Support and Resistance zones.
Bullish or Bearish sentiment depending on price’s relation to the opening gap levels.
Areas where the market may retrace or reverse before continuing in the primary trend.
How NWOG is Identified:
The high and low of the first candle of the new week are drawn on the chart, and these levels are used to assess the market's behavior relative to this range.
Trading Strategy Using NWOG:
Above the NWOG Range: If price is trading above the NWOG levels, it signals bullish sentiment.
Below the NWOG Range: If price is trading below the NWOG levels, it signals bearish sentiment.
Price Touching the NWOG Levels: If price approaches or breaks through the NWOG levels, it can indicate a potential retracement or reversal.
2. Fair Value Gap (FVG):
Definition:
A Fair Value Gap (FVG) occurs when there is a gap or imbalance between two consecutive candlesticks, where the high of one candle is lower than the low of the next candle (or vice versa), creating a zone that may act as a price imbalance.
Purpose:
FVGs represent an imbalance in price action, often indicating that the market moved too quickly and left behind a price region that was not fully traded.
FVGs can serve as areas where price is likely to retrace to fill the gap, as traders seek to correct the imbalance.
How FVG is Identified:
An FVG is detected if:
Bearish FVG: The high of one candle is less than the low of the next (gap up).
Bullish FVG: The low of one candle is greater than the high of the next (gap down).
The area between the gap is drawn as a shaded region, indicating the FVG zone.
Trading Strategy Using FVG:
Price Filling the FVG: Price is likely to retrace to fill the gap. A reversal candle in the FVG zone can indicate a trade setup.
Support and Resistance: FVG zones can act as support (in a bullish FVG) or resistance (in a bearish FVG) if the price retraces to them.
Combined Strategy: New Week Opening Gap (NWOG) and Fair Value Gap (FVG):
The combined use of NWOG and FVG helps traders pinpoint high-probability price action setups where:
The New Week Opening Gap (NWOG) acts as a major reference level for potential support or resistance.
Fair Value Gaps (FVG) represent market imbalances where price might retrace to, filling the gap before continuing its move.
Signal Logic:
Buy Signal:
Price touches or breaks above the NWOG range (indicating a bullish trend) and there is a bullish FVG present (gap indicating a support area).
Price retraces to fill the bullish FVG, offering a potential buy opportunity.
Sell Signal:
Price touches or breaks below the NWOG range (indicating a bearish trend) and there is a bearish FVG present (gap indicating a resistance area).
Price retraces to fill the bearish FVG, offering a potential sell opportunity.
Example:
Buy Setup:
Price breaks above the NWOG resistance level, and a bullish FVG (gap down) appears below. Traders can wait for price to pull back to fill the gap and then take a long position when confirmation occurs.
Sell Setup:
Price breaks below the NWOG support level, and a bearish FVG (gap up) appears above. Traders can wait for price to retrace and fill the gap before entering a short position.
Key Benefits of the Combined NWOG & FVG Indicator:
Combines Two Key Concepts:
NWOG provides context for the market's overall direction based on the start of the week.
FVG highlights areas where price imbalances exist and where price might retrace to, making it easier to spot entry points.
High-Probability Setups:
By combining these two strategies, the indicator helps traders spot high-probability trades based on major market levels (from NWOG) and price inefficiencies (from FVG).
Helps Identify Reversal and Continuation Opportunities:
FVGs act as potential support and resistance zones, and when combined with the context of the NWOG levels, it gives traders clearer guidance on where price might reverse or continue its trend.
Clear Visual Signals:
The indicator can plot the NWOG levels on the chart, and shade the FVG areas, providing a clean and easy-to-read chart with entry signals marked for buy and sell opportunities.
Conclusion:
The New Week Opening Gap (NWOG) and Fair Value Gap (FVG) combined indicator is a powerful tool for traders who use price action strategies. By incorporating the New Week's opening range and identifying gaps in price action, this indicator helps traders identify potential support and resistance zones, pinpoint entry opportunities, and increase the probability of successful trades.
This combined strategy enhances your analysis by adding layers of confirmation for trades based on significant market levels and price imbalances. Let me know if you'd like more details or modifications!

ADM Indicator [CHE] Comprehensive Description of the Three Market Phases for TradingView
Introduction
Financial markets often exhibit patterns that reflect the collective behavior of participants. Recognizing these patterns can provide traders with valuable insights into potential future price movements. The ADM Indicator is designed to help traders identify and capitalize on these patterns by detecting three primary market phases:
1. Accumulation Phase
2. Manipulation Phase
3. Distribution Phase
This indicator places labels on the chart to signify these phases, aiding traders in making informed decisions. Below is an in-depth explanation of each phase, including how the ADM Indicator detects them.
1. Accumulation Phase
Definition
The Accumulation Phase is a period where informed investors or institutions discreetly purchase assets before a potential price increase. During this phase, the price typically moves within a confined range between established highs and lows.
Characteristics
- Price Range Bound: The asset's price stays within the previous high and low after a timeframe change.
- Low Volatility: Minimal price movement indicates a balance between buyers and sellers.
- Steady Volume: Trading volume may remain relatively constant or show slight increases.
- Market Sentiment: General market interest is low, as the accumulation is not yet apparent to the broader market.
Detection with ADM Indicator
- Criteria: An accumulation is detected when the price remains within the previous high and low after a timeframe change.
- Indicator Action: At the end of the period, if accumulation has occurred, the indicator places a label "Accumulation" on the chart.
- Visual Cues: A yellow semi-transparent background highlights the accumulation phase, enhancing visual recognition.
Implications for Traders
- Entry Opportunity: Consider preparing for potential long positions before a possible upward move.
- Risk Management: Use tight stop-loss orders below the support level due to the defined trading range.
2. Manipulation Phase
Definition
The Manipulation Phase, also known as the Shakeout Phase, occurs when dominant market players intentionally move the price to trigger stop-loss orders and create panic among less-informed traders. This action generates liquidity and better entry prices for large positions.
Characteristics
- False Breakouts: The price moves above the previous high or below the previous low but quickly reverses.
- Increased Volatility: Sharp price movements occur without fundamental reasons.
- Stop-Loss Hunting: The price targets common stop-loss areas, triggering them before reversing.
- Emotional Trading: Retail traders may react impulsively, leading to poor trading decisions.
Detection with ADM Indicator
- Manipulation Up:
- Criteria: Detected when the price rises above the previous high and then falls back below it.
- Indicator Action: Places a label "Manipulation Up" on the chart at the point of detection.
- Manipulation Down:
- Criteria: Detected when the price falls below the previous low and then rises back above it.
- Indicator Action: Places a label "Manipulation Down" on the chart at the point of detection.
- Visual Cues:
- Manipulation Up: Blue background highlights the phase.
- Manipulation Down: Orange background highlights the phase.
Implications for Traders
- Caution Advised: Be wary of false signals and avoid overreacting to sudden price changes.
- Preparation for Next Phase: Use this phase to anticipate potential distribution and adjust strategies accordingly.
3. Distribution Phase
Definition
The Distribution Phase occurs when the institutions or informed investors who accumulated positions start selling to the general market at higher prices. This phase often follows a Manipulation Phase and may signal an impending trend reversal.
Characteristics
- Price Reversal: The price moves in the opposite direction of the prior manipulation.
- High Trading Volume: Increased selling activity as large players offload positions.
- Trend Weakening: The previous trend loses momentum, indicating a potential shift.
- Market Sentiment Shift: Optimism fades, and uncertainty or pessimism may emerge.
Detection with ADM Indicator
- Distribution Up:
- Criteria: Detected after a verified Manipulation Up when the price subsequently falls below the previous low.
- Indicator Action: Places a label "Distribution Up" on the chart.
- Distribution Down:
- Criteria: Detected after a verified Manipulation Down when the price subsequently rises above the previous high.
- Indicator Action: Places a label "Distribution Down" on the chart.
- Visual Cues:
- Distribution Up: Purple background highlights the phase.
- Distribution Down: Maroon background highlights the phase.
Implications for Traders
- Exit Signals: Consider closing long positions if in a Distribution Up phase.
- Short Selling Opportunities: Potential to enter short positions anticipating a downtrend.
Using the ADM Indicator on TradingView
Indicator Overview
The ADM Indicator automates the detection of Accumulation, Manipulation, and Distribution phases by analyzing price movements relative to previous highs and lows on a selected timeframe. It provides visual cues and labels on the chart, helping traders quickly identify the current market phase.
Features
- Multi-Timeframe Analysis: Choose from auto, multiplier, or manual timeframe settings.
- Visual Labels: Clear labeling of market phases directly on the chart.
- Background Highlighting: Distinct background colors for each phase.
- Customizable Settings: Adjust colors, styles, and display options.
- Period Separators: Optional separators delineate different timeframes.
Interpreting the Indicator
1. Accumulation Phase
- Detection: Price stays within the previous high and low after a timeframe change.
- Label: "Accumulation" placed at the period's end if detected.
- Background: Yellow semi-transparent color.
- Action: Prepare for potential long positions.
2. Manipulation Phase
- Detection:
- Manipulation Up: Price rises above previous high and then falls back below.
- Manipulation Down: Price falls below previous low and then rises back above.
- Labels: "Manipulation Up" or "Manipulation Down" placed at detection.
- Background:
- Manipulation Up: Blue color.
- Manipulation Down: Orange color.
- Action: Exercise caution; avoid impulsive trades.
3. Distribution Phase
- Detection:
- Distribution Up: After a Manipulation Up, price falls below previous low.
- Distribution Down: After a Manipulation Down, price rises above previous high.
- Labels: "Distribution Up" or "Distribution Down" placed at detection.
- Background:
- Distribution Up: Purple color.
- Distribution Down: Maroon color.
- Action: Consider exiting positions or entering counter-trend trades.
Configuring the Indicator
- Timeframe Type: Select Auto, Multiplier, or Manual for analysis timeframe.
- Multiplier: Set a custom multiplier when using "Multiplier" type.
- Manual Resolution: Define a specific timeframe with "Manual" option.
- Separator Settings: Customize period separators for visual clarity.
- Label Display Options: Choose to display all labels or only the most recent.
- Visualization Settings: Adjust colors and styles for personal preference.
Practical Tips
- Combine with Other Analysis Tools: Use alongside volume indicators, trend lines, or other technical tools.
- Backtesting: Review historical data to understand how the indicator signals would have impacted past trades.
- Stay Informed: Keep abreast of market news that might affect price movements beyond technical analysis.
- Risk Management: Always employ stop-loss orders and position sizing strategies.
Conclusion
The ADM Indicator is a valuable tool for traders seeking to understand and leverage market phases. By detecting Accumulation, Manipulation, and Distribution phases through specific price action criteria, it provides actionable insights into market dynamics.
Understanding the precise conditions under which each phase is detected empowers traders to make more informed decisions. Whether preparing for potential breakouts during accumulation, exercising caution during manipulation, or adjusting positions during distribution, the ADM Indicator aids in navigating the complexities of the financial markets.
Disclaimer:
The content provided, including all code and materials, is strictly for educational and informational purposes only. It is not intended as, and should not be interpreted as, financial advice, a recommendation to buy or sell any financial instrument, or an offer of any financial product or service. All strategies, tools, and examples discussed are provided for illustrative purposes to demonstrate coding techniques and the functionality of Pine Script within a trading context.
Any results from strategies or tools provided are hypothetical, and past performance is not indicative of future results. Trading and investing involve high risk, including the potential loss of principal, and may not be suitable for all individuals. Before making any trading decisions, please consult with a qualified financial professional to understand the risks involved.
By using this script, you acknowledge and agree that any trading decisions are made solely at your discretion and risk.
This indicator is inspired by the Super 6x Indicators: RSI, MACD, Stochastic, Loxxer, CCI, and Velocity . A special thanks to Loxx for their relentless effort, creativity, and contributions to the TradingView community, which served as a foundation for this work.
Best regards Chervolino
Overview of the Timeframe Levels in the `autotimeframe()` Function
The `autotimeframe()` function automatically adjusts the higher timeframe based on the current chart timeframe. Here are the specific timeframe levels used in the function:
- Current Timeframe ≤ 1 Minute
→ Higher Timeframe: 240 Minutes (4 Hours)
- Current Timeframe ≤ 5 Minutes
→ Higher Timeframe: 1 Day
- Current Timeframe ≤ 1 Hour
→ Higher Timeframe: 3 Days
- Current Timeframe ≤ 4 Hours
→ Higher Timeframe: 7 Days
- Current Timeframe ≤ 12 Hours
→ Higher Timeframe: 1 Month
- Current Timeframe ≤ 1 Day
→ Higher Timeframe: 3 Months
- Current Timeframe ≤ 7 Days
→ Higher Timeframe: 6 Months
- For All Higher Timeframes (over 7 Days)
→ Higher Timeframe: 12 Months
Summary:
The function assigns a corresponding higher timeframe based on the current timeframe to optimize the analysis:
- 1 Minute or Less → 4 Hours
- Up to 5 Minutes → 1 Day
- Up to 1 Hour → 3 Days
- Up to 4 Hours → 7 Days
- Up to 12 Hours → 1 Month
- Up to 1 Day → 3 Months
- Up to 7 Days → 6 Months
- Over 7 Days → 12 Months
This automated adjustment ensures that the indicator works effectively across different chart timeframes without requiring manual changes.

Universal Estimated Funding RateDescription:
This indicator calculates an estimated funding rate for perpetual futures contracts on Binance. The funding rate is derived from the premium index, reflecting the difference between the perpetual futures price and the spot market price, with an assumed constant interest rate.
Key Features:
Dynamic Symbol Detection: Automatically adapts to the base and quote currencies of the current chart, making it compatible with most Binance trading pairs that support both spot and perpetual markets.
Customizable Timeframes: Supports multiple timeframes, with a default recommendation of 4 hours to align with Binance's funding intervals.
Real-Time Data: Fetches live spot and perpetual prices to calculate the premium index and estimate funding rates in real time.
Error Handling: Displays alerts and highlights invalid data if the pair lacks spot or perpetual market information, ensuring clarity for the user.
Use Case:
This indicator is designed to help traders:
Track market sentiment through funding rates.
Identify opportunities for arbitrage or hedging between spot and perpetual markets.
Monitor trends in funding rates to complement technical analysis and refine entry/exit decisions.
How It Works:
The script dynamically identifies the spot and perpetual futures symbols for the selected chart.
It calculates the premium index as the percentage difference between the perpetual and spot prices.
Combines the premium index with an assumed interest rate (default: 0.01% per 8 hours) to estimate the funding rate.
How to Use:
Apply the indicator to any Binance trading pair chart.
Set the timeframe to align with your trading strategy (e.g., 4-hour for swing trading or 5-minute for scalping).
Observe the plotted funding rate to assess market sentiment:
Positive values indicate a long bias (longs pay shorts).
Negative values indicate a short bias (shorts pay longs).
Important Notes:
This is an estimated funding rate based on available data. For exact values, refer to Binance directly.
Funding rates are updated every 8 hours on Binance, so aligning with 4-hour charts is optimal.
Ensure both spot and perpetual data are available for the chosen pair.
This indicator is open-source and serves as a valuable tool for traders seeking deeper insights into funding dynamics on Binance. Happy trading! 🚀

HBK Price Action Strategy HBKPrice Action Strategy for XAUUSD with a Favorable Risk-Reward Ratio
Understanding the Strategy:
This strategy leverages price action principles to identify potential entry and exit points for XAUUSD on a 5-minute timeframe. The core idea is to identify price action patterns that suggest a high probability of a particular direction, and then to set stop-loss and take-profit levels to manage risk and reward.
Key Price Action Patterns to Watch:
Pin Bar: A pin bar is a candlestick with a long wick in one direction and a small body in the opposite direction. It often signals a reversal in the current trend.
Inside Bar: An inside bar forms when the current candle's high is lower than the previous candle's high, and the current candle's low is higher than the previous candle's low. It often indicates indecision or a potential breakout.
Engulfing Pattern: An engulfing pattern occurs when the current candle completely engulfs the previous candle. A bullish engulfing pattern signals a potential uptrend, while a bearish engulfing pattern signals a potential downtrend.
Risk-Reward Ratio:
A favorable risk-reward ratio is crucial for long-term trading success. Aim for a minimum risk-reward ratio of 1:2, meaning you risk $1 to potentially gain $2.
Entry and Exit Signals:
Long Entry:
Identify a bullish pin bar or engulfing pattern.
Wait for a confirmation candle to close above the pin bar's high or the engulfing pattern's high.
Place a stop-loss below the recent swing low.
Set a take-profit target at a key resistance level or a multiple of the stop-loss distance.
Short Entry:
Identify a bearish pin bar or engulfing pattern.
Wait for a confirmation candle to close below the pin bar's low or the engulfing pattern's low.
Place a stop-loss above the recent swing high.
Set a take-profit target at a key support level or a multiple of the stop-loss distance.
Additional Tips:
Use Support and Resistance Levels: Identify key support and resistance levels to set your stop-loss and take-profit targets.
Consider Market Sentiment: Pay attention to market sentiment and news events that may impact gold prices.
Manage Risk: Always use stop-loss orders to limit potential losses.
Be Patient: Don't force trades. Wait for high-probability setups.
Practice Discipline: Stick to your trading plan and avoid impulsive decisions.
Remember:
Price action trading requires practice and patience.
Backtest your strategy on historical data to refine your approach.
Always adapt to changing market conditions.
By following these guidelines and practicing disciplined risk management, you can increase your chances of success in trading XAUUSD on a 5-minute timeframe.

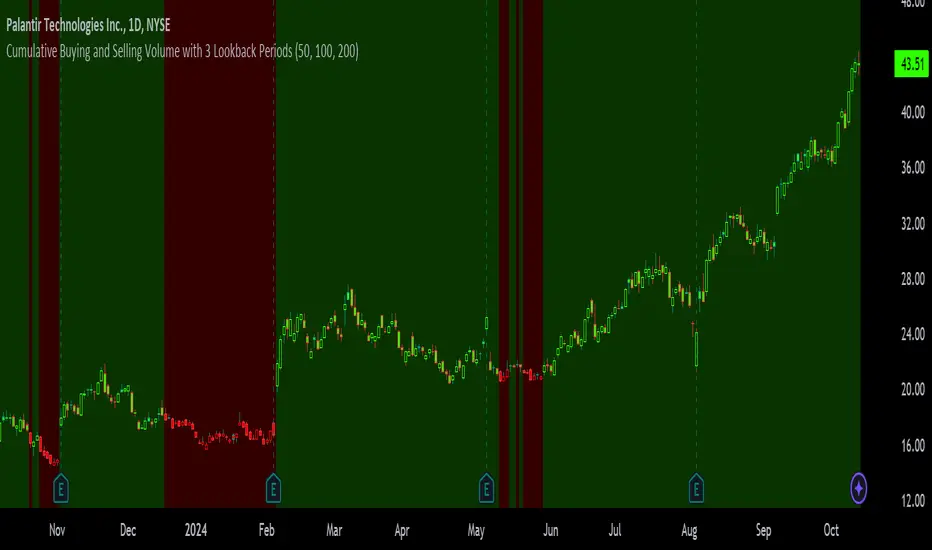
Cumulative Buying and Selling Volume with 3 Lookback PeriodsScript Overview:
This script is designed to help traders identify market momentum by analyzing buying and selling volume. It calculates the cumulative buying and selling pressure over three different lookback periods, providing insights into whether the bulls or bears are dominating at any given time. The script does this by computing the cumulative buying and selling volume for each period and comparing them through exponential moving averages (EMA) to smooth out short-term fluctuations.
Purpose and Use:
The primary goal of this script is to highlight shifts in market sentiment based on volume dynamics. Volume is a critical component in market analysis, often signaling the strength behind price movements. By focusing on cumulative buying and selling pressure, the script gives traders an idea of whether the market is trending towards more buying or selling during specific periods. Traders can use this tool to:
Identify potential entry points when buying pressure is strong.
Recognize potential selling opportunities when selling pressure is increasing.
Detect periods of indecision when neither buying nor selling dominates.
Key Concepts:
1. Buying Volume (BV):
The buying volume is calculated based on the price range of each candle. It represents the volume allocated to the bullish side of the market:
When the close is near the high, the buying volume is higher.
Formula: BV = volume * (close - low) / (high - low).
2. Selling Volume (SV):
Similarly, selling volume is derived based on the position of the close relative to the low:
When the close is near the low, selling volume is higher.
Formula: SV = volume * (high - close) / (high - low)
3. Lookback Periods:
The script allows users to define three different lookback periods (5, 10, and 20 by default). These periods smooth out the cumulative buying and selling volumes using EMA calculations:
Shorter periods capture more immediate changes in volume dynamics.
Longer periods provide a broader perspective on market trends.
4. Cumulative Volume Calculation:
For each lookback period, cumulative buying and selling volumes are tracked separately and then smoothed with EMA:
emaBuyVol and emaSellVol are the smoothed values for buying and selling volumes over the lookback periods.
5. Market Pressure Comparison:
Buying Pressure: If the EMA of buying volume is greater than the EMA of selling volume for a particular lookback period, the script considers that buying pressure dominates for that period.
Selling Pressure: Conversely, if selling volume dominates over buying volume for a period, the script registers selling pressure.
6. Overall Market Pressure:
The script aggregates the buying and selling pressures from the three lookback periods to determine the overall market sentiment:
If the majority of periods show buying pressure, the market is bullish.
If the majority show selling pressure, the market is bearish.
If neither side dominates, it suggests a neutral or indecisive market.
Visual Cues:
The script provides visual feedback to help traders quickly interpret the market pressure:
Background Color:
Green (#2bff00) when buying pressure dominates.
Red (#ff0000) when selling pressure dominates.
Gray (#404040) when there is no clear dominance.
Bar Color: The script also colors the price bars based on the dominant market pressure:
Green for buying pressure.
Red for selling pressure.
Gray for neutral or balanced market pressure.
Reset Mechanism:
At the start of each new candle, the cumulative volumes for all three periods are reset to zero. This ensures that the cumulative volumes are only measured for the current candle, preventing carryover from previous periods that could distort the analysis.
How Traders Can Use This Script:
Trend Confirmation: Traders can use the script as a trend confirmation tool. When the background turns green (buying dominance), it suggests bullish momentum. When red, bearish momentum is likely. This information can be used to confirm existing positions or signal new trades in the direction of the market pressure.
Reversal Detection: A sudden shift in the background color (from green to red or vice versa) can indicate a potential reversal. This can be particularly useful when combined with other technical indicators such as price action or support/resistance levels.
Multiple Timeframes: Since the script supports three different lookback periods, it provides a comprehensive view of market pressure across short-term, medium-term, and long-term perspectives. Traders can tailor the lookback periods based on their preferred timeframe to match their trading style, whether it’s intraday trading or longer-term swing trading.
Risk Management: The script's clear visual cues help traders manage risk by highlighting when selling pressure increases, allowing them to consider reducing long positions or tightening stop-losses.
Market DirectionThe "Market Direction" indicator combines four advanced sub-indicators to provide a comprehensive and multi-dimensional analysis of market trends, momentum, and potential reversals. This innovative approach leverages different aspects of price action, volume, and market sentiment, offering traders an in-depth view of market conditions.
1. Fractal Indicator: Multi-Scale Price Action Analysis
The Fractal Indicator identifies significant highs and lows over six different pivot lengths, offering a nuanced view of price action across multiple timeframes. By comparing distances from current closing prices to these key fractal points, the indicator determines potential trend reversals and market direction. This approach enables traders to adapt their strategies to various market conditions, capturing both short-term fluctuations and long-term trends.
2. Volume MACD Indicator: Enhanced Market Momentum
The Volume MACD Indicator goes beyond traditional MACD analysis by incorporating volume-weighted movement and the structural attributes of candlesticks (such as body length and wicks). This hybrid model offers a more comprehensive understanding of market momentum by integrating both price action and trading volume. The use of Smoothed Moving Averages (SMMA) reduces noise and ensures more stable signals, helping traders focus on sustainable trends and longer-term investment opportunities.
3. Cumulative Volume Momentum Indicator: Volume Dynamics Insight
The Cumulative Volume Momentum Indicator evaluates the momentum of cumulative buying and selling volumes, offering a clear picture of market strength and potential reversals. By comparing the relationship between open, close, high, and low prices, and applying a MACD approach to these volume dynamics, this indicator helps traders identify momentum shifts that often precede price movements. The visualization through histograms adds clarity to bullish and bearish volume momentum, enhancing decision-making in volatile markets.
4. POC-Price Momentum Indicator: Market Depth and Sentiment
The POC-Price Momentum Indicator assesses the difference between the Point of Control (POC) and closing prices, providing insights into underlying market sentiment. Positive differences indicate a buildup of upward momentum, while negative differences suggest a bearish tilt. By calculating moving averages of these differences, the indicator highlights the strength and sustainability of ongoing trends, helping traders align their strategies with the broader market direction.
Unified Rating for Confirming Market Direction
The "Market Direction" indicator consolidates the outputs of these four sub-indicators into a single, aggregated sentiment score. This score helps traders confirm the prevailing market trend by weighing the combined insights from fractal analysis, volume momentum, price action, and POC dynamics. A positive score suggests a bullish market, while a negative score indicates bearish conditions.

Inverted Yield Curve (US01Y/US10Y Ratio)This indicator calculates and visualizes the ratio between the US 1-Year Treasury Yield (US01Y) and the US 10-Year Treasury Yield (US10Y). It provides a clear visual representation of the relationship between short-term and long-term interest rates, which can be a valuable tool for analyzing market conditions, potential recessions, or shifts in economic outlook.
Features:
US01Y/US10Y Ratio: The indicator plots the ratio between the 1-Year and 10-Year US Treasury Yields as a smooth curve.
Dynamic Highlighting: Portions of the curve where the ratio exceeds 1 are highlighted in red, making it easy to identify periods where short-term rates surpass long-term rates—a key signal often associated with economic shifts or inversions.
Customizable Appearance: The main curve is plotted in a light blue color for clear visibility against most chart backgrounds.
Use Cases:
Yield Curve Analysis: This indicator helps traders and analysts monitor the yield curve, specifically focusing on the relationship between short-term and long-term interest rates.
Recession Signals: An inverted yield curve, where the ratio exceeds 1, can be an early warning signal for potential economic downturns.
Market Sentiment: Use the indicator to gauge shifts in investor sentiment by tracking changes in the yield curve over time.
How to Use:
Add the script to your TradingView chart.
The light blue curve represents the ratio of US01Y/US10Y.
Red highlights indicate periods where the ratio exceeds 1, signaling potential yield curve inversion.
This indicator is ideal for traders, investors, and economists looking to incorporate yield curve analysis into their trading strategies or economic forecasts.

ATH/ATL Tracker [LuxAlgo]The ATH/ATL Tracker effectively displays changes made between new All-Time Highs (ATH)/All-Time Lows (ATL) and their previous respective values, over the entire history of available data.
The indicator shows a histogram of the change between a new ATH/ATL and its respective preceding ATH/ATL. A tooltip showing the price made during a new ATH/ATL alongside its date is included.
🔶 USAGE
By tracking the change between new ATHs/ATLs and older ATHs/ATLs, traders can gain insight into market sentiment, breadth, and rotation.
If many stocks are consistently setting new ATHs and the number of new ATHs is increasing relative to old ATHs, it could indicate broad market participation in a rally. If only a few stocks are reaching new ATHs or the number is declining, it might signal that the market's upward momentum is decreasing.
A significant increase in new ATHs suggests optimism and willingness among investors to buy at higher prices, which could be considered a positive sentiment. On the other hand, a decrease or lack of new ATHs might indicate caution or pessimism.
By observing the sectors where stocks are consistently setting new ATHs, users can identify which sectors are leading the market. Sectors with few or no new ATHs may be losing momentum and could be identified as lagging behind the overall market sentiment.
🔶 DETAILS
The indicator's main display is a histogram-style readout that displays the change in price from older ATH/ATLs to Newer/Current ATH/ATLs. This change is determined by the distance that the current values have overtaken the previous values, resulting in the displayed data.
The largest changes in ATH/ATLs from the ticker's history will appear as the largest bars in the display.
The most recent bars (depending on the selected display setting) will always represent the current ATH or ATL values.
When determining ATH & ATL values, it is important to filter out insignificant highs and lows that may happen constantly when exploring higher and lower prices. To combat this, the indicator looks to a higher timeframe than your chart's timeframe in order to determine these more significant ATHs & ATLs.
For Example: If a user was on a 1-minute chart and 5 highs-new highs occur across 5 adjacent bars, this has the potential to show up as 5 new ATHs. When looking at a higher timeframe, 5 minutes, only the highest of the 5 bars will indicate a new ATH. To assist with this, the indicator will display warnings in the dashboard when a suboptimal timeframe is selected as input.
🔹 Dashboard
The dashboard displays averages from the ATH/ATL data to aid in the anticipation and expectations for new ATH/ATLs.
The average duration is an average of the time between each new ATH/ATL, in this indicator it is calculated in "Days" to provide a more comprehensive understanding.
The average change is the average of all change data displayed in the histogram.
🔶 SETTINGS
Duration: The designated higher timeframe to use for filtering out insignificant ATHs & ATLs.
Order: The display order for the ATH/ATL Bars, Options are to display in chronological (oldest to newest) or reverse chronological order (newest to oldest).
Bar Width: Sets the width for each ATH/ATL bar.
Bar Spacing: Sets the # of empty bars in between each ATH/ATL bar.
Dashboard Settings: Parameters for the dashboard's size and location on the chart.

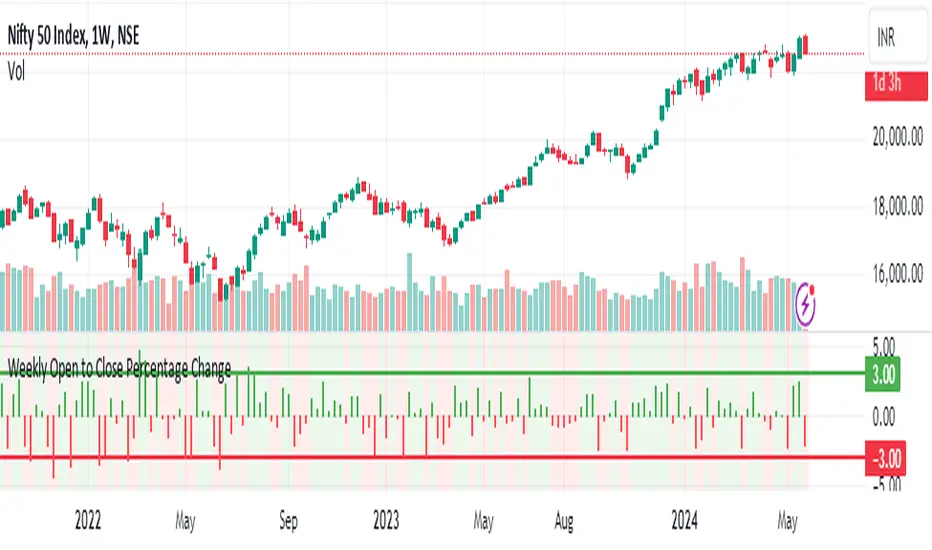
Weekly Open to Close Percentage ChangeThe "Weekly Open to Close Percentage Change Indicator" is a powerful tool designed to help traders and investors track the percentage change in price from the open of the current week's candle to its close. This indicator provides a clear visualization of how the price has moved within the week, offering valuable insights into weekly market trends and momentum.
Key Features:
Weekly Analysis: Focuses on weekly time frames, making it ideal for swing traders and long-term investors.
Percentage Change Calculation: Accurately calculates the percentage change from the open price of the current week's candle to the close price.
Color-Coded Visualization: Uses color coding to differentiate between positive and negative changes:
Green for positive percentage changes (price increase).
Red for negative percentage changes (price decrease).
Histogram Display: Plots the percentage change as a histogram for easy visual interpretation.
Background Highlighting: Adds a background color with transparency to highlight the nature of the change, enhancing chart readability.
Optional Labels: Includes an option to display percentage change values as small dots at the top for quick reference.
How to Use:
Add the script to your TradingView chart by opening the Pine Editor, pasting the script, and saving it.
Apply the indicator to your chart. It will automatically calculate and display the weekly percentage change.
Use the color-coded histogram and background to quickly assess weekly price movements and make informed trading decisions.
Use Cases:
Trend Identification: Quickly identify whether the market is trending upwards or downwards on a weekly basis.
Market Sentiment: Gauge the market sentiment by observing the weekly price changes.
Swing Trading: Ideal for swing traders who base their strategies on weekly price movements.
Note: This indicator is designed for educational and informational purposes. Always conduct thorough analysis and consider multiple indicators and factors when making trading decisions.
MVRV Ratio - R.BonaldiMVRV Ratio Indicator
The MVRV Ratio Indicator is a powerful tool for cryptocurrency traders and investors. It provides a visual representation of the Market Value to Realized Value ratio, helping you assess whether a cryptocurrency is overvalued or undervalued.
What is the MVRV Ratio?
Market Value: The current market price of the cryptocurrency multiplied by its circulating supply.
Realized Value: The average price at which each unit of the cryptocurrency was last moved on the blockchain, providing a more realistic view of its actual value.
How to Use This Indicator:
Identify Critical Levels:
The indicator displays a blue line representing the MVRV Ratio.
Horizontal lines at levels 1 (red) and 3 (green) help you quickly see significant thresholds.
When the blue line is below the red line (MVRV < 1), the cryptocurrency is considered undervalued.
When the blue line is above the green line (MVRV > 3), the cryptocurrency is considered overvalued.
Visual Cues:
The background turns red when the MVRV Ratio is below 1, indicating potential buying opportunities.
The background turns green when the MVRV Ratio is above 3, signaling potential selling opportunities.
Why Use the MVRV Ratio?
Risk Management: By identifying overvalued and undervalued conditions, you can make more informed decisions, reducing the risk of buying high and selling low.
Market Sentiment: The MVRV Ratio provides insight into market sentiment, helping you gauge the overall mood and potential future movements.
Timing: Use the indicator to time your entries and exits more effectively, aligning your trades with the underlying value of the cryptocurrency.
Whether you're a long-term investor looking to accumulate during undervalued periods or a short-term trader aiming to capitalize on overvalued spikes, the MVRV Ratio Indicator offers a clear and concise way to enhance your trading strategy.

US CPIIntroducing "US CPI" Indicator
The "US CPI" indicator, based on the Consumer Price Index (CPI) of the United States, is a valuable tool for analyzing inflation trends in the U.S. economy. This indicator is derived from official data provided by the U.S. Bureau of Labor Statistics (BLS) and is widely recognized as a key measure of inflationary pressures.
What is CPI?
The Consumer Price Index (CPI) is a measure that examines the average change in prices paid by consumers for a basket of goods and services over time. It is an essential economic indicator used to gauge inflationary trends and assess changes in the cost of living.
How is "US CPI" Calculated?
The "US CPI" indicator in this script retrieves CPI data from the Federal Reserve Economic Data (FRED) using the FRED:CPIAUCSL symbol. It calculates the rate of change in CPI over a specified period (typically 12 months) and applies technical analysis tools like moving averages (SMA and EMA) for trend analysis and smoothing.
Why Use "US CPI" Indicator?
1. Inflation Analysis: Monitoring CPI trends provides insights into the rate of inflation, which is crucial for understanding the overall economic health and potential impact on monetary policy.
2. Policy Implications: Changes in CPI influence decisions by policymakers, central banks, and investors regarding interest rates, fiscal policies, and asset allocation.
3. Market Sentiment: CPI data often impacts market sentiment, influencing trading strategies across various asset classes including currencies, bonds, and equities.
Key Features:
1. Customizable Smoothing: The indicator allows users to apply exponential moving average (EMA) smoothing to CPI data for clearer trend identification.
2. Visual Representation: The plotted line visually represents the inflation rate based on CPI data, helping traders and analysts assess inflationary pressures at a glance.
Sources and Data Integrity:
The CPI data used in this indicator is sourced directly from FRED, ensuring reliability and accuracy. The script incorporates robust security protocols to handle data requests and maintain data integrity in a trading environment.
In conclusion, the "US CPI" indicator offers a comprehensive view of inflation dynamics in the U.S. economy, providing traders, economists, and policymakers with valuable insights for informed decision-making and risk management.
Disclaimer: This indicator and accompanying analysis are for informational purposes only and should not be construed as financial advice. Users are encouraged to conduct their own research and consult with professional advisors before making investment decisions.

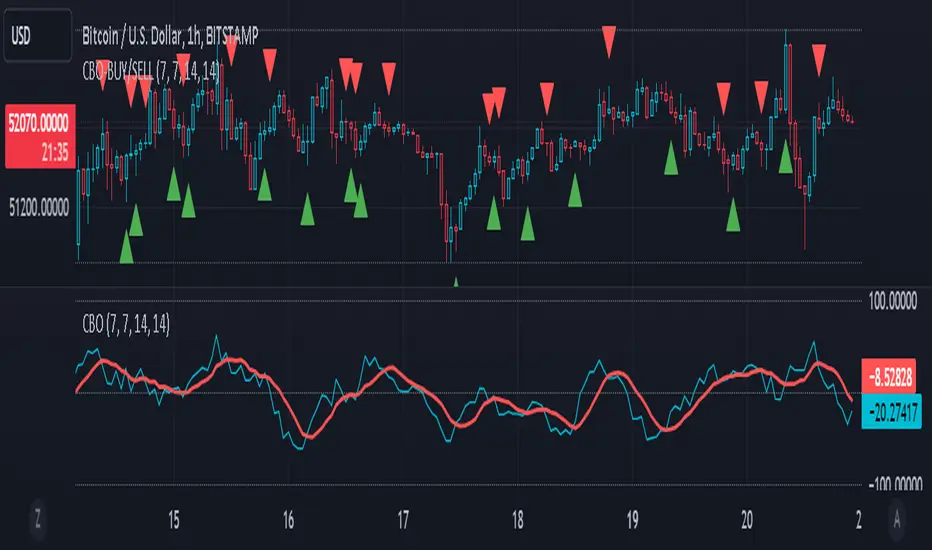
CBO (Candle Bias Oscillator)The Candle Bias Oscillator (CBO) with volume and ATR scaling is a unique technical analysis tool designed to capture market sentiment through the analysis of candlestick patterns, volume momentum, and market volatility. This indicator is built on the foundation of assessing the bias within a candlestick's body and wicks, adjusted for market volatility using the Average True Range (ATR), and further refined by comparing the Rate of Change (ROC) in volume and the adjusted bias. The culmination of these calculations results in the CBO, a smoothed oscillator that highlights potential market turning points through divergence analysis.
Key Features:
Bias Calculations: Utilizes the relationship between the candle's body and wicks to determine the market's immediate bias, offering a nuanced view beyond simple price action. Have you ever wanted to quantify exactly how bullish or bearish a particular candle or candlestick pattern is? Whether it's dojis, hammers, engulfing, gravestones, evening morning star, three soldiers etc. you don't have to memorize 50 candlestick patterns anymore.
Volatility Adjustment: Employs the ATR to adjust the bias calculation, ensuring the oscillator remains relevant across varying market conditions by accounting for volatility.
Momentum and Divergence: Measures the momentum in volume and bias through ROC calculations, identifying divergence that may signal reversals or significant price movements.
Signal Line: A smoothed version of the CBO, derived from its own values, serving as a benchmark for identifying potential crossovers and divergences.
Utility and Application:
The CBO with Divergence Scaling is developed for traders who seek a deeper understanding of market dynamics beyond price movements alone. It is particularly useful for identifying potential reversals or continuation patterns early, by highlighting divergence between market sentiment (as expressed through candlestick bias) and actual volume movements. In this way, it aligns us retail traders with institutional traders and smart money. This indicator is versatile and can be applied across various time frames and market instruments, offering value to both short-term traders and long-term investors.
How to Use:
Trend Identification: The direction and value of the CBO provide insights into the prevailing market trend. A positive oscillator value may indicate bullish sentiment, while a negative value suggests bearish sentiment.
Signal Line Crossovers: Crossovers between the CBO and its signal line can be used as potential buy or sell signals. A crossover above the signal line might indicate a buying opportunity, whereas a crossover below could suggest a selling point.
Divergence: Discrepancies between the CBO and price action (especially when confirmed by volume ROC) can highlight potential reversals.
Customization and Parameters: This script allows users to adjust several parameters, including oscillator periods, signal line periods, ATR periods, and ROC periods for divergence, to best fit their trading strategy and the characteristics of the market they are analyzing.
Conclusion:
The Custom Bias Oscillator with Divergence Scaling is a comprehensive tool designed to offer traders a multi-faceted view of market conditions, combining elements of price action, volatility, and momentum. By integrating these aspects into a single indicator, it aims to provide a more rounded and actionable insight into market trends and potential turning points.
To comply with best practices and ensure clarity regarding the informational nature of the Custom Bias Oscillator (CBO) tool, it's crucial to include a disclaimer about the non-advisory nature of the script. Here's a suitable disclaimer that you can add to the end of your script description or publication:
Disclaimer:
The Custom Bias Oscillator (CBO) with Divergence Scaling and its accompanying analysis are provided as tools for educational and informational purposes only and should not be construed as financial advice. The creator of this indicator does not guarantee any specific outcomes or profit, and all users should be aware of the risks involved in trading and investing. Users should conduct their own research and consult with a professional financial advisor before making any investment decisions. The use of this indicator is at the user's own risk, and the creator bears no responsibility for any direct or consequential loss arising from any use of this tool or the information provided herein.
Multiperiod Volume Pressure Indicator
Description:
The Volume Pressure Indicator is a powerful tool designed to assess market sentiment based on a combination of price and volume data. By analyzing buy and sell pressure within specific lookback periods, this indicator provides valuable insights into the intensity of market buying and selling activities. Traders can use this information to make informed decisions, especially during periods of price consolidation or trend reversal.
Key Features:
- **Multi-Period Analysis:** Utilizes multiple lookback periods (1, 2, and 4) to calculate buy and sell pressures, offering a nuanced view of market dynamics over different timeframes.
- **Pressure Calculation:** Computes buy and sell pressures based on price range and closing values, providing a comprehensive understanding of market participant behavior.
- **Color-Coded Bars:** Visualizes market sentiment by coloring bars according to the number of positive (buy pressure > sell pressure) periods observed within the specified lookback periods.
How to Use:
- **Color Coding:** Green bars represent periods where buy pressure dominates, indicating potential buying interest. Yellow bars suggest a balance between buy and sell pressures. Red bars signal periods dominated by sell pressure, indicating potential selling interest.
- **Lookback Periods:** Shorter lookback periods (e.g., 1) offer insights into immediate market sentiment, while longer periods (e.g., 4) provide a broader perspective. Analyzing multiple periods can help traders confirm trends and anticipate reversals.
Customization:
- **Lookback Periods:** Adjust the length of the lookback periods (1, 2, and 4) to match your trading style and timeframe preferences.
Disclaimer:
Trading involves risk, and past performance is not indicative of future results. Always conduct thorough analysis and apply proper risk management techniques before making trading decisions.
Usage Scenarios:
- **Trend Confirmation:** Use the indicator to confirm the strength of an ongoing trend. Consistent green bars can validate a bullish trend, while red bars may confirm a bearish trend.
- **Reversal Signals:** Look for transitions in bar colors to identify potential trend reversals. A shift from green to yellow/red or vice versa can indicate changing market sentiment.
- **Divergence Analysis:** Compare price movements with the indicator's bar colors. Divergence between price trends and bar colors may signal upcoming price movements.

TMA Bands with Break Arrow @ClearTradingMind
The "TMA Bands with Break Arrow" indicator, developed by ClearTradingMind, is designed to provide traders with insights into potential trend reversals based on the movement of price within a channel defined by the Triangular Moving Average (TMA) and its bands. The TMA is a smoothed moving average, and this indicator adds upper and lower bands to visualize potential breakouts.
Key Components:
1. TMA Bands: The indicator plots the upper and lower bands of the TMA channel. These bands represent potential overbought (upper band) and oversold (lower band) conditions.
2. Break Arrows: The indicator generates buy (green triangle up) and sell (red triangle down) arrows when the closing price breaks above the upper band or below the lower band, indicating a potential trend reversal.
3. Background Color: The background color dynamically changes based on the last generated signal. A blue background suggests a recent buy signal, while a red background indicates a recent sell signal. This provides a quick visual reference for the prevailing market sentiment.
Usage:
1. Trend Reversals: Traders can use the buy and sell arrows as signals for potential trend reversals. A buy signal suggests a possible upward trend, while a sell signal suggests a potential downward trend.
2. Channel Breakouts: Watch for price breaking above the upper band (buy signal) or below the lower band (sell signal). These breakouts may indicate the start of a new trend.
3. Volatility Analysis: The width of the TMA channel represents volatility. A widening channel suggests increased volatility, while a narrowing channel suggests decreasing volatility.
4. Background Color: The background color provides additional context. A blue background indicates recent bullish sentiment, while a red background suggests recent bearish sentiment.
Parameters:
- TMA Period: The number of bars used to calculate the Triangular Moving Average.
- ATR Period: The number of bars used to calculate the Average True Range (ATR) for determining the width of the TMA channel.
- ATR Multiplier: A multiplier applied to the ATR to determine the width of the TMA channel.
Note: This indicator is a tool to assist traders in their analysis, and it is recommended to use it in conjunction with other technical and fundamental analysis methods for more comprehensive decision-making.
Disclaimer: Trading involves risk, and this indicator does not guarantee profit. Users should conduct thorough analysis and risk management before making trading decisions.

Engulfing Signals
Okay, so we've got an indicator here that prints buy sell signals based on engulfing candles and uses a 200 EMA and RSI to filter out some of the noise.
This indicator incorporates price action, in the form of engulfing candles, moving averages and a momentum oscillator. It also has the of plotting either a Simple Moving Average or an Exponential Moving Average over varying periods in order to determine if price is respecting a certain level or to develop more accurately-timed alert signals. Engulfing candles can be a good indication of a change in sentiment and momentum.
Engulfing candles can be a good indication of a change in market behaviour but they happen far too often to be of any practical use by themselves.
In order to filter out some of the weaker candles, I have incorporated RSI into this script. The indicator will provide a BUY signal only when an engulfing candle prints and there is a reading of above 50 on the RSI, which is considered to reflect overall bullish sentiment. The signal is printed directly on the chart as a small green triangle just under the engulfing candle.
In contrast, the indicator will provide a SELL signal only when an engulfing candle prints and there is a reading of below 50 on the RSI, which is considered to reflect overall bearish sentiment. The signal is printed directly on the chart as a small red triangle just above the engulfing candle.
In order to maintain a clean chart and maximise the opportunity to couple this indicator up with other indicators that may increase the accuracy of the signals even further, the RSI will not be shown on the chart. However, to verify the accuracy of the signals please feel free to load the RSI indicator onto your chart and you will see that the signals only print according to the conditions described above.
In order to further filter out weaker signals I have made a rule that a buy signal should only print if it is above the 200 EMA and a sell signal only if the engulfing candle is below the 200 EMA. I use the 200 EMA because it is a commonly accepted indication of the general trend and to make the signals as accurate as possible we want to be trading with the longer trend, not against it.
The indicator will not print signals for engulfing candles outside of these parameters.
I suggest combining this indicator with a shorter moving average such as a 9, 14 or 20 perhaps. There is no need to add an additional indicator. You can do this directly in the settings menu. This unique feature allows you to study possible levels that price may or may not be respecting.
Alternatively, you could use the MACD to filter out some of the weaker signals, though bear in mind that the RSI is already doing that to some degree before the signal even prints.
To my knowledge there is no other indicator out there that combines these three concepts but, as you will see, doing so provides some high quality signals.

StatBox📊 StatBox: A Comprehensive Trading Indicator for RSI, Volume Percent, and ADD 📈💼
Introducing StatBox, the ultimate trading indicator designed to provide traders with a powerful analytical toolset for making informed trading decisions. With StatBox, you gain access to real-time data on Relative Strength Index (RSI), Volume Percent, and ADD (Advance/Decline Differential). This dynamic combination of indicators empowers you to navigate the market with greater precision and confidence. 📊🔍
Key Features of StatBox:
1️⃣ RSI (Relative Strength Index): RSI is a widely recognized momentum oscillator that measures the speed and change of price movements. StatBox displays RSI as a numerical value, ranging from 0 to 100, allowing you to quickly assess whether a security is overbought or oversold. This information is invaluable for identifying potential reversal points and optimizing entry or exit strategies.
2️⃣ Volume Percent: StatBox provides a visual representation of the Volume Percent, which reflects the relative trading volume compared to a specified period. By monitoring volume dynamics, you gain insights into market sentiment and potential price trends. A higher volume percentage often indicates stronger market participation, suggesting increased interest in a particular security.
3️⃣ ADD (Advance/Decline Differential): ADD is a breadth indicator that calculates the difference between advancing (upward moving) and declining (downward moving) securities. StatBox presents ADD as a histogram, enabling you to assess the overall strength or weakness of the market. Positive values indicate bullish sentiment, while negative values suggest bearish sentiment. By tracking ADD, you can identify potential market reversals or confirm existing trends.
With StatBox, you can:
✅ Quickly gauge the overbought or oversold conditions of a security using RSI.
✅ Monitor volume dynamics to assess market sentiment and potential price trends.
✅ Analyze the breadth of the market and identify bullish or bearish signals with ADD.
✅ Make well-informed trading decisions based on a comprehensive view of multiple indicators.
StatBox provides a user-friendly interface, allowing you to seamlessly integrate it into your preferred trading platform or charting software. Its intuitive design and real-time data updates ensure you have the most accurate and up-to-date information at your fingertips.
Upgrade your trading arsenal and unlock the potential of RSI, Volume Percent, and ADD with StatBox. Experience the power of multiple indicators in a single comprehensive tool. Download StatBox today and gain a competitive edge in the dynamic world of trading! 🚀📈

RSI+ by Wilson (alt)Extension of the excellent RSI+ script by Wilsonlibero. I tweaked the parameters to better fit crypto markets, and I added a few more visuals, such as midline, overbought/oversold threshold lines and areas, background coloration depending on RSI trend above or below midline, and a few other tweaks especially colors (fixed the transp parameter deprecation for example). The color theme is by default more optimized for dark mode charts, but all colors can be configured, and all drawings can be enabled/disabled/tweaked in the parameters.
I'm just giving back to the community since I could modify this script only because it was open-source. If you like this script, please don't give me any credit, but please show some love to the original author Wilsonlibero:

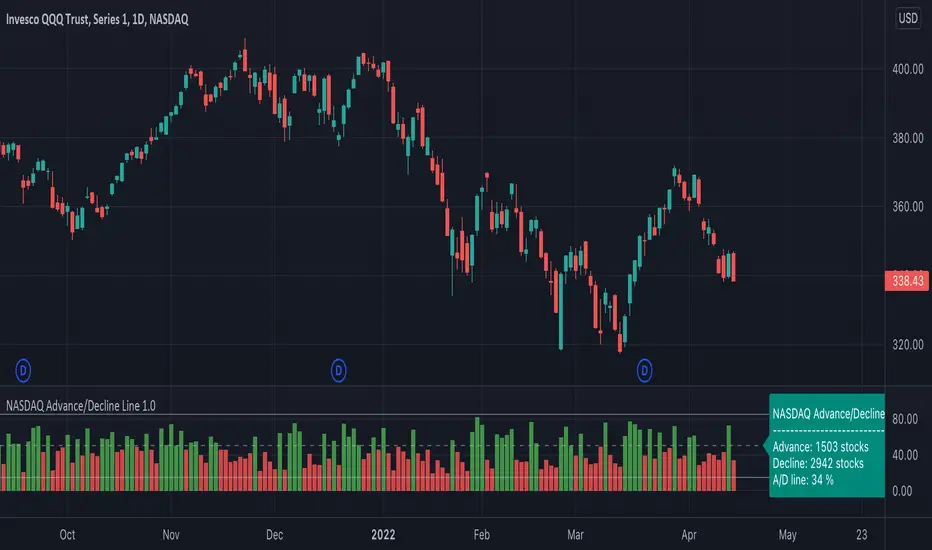
NASDAQ Advance/Decline Line 1.0NASDAQ Advance/Decline Line is a Market Breath indicator.
Brought to you by IQ-trading (Andrei Bogdan) via Trading View Pine script. If you find this helpful in anyway, please leave a like!
A/D line calculates a ratio between total number of NASDAQ stocks advancing and total number of NASDAQ stocks in one day, providing another way to grasp the market breath at any moment.A
Green columns mean more than 50% of NASDAQ stocks are advancing, red columns mean more than 50% of NASDAQ stocks are declining.
Green values above the top band mean correlation to the upside, red values bellow the low band mean correlation to the downside.
Correlation means rising probability of capitulation (to the upside or to the downside).
For a better interpretation, NASDAQ Advance/Decline Line should be used in conjunction with other indicators (volatility, volume, etc.).
--------------------
NASDAQ here refers to the totality of assets listed on the NASDAQ exchange, not to the Nasdaq Composite index or the Nasdaq100 index.
NASDAQ is the second-largest stock exchange on earth, and operates the two major stock indexes based on companies that trade on its exchange: the Nasdaq Composite and the Nasdaq 100.
The Nasdaq Composite tracks the performance of more than 3,000 stocks listed on the Nasdaq while the Nasdaq 100 captures the performance of the exchange’s largest non-financial companies.
RSI or %B of Bitfinex shorts /longs of main crypto trading pairsNormalized longs and shorts with %B or RSI of some crypto trading pairs listed below (longs and shorts data from Bitfinex). If you're not familiar with %B just use default setting and it will plot a RSI of the longs and shorts (screenshot is from %B). Obviously this should not be used as a single reason to take a trade but part of your analysis.
For some longs/shorts sentiment interpretation you can look at this:
cdn.discordapp.com
Available pairs (you can add some with very basic Pine Script knowledge but it will take more time loading):
BTCUSD
ETHUSD
ETHBTC
EOSBTC
LTCBTC
XRPBTC
BCHBTC
TRXBTC
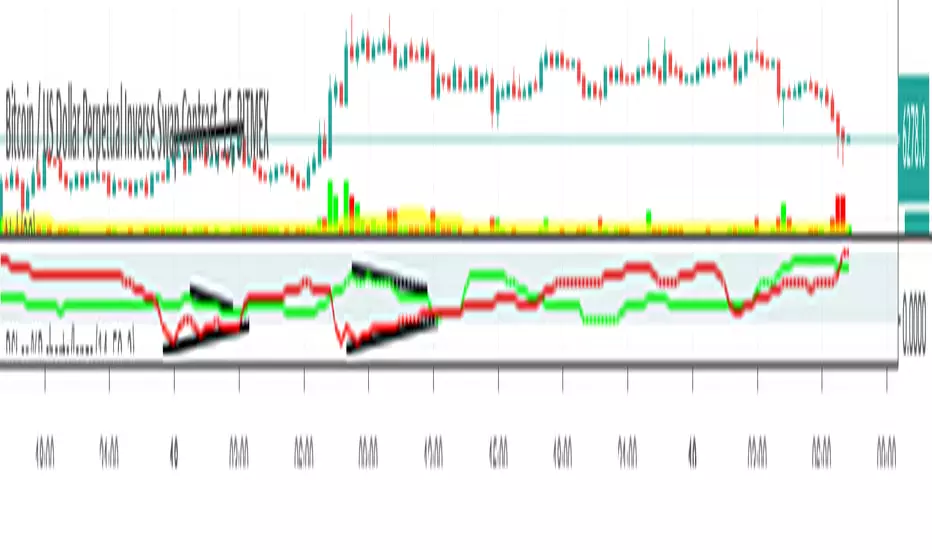
@WACC Volatility Weighted PUT/CALL Positions [SPX]This indicator is based on Volatility and Market Sentiment. When volatility is high, and market sentiment is positive, the indicator is in a low or 'buy state'. When volatility is low and market sentiment is poor, the indicator is high.
The indicator uses the VIX as it's volatility input.
The indicator uses the spread between the Call Volume on SPX/SPY and the Put Volume.
This is pulled from CVSPX and PVSPX.
When volatility and put/call reaches a critical level, such as the levels present in a crisis or a sell off, the line will be green. See Sept 2015, 2008, and Feb 2018.
This level can be edited in the source code.
As the indicator is based on Put/Call, the indicator works best on larger time frames as the put/call ratio becomes a more discernible measure of sentiment over time.
