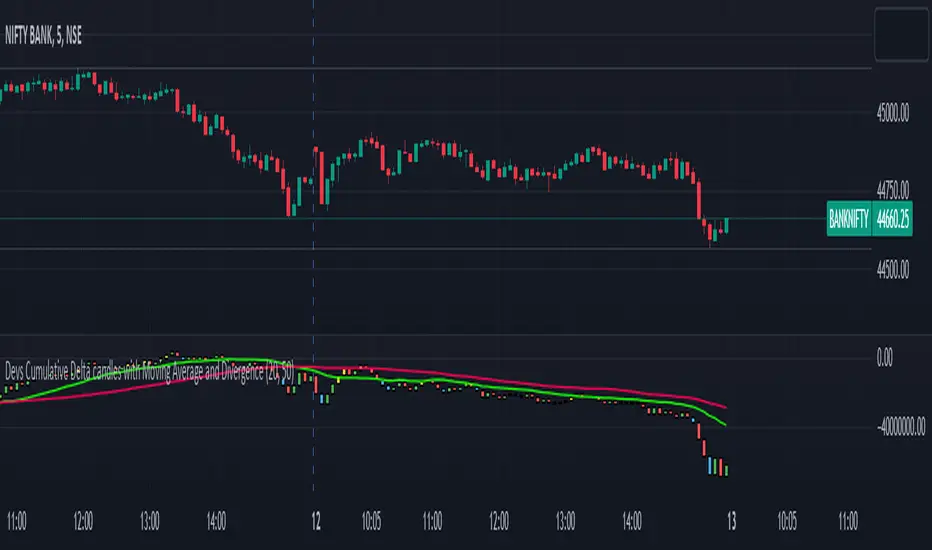
Devs Cumulative Delta candles with Moving Average and DivergenceDELTA = BUY Volume – SELL Volumes
Delta = Positive => Aggressiveness on the Buy side
Delta = Negative => Aggressiveness on the Sell side
If delta is greater than 0 you have more buying than selling pressure. If delta is less than 0, you have more selling than buying pressure.
When there is more Buying than Selling (Delta=Positive), the price candle is Green and when there is more Selling than Buying (Delta=Negative), the price candle is Red. We use delta to understand the relationship between buying or selling pressure and price.
Let’s imagine a price bar that reached the low for the day but delta was actually positive and the bar closed higher than it opened.
In simple terms we can describe this as:
Price made a new low
The bar closed higher
Delta demonstrated more buying than selling : Volume delta is a key metric to understand when making trading decisions based on volume and order flow. However, on its own it can be too much information to interpret quickly when trading in a volatile market.
What are Delta Bars?
Delta Bars is a candlestick representation of Delta. In other words, it has an Open, High (also called Delta Max), Low (also called Delta Min) and Close point in every candle (1min, 5min, 30min etc.)
The Delta Open in every candle is always 0
The Delta Close is the cumulative BUY less cumulative SELL at the close if the candle
The Delta Max is the maximum value of Delta during the candle session (lowest Delta Max possible = 0)
The Delta Min is the minimum value of Delta during the candle session (highest Delta Min possible = 0) The Delta bars are uncorrelated to the Tick Multiplier of the symbol.
Generally you would expect Price to move UP when Delta is positive and Price to move DOWN when Delta is negative. So what happens when the above rule is not followed. We have Divergence
Divergence:
Any two parameters that should be in sync (Price and Delta in this case) towards supporting a particular move (Up or Down) but are in reality not (in sync) form a Divergence
Cumulative volume delta takes the delta values for every bar and successively adds them together to visually provide as seen in the chart.
While volume delta is great for comparing delta bar to bar, cumulative volume delta is useful when determining buying or selling pressure at different price levels such as swing highs or lows. I just gave you a details regarding delta and delta bars.
What details would you see in the indicator??
When you apply this indicator on the chart, you will find the CD(Cumulative delta) candles, which move up and down the way price moves in a chart. Moreover, in case of a divergence, you will find a change in colour of delta candles. If the price is still green but the delta is negative, you will find a bullish divergence, marked with Yellow colour and if the price is red and you have a positive delta, you will have a bearish divergence, marked with blue coloured delta candle. Usually it has been seen that a repeated divergence generally depicts end of a trend or slow down of a trend.
Moreover, I have placed 2 moving averages in the script which you can customize as per your needs. I prefer 20 and 50 day MA for better accuracy as most reversals happen at 20 and 50 day MA.
This indicator works in almost all index, stocks, currencies excepting few where the volume past is invisible. This indicator purely works taking the buying and selling volume into consideration. Sometimes when you change the timeframe in chart, you may have to manually adjust for the display in chart.
Cerca negli script per "session high"
Traders_Reality_LibLibrary "Traders_Reality_Lib"
This library contains common elements used in Traders Reality scripts
calcPvsra(pvsraVolume, pvsraHigh, pvsraLow, pvsraClose, pvsraOpen, redVectorColor, greenVectorColor, violetVectorColor, blueVectorColor, darkGreyCandleColor, lightGrayCandleColor)
calculate the pvsra candle color and return the color as well as an alert if a vector candle has apperared.
Situation "Climax"
Bars with volume >= 200% of the average volume of the 10 previous chart TFs, or bars
where the product of candle spread x candle volume is >= the highest for the 10 previous
chart time TFs.
Default Colors: Bull bars are green and bear bars are red.
Situation "Volume Rising Above Average"
Bars with volume >= 150% of the average volume of the 10 previous chart TFs.
Default Colors: Bull bars are blue and bear are violet.
Parameters:
pvsraVolume : the instrument volume series (obtained from request.sequrity)
pvsraHigh : the instrument high series (obtained from request.sequrity)
pvsraLow : the instrument low series (obtained from request.sequrity)
pvsraClose : the instrument close series (obtained from request.sequrity)
pvsraOpen : the instrument open series (obtained from request.sequrity)
redVectorColor : red vector candle color
greenVectorColor : green vector candle color
violetVectorColor : violet/pink vector candle color
blueVectorColor : blue vector candle color
darkGreyCandleColor : regular volume candle down candle color - not a vector
lightGrayCandleColor : regular volume candle up candle color - not a vector
@return
adr(length, barsBack)
Parameters:
length : how many elements of the series to calculate on
barsBack : starting possition for the length calculation - current bar or some other value eg last bar
@return adr the adr for the specified lenght
adrHigh(adr, fromDo)
Calculate the ADR high given an ADR
Parameters:
adr : the adr
fromDo : boolean flag, if false calculate traditional adr from high low of today, if true calcualte from exchange midnight
@return adrHigh the position of the adr high in price
adrLow(adr, fromDo)
Parameters:
adr : the adr
fromDo : boolean flag, if false calculate traditional adr from high low of today, if true calcualte from exchange midnight
@return adrLow the position of the adr low in price
splitSessionString(sessXTime)
given a session in the format 0000-0100:23456 split out the hours and minutes
Parameters:
sessXTime : the session time string usually in the format 0000-0100:23456
@return
calcSessionStartEnd(sessXTime, gmt)
calculate the start and end timestamps of the session
Parameters:
sessXTime : the session time string usually in the format 0000-0100:23456
gmt : the gmt offset string usually in the format GMT+1 or GMT+2 etc
@return
drawOpenRange(sessXTime, sessXcol, showOrX, gmt)
draw open range for a session
Parameters:
sessXTime : session string in the format 0000-0100:23456
sessXcol : the color to be used for the opening range box shading
showOrX : boolean flag to toggle displaying the opening range
gmt : the gmt offset string usually in the format GMT+1 or GMT+2 etc
@return void
drawSessionHiLo(sessXTime, show_rectangleX, show_labelX, sessXcolLabel, sessXLabel, gmt, sessionLineStyle)
Parameters:
sessXTime : session string in the format 0000-0100:23456
show_rectangleX : show the session high and low lines
show_labelX : show the session label
sessXcolLabel : the color to be used for the hi/low lines and label
sessXLabel : the session label text
gmt : the gmt offset string usually in the format GMT+1 or GMT+2 etc
sessionLineStyle : the line stile for the session high low lines
@return void
calcDst()
calculate market session dst on/off flags
@return indicating if DST is on or off for a particular region
timestampPreviousDayOfWeek(previousDayOfWeek, hourOfDay, gmtOffset, oneWeekMillis)
Timestamp any of the 6 previous days in the week (such as last Wednesday at 21 hours GMT)
Parameters:
previousDayOfWeek : Monday or Satruday
hourOfDay : the hour of the day when psy calc is to start
gmtOffset : the gmt offset string usually in the format GMT+1 or GMT+2 etc
oneWeekMillis : the amount if time for a week in milliseconds
@return the timestamp of the psy level calculation start time
getdayOpen()
get the daily open - basically exchange midnight
@return the daily open value which is float price
newBar(res)
new_bar: check if we're on a new bar within the session in a given resolution
Parameters:
res : the desired resolution
@return true/false is a new bar for the session has started
toPips(val)
to_pips Convert value to pips
Parameters:
val : the value to convert to pips
@return the value in pips
rLabel(ry, rtext, rstyle, rcolor, valid, labelXOffset)
a function that draws a right aligned lable for a series during the current bar
Parameters:
ry : series float the y coordinate of the lable
rtext : the text of the label
rstyle : the style for the lable
rcolor : the color for the label
valid : a boolean flag that allows for turning on or off a lable
labelXOffset : how much to offset the label from the current position
rLabelOffset(ry, rtext, rstyle, rcolor, valid, labelXOffset)
a function that draws a right aligned lable for a series during the current bar
Parameters:
ry : series float the y coordinate of the lable
rtext : the text of the label
rstyle : the style for the lable
rcolor : the color for the label
valid : a boolean flag that allows for turning on or off a lable
labelXOffset : how much to offset the label from the current position
rLabelLastBar(ry, rtext, rstyle, rcolor, valid, labelXOffset)
a function that draws a right aligned lable for a series only on the last bar
Parameters:
ry : series float the y coordinate of the lable
rtext : the text of the label
rstyle : the style for the lable
rcolor : the color for the label
valid : a boolean flag that allows for turning on or off a lable
labelXOffset : how much to offset the label from the current position
drawLine(xSeries, res, tag, xColor, xStyle, xWidth, xExtend, isLabelValid, labelXOffset, validTimeFrame)
a function that draws a line and a label for a series
Parameters:
xSeries : series float the y coordinate of the line/label
res : the desired resolution controlling when a new line will start
tag : the text for the lable
xColor : the color for the label
xStyle : the style for the line
xWidth : the width of the line
xExtend : extend the line
isLabelValid : a boolean flag that allows for turning on or off a label
labelXOffset : how much to offset the label from the current position
validTimeFrame : a boolean flag that allows for turning on or off a line drawn
drawLineDO(xSeries, res, tag, xColor, xStyle, xWidth, xExtend, isLabelValid, labelXOffset, validTimeFrame)
a function that draws a line and a label for the daily open series
Parameters:
xSeries : series float the y coordinate of the line/label
res : the desired resolution controlling when a new line will start
tag : the text for the lable
xColor : the color for the label
xStyle : the style for the line
xWidth : the width of the line
xExtend : extend the line
isLabelValid : a boolean flag that allows for turning on or off a label
labelXOffset : how much to offset the label from the current position
validTimeFrame : a boolean flag that allows for turning on or off a line drawn
drawPivot(pivotLevel, res, tag, pivotColor, pivotLabelColor, pivotStyle, pivotWidth, pivotExtend, isLabelValid, validTimeFrame, levelStart, pivotLabelXOffset)
draw a pivot line - the line starts one day into the past
Parameters:
pivotLevel : series of the pivot point
res : the desired resolution
tag : the text to appear
pivotColor : the color of the line
pivotLabelColor : the color of the label
pivotStyle : the line style
pivotWidth : the line width
pivotExtend : extend the line
isLabelValid : boolean param allows to turn label on and off
validTimeFrame : only draw the line and label at a valid timeframe
levelStart : basically when to start drawing the levels
pivotLabelXOffset : how much to offset the label from its current postion
@return the pivot line series
getPvsraFlagByColor(pvsraColor, redVectorColor, greenVectorColor, violetVectorColor, blueVectorColor, lightGrayCandleColor)
convert the pvsra color to an internal code
Parameters:
pvsraColor : the calculated pvsra color
redVectorColor : the user defined red vector color
greenVectorColor : the user defined green vector color
violetVectorColor : the user defined violet vector color
blueVectorColor : the user defined blue vector color
lightGrayCandleColor : the user defined regular up candle color
@return pvsra internal code
updateZones(pvsra, direction, boxArr, maxlevels, pvsraHigh, pvsraLow, pvsraOpen, pvsraClose, transperancy, zoneupdatetype, zonecolor, zonetype, borderwidth, coloroverride, redVectorColor, greenVectorColor, violetVectorColor, blueVectorColor, lightGrayCandleColor)
a function that draws the unrecovered vector candle zones
Parameters:
pvsra : internal code
direction : above or below the current pa
boxArr : the array containing the boxes that need to be updated
maxlevels : the maximum number of boxes to draw
pvsraHigh : the pvsra high value series
pvsraLow : the pvsra low value series
pvsraOpen : the pvsra open value series
pvsraClose : the pvsra close value series
transperancy : the transparencfy of the vecor candle zones
zoneupdatetype : the zone update type
zonecolor : the zone color if overriden
zonetype : the zone type
borderwidth : the width of the border
coloroverride : if the color overriden
redVectorColor : the user defined red vector color
greenVectorColor : the user defined green vector color
violetVectorColor : the user defined violet vector color
blueVectorColor : the user defined blue vector color
lightGrayCandleColor : the user defined regular up candle color
cleanarr(arr)
clean an array from na values
Parameters:
arr : the array to clean
@return if the array was cleaned
calcPsyLevels(oneWeekMillis, showPsylevels, psyType, sydDST)
calculate the psy levels
4 hour res based on how mt4 does it
mt4 code
int Li_4 = iBarShift(NULL, PERIOD_H4, iTime(NULL, PERIOD_W1, Li_0)) - 2 - Offset;
ObjectCreate("PsychHi", OBJ_TREND, 0, Time , iHigh(NULL, PERIOD_H4, iHighest(NULL, PERIOD_H4, MODE_HIGH, 2, Li_4)), iTime(NULL, PERIOD_W1, 0), iHigh(NULL, PERIOD_H4,
iHighest(NULL, PERIOD_H4, MODE_HIGH, 2, Li_4)));
so basically because the session is 8 hours and we are looking at a 4 hour resolution we only need to take the highest high an lowest low of 2 bars
we use the gmt offset to adjust the 0000-0800 session to Sydney open which is at 2100 during dst and at 2200 otherwize. (dst - spring foward, fall back)
keep in mind sydney is in the souther hemisphere so dst is oposite of when london and new york go into dst
Parameters:
oneWeekMillis : a constant value
showPsylevels : should psy levels be calculated
psyType : the type of Psylevels - crypto or forex
sydDST : is Sydney in DST
@return

High & Low Of Custom SessionThis script boxes a custom session and sets the box at the high and low of the session and draws that box to the next session.
Box color is determined by price in relation to the box position. Box color is set at the start of the next session. This allows
user to lookback at multiple box sets to see how each day closed in relation to the session highlighted.
I have written this for backtesting purposes and intend to expand it to use with volume analysis and gradient color to change the box color based on how many times price tests
the box.
ICT Index Futures Vertical LinesLearning to trade is complicated enough, so to make the process it little less daunting, I decided to create something helpful.
This indicator relieves you of drawing the same lines and levels over and over each trading day.
It also provides key price levels for you to watch when the trading session starts.
This project is inspired by the ICT 2022 Mentorship.
This indicator was designed and tested to practice and trade the CME Index Futures like Nasdaq, S&P500 and the DOW.
The concepts by ICT are known to work on other markets like Crypto, but I haven't tested that so use at your own risk.
Features:
When a new trading day starts, the following lipstick is put on the chart:
Vertical lines:
- Globex (Overnight) Session Start @17.00
- New York Midnight @ 00:00
- New York AM Session Start @ 08.30
- CME Open @ 09.30
- New York Lunch Start @12.00
- New York PM Session Start @13.00
- New York PM Session End @ 16.30
Important levels:
- Globex (Overnight) Session Opening price
- Globex (Overnight) Session High
- Globex (Overnight) Session Low
- New York Mignight Opening Price
Additional features:
- Shows the day of the week at the bottom for your convenience
- London Killzone Vertical lines
- London Killzone Highlight
- NY Lunch No-Trade-Zone Highlight
- Important levels have a small label to show their meaning and price
- Almost everything is customizable: colors, line types, times, etc
- Customizable timezone setting in case you don't want to work on ICT's recommended timezone (New York UTC-4)
- Toggle to Show only Today's drawings on the chart. You can choose to display all chart lipstick from almost a month of trading data to do your research. Ideal if you want to determine the daily profiles for example.
Screenshots:
London Killzone Highlight turned on:
Multi Day Lipstick:

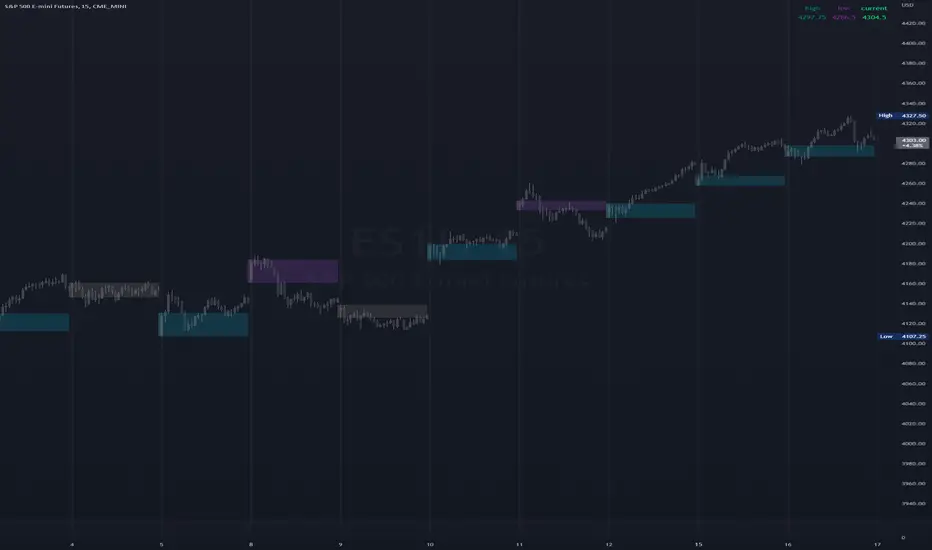
[DisDev] 12 Candle|Round#|Future SessionsThis indicator has many components; below, each component is explained and how it can be used as a trading tool.
1) Future Lines
a. Vertical lines are projected into the future to mark the beginning of each of the three major markets, Tokyo, London, and New York.
b. When major markets open, this can cause an increase in price action. So this component provides the trader with a reminder of when the next major market opens.
c. Also, the days of the week are displayed to allow the user to backtest price reaction for certain days of the week easily (e.g., Major Markets reopening after the weekend).
2) 12 Hour Candle Sessions High and Low
a. As price intersects with the beginning of the session, the vertical line disappears, and two corresponding horizontal lines begin. These horizontal lines dynamically adjust to mark each session's high and low, and a semi-transparent box fills the space between the high and low lines.
b. The duration of each session is a three-hour window, which each consists of 12 Fifteen-Minute Candles. This marks the hour prior to equity markets open, the opening hour, and the post-open hour.
c. The sessions highs and lows can be selected within the settings show for a 24 hour period. This assists the trader with session range breakouts; three examples of how this could be traded are below.
Example 1
d. The Tokyo and London session high kept the price action within a range. Once it broke the range, the Tokyo and London session highs were used as support, resulting in a range breakout.
Example 2
e. The below picture shows price action failing to break London Session Low and New York Session High; this is followed by Tokyo Low acting as resistance and price moving down 9%.
Example 3
f. Below price action with an increased volume of 323% (based on the average of the last 10 bar) fails to break the Tokyo High on the 1st attempt. The second attempt fails on 241% volume. The third attempt at 475% breaks the range, completing the range breakout seeing a move of 3.4% in price.
4) High of Day (HOD) and Low of Day (LOD)
a. As the trading day unfolds, we mark the HOD (d-High) and LOD (d-Low) with blue dotted horizontal lines. Then at the start of the next trading day, the former High and Low become the Previous Day High (pd-High) and Low (pd-Low) and are changed to dashes.
b. These high and low levels add extra confluence with the session high and lows for Swing Failure Patterns (SFP) and confirmation of trends.
5) Round Numbers
a. As humans, it's hard to use just any number to make sense of things. We prefer to use round numbers. This is important for trading as many traders will automatically use round numbers as their stop losses.
b. This indicator component reminds users of this fact and displays round numbers such as 00, 25, 50, and 75. The indicator automatically calculates and displays lines for the round numbers for as many as twelve levels above and below the current price.
c. Below are examples of how round numbers are broken to trigger stop losses; you may want to break the habit of using round numbers as your stop losses.
Below is the indicator in full swing, displaying all the elements described above.

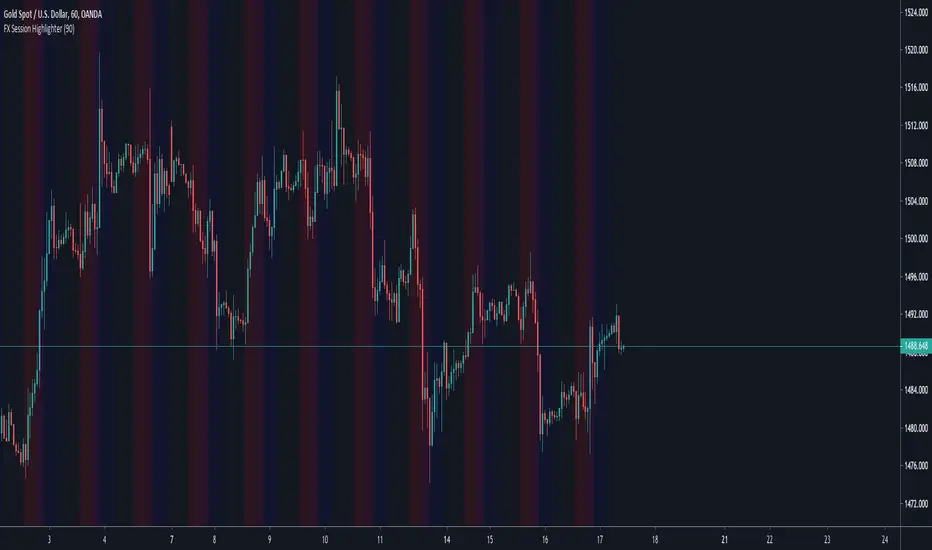
FX Session HighlighterThis indicator highlights forex market session for Sydney, Tokyo, London and New York .
1. Zone can be turned on and off.
2. Zone colour can be changed.
Default Colour
Sydney - Green
Tokyo - Yellow
London - Red
New York - Navy
ATR LinesDocumentation V0.1 (Beta)
ATR value will be defined using the last fully formed daily candle and 20 periods as a default value.
ATR lines will use current session's hourly bar highs and lows.
Upside ATR line = current session lowest low + ATR value
Downside ATR line = current session highest high - ATR value
Real time ATR lines update upon hourly bar close
Lines will be displayed both on the 1H and 4H time-frames
Inputs
During session you can chose 1 as value for "Hours back to show" effectively only displaying current ATR line instead of all previous lines, if you want to keep track of past lines just select the number of hours you'd like
When a market is closed, if you want to display the last lines just select the number of hours separating current time and the last hour of market session. For exemple if market closed on Friday 20.00 P.M and we are on Sunday 14.00 P.M use 42 hours value
Style
Lines use color 2 as main style, for exemple you can make upside line red and downside line green to mimic support and resistance settings
Color 0 and 1 will trigger if downside ATR goes above upside ATR and vice-versa
For full length lines just tick Price Line
Timezone
Forex brokers choose their own timezone, two of them on TradingView use New York time and two of them use UTC-0. Meaning that, depending on your own timezone and TradingViews settings, you could get confused while back-testing the script.
For example, FXCM use NY time (UTC -5). If you are from Brussels in Belgium (UTC +2) you could be under the impression that 7 hourly bar are from the previous day session. That is also what your X axis will display. However, if you use TradingView's official mutli-time period charts indicator (MTCP) you will be able to clearly identify your broker daily range.
Why is it important ? Because ATR lines script uses intraday hourly bar and reset everyday. If you do the math thinking an hourly bar should be excluded when in fact it should not, you'll end up with false positive.
For any question or bug report please use Discord Mugen#9114 or Twitter @MugenBTC

SmartManiacSmartManiac — Smart Money Liquidity & Sentiment Indicator
Overview
SmartManiac is a comprehensive Smart Money Concepts (SMC) indicator that combines liquidity structure analysis with volume delta sentiment detection. It automatically maps key liquidity levels, identifies Fair Value Gaps (FVGs) across multiple timeframes, and detects potential reversal points using a multi-factor scoring system based on volume delta, liquidations, and price action.
Features
Liquidity Structure Mapping
Previous Day/Week/Month High & Low (PDH/PDL, PWH/PWL, PMH/PML) — automatically detected and drawn with priority-based labeling
Buy-Side & Sell-Side Liquidity (BSL/SSL) — swing highs and lows that act as liquidity targets
Session High/Low — Asia, London, and New York session levels with customizable times
Smart level merging — nearby levels are consolidated using ATR-based tolerance to reduce clutter
Swept level tracking — lines change to dashed/dotted when price sweeps through them
Fair Value Gap (FVG) Zones
Multi-timeframe FVG detection: 5m, 15m, 1H, 4H, Daily, Weekly
Auto-filtering based on chart timeframe — prevents lower TF clutter on higher TF charts
Status tracking: Untouched → Touched → Half-filled → Fully filled
Sweep FVGs — special zones created when FVG forms immediately after a liquidity sweep
Sweep Imbalances
Detects FVGs that form right after liquidity sweeps
Shows pending zones in gray, changes to green (bullish setup) or red (bearish setup) when price returns to the zone
Helps identify potential reversal entries after stop hunts
Volume Delta & Sentiment Analysis
Aggregated volume from multiple exchanges for accurate delta calculation
Z-score based extreme detection for buying/selling pressure
Cumulative Volume Delta (CVD) tracking
Peak FOMO / Depression Signals
4-factor percentile scoring system:
Factor 1: Delta Z-score before reversal (buying/selling pressure buildup)
Factor 2: Volume spike + price reversal bar
Factor 3: Delta reversal confirmation
Factor 4: Liquidations spike (requires external data source)
Signals show as 🔥 (FOMO top) or 💎 (Depression bottom)
Size varies by strength (tiny = moderate, small = strong)
Requires prior price move + reversal bar confirmation to reduce false signals
Sweep Visualization Boxes
Visual representation of liquidations and delta at sweep points
Box length normalized by √(line_length) for fair comparison
Helps assess sweep "quality" — stronger sweeps may lead to stronger reversals
Sweep Confirmation Markers
After a sweep, watches for 3 confirmation factors within 5 bars:
Opposite candle color
Opposite-side liquidations
Opposite-side delta
Shows - marker when all 3 confirm
Risk State Background
Optional background coloring for Risk-Off (selling + long liqs) and Risk-On (buying + short liqs) states
Helps identify broader market sentiment regime
Debug Inspector
Moveable vertical line to inspect any bar's factor values
Useful for understanding why signals triggered or didn't trigger
How to Use
Liquidity Levels — Watch for price approaching PDH/PDL/PWH/PWL/PMH/PML and BSL/SSL levels. These are likely targets for stop hunts.
Sweep + FVG — After a sweep (level turns dashed), look for an FVG to form in the opposite direction. Gray sweep FVG turning green/red indicates potential entry zone.
Peak Signals — 🔥 appears at potential tops after strong rallies with extreme buying that reverses. 💎 appears at potential bottoms after drops with extreme selling that reverses. Hover over labels to see factor breakdown.
Confirmation Dots — Green - below price = bullish sweep confirmed. Red - above price = bearish sweep confirmed.
Settings
The indicator offers extensive customization:
Toggle each feature on/off independently
Customize colors and transparency for all elements
Adjust sensitivity thresholds for signals
Configure session times for your timezone
Set liquidations data source from external indicator
External Data
For Factor 4 (Liquidations), connect an external liquidations indicator:
Add a liquidations indicator to your chart (e.g., TradingView's native Liquidations indicator)
In SmartManiac settings, select the Long and Short liquidation plots as sources
Note: TradingView's native indicator has inverted labels — swap if needed
Notes
Best used on liquid markets with volume data (BTC, ETH, major forex pairs)
Higher timeframes (1H, 4H) tend to produce more reliable signals
Combine with your own analysis — no indicator is 100% accurate
Liquidations data significantly improves signal quality but is optional
Credits
Developed by @cybermediaboy, 2025. Methodology partially based on CryptoVolium's Smart Money approach.

TCR by AMAGADON TCR - THREE CANDLE RULES
The Methodology
TCR (Three Candle Rules) is a systematic confirmation indicator developed to solve the problem of "False Breakouts." Many traders lose capital by entering as soon as price touches a level; TCR eliminates this by enforcing a Two-Candle Validation rule.
The algorithm identifies a session-based range and requires price to "prove" its strength by holding outside that range for two consecutive candles before a signal is issued.
How the TCR Logic Works:
Zone Identification: The script anchors to the high and low of the session start (Asia, London, or NY).
Validation (The Rule):
For a BUY: Two consecutive M15 candles must both Open and Close entirely above the session high.
For a SELL: Two consecutive M15 candles must both Open and Close entirely below the session low.
The Trigger Box: Once validated, a Blue (Buy) or Red (Sell) box is drawn. The 50% (Midpoint) of the trigger candle becomes the high-probability entry zone.
STRICT FOREX RISK DISCLOSURE
⚠️ HIGH-RISK WARNING: Trading Foreign Exchange (Forex) involves a high level of risk and may not be suitable for all investors. The high degree of leverage can lead to the loss of your entire investment. Only trade with money you can afford to lose.
NO FINANCIAL ADVICE: TCR - THREE CANDLE RULES is a technical analysis tool for educational and informational purposes only. It does not constitute financial or investment advice.
LIMITATION OF LIABILITY:
No Accuracy Guarantees: Mathematical patterns do not guarantee future results.
Execution Risks: The author is not responsible for losses due to market volatility, news spikes, or broker slippage.
User Responsibility: By using this script, you acknowledge that all trading decisions are yours alone. The author is not liable for any financial damages

Malama's PRE-Market Box Overview
Malama's PM Box is a clean, professional pre-market range indicator that tracks the entire pre-market session (default 04:00–09:30 EST), draws a dynamic box during pre-market hours, and automatically extends clean high/low reference lines into the regular trading session. Upon breakout of these levels during regular hours, it optionally displays clear "BREAK" labels and fires alerts — making it ideal for day traders focusing on pre-market range breakouts.
Key Features
Dynamic Pre-Market Box: A real-time updating box that visually represents the developing pre-market high and low range, with customizable fill color, border, and transparency.
Extended Support & Resistance Lines: At the start of regular trading hours (09:30), the final pre-market high (resistance) and low (support) are locked in and extended as horizontal lines across the chart for the entire day.
Breakout Signals: Optional on-chart "BREAK" labels (green upward for bullish, red downward for bearish) when price closes beyond the pre-market high or low during regular hours.
Alerts: Built-in alert conditions for bullish breakouts (above PM high) and bearish breakdowns (below PM low).
Clean & Efficient Drawing: Uses Pine Script boxes and lines for smooth visuals and performance; lines extend automatically until the next trading day.
Major Differences & Improvements from the Older "Malama's KAYCAP Pre-Market Box"
The older script focused on isolating a single specific candle (default 4:00 AM) and plotting its body and wick levels separately. This new version represents a complete evolution into a full pre-market range tool with the following key upgrades:
Full Session Range vs. Single Candle:
Old: Captured only one user-defined minute/candle (e.g., exactly 4:00).
New: Tracks the entire pre-market session (default 04:00–09:30) and continuously updates the true session high/low.
Visual Presentation:
Old: Four separate plots (body top/bottom, high/low) with basic fill.
New: Single professional box with customizable fill/transparency/border during pre-market, plus clean extended horizontal lines after market open.
Extension & Persistence:
Old: Static plots that did not extend or update dynamically.
New: Lines automatically extend rightward throughout the regular session and reset cleanly each day.
Breakout Detection & Signaling:
Old: No breakout logic or alerts.
New: Detects true breakout/breakdown candles during regular hours, with optional visual labels and dedicated alert conditions.
User Experience:
Old: Required manual configuration of exact minute and separate pre-market session inputs (unused in logic).
New: Simplified session input using TradingView's built-in session string, fewer inputs overall, and more intuitive grouping.
In essence, the older version was a niche tool for analyzing one specific pre-market candle's structure, while PM Box (Visual Pro) is a modern, practical day-trading utility focused on the classic pre-market high/low range strategy with superior visuals, automation, and breakout signaling.
How to Use
Apply to 1-minute or 5-minute charts on US stocks or indices with pre-market data.
Default session (04:00–09:30) captures standard US pre-market; adjust if your broker uses a different timezone.
Watch the box develop live during pre-market.
Once regular hours begin, use the extended high (resistance) and low (support) lines as key levels.
Trade breakouts/breakdowns when price closes beyond these lines (confirmed by labels and alerts).
Combine with volume, trend filters, or other confluence for higher-probability setups.
Disclaimer
This indicator is for educational and informational purposes only. It is not financial advice. Past performance does not guarantee future results. Always use proper risk management and combine with your own analysis. Trading involves substantial risk of loss.

Market Session Terrain Monitor vs 1.0 (UTC)Summary
Market Session Terrain Monitor helps traders understand where the market is within its normal intraday behavior, not where it should go. It is a decision-support tool designed to reduce late entries, over-trading, and narrative bias by grounding intraday analysis in historical session statistics.
Purpose
Market Session Terrain Monitor provides statistical context for intraday market movement by analyzing how much each major trading session typically moves, how much it has moved so far, and what market state the current session inherits from previous sessions.
The indicator is designed to answer one core question:
Is the current session early, normal, or already expanded relative to its historical behavior?
This indicator does not predict direction and does not generate buy or sell signals. It is intended as a context and state-awareness tool to support independent, structure-based decision making.
Sessions Analyzed
The trading day is divided into three independent sessions, defined in UTC time:
• Asia
• London
• New York
Each session is analyzed separately using its own historical data. No session is assumed to control or predict the behavior of another.
Session Range
For each session, the indicator measures the session range, defined as the session high minus the session low. This captures how much the market actually moved during that session, regardless of direction.
P90 Expansion Benchmark
For each session, the indicator calculates a P90 expansion benchmark.
• P90 represents the range that only about ten percent of historical sessions exceed
• It reflects a large but repeatable expansion, not an extreme outlier
• It is used as a normalization reference so sessions with different volatility characteristics can be compared on equal terms
The P90 values are displayed in the table header in price units, such as USD, as a reference for scale.
Percent of P90
Current and previous session ranges are expressed as a percentage of that session’s own P90.
This shows:
• How much of a statistically large session has already been used
• Whether the session is still early, behaving normally, or approaching expansion
Rolling Comparative Table
The table displays three rows, ordered by time and anchored to the current active session:
• Current · Session
• Previous · Session
• Previous-2 · Session
Each row shows:
• Session name
• Session range in price units
• Session range as a percentage of that session’s P90
This rolling layout provides context about the market state inherited by the current session without implying causality.
How to Use the Indicator
The indicator helps with:
• Identifying whether a session is early or late in its statistical range
• Avoiding entries when a session is already stretched
• Recognizing compression versus expansion regimes
• Understanding the market state the current session inherits
The indicator does not:
• Predict direction
• Forecast highs or lows
• Assume that one session determines the next
Directional decisions should come from price structure, execution rules, and risk management.
Design Philosophy
• Range first, direction second
• State awareness over narrative
• Statistical normalization instead of absolute numbers
• Comparative, not predictive
The indicator intentionally avoids estimating remaining range or subtracting previous session movement, as those approaches introduce bias and false causality.
Suitable Markets
• Gold and silver
• Forex pairs
• Indices
• Other liquid instruments with clear session behavior

Market Session Terrain Monitor v1.0Summary
Market Session Terrain Monitor helps traders understand where the market is within its normal intraday behavior, not where it should go. It is a decision-support tool designed to reduce late entries, over-trading, and narrative bias by grounding intraday analysis in historical session statistics.
Purpose
Market Session Terrain Monitor provides statistical context for intraday market movement by analyzing how much each major trading session typically moves, how much it has moved so far, and what market state the current session inherits from previous sessions.
The indicator is designed to answer one core question:
Is the current session early, normal, or already expanded relative to its historical behavior?
This indicator does not predict direction and does not generate buy or sell signals. It is intended as a context and state-awareness tool to support independent, structure-based decision making.
Sessions Analyzed
The trading day is divided into three independent sessions, defined in UTC time:
• Asia
• London
• New York
Each session is analyzed separately using its own historical data. No session is assumed to control or predict the behavior of another.
Session Range
For each session, the indicator measures the session range, defined as the session high minus the session low. This captures how much the market actually moved during that session, regardless of direction.
P90 Expansion Benchmark
For each session, the indicator calculates a P90 expansion benchmark.
• P90 represents the range that only about ten percent of historical sessions exceed
• It reflects a large but repeatable expansion, not an extreme outlier
• It is used as a normalization reference so sessions with different volatility characteristics can be compared on equal terms
The P90 values are displayed in the table header in price units, such as USD, as a reference for scale.
Percent of P90
Current and previous session ranges are expressed as a percentage of that session’s own P90.
This shows:
• How much of a statistically large session has already been used
• Whether the session is still early, behaving normally, or approaching expansion
Rolling Comparative Table
The table displays three rows, ordered by time and anchored to the current active session:
• Current · Session
• Previous · Session
• Previous-2 · Session
Each row shows:
• Session name
• Session range in price units
• Session range as a percentage of that session’s P90
This rolling layout provides context about the market state inherited by the current session without implying causality.
How to Use the Indicator
The indicator helps with:
• Identifying whether a session is early or late in its statistical range
• Avoiding entries when a session is already stretched
• Recognizing compression versus expansion regimes
• Understanding the market state the current session inherits
The indicator does not:
• Predict direction
• Forecast highs or lows
• Assume that one session determines the next
Directional decisions should come from price structure, execution rules, and risk management.
Design Philosophy
• Range first, direction second
• State awareness over narrative
• Statistical normalization instead of absolute numbers
• Comparative, not predictive
The indicator intentionally avoids estimating remaining range or subtracting previous session movement, as those approaches introduce bias and false causality.
Suitable Markets
• Gold and silver
• Forex pairs
• Indices
• Other liquid instruments with clear session behavior

J Trap CandleJ Trap identifies Failed-2 inducement candles where price briefly takes liquidity (higher high or lower low) and immediately reverses, signaling a potential trap and short-term reversal.
These candles are best used at key levels (prior highs/lows, session highs/lows, Fib 61.8–88.6) and in alignment with higher-timeframe bias, especially during active sessions (London or NY) where liquidity is present.

Session Levels + PDH/PDL (Adjustable, v6 fixed) 📊 Session Levels + PDH/PDL (Adjustable)
This indicator plots key intraday reference levels based on major market sessions and the previous day’s range. It is designed for traders who rely on session highs/lows, liquidity levels, and market structure rather than indicators like EMAs or oscillators.
🔹 What it shows
Asia Session High & Low
UK (London) Session High & Low
New York Session High & Low
Previous Day High (PDH) & Previous Day Low (PDL)
Each level is drawn as a horizontal line and can optionally include a label for quick identification.
⚙️ Fully adjustable
Session times for Asia, UK, and New York are fully editable
Custom colors for each session and PDH/PDL
Show / hide toggles for each session individually
Adjustable line width and right-side extension
Optional session background shading with adjustable transparency
Optional labels for all levels
🕒 Timezone handling
Uses a user-defined timezone (default: Europe/Dublin)
Works on any intraday timeframe
Session logic is replay-safe and does not repaint past levels
🎯 How traders typically use it
Identify liquidity pools at session highs/lows
Use PDH/PDL as targets, reactions, or bias levels
Combine with price action, market structure, ORBs, or ICT-style models
Mark London and NY expansions after Asia range is set
✅ Designed for
Futures traders (ES, NQ, YM, Gold)
Forex and indices
Intraday & session-based strategies
Traders who want clean charts with meaningful levels only

Session Killzone & Liquidity Sweep Engine [2025]A session-based market analysis tool designed to visualize key intraday trading sessions and monitor price interaction with session highs and lows.
The script draws configurable session ranges (Asia, London, New York AM, Lunch, and PM) using session-based boxes. For each session, the high and low levels are calculated in real time and projected forward as reference levels.
Each session high and low reacts dynamically to price behavior:
• If price wicks beyond a session level without a candle close beyond it, the level is marked as a liquidity sweep and stops extending.
• If price closes beyond a session level, the level is considered invalidated and removed.
Optional midpoint levels can be displayed for each session. Users can choose whether levels extend only until mitigation or continue beyond it, as well as whether only the most recent session or all past sessions are tracked.
Additional features include:
• Timezone support with proper session alignment
• Session drawing limits to manage chart clutter
• Timeframe filtering to restrict drawings to lower timeframes
• Optional alerts when session highs or lows are broken by a candle close
• Extensive customization for colors, line styles, labels, and visibility
This tool is intended for traders who analyze intraday price behavior around session highs and lows and want a structured way to observe wick-based interactions and level invalidations.

VX-Session-Boxes-(AM/PM Split)(Customizable) by Ikaru-s-VX-Session-Boxes-(AM/PM Split) is a session-based visualization tool for TradingView that highlights major market sessions directly on the chart using dotted range boxes and an optional AM/PM split.
The indicator allows traders to visually separate market behavior across different sessions while keeping the chart clean and readable.
🔹 Key Features
Custom Session Definitions
Define up to 4 independent sessions using TradingView’s session format (HHMM-HHMM + weekdays).
Timezone-Aware
All sessions are calculated using a user-defined timezone (IANA or UTC offset), ensuring accurate session alignment across markets.
Dotted Session Boxes
Each session is drawn as a dotted box based on the session’s high/low range, providing a clear view of volatility and price structure.
AM / PM Split Visualization
Sessions can be visually split into AM and PM parts:
Separate box shading for AM and PM
Optional dotted vertical split line at the AM → PM transition (12:00 in the selected timezone)
Session Labels
Optional labels at the start of each session for quick identification (e.g. Sydney, Tokyo, London, New York).
Fully Customizable Visuals
Adjustable opacity, border width, and visibility toggles for boxes, split lines, and labels.
🔹 Use Cases
Session-based market analysis (Asia / London / New York)
Identifying session ranges and volatility expansion
Observing price behavior differences between AM and PM
Studying session transitions and liquidity shifts
🔹 Notes
Session boxes are based on session high and low, not full chart height.
AM/PM split is based on 12:00 (noon) in the selected timezone.
Designed for clarity and performance on intraday timeframes.
🔹 Compatibility
Pine Script® v6
Works on all intraday timeframes
Overlay indicator (draws directly on the price chart)

KIMATIX FVG/IFVG/BPRProfessional Fair Value Gap & Imbalance Toolkit
The KIMATIX FVG/IFVG/BPR indicator is a precision tool designed to identify institutional inefficiencies in price:
Fair Value Gaps (FVG), Inverse Fair Value Gaps (IFVG) and Balanced Price Ranges (BPR) — clean, minimal and non-repainting.
This indicator is built for scalpers, intraday traders and smart-money traders who want to trade where price is most likely to react, not where indicators lag.
What this indicator shows
Fair Value Gaps (FVG)
Detects bullish and bearish FVGs using strict 3-candle imbalance logic
Highlights areas where price moved too fast, leaving inefficient structure
Ideal for:
Continuation trades
Pullback entries
Reaction zones after impulse moves
Color-coded
🟢 Bullish FVG
🔴 Bearish FVG
Inverse Fair Value Gaps (IFVG)
Automatically detects when an FVG is invalidated
Marks the same zone as an Inverse FVG
Extremely useful for:
Failed structure setups
Reversal trades
Stop-hunt & liquidity traps
Color-coded
🟡 IFVG (invalidation zone)
Balanced Price Range (BPR)
Detects overlapping bullish & bearish FVGs
Highlights price areas where buying and selling pressure are balanced
These zones often act as:
High-probability reaction areas
Compression zones before expansion
Premium intraday decision levels
Color-coded
🔵 BPR (balanced price range)
Smart, Clean & Non-Repainting
Non-repainting
Only the last 3 active zones are shown → no clutter
Boxes extend forward with a manual cap (user-controlled)
Designed for 1m – 15m execution, works on all markets
Futures, Crypto, FX, Indices, Stocks
How professionals use it
Combine FVGs with:
VWAP
Session highs/lows
Volume Profile (POC / VAH / VAL)
Market structure (BOS / displacement)
Use IFVGs to spot failed smart-money narratives
Use BPRs as decision zones, not blind entries
This indicator does not give buy/sell signals.
It shows you where trades make sense — execution is up to you.
Best use cases
Scalping (1m–3m)
Intraday trading (5m–15m)
Smart-money concepts
Liquidity-based trading
News reactions & stop runs
Learn how to trade it properly
This indicator is part of the KIMATIX Trading Framework.
More education, live examples & full system:
kimatixtrading.com

CK: Locked Session H/L + Volume Profile (1m Fixed)The session roadmap every futures trader needs — without the clutter.
This tool automatically locks the previous session’s structure and gives you the five most important institutional levels:
✅ Locked Session High
✅ Locked Session Low
✅ Session POC (Point of Control)
✅ VAH – Value Area High
✅ VAL – Value Area Low
Everything is calculated using 1-minute data only, so your levels are accurate, consistent, and never repaint.
💡 What It Does
Tracks the entire session from the RTH close to the next RTH close.
Builds a volume-by-price profile for that session.
Automatically freezes the session’s:
Highest price
Lowest price
Most-traded price (POC)
70% value area (VAH/VAL)
Plots all levels as clean horizontal lines for today’s trading.
🚀 Why Traders Use This
These 5 levels control most algorithmic and institutional activity.
This indicator shows you exactly where price reacted yesterday, so you can:
Catch retests and bounces with confidence
Avoid trading in the middle of nowhere
Anticipate reversals, breakouts, and liquidity grabs
Build a consistent plan around the same fixed levels every day

OHLC ProjectionsOHLC Projections is an advanced analytical tool designed to forecast potential price ranges for the current session (Daily or Weekly) based on historical data. The indicator utilizes a statistical analysis of price behavior relative to the Open, calculating average values for "Manipulation" (movement against the closing direction) and "Distribution" (the main expansion in the closing direction).
Unlike standard moving averages, this tool creates a "roadmap" for the developing candle, helping traders identify potential session highs and lows before they form.
How It Works
The algorithm analyzes a user-defined lookback period (e.g., 60 candles) and calculates:
Manipulation (M): The average length of the wick formed opposite to the candle's closing direction (e.g., the bottom wick of a bullish candle).
Distribution (D): The average distance from the Open to the extreme point in the direction of the close.
Based on these metrics, the following levels are projected:
Open Line: The opening price of the period (Always Solid).
Manipulation Levels (+M / -M): The statistical range where price often "traps" traders before the true move begins. These are often ideal reversal points (Smart Money Reversal).
Distribution Levels (+D / -D): The statistical target (Take Profit) that price tends to reach after the manipulation phase is complete.
Key Features
Anchored Levels (Non-Repainting): Levels are calculated once at the start of a new session (e.g., at Midnight) and remain fixed throughout the day. They do not "float" or repaint with current price action.
History Management: A unique "Limit history to current day" feature keeps your chart clean. When enabled, the indicator automatically removes lines from previous days, leaving only the projections relevant to the current active session.
NY Midnight Support: Option to anchor daily calculations specifically to the New York Midnight Open (essential for ICT/SMC traders).
Dual Timeframe: Ability to display projections for two timeframes simultaneously (e.g., Daily and Weekly) on lower timeframe charts.
"Areas" Mode: Option to display zones (Boxes) instead of lines, based on two different lookback periods (short and long), allowing for the visualization of statistical confluence.
Premium/Discount Zones: Optional shading of zones above and below the opening price to easily identify expensive (Premium) and cheap (Discount) price areas.
Configuration & Visuals
The indicator is fully customizable:
Lookback Period: Adjust the number of historical candles used for the average calculation.
Visual Style: Full control over line colors and styles. The Open Line is always forced to Solid for easy distinction, while other levels can be set to dotted or dashed.
Statistics Table: An optional dashboard displaying the specific price values for all calculated levels.
Strategy Application
This tool is highly effective for Smart Money Concepts (SMC) and Inner Circle Trader (ICT) strategies.
Look for Short opportunities when price extends above the Open and hits the -M or +D levels.
Look for Long opportunities when price drops below the Open and tests the +M or -D levels.
Alerts
Built-in alerts allow you to be notified immediately when price crosses key Manipulation or Distribution levels, ensuring you never miss a reaction point.

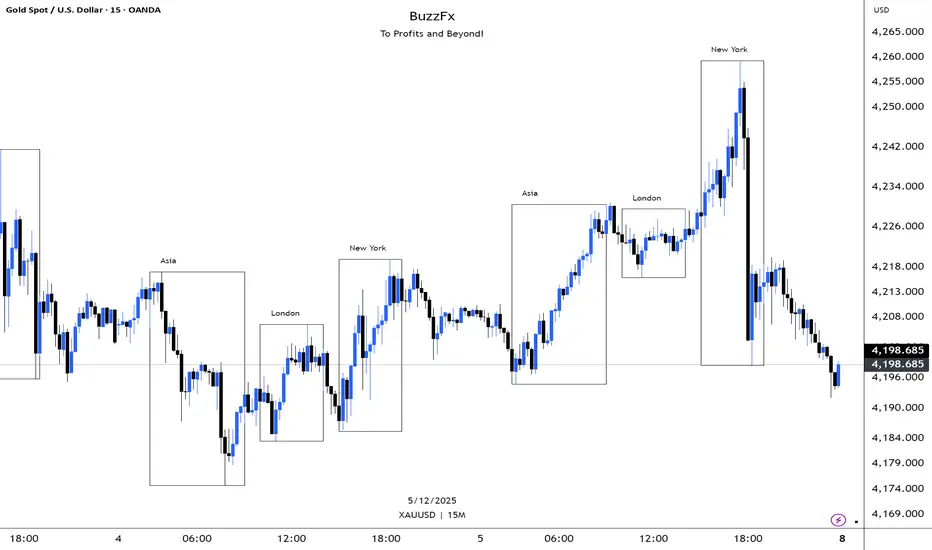
BuzzFx Market SessionsBuzzFx Market Sessions is a clean and powerful tool that highlights the most important trading sessions directly on your chart.
It automatically marks:
London Session
New York Session
Asian Session
Pre-New York
Session highs & lows (optional)
Session ranges & volatility zones
This indicator helps traders instantly understand:
When major liquidity enters the market
When volatility typically increases
How price reacts inside each session
Which session is driving the current trend
Designed for both beginners and advanced traders, BuzzFx Market Sessions gives you a clearer view of market structure and timing—so you can trade smarter, not harder.
Perfect for day traders, scalpers, and SMC traders who rely on timing, volatility, and session behavior.
Sessions Pro+ (@JP7FX)Sessions Pro Plus (JP7FX)
Sessions Pro Plus marks key trading sessions and gives real time session information. It helps traders track session behaviour without manual work.
Session Info Panel
Shows live updates for Tokyo, Frankfurt, London and New York.
Displays if session highs or lows are intact or taken.
Includes a countdown to the next session start.
Range High and Low Alerts
Alerts trigger when a session high or low is breached.
Useful for monitoring breaks, sweeps and changes in behaviour.
Daily Open Bias
Shows whether price is above or below the daily open.
Helps traders understand directional conditions quickly.
Custom Session Settings
Session times can be adjusted to fit personal trading hours.
Sessions can be renamed and recoloured for clarity.
Webhook and Real Time Alerts
Alerts support webhook integrations for external platforms, including Discord.
Countdown Timers
Displays countdowns to the next session open to help plan ahead.
This indicator is designed for traders who follow session timing, session highs and lows, and daily open behaviour. It aims to simplify chart preparation and reduce the need to track session information manually.

Prime-Time × Vortex (3/6/9) — Ace (clean v3)1️⃣ Prime-Time Index (PT)
A bar becomes Prime-Time when the count satisfies the formula:
4·n − 3 is a perfect square
This generates the sequence:
1, 3, 7, 13, 21, 31, 43, 57, 73, 91, …
These are time windows where price is more likely to form:
Shifts in market structure
Impulses
Reversals
Liquidity expansions
These PT bars are drawn as small circles above the candle.
If labels are enabled, the counter value (n) is also shown.
2️⃣ Vortex 3/6/9 Digital-Root Timing
Every bar also has a digital root, calculated from the counter:
If n → digitalRoot(n) = 3, 6, or 9,
the bar is considered a Vortex bar.
These moments often align with:
Swing highs / swing lows
Micro shifts
Mini-reversals
Minor liquidity grabs
When a Prime-Time bar is also a 3/6/9 bar → high-probability timing.
These bars are highlighted in green by default.
3️⃣ Filters & Display
You can customize:
Anchor time → when counting begins
Reset daily → restart counter each new trading day
Show only 3/6/9 → hides normal PT hits
Label offset → distance above the candle
Color themes
This makes the indicator usable on:
1Min
5Min
15Min
1H
Any timeframe you want
4️⃣ How To Apply It in Trading
Use it as a time confluence tool, not a signal generator.
✔ Best ways to use:
Look for MSS, sweeps, OB retests, FVG reactions when
they occur on or near a Prime-Time or 3/6/9 bar
Expect volatility increases after PT bars
Use 3/6/9 hits to anticipate internal turning points
Combine with:
Session High/Low
Killzones (London, NYO, PM)
Purge Protocol
MMXM Execution
✔ Example:
If price sweeps a level and prints a 3/6/9 vortex bar inside a PT window →
you have a very strong timing alignment for reversal.
5️⃣ Simple Summary
Feature Meaning
Prime-Time Hit (PT) Major time window where price often shifts
3/6/9 Vortex Bar Micro-timing for internal swings
PT + 3/6/9 together High-probability timing for entries
Reset Daily Perfect for intraday models like NYO & London
Anchor Time Defines the entire cycle structure

FPT - Key Levels with VWAP🔶 FPT – Key Levels with VWAP
This indicator combines multi-session VWAP, higher-timeframe key levels, market structure (HH/HL/LH/LL), and liquidity zones into one clean intraday tool.
Designed for scalping, day-trading, and session-based strategies such as Asia → London → New York flows.
🔵 Features
1. Multi-Session VWAP
Asia VWAP
London VWAP
New York VWAP
Daily reset
Optional deviations & clean mode
2. Key Levels (HTF SR Zones)
Automatically detects:
Previous Day High / Low
4H / 1H Key Levels
Session High / Low
Midpoints
Equal Highs & Equal Lows (liquidity lines)
3. Market Structure Engine
Swing points (HH, HL, LH, LL)
Break of Structure (BOS)
Market Structure Shift (MSS)
Optional minimal mode showing only breaks
4. Liquidity Tools
Buyside & sellside liquidity zones
Range high / low liquidity
Optional void / imbalance zones
5. Clean Visualization Mode
Removes unnecessary text
Shows only the essential levels
Perfect for chart posting or backtesting
🟩 Use Cases
Intraday key level mapping
VWAP deviation → mean reversion setups
Liquidity sweep → BOS/MSS setups
Session volatility filtering
Scalping and fast execution planning
⚠️ Disclaimer
This script does not provide financial advice.
It is for educational and analytical purposes only.
All trading decisions are solely your responsibility.
