Session ATR Progression Tracker📊 Session ATR Progression Tracker - SIYL Regression Trading Tool
Track how much of your instrument's 7-day Average True Range (ATR) has been covered during the current trading session. This indicator is specifically designed for regression traders who follow the "Stay In Your Lane" (SIYL) methodology, helping you identify when the probability of mean reversion significantly increases. If you are interested in more on that check out Rod Casselli and tradersdevgroup.com.
🎯 Key Features:
• Real-time ATR Coverage Percentage - See at a glance what percentage of the 7-day ATR has been covered in the current session
• SIYL-Optimized Thresholds - See at a glance when the instrument has achieved 80% and 100% ATR coverage, the proven thresholds where mean reversion probability increases (customizable)
• Flexible Session Modes:
- Daily: Resets at calendar day change
- Session: Uses exchange-defined trading sessions
- Custom Session: Set your exact session start/end times (perfect for futures traders and international markets)
• Visual Alerts - Color-coded display (gray → orange → red) and optional background highlighting
• Repositionable Display - Choose from 9 screen positions to avoid chart clutter
• Session Markers - Green triangles mark the start of each new session
• Detailed Stats - View current range, ATR value, session high/low, and session status
💡 Why Use This Indicator?
This tool is built around a proven concept: regression trading becomes significantly more effective once a session has achieved at least 80% of its 7-day ATR. At this threshold, the probability of price reverting to mean increases substantially, creating higher-probability trade setups for SIYL practitioners.
Benefits for regression traders:
- Identify optimal entry points when mean reversion probability is highest (≥80% ATR coverage)
- Avoid premature regression entries before adequate range has been established
- Recognize when daily moves have "earned their range" and are ripe for reversal
- Time fade-the-move and counter-trend strategies with statistical backing
- Improve win rates by trading only after proven probability thresholds are met
⚙️ Setup Instructions:
1. Add the indicator to your chart
2. Select your preferred "Reset Mode" (recommend "Custom Session" for futures/international markets)
3. If using Custom Session, enter your session times in 24-hour format (e.g., 0930-1600 for US stocks, 1700-1600 for CME futures)
4. Adjust alert thresholds if desired (default: 80% and 100% - proven SIYL thresholds)
5. Position the display where it's most visible on your chart
📈 Works Across All Markets:
Stocks • Futures • Forex • Indices • Crypto • Commodities
Perfect for regression traders, mean reversion specialists, and SIYL practitioners who want to trade with probability on their side by entering only after the session has "earned its range."
---
Tip: For futures contracts with overnight sessions that span calendar days (like MES, MNQ, MYM), use "Custom Session" mode with your exchange's official session times for accurate tracking.
Cerca negli script per "session high"

MP SESSIONS, DST, OTTHere’s a clear description you can use for this script (for yourself or as a TradingView “Indicator Description”):
---
### MP SESSIONS, DST, OTT – What this indicator does
This script is a **multi-session market timing tool** that:
1. **Draws full trading sessions on the chart** (Asia, Sydney, Tokyo, Shanghai, Europe, London, New York, NYSE)
2. **Automatically adjusts for Daylight Saving Time (DST)** for Sydney, London, and New York
3. **Shows a live info table** with session times, DST status, and whether each session is currently open or closed
4. **Adds optional custom “OTT” vertical lines** at user-defined intraday times (for your own models, killzones, or time blocks)
---
### Main Features (high level)
#### 1. Market mode & time zone handling
* **Market Mode**:
* `Forex`
* `Stock`
* `User Custom` (you type your own session ranges)
* `TFlab suggestion` (predefined “optimized” session times)
* **Time Zone Mode**:
* `UTC`
* `Session Local Time` (local exchange time: Sydney, Tokyo, London, New York etc.)
* `Your Time Zone` (converts to the user-selected TZ, e.g. `UTC-4:00`)
* Handles separate time zones for:
* Asia, Sydney, Tokyo, Shanghai, Europe, London, New York, NYSE
* Has logic to **recalculate session start/end depending on DST** and the chosen mode.
---
#### 2. Daylight Saving Time (DST) engine
The function `DST_Detector`:
* Calculates when DST **starts and ends** for:
* `Australia/Sydney`
* `Europe/London`
* `America/New_York`
* Detects the correct Sunday (2nd, 4th, etc.) for start/end using day-of-week and week counts.
* Returns `'Active'` or `'Inactive'` for each region.
* These values are then used to **shift the sessions** (e.g. New York 13:00–21:00 vs 12:00–20:00 in UTC).
The script can also **draw vertical lines** on the chart when DST starts/ends and label them:
* “Sydney DST Started / Ended”
* “London DST Started / Ended”
* “New York DST Started / Ended”
---
#### 3. Session timing & sessions on the chart
The function `Market_TimeZone_Calculator`:
* Based on **Market Mode** + **Time Zone Mode** + **DST state**, it returns:
* Time ranges for: Sydney, Tokyo, Shanghai, Asia (combined), Europe, London, New York, NYSE
* These ranges are in `"HHMM-HHMM"` format.
Then the script:
* Converts these to `time()` conditions using the proper time zone
* Creates boolean series like `On_sesAsia`, `On_sesEurope`, `On_sesNewYork`, etc., which are **1 when the session is open and 0 when closed**.
---
#### 4. Session high/low boxes & labels
The function `LowHighSessionDetector`:
* Tracks **high and low of each session** while it’s active.
* When a new session starts:
* Resets and starts recording the session high/low.
* While session is active:
* Updates `High` with the max of current bar high and previous session high.
* Updates `Low` with the min of current bar low and previous session low.
* When the session is "on":
* Draws a **box** from session low to high (`box.new`) and extends it to the right as long as the session continues.
* Places a **label with session name** (Asia, London, New York, etc.) near the high:
* Style depends on the session (down/right/left).
You have visibility toggles per session:
* `Asia Session`, `Sydney Session`, `Tokyo Session`, `Shanghai Session`, `Europe Session`, `London Session`, `New York Session`, `NYSE` (for TFlab mode).
So you visually see:
* A shaded box for each session
* The full H/L range for that session
* A text label with the session name.
---
#### 5. Info table
The indicator builds a **table in a corner of the chart** showing:
* Header:
* “FOREX Session”, “Stock Market Trading Hours”, “User Custom Session”, or “TFlab suggestion” depending on mode.
* Columns:
1. Session name (Asia, Sydney, Tokyo, Shanghai, Europe, London, New York, NYSE)
2. DST status for that region (“Active 🌞 / Inactive 🍂 / Not Observed”)
3. Session **start time**
4. Session **end time**
5. Current **status** (“Open / Closed”, with green/red background)
The function `SplitFunction`:
* Parses the `"HHMM-HHMM"` strings for each session.
* Converts them into:
* Either raw times (if viewing in UTC/session local)
* Or converted times in **Your Time Zone** using `timestamp` and `hour/ minute` with `YourTZ`.
* Returns formatted `Start` and `End` strings like `9:30`, `13:00`, etc.
So the table is effectively a **live session schedule** that:
* Auto-adjusts to DST
* Can show times in your own time zone
* Shows which session is open right now.
---
#### 6. OTT vertical lines (custom intraday markers)
At the bottom, there is an **OTT section** which lets you draw up to **three sets of vertical lines** at specific times:
* Each OTT block has:
* Enable toggle (`Enable OTT 1/2/3`)
* Start hour & minute
* End hour & minute
* Color
* Global OTT settings:
* Line style: `Solid / Dashed / Dotted`
* Line width
* Toggle: “Show OTT Labels?”
Logic:
* `is_ott_time()` checks if current bar’s `hour` and `minute` match the OTT input time.
* `draw_ott()`:
* When the bar time matches, draws a **vertical line** through the candle from low to high (`extend.both`).
* Optionally adds a label above the bar, like `"OTT1 Start"`, `"OTT1 End"`, etc.
Use cases:
* Marking **open/close of your trading session**
* Defining **killzones**, news times, or custom model windows
* Visual anchors for your intraday routine (NY open, 10 AM candle, etc.)
---
### TL;DR
This indicator is a **session toolkit + DST engine + time markers**:
* **Visually paints the main global sessions** with boxes and labels.
* **Handles DST automatically** for Sydney, London, New York.
* **Shows a live table** with session times, DST status, and open/closed status in your time zone.
* **Adds up to three configurable vertical time markers (OTT)** for custom session windows or key times.
If you want, I can also write a **short version** (2–3 sentences) for the TradingView “Description” field.

MP SESSIONS, DST, OTTMP SESSIONS, DST, OTT – What this indicator does
This script is a multi-session market timing tool that:
Draws full trading sessions on the chart (Asia, Sydney, Tokyo, Shanghai, Europe, London, New York, NYSE)
Automatically adjusts for Daylight Saving Time (DST) for Sydney, London, and New York
Shows a live info table with session times, DST status, and whether each session is currently open or closed
Adds optional custom “OTT” vertical lines at user-defined intraday times (for your own models, killzones, or time blocks)
Main Features (high level)
1. Market mode & time zone handling
Market Mode:
Forex
Stock
User Custom (you type your own session ranges)
TFlab suggestion (predefined “optimized” session times)
Time Zone Mode:
UTC
Session Local Time (local exchange time: Sydney, Tokyo, London, New York etc.)
Your Time Zone (converts to the user-selected TZ, e.g. UTC-4:00)
Handles separate time zones for:
Asia, Sydney, Tokyo, Shanghai, Europe, London, New York, NYSE
Has logic to recalculate session start/end depending on DST and the chosen mode.
2. Daylight Saving Time (DST) engine
The function DST_Detector:
Calculates when DST starts and ends for:
Australia/Sydney
Europe/London
America/New_York
Detects the correct Sunday (2nd, 4th, etc.) for start/end using day-of-week and week counts.
Returns 'Active' or 'Inactive' for each region.
These values are then used to shift the sessions (e.g. New York 13:00–21:00 vs 12:00–20:00 in UTC).
The script can also draw vertical lines on the chart when DST starts/ends and label them:
“Sydney DST Started / Ended”
“London DST Started / Ended”
“New York DST Started / Ended”
3. Session timing & sessions on the chart
The function Market_TimeZone_Calculator:
Based on Market Mode + Time Zone Mode + DST state, it returns:
Time ranges for: Sydney, Tokyo, Shanghai, Asia (combined), Europe, London, New York, NYSE
These ranges are in "HHMM-HHMM" format.
Then the script:
Converts these to time() conditions using the proper time zone
Creates boolean series like On_sesAsia, On_sesEurope, On_sesNewYork, etc., which are 1 when the session is open and 0 when closed.
4. Session high/low boxes & labels
The function LowHighSessionDetector:
Tracks high and low of each session while it’s active.
When a new session starts:
Resets and starts recording the session high/low.
While session is active:
Updates High with the max of current bar high and previous session high.
Updates Low with the min of current bar low and previous session low.
When the session is "on":
Draws a box from session low to high (box.new) and extends it to the right as long as the session continues.
Places a label with session name (Asia, London, New York, etc.) near the high:
Style depends on the session (down/right/left).
You have visibility toggles per session:
Asia Session, Sydney Session, Tokyo Session, Shanghai Session, Europe Session, London Session, New York Session, NYSE (for TFlab mode).
So you visually see:
A shaded box for each session
The full H/L range for that session
A text label with the session name.
5. Info table
The indicator builds a table in a corner of the chart showing:
Header:
“FOREX Session”, “Stock Market Trading Hours”, “User Custom Session”, or “TFlab suggestion” depending on mode.
Columns:
Session name (Asia, Sydney, Tokyo, Shanghai, Europe, London, New York, NYSE)
DST status for that region (“Active 🌞 / Inactive 🍂 / Not Observed”)
Session start time
Session end time
Current status (“Open / Closed”, with green/red background)
The function SplitFunction:
Parses the "HHMM-HHMM" strings for each session.
Converts them into:
Either raw times (if viewing in UTC/session local)
Or converted times in Your Time Zone using timestamp and hour/ minute with YourTZ.
Returns formatted Start and End strings like 9:30, 13:00, etc.
So the table is effectively a live session schedule that:
Auto-adjusts to DST
Can show times in your own time zone
Shows which session is open right now.
6. OTT vertical lines (custom intraday markers)
At the bottom, there is an OTT section which lets you draw up to three sets of vertical lines at specific times:
Each OTT block has:
Enable toggle (Enable OTT 1/2/3)
Start hour & minute
End hour & minute
Color
Global OTT settings:
Line style: Solid / Dashed / Dotted
Line width
Toggle: “Show OTT Labels?”
Logic:
is_ott_time() checks if current bar’s hour and minute match the OTT input time.
draw_ott():
When the bar time matches, draws a vertical line through the candle from low to high (extend.both).
Optionally adds a label above the bar, like "OTT1 Start", "OTT1 End", etc.
Use cases:
Marking open/close of your trading session
Defining killzones, news times, or custom model windows
Visual anchors for your intraday routine (NY open, 10 AM candle, etc.)

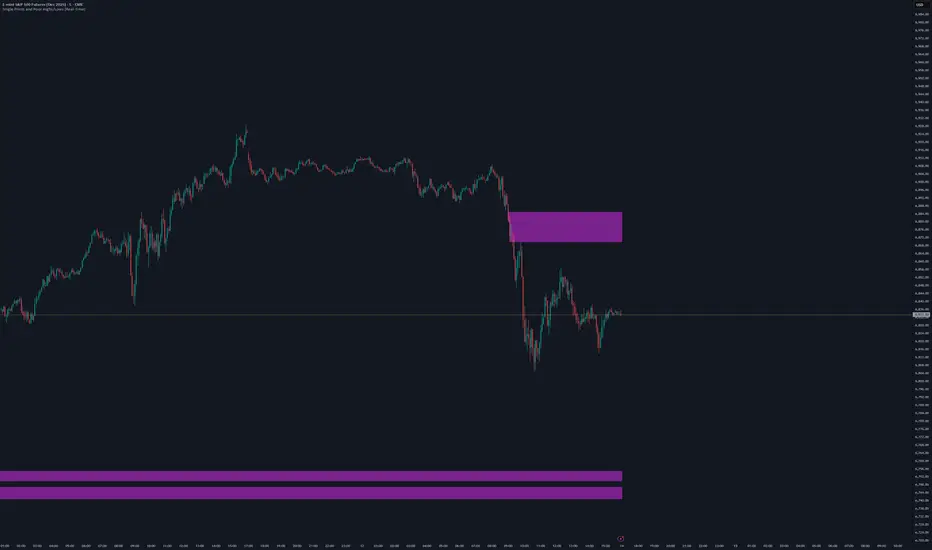
Single Prints and Poor Highs/Lows [Real-Time]This indicator is designed for traders utilizing Auction Market Theory (AMT) who need real-time visibility into market structure inefficiencies. Unlike standard TPO tools that often wait for closed bars or finished sessions, this script builds a developing TPO profile tick-by-tick to identify Single Prints and Poor Highs/Lows the moment they form.
Key Features:
Real-Time Single Prints: Automatically detects and highlights areas of single-print inefficiencies (buying/selling tails) as they happen. These "ghost" boxes persist on the chart until price repairs (fills) them, acting as immediate targets or support/resistance zones.
Poor High/Low Detection: Strictly implements AMT logic to identify "unfinished" auctions. If a session extreme is formed by two or more TPO blocks (indicating a flat top/bottom rather than a rejection tail), it marks the level with a dotted line.
Repair Logic: Both Single Prints and Poor High/Low lines are dynamic. If price revisits and repairs the structure, the markers automatically vanish to keep your chart clean.
Session Control: Fully customizable RTH (Regular Trading Hours) session input (default 08:30–15:15) to ensure profiles are built on relevant liquidity.
Quantization: Adjustable "Ticks per Block" allowing you to tune the sensitivity of the TPO profile to different assets (ES, NQ, CL, etc.).
How It Works:
TPO Construction: The script breaks the session into 30-minute periods (configurable) and tracks price overlap.
Single Prints: When the market expands rapidly, leaving gaps in the profile (single TPO blocks), a box is drawn. If price trades back through this box, it deletes itself.
Poor Extremes: It monitors the current session High and Low. If the extreme price level has a TPO count of ≥ 2, it is flagged as "Poor." If the extreme is a single print (count = 1), it is considered a valid tail and left unmarked.
Settings:
RTH Session: Define your specific trading session time.
TPO Period: Default is 30 minutes (standard AMT).
Ticks per Block: Controls the vertical resolution of the TPO. (Higher values = coarser profile, Lower values = more precision).
Colors: Fully customizable colors for Live Prints, Historical Prints, and Poor High/Low lines.
Usage:
Use this tool to spot immediate structural targets. A Poor High often acts as a magnet for price to revisit and "repair," while Single Prints often defend as support/resistance on the first retest.
RiskCraft - Advanced Risk Management SystemRiskCraft – Risk Intelligence Dashboard
Trade like you actually respect risk
"I know the setup looks good… but how much am I actually risking right now?"
RiskCraft is an open-source Pine Script v6 indicator that keeps risk transparent directly on the chart. It is not a signal generator; it is a risk desk that calculates size, frames volatility, and reminds you when your behaviour drifts away from the plan.
Core utilities
Calculates professional-style position sizing in real time.
Reads volatility and market regime before position size is confirmed.
Adjusts risk based on the trader’s emotional state and confidence inputs.
Maps session risk across Asian, London, and New York hours.
Draws exactly one stop line and one target line in the preferred direction.
Provides rotating education tips plus contextual warnings when risk escalates.
It is intentionally conservative and keeps you in the game long enough for any separate entry logic to matter.
---
Chart layout checklist
Use a clean chart on a liquid symbol (e.g., AMEX:SPY or major FX pairs).
Main RiskCraft dashboard placed on the right edge.
Session Risk box on the left with UTC time visible.
Floating risk badge above price.
Stop/target guide lines enabled.
Education panel visible in the bottom-right corner.
---
1. On-chart components
Right-side dashboard : account risk %, position size/value, stop, target, risk/reward, regime, trend strength, emotional state, behavioural score, correlation, and preferred trade direction.
Session Risk box : highlights active session (Asian, London, NY), current UTC time, and risk label (High/Med/Low) per session.
Floating risk badge : keeps actual account risk percent visible with colour-coded wording from Ultra Cautious to Very Aggressive.
Stop/target lines : exactly one dashed stop and one dashed target aligned with the preferred bias.
Education panel : rotates core principles and AI-style warnings tied to volatility, risk %, and behaviour flags.
---
2. Volatility engine – ATR with context 📈
atr = ta.atr(atrLength)
atrPercent = (atr / close) * 100
atrSMA = ta.sma(atr, atrLength)
volatilityRatio = atr / atrSMA
isHighVol = volatilityRatio > volThreshold
ATR vs ATR SMA shows how wild price is relative to recent history.
Volatility ratio above the threshold flips isHighVol , which immediately trims risk.
An ATR percentile rank over the last 100 bars indicates calm versus chaotic regimes.
Daily ATR sampling via request.security() gives higher time-frame context for intraday sessions.
When volatility spikes the script dials position size down automatically instead of cheering for maximum exposure.
---
3. Market regime radar – Danger or Drift 🌊
ema20 = ta.ema(close, 20)
ema50 = ta.ema(close, 50)
ema200 = ta.ema(close, 200)
trendScore = (close > ema20 ? 1 : -1) +
(ema20 > ema50 ? 1 : -1) +
(ema50 > ema200 ? 1 : -1)
= ta.dmi(14, 14)
Regimes covered:
Danger : high volatility with weak trend.
Volatile : volatility elevated but structure still directional.
Choppy : low ADX and noisy action.
Trending : directional flows without extreme volatility.
Mixed : anything between.
Each regime maps to a 1–10 risk score and a multiplier that feeds the final position size. Danger and Choppy clamp size; Trending restores normal risk.
---
4. Behaviour engine – trader inputs matter 🧠
You provide:
Emotional state : Confident, Neutral, FOMO, Revenge, Fearful.
Confidence : slider from 1 to 10.
Toggle for behavioural adjustment on/off.
Behind the scenes:
Each state triggers an emotional multiplier .
Confidence produces a confidence multiplier .
Combined they form behavioralFactor and a 0–100 Behavioural Score .
High-risk emotions or low conviction clamp the final risk. Calm inputs allow normal size. The dashboard prints both fields to keep accountability on-screen.
---
5. Correlation guardrail – avoid stacking identical risk 📊
Optional correlation mode compares the active symbol to a reference (default AMEX:SPY ):
corrClose = request.security(correlationSymbol, timeframe.period, close)
priceReturn = ta.change(close) / close
corrReturn = ta.change(corrClose) / corrClose
correlation = calcCorrelation()
Absolute correlation above the threshold applies a correlation multiplier (< 1) to reduce size.
Dashboard row shows the live correlation and reference ticker.
When disabled, the row simply echoes the current symbol, keeping the table readable.
---
6. Position sizing engine – heart of the script 💰
baseRiskAmount = accountSize * (baseRiskPercent / 100)
adjustedRisk = baseRiskAmount * behavioralFactor *
regimeAdjustment * volAdjustment *
correlationAdjustment
finalRiskAmount = math.min(adjustedRisk,
accountSize * (maxRiskCap / 100))
stopDistance = atr * atrStopMultiplier
takeProfit = atr * atrTargetMultiplier
positionSize = stopDistance > 0 ? finalRiskAmount / stopDistance : 0
positionValue = positionSize * close
Outputs shown on the dashboard:
Position size in units and value in currency.
Actual risk % back on account after adjustments.
Risk/Reward derived from ATR-based stop and target.
---
7. Intelligent trade direction – bias without signals 🎯
Direction score ingredients:
EMA stack alignment.
Price versus EMA20.
RSI momentum relative to 50.
MACD line vs signal.
Directional Movement (DI+/DI–).
The resulting Trade Direction row prints LONG, SHORT, or NEUTRAL. No orders are generated—this is guidance so you only risk capital when the structure supports it.
---
8. Stop/target guide lines – two lines only ✂️
if showStopLines
if preferLong
// long stop below, target above
else if preferShort
// short stop above, target below
Lines refresh each bar to keep clutter low.
When the direction score is neutral, no lines appear.
Use them as visual anchors, not auto-orders.
---
9. Session Risk map – global volatility clock 🌍
Tracks Asian, London, and New York windows via UTC.
Computes average ATR per session versus global ATR SMA.
Labels each session High/Med/Low and colours the cells accordingly.
Top row shows the active session plus current UTC time so you always know the regime you are trading.
One glance tells you whether you are trading quiet drift or the part of the day that hunts stops.
---
10. Floating risk badge – honesty above price 🪪
Text ranges from Ultra Cautious through Very Aggressive.
Colour matches the risk palette inputs (High/Med/Low).
Updates on the last bar only, keeping historical clutter off the chart.
Account risk becomes impossible to ignore while you stare at price.
---
11. Education engine & warnings 📚
Rotates evergreen principles (risk 1–2%, journal trades, respect plan).
Triggers contextual warnings when volatility and risk % conflict.
Flags when emotional state = FOMO or Revenge.
Highlights sub-standard risk/reward setups.
When multiple danger flags stack, an AI-style warning overrides the tip text so you can course-correct before capital is exposed.
---
12. Alerts – hard guard rails 🚨
Excessive Risk Alert : actual risk % crosses custom threshold.
High Volatility Alert : ATR behaviour signals danger regime.
Emotional State Warning : FOMO or Revenge selected.
Poor Risk/Reward Alert : risk/reward drops below your standard.
All alerts reinforce discipline; none suggest entries or exits.
---
13. Multi-market behaviour 🕒
Intraday (1m–1h): session box and badge react quickly; ideal for scalpers needing constant risk context.
Higher time frames (1D–1W): dashboard shifts slowly, supporting swing planning.
Asset classes confirmed in validation: crypto majors, large-cap equities, indices, major FX pairs, and liquid commodities.
Risk logic is price-based, so it adapts across markets without bespoke tuning.
15. Key inputs & recommended defaults
Account Size : 10,000 (modify to match actual account; min 100).
Base Risk % : 1.0 with a Maximum Risk Cap of 2.5%.
ATR Period : 14, Stop Multiplier 2.0, Target Multiplier 3.0.
High Vol Threshold : 1.5 for ATR ratio.
Behavioural Adjustment : enabled by default; disable for fixed risk.
Correlation Check : optional; default symbol AMEX:SPY , threshold 0.7.
Display toggles : main dashboard, risk badge, session map, education panel, and stop lines can be individually disabled to reduce clutter.
16. Usage notes & limits
Indicator mode only; no automated entries or exits.
Trade history panel intentionally disabled (requires strategy context).
Correlation analysis depends on additional data requests and may lag slightly on illiquid symbols.
Session timing uses UTC; adjust expectations if you trade localized instruments.
HTF ATR sampling uses daily data, so bar replay on lower charts may show brief data gaps while HTF loads.
What does everyone think RISK really means?

MTF S/R Array - Full CustomA clean, institutional-style multi-timeframe support and resistance indicator designed for precision trading decisions. Plots previous and current period levels with full customization for backtesting and live trading.
━━━━━━━━━━━━━━━━━━━━━━
WHAT IT PLOTS
━━━━━━━━━━━━━━━━━━━━━━
MONTHLY
- Previous Month High / Low / Close
- Previous Month Highest Closing Price
- Current Month High / Low / Highest Close
WEEKLY
- Previous Week High / Low / Close
- Current Week High / Low
DAILY
- Previous Day High / Low / Close
- Current Day High / Low
SESSIONS (Full Session - EST)
- Asian: 7pm - 4am
- London: 3am - 12pm
- New York: 8am - 5pm
OPENING RANGE
- Monday/Tuesday combined high and low
- Clean box visualization for weekly initial balance
━━━━━━━━━━━━━━━━━━━━━━
WHY THESE LEVELS MATTER
━━━━━━━━━━━━━━━━━━━━━━
Institutions and smart money reference these key levels for:
- Liquidity targets
- Stop hunts
- Reversal zones
- Trend continuation entries
Previous period levels act as magnets for price. Current levels show where the battle is happening now.
━━━━━━━━━━━━━━━━━━━━━━
FULL CUSTOMIZATION
━━━━━━━━━━━━━━━━━━━━━━
Every level type has independent controls:
- Show/Hide Previous and Current separately
- Extend Bars - control how far each level stretches
- Line Width - adjust thickness per level
- Transparency - fade previous levels for clarity
- Colors - separate colors for High/Low vs Close
Additional settings:
- Labels on/off with size and style options
- Info table with position and size controls
- Opening range box transparency and border width
━━━━━━━━━━━━━━━━━━━━━━
HOW TO USE
━━━━━━━━━━━━━━━━━━━━━━
1. Use on lower timeframes (1m, 5m, 15m) to see HTF levels
2. Watch for price reactions at previous period highs/lows
3. Look for session high/low sweeps followed by reversals
4. Use Monday/Tuesday opening range for weekly bias and targets
5. Previous levels extend further back for backtesting context
━━━━━━━━━━━━━━━━━━━━━━
TIPS
━━━━━━━━━━━━━━━━━━━━━━
- Increase "Prev Extend Bars" on monthly/weekly to see levels across more history
- Use higher transparency on previous levels to keep chart clean
- Turn off sessions you don't trade to reduce clutter
- The info table shows all values at a glance - position it where it doesn't block price action
━━━━━━━━━━━━━━━━━━━━━━
BEST FOR
━━━━━━━━━━━━━━━━━━━━━━
- ICT / Smart Money Concepts traders
- Session-based strategies
- Swing traders using HTF levels on LTF entries
- Anyone who wants clean, customizable S/R levels
Works on Forex, Crypto, Stocks, Futures, and Indices.

DTR & ATR with live zonesThis indicator is designed to help traders gauge the day's volatility in real-time. It compares the current Daily True Range (DTR)—the distance between the session's high and low—to the historical Average True Range (ATR).
The main purpose is to project potential price levels where the market might reach based on its average volatility. These levels (100% ATR, 150%, 200%, etc.) can be used as price targets. For instance, if you're in a long trade, you might consider taking partial or full profits as the price approaches these upper ATR extension levels. The indicator is highly customisable, allowing you to control the appearance of the ATR lines, zones, and labels to fit your charting preferences.
Core Concepts: ATR and DTR
To use this indicator effectively, it's important to understand its two main components:
Average True Range (ATR): This is a classic technical analysis indicator that measures market volatility. It calculates the average range of price movement over a specific period (e.g., 14 days). A higher ATR means the price is, on average, moving more, while a low ATR indicates less volatility. This script uses a higher timeframe ATR (e.g., Daily) to establish a stable volatility baseline for the current trading day.
Daily True Range (DTR): This is simply the difference between the current trading session's highest high and lowest low (session high - session low). It tells you how much the price has actually moved so far today.
The indicator's logic revolves around comparing the live, unfolding DTR to the historical, baseline ATR. An on-screen table conveniently shows this comparison as a percentage, to show how volatile the day has been.
How It Works: The Dynamic & Locked Mechanism
The most clever part of this indicator is how it draws the ATR levels. It operates in two distinct phases during the trading session:
Phase 1: Dynamic Expansion (Before DTR meets ATR)
At the start of the session, the DTR is small. The indicator calculates the remaining range needed to "complete" the 100% ATR level (difference = avg_atr - dtr). It then adds this remaining amount to the session high and subtracts it from the session low. This creates a "floating" 100% ATR range that expands dynamically as the session high or low is extended.
Phase 2: The Lock-in (After DTR meets or exceeds ATR)
Once the day's range (DTR) becomes equal to or greater than the avg_atr, the day has met its "expected" volatility. At this point, the levels lock in place. The indicator intelligently determines the anchor point for the locked range.
Once this primary 100% ATR range is established (either dynamically or locked), the script projects the other levels (150%, 200%, 250%, and 300%) by adding or subtracting multiples of the avg_atr from this base.
How to Use It for Trading
The primary use of this indicator is to set logical, volatility-based price targets.
Setting Profit Targets: If you enter a long position, the upper ATR levels (100%, 150%, 200%) serve as excellent areas to consider taking profits. A move to the 200% or 250% level often signifies an overextended or "exhaustion" move, making it a high-probability exit zone. For short positions, the lower ATR levels serve the same purpose.
Assessing Intraday Momentum: The on-screen table tells you how much of the expected daily range has been used. If it's early in the session and the DTR is only at 30% of the ATR, you can anticipate more significant price movement is likely to come. Conversely, if the DTR is already at 150% of ATR, the bulk of the day's move may already be complete.
Mean Reversion Signals: If the price pushes to an extreme level (e.g., 250% ATR) and shows signs of stalling (e.g., bearish divergence on an oscillator), it could signal a potential reversal or pullback, offering an opportunity for a counter-trend trade.
Key Settings
ATR Length & Smoothing Type: These settings control how the baseline ATR is calculated. The default 14 period and RMA smoothing are standard, but you can adjust them to your preference.
Session Settings: This is crucial. You must set the Market Session and Time Zone to match the primary trading hours of the asset you are analysing (e.g., "0930-1600" for the NYSE session).
Show Lines / Show Labels / Show Zones: The script gives you full control over the visual display. You can toggle each ATR level's lines, labels, and background zones individually to avoid a cluttered chart and focus only on the levels that matter to your strategy.

ICT Essentials [LDT]ICT Essentials
Overview
ICT Essentials is an all-in-one trading utility built to create a natural and efficient workflow for ICT-based traders.
Every component has been designed to integrate seamlessly and update dynamically across timeframes.
The indicator focuses on clarity, performance and customization, allowing traders to tailor every part of their trading experience.
Equal Highs & Lows
This feature automatically detects and marks Equal Highs (EQH) and Equal Lows (EQL) with full control over visuals and behavior.
Users can customize line colors, widths, and styles, label size, color, background transparency and text offset.
The logic uses an optimized scanning and caching system that maintains smooth performance even on higher timeframes.
It provides a precise and adaptive way to identify structural liquidity points whilst keeping the chart clean and readable.
Killzones & Session Pivots
Plots the main trading sessions such as Asia, London and New York (AM, Lunch, PM) with full flexibility and styling options.
Each session can be enabled or disabled individually, with its own color, transparency and label preferences.
Session highs and lows are automatically tracked and plotted as pivots with extension modes like Until Mitigated or Past Mitigation.
This system gives traders the ability to organize market sessions exactly how they prefer whilst keeping the chart consistent and efficient.
Daily Pivots and Tier System
Alongside session pivots, the script tracks daily highs and lows to provide a broader structural view of price. These pivots are stored and displayed on the chart with their appearance updating automatically when price interacts with them.
The system includes a unique tier-based visibility filter that maintains a clean chart by preventing duplicate or overlapping pivots. Recent daily pivots are cached and compared to session pivots and when two levels fall within a defined proximity, the redundant one is automatically hidden. This creates a clear hierarchy of daily and session levels, keeping the most relevant structure visible whilst removing noise.
All aspects of the daily pivot system are fully customizable, including the number of tracked pivots, color, style settings and how mitigated levels are handled. The caching and filtering logic ensures smooth performance and a visually organized workspace even as the data updates in real time.
Key Times
Allows up to five custom key time markers such as the Midnight Open, 6:00 AM or 10:00 AM.
Each marker can be fully customized with its own text, color, line style and thickness.
This makes it simple to visualize key reaction points that align with each traders timing model.
Higher Timeframe Candles
Displays higher timeframe candles such as 1H, 4H or Daily directly on the active chart to provide context without switching views.
Users can customize body, wick and border colors, along with adding optional trace lines for the open, close, high and low and can also show the countdown timers for remaining candle time.
Adjustable spacing, positioning and label visibility makes the display blend naturally with any trading setup.
This module helps traders connect multiple timeframes visually in a clean and intuitive way.
Watermark
Adds a customizable watermark with title, subtitle and symbol or timeframe information.
Every element can be adjusted for color, size, transparency, alignment and position.
The result is a polished, professional chart layout that adapts to the user's personal style.
Optimization and Design
ICT Essentials is built for performance, using cached arrays and lightweight calculations to maintain responsiveness on all timeframes.
Each feature can be toggled individually to suit the traders focus or system performance.
The script delivers a fluid, customizable and highly optimized trading experience designed to feel natural and effortless in day-to-day use.
Credits
This script takes reference and inspiration from several open-source indicators:
Equal Highs and Lows by jzstur
ICT HTF Candles (fadi) by fadizeidan
ICT Killzones + Pivots EP by tradeforopp
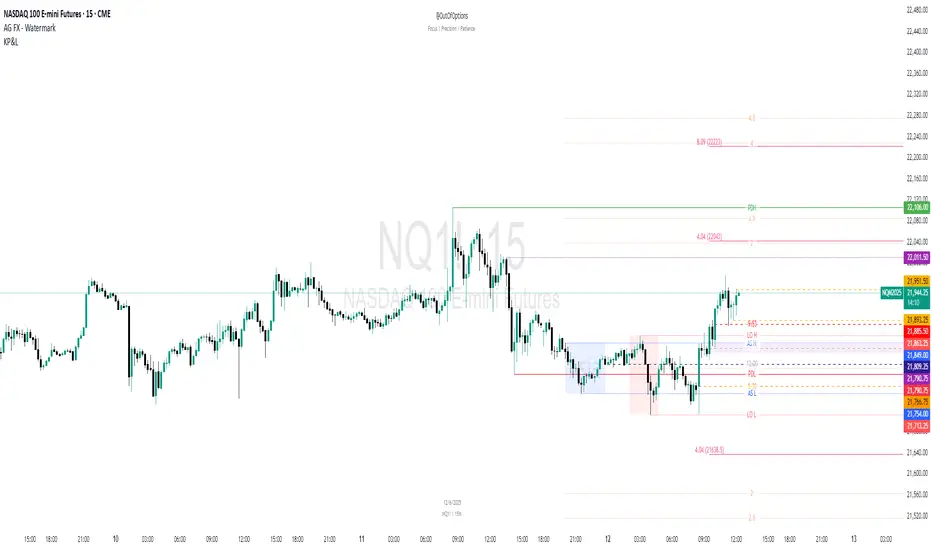
AG FX - Watermark by AGFXTRADING
All components have been refactored, optimized and unified into a single framework for a smoother and more efficient workflow.

AP Session Liquidity with EQH/EQL and Previous DayThis indicator plots key intraday session highs and lows, along with essential market structure levels, to help traders identify areas of interest, potential liquidity zones, and high-probability trade setups. It includes the Asia Session High and Low (typically 00:00–08:00 UTC), London Session High and Low (08:00–12:00 UTC), New York AM Session High and Low (12:00–15:00 UTC), and New York Lunch High and Low (15:00–17:00 UTC). Additionally, it displays the Previous Day’s High and Low for context on recent price action, as well as automatically detected Equal Highs and Lows based on configurable proximity settings to highlight potential liquidity pools or engineered price levels. These session levels are widely used by institutional traders and are critical for analyzing market behavior during time-based volatility windows. Traders can use this indicator to anticipate breakouts, fakeouts, and reversals around session boundaries—such as liquidity grabs at Asia highs/lows before the London or New York sessions—or to identify key consolidation and expansion zones. Equal Highs and Lows serve as magnets for price, offering insight into potential stop hunts or inducement zones. This tool is ideal for day traders, scalpers, and smart money concept practitioners, and includes full customization for session timings, color schemes, line styles, and alert conditions. Whether you're trading price action, ICT concepts, or supply and demand, this indicator provides a powerful framework for intraday analysis.

[TTM] ICT Sessions & Ranges🌟 Overview 🌟
The ICT Sessions & Ranges Indicator helps traders identify key intraday price levels by marking custom session highs/lows and opening ranges.
It helps traders spot potential liquidity grabs, reversals, and breakout zones by tracking price behavior around these key areas
🌟 Session Highs & Lows – Liquidity Zones 🌟
Session highs and lows often attract price due to stop orders resting above or below them. These levels are frequently targeted during high-volatility moves.
🔹 Asia Session
- Usually ranges in low volatility.
- Highs/lows often get swept during early London.
- Price may raid these levels, then reverse.
🔹 London Session
- First major volatility of the day.
- Highs/lows often tested or swept in New York.
- Commonly forms the day’s true high or low.
🌟 Opening Range Concepts 🌟
The Opening Range is the first 15, 30, or 60 minutes of a session (e.g., New York).
The high (ORH) and low (ORL) define the market’s initial balance and key reaction levels.
🔹 Breakout Trade
- Price breaks ORH/ORL with momentum.
- Signals directional intent.
- Traders enter on the breakout, with stops inside the range.
🔹 Liquidity Raid
- Price briefly breaks ORH/ORL to trigger stops.
- Reverses after the sweep.
- Look for structure shift and entry near FVG or OB.
🌟 Customizable Settings 🌟
The indicator includes 3 configurable ranges , each with:
Start & End Time – Set any custom time window.
Display Type – Choose Box (highlight range) or Lines (mark high/low).
Color Settings – Set custom colors for boxes and lines.
🌟 Default Settings 🌟
Range 1 : 19:00–00:00 (Asia Session)
Range 2 : 01:45–05:15 (London Session)
Range 3 : 09:30–10:00 (NY Opening Range – 30m)

Session Breakouts & Trend Indicator# Session Breakouts & Trend Indicator
This indicator identifies high-probability trading opportunities by tracking key intraday sessions and their breakouts while aligning them with the overall market trend direction.
## What Makes This Indicator Unique
Unlike standard breakout indicators that only identify when price crosses a threshold, this indicator:
- Dynamically identifies and tracks important daily sessions (default: AM 09:00-10:00 and PM 15:00-16:00)
- Determines trend direction using a triple EMA system (20/50/200)
- Shows when breakouts align with the overall trend (higher probability setups)
- Provides visual confirmation with session ranges, breakout levels, and background highlighting
- Includes a comprehensive information panel showing trend/session alignment
## How It Works
The indicator tracks two important daily sessions:
1. **AM Session**: Typically the first hour of trading (default: 09:00-10:00)
2. **PM Session**: Typically the last hour of trading (default: 15:00-16:00)
For each session, it:
- Marks the high and low range
- Establishes breakout levels above/below these ranges
- Detects when price breaks beyond these levels
- Determines if the breakout aligns with the prevailing trend
The trend is calculated using three EMAs (20, 50, 200) for reliable trend identification.
## How To Use
1. Apply the indicator to your chart (works best on 5-minute timeframes)
2. Adjust session times to match your trading schedule if needed
3. Watch for breakouts above session highs (bullish) or below session lows (bearish)
4. Check the information panel to see if the breakout aligns with the trend
5. Enter trades in the direction of trend-aligned breakouts for higher probability setups
6. Set stop losses below the opposite side of the session range
## Settings
- **Session Times**: Customize AM and PM session times
- **EMA Lengths**: Adjust trend determination sensitivity
- **Visualization Options**: Toggle display of sessions, breakouts, and VWAP
- **Alert Settings**: Configure alerts for breakouts and trend-aligned conditions
This indicator is valuable for day traders and swing traders looking for objective entry points with higher probability of success.

VWAP 2.0 with desv + Initial Balance by RiotWolftrading🌟 Overview
This powerful tool is designed for traders who want to harness the power of the Volume Weighted Average Price (VWAP) alongside session-based ranges to make informed trading decisions. Whether you're a day trader or a swing trader, this indicator provides a clean and effective way to identify support, resistance, and market trends—all in one place! 💡
✨ Key Features
Auto-Anchored VWAP 📊
Automatically calculates the VWAP based on a user-defined anchor period (e.g., Daily, Weekly, Monthly).
Resets at the start of each period (e.g., daily for a Daily anchor).
Displays a customizable VWAP line with standard deviation bands to highlight key price levels.
Standard Deviation Bands 📏
Plots up to three sets of standard deviation bands above and below the VWAP (multipliers: 1.0, 2.0, 3.0).
Includes volume percentage labels to show where trading volume is concentrated. 📉
Session High/Low Range 🕒
Identifies the high and low prices within a customizable session (default: 12:00 to 15:31).
Draws horizontal lines at the session high and low, with dotted deviation lines for additional reference points.
Perfect for spotting key levels during your trading session! 🔑
Time-Based Range Box ⏰
Highlights a specific time window (default: 15:40 to 15:50) with a colored box showing the high and low prices.
Ideal for tracking price action during high-impact events like news releases or market opens. 📅
Alerts 🚨
Set up alerts for when the price crosses above or below the VWAP—never miss a potential trading opportunity!
⚙️ Settings
Customize the indicator to fit your trading style with these easy-to-use settings:
VWAP Settings
Timezone 🌍: Select your timezone (default: GMT+2) to align calculations with your local time.
VWAP Source 📈: Choose the price source for VWAP (default: hlc3 - average of high, low, close).
Std Deviation Multipliers 📐: Adjust the multipliers for the bands (default: 1.0, 2.0, 3.0).
Line Width ✏️: Set the thickness of the VWAP and band lines (default: 1).
Session Time ⏳: Define the session window for VWAP calculations (default: 08:00-18:00, all days).
Show Upper/Lower Bands 👀: Toggle visibility for each set of bands (default: Band 1 visible, Bands 2 & 3 hidden).
Range Settings
Range Start/End Time 🕙: Set the time window for the range box (default: 15:40 to 15:50).
Box Color 🎨: Customize the border color (default: blue).
Box Background Color 🖌️: Adjust the background color (default: light aqua, 90% transparency).
I created this indicator to provide a streamlined, clutter-free tool for traders who rely on VWAP and session-based analysis. It focuses on the essentials—VWAP, standard deviation bands, session high/low, and range box—without unnecessary overlays. I hope it helps you in your trading journey! If you have feedback or suggestions, feel free to share—I’d love to hear from you! 😊

Intraday Macro & Flow Indicator# IntraMacroFlow Indicator
## Introduction
IntraMacroFlow is a volume and delta-based indicator that identifies significant price movements within trading sessions. It generates signals when volume spikes coincide with quality price movement, filtered by RSI to avoid overbought/oversold conditions.
> **Note:** This indicator provides multiple signals and should be combined with additional analysis methods such as support/resistance, trend direction, and price action patterns.
## Inputs
### Volume Settings
* **Volume Lookback Period** (14) - Number of bars for volume moving average calculation
* **Volume Threshold Multiplier** (1.5) - Required volume increase over average to generate signals
* **Delta Threshold** (0.3) - Required close-to-open movement relative to bar range (higher = stronger movement)
### Session Configuration
* **Use Dynamic Session Detection** (true) - Automatically determine session times
* **Highlight Market Open Period** (true) - Highlight first third of trading session
* **Highlight Mid-Session Period** (true) - Highlight middle portion of trading session
* **Detect Signals Throughout Whole Session** (true) - Find signals in entire session
* **Session Time** ("0930-1600") - Trading hours in HHMM-HHMM format
* **Session Type** ("Regular") - Select Regular, Extended, or Custom session
### Manual Session Settings
Used when dynamic detection is disabled:
* **Manual Session Open Hour** (9)
* **Manual Session Open Minute** (30)
* **Manual Session Open Duration** (60)
* **Manual Mid-Session Start Hour** (12)
* **Manual Mid-Session End Hour** (14)
## How It Works
The indicator analyzes each bar using three primary conditions:
1. **Volume Condition**: Current volume > Average volume × Threshold
2. **Delta Condition**: |Close-Open|/Range > Delta threshold
3. **Time Condition**: Bar falls within configured session times
When all conditions are met:
* Bullish signals appear when close > open and RSI < 70
* Bearish signals appear when close < open and RSI > 30
## Display Elements
### Shapes and Colors
* Green triangles below bars - Bullish signals
* Red triangles above bars - Bearish signals
* Blue background - Market open period
* Purple background - Mid-session period
* Bar coloring - Green (bullish), Red (bearish), or unchanged
### Information Panel
A dynamic label shows:
* Current volume relative to average (Vol)
* Delta value for current bar (Delta)
* RSI value (RSI)
* Session status (Active/Closed)
## Calculation Method
```
// Volume Condition
volumeMA = ta.sma(volume, lookbackPeriod)
volumeCondition = volume > volumeMA * volumeThreshold
// Delta Calculation (price movement quality)
priceRange = high - low
delta = math.abs(close - open) / priceRange
deltaCondition = delta > deltaThreshold
// Direction and RSI Filter
bullishBias = close > open and entrySignal and not (rsi > 70)
bearishBias = close < open and entrySignal and not (rsi < 30)
```
## Usage Recommendations
### Suitable Markets
* Equities during regular trading hours
* Futures markets
* Forex during active sessions
* Cryptocurrencies with defined volume patterns
### Recommended Timeframes
* 1-minute to 1-hour (optimal: 5 or 15-minute)
### Parameter Adjustments
* For fewer but stronger signals: increase Volume Threshold (2.0+) and Delta Threshold (0.4-0.6)
* For more signals: decrease Volume Threshold (1.2-1.5) and Delta Threshold (0.2-0.3)
### Usage Tips
* Combine with trend analysis for higher-probability entries
* Focus on signals occurring at session boundaries and mid-session
* Use opposite signals as potential exit points
* Configure alerts to receive notifications when signals occur
## Additional Notes
* RSI parameters are fixed at 14 periods with 70/30 thresholds
* The indicator handles overnight sessions correctly
* Fully compatible with TradingView alerts
* Customizable visual elements
## Release Notes
Initial release: This is a template indicator that should be customized to suit your specific trading strategies and preferences.

FT SessionsFT Sessions
Overview
The FT Sessions is a highly customizable and powerful indicator designed for intraday traders who focus on session-based analysis. This script visually highlights global market sessions—Asia, Frankfurt, London, and New York (AM & PM)—on the chart, making it easier to track session ranges and analyze intraday price movements.
Key Features
Customizable Session Times and Colors:
Define your own session times and assign unique colors for better visibility.
Session Range Visualization:
Displays high and low ranges for each session.
Optional transparent range areas with outlines for clarity.
Configurable session range labels for enhanced readability.
Flexible Timezone Settings:
Choose a UTC offset or sync with the exchange's timezone.
User-Friendly Customization:
Compact settings for easier adjustments.
Enable or disable specific sessions to focus on relevant market activity.
How This Script Differs from LuxAlgo
This script draws inspiration from LuxAlgo's session tracking concept but has been developed with significant modifications and unique features:
Built from Scratch in Pine Script v5:
Fully optimized for Pine Script’s latest version, improving performance and functionality.
Expanded Session Range Features:
Five unique sessions (Asia, Frankfurt, London, New York AM, New York PM) with customizable ranges, colors, and labels.
Real-time updating of session ranges for improved intraday analysis.
4H Timeframe Optimization:
Automatically notifies users if applied to an unsupported timeframe, ensuring session accuracy.
Highly Configurable Input Options:
Advanced timezone handling and compact session management settings.
Unique Coding Structure:
Designed to maximize efficiency and minimize resource usage on TradingView.
While LuxAlgo focuses on session concepts, this script brings a fresh, customizable approach specifically tailored for intraday traders seeking precision in tracking session activity.
How It Works
The indicator tracks price movements within each session.
Highlights the high and low range of each session directly on the chart.
Updates session ranges in real-time to reflect evolving market conditions.
Practical Applications
Intraday Trading: Plan trades based on major market session ranges.
Breakout Strategies: Use session high and low levels to identify potential breakouts.
Session-Specific Patterns: Spot consolidations and reversals within session activity.
Important Notes
Optimized for the 4H timeframe. If applied to another timeframe, a notification will appear.
Best used in combination with other tools (e.g., volume or trend indicators) for a complete trading strategy.
Credits
This script draws inspiration from LuxAlgo's open-source session-tracking methodology. However, it introduces substantial improvements and unique features that set it apart. Full credit is given to LuxAlgo for their original open-source concept.
Disclaimer
This script is for informational and educational purposes only. Always test on a demo account before applying to live markets.

Key Prices & LevelsThis indicator is designed to visualize key price levels & areas for NY trading sessions based on the price action from previous day, pre-market activity and key areas from NY session itself. The purpose is to unify all key levels into a single indicator, while allowing a user to control which levels they want to visualize and how.
The indicator identifies the following:
Asia Range High/Lows, along with ability to visualize with a box
London Range High/Lows, along with ability to visualize with a box
Previous Day PM Session High/Lows
Current Day Lunch Session High/Lows, starts appearing after 12pm EST once the lunch session starts
New York Open (8:30am EST) price
9:53 Open (root candle) price
New York Midnight (12:00am EST) price
Previous Day High/Lows
First 1m FVG after NY Session Start (after 9:30am), with the ability to configure minimum FVG size.
Opening Range Gap, showing regular market hours close price (previous day 16:15pm EST close), new session open price (9:30am EST open) and optionally the mid-point between the two
Asia Range 50% along with 2, 2.5, 4 and 4.5 deviations of the Asia range in both directions
Configurability:
Each price level can be turned off
Styles in terms of line type, color
Ability to turn on/off labels for price levels and highlighting of prices on price scale
Ability to control label text for price levels
How is it different:
Identifies novel concepts such as 9:53 open, root candle that can be used as a bounce/resistance area during AM/PM sessions as well as confirmation of direction once closed over/under to indicate price's willingness to continue moving in the same direction.
It also shows 1st 1m FVG after New York Session open, that can be used to determine direction of the price action depending on PA's reaction to that area. While both 9:53 and 1m FVG are 1m based markers, these levels are visualized by the indicator on all timeframes from 15s to 1h.
Additionally the indicator is able to both highlight key prices in the price scale pane as well as combine labels to minimize clutter when multiple levels have the same price.
Lastly for in-session ranges such as Lunch High/Low the indicator updates the range in real-time as opposed to waiting for the lunch session to be over.
Session Sweeps [LuxAlgo]The Session Sweeps indicator combines ICT-based features for a complete trading methodology involving market sessions, market structure, and fair value gaps to find optimal entry conditions for trading price action.
Traders frequently tend to place stop/limit orders at the high and low points of major trading sessions such as Asian (Tokyo), European (London), and North American (New York), resulting in the establishment of liquidity pools at those particular levels. The Session Sweeps indicator is crafted to recognize and underscore occurrences of session sweeps or liquidity sweeps during these major trading sessions.
🔶 USAGE
Default settings utilize major forex trading sessions, yet users can select their preferred opening and closing times, rename the sessions, or adjust the colors. It's important to note that the specified times for each session align with the respective local timezones: Asian (Tokyo) UTC+9, European (London) UTC, and North American (New York) UTC-5.
If the price briefly crosses either the highest or lowest point of a market session. These movements, aiming at triggering stop losses, suggest potential shifts in the market direction. Detecting such movements is the fundamental purpose and core functionality of the script.
🔹Market Structure Shifts
A Market Structure Shift refers to a change in market direction, either from an uptrend to a downtrend or vice versa. A part of a common entry model when using session sweeps is waiting for the formation of a CHoCH after a session sweep.
🔹Fair Value Gaps
A Fair Value Gap (FVG) holds particular appeal for price action traders, emerging when there are inefficiencies or imbalances in the market, often a result of uneven buying and selling activity. The underlying concept of FVGs is that the market tends to revisit these inefficiencies before resuming its trajectory in alignment with the initial impulsive move.
After the formation of a CHoCH traders can enter a position when the price enters the area of a Fair Value Gap (FVG).
🔹Setup Examples
This entry setup is commonly used by ICT traders and is shared for informational & educational purposes only.
Long Positions (5-Minute Timeframe):
Wait for the previous session's low to be swept.
Look for a Bullish Choch.
Find a Bullish FVG formed by or before the Choch.
Entry Point: At the FVG.
Take Profit (TP): At the session high or aim for a 1:2 Risk-Reward Ratio.
Stop Loss (SL): At the session low or nearest Swing Low.
Take partial profits at intermediate swings, but don’t shift SL prematurely.
Short Positions (5-Minute Timeframe):
Wait for the previous session's high to be swept.
Look for a Bearish Choch.
Find a FVG formed by or before the Choch.
Entry Point: At the FVG.
Take Profit (TP): At the previous session's low or aim for a 1:2 RR.
Stop Loss (SL): At the session high or nearest Swing High.
Take partial profits at intermediate swings, but don’t shift SL prematurely.
🔶 SETTINGS
🔹Session Sweeps
Buyside Sweep Zones, Color, and Margin: toggles the visibility of bullside sweep zones, customizes the associated color, and sets the margin value defining the range of a bullside sweep zone.
Sellside Sweep Zones, Color, and Margin: toggles the visibility of sell-side sweep zones, customizes the associated color, and sets the margin value defining the range of a sell-side sweep zone.
Sweep Margin Length: specifies the maximum allowed length of a sweep zone invalidation, the length over which the price slightly invalidated the margin range.
Detect Sweeps Once per Session: if enabled will detect only once a sweep zone within a session.
Hide Fake Sweep Zones, and Color: controls the visibility and color of the fake sweep zones.
🔹Sessions
Session (Asia, London, New York AM, and New York PM), Start Time, and End Time: enables or disables the visibility of the named market session range, and customization of the session hours.
Color: color customization option of the named session.
Extend Max/Min: extends the highest and lowest price levels of the named session until the end of the next enabled session. This option is recommended to be enabled when sweep zone detection is activated to observe the relationship between the sweep zone and previous session extreme levels.
Extend Mid: extends the mean price levels of the named session until the end of the next enabled session. The extended line may serve as potential support and resistance levels.
Fill: enables/disables background coloring of the named session.
New York DST | London DST: enabling this option initiates Daylight Saving Time (DST) for New York or London. Note: Daylight Saving Time is not applied to the Asian (Tokyo) session.
Sessions Extreme Lines | Sessions Names: toggles the visibility of the highest and lowest price levels, as well as the names, for all market sessions.
Session Lines Width: sets the width of the lines for all sessions.
Session Fill Transparency: sets the background color transparency of the range for all sessions.
🔹Market Structure Shifts
Market Structure Shifts: toggles the visibility of market structure shifts, also known as change of character (CHoCH).
Detection Length: specifies the detection length.
Market Structure Shifts; Bull & Bear: color customization options.
🔹Fair Value Gaps
Fair Value Gaps: toggles the visibility of the fair value gaps.
Fair Value Gap Width Filter: specifies the filtering multiplier; additional details can be found in the tooltip of the respective input option.
Bullish & Bearish Imbalance: color customization options.
🔹Sessions Tabular View
Sessions Tabular View: toggles the visibility of the tabular view of the sessions, displaying date &time, status, and countdown counter.
Hide if not Forex Market Instrument: checks the market and automatically enables/disables the option based on the market instrument.
Table Text Size & Position: size and placement customization options
🔶 LIMITATIONS
Please be aware that fair value gap filtering cannot be applied to the initial 144 candles (with a fixed-length ATR) as the ATR value necessary for filtering won't be available during this period.
🔶 RELATED SCRIPTS
Buyside-Sellside-Liquidity
Sessions
Liquidity-Voids-FVG
Thank you to our community for the recommendation of this script. To explore additional conceptual scripts and related content, we invite you to visit >>> LuxAlgo-Scripts .

skThis Pine Script is an indicator designed to mark and highlight specific trading sessions on a TradingView chart. Here's a description of the script's functionality:
1. *Session Selection*: The script allows you to select a session time frame using the `session_input` input. The available options for session time frames are "D" (daily), "W" (weekly), "M" (monthly), "H" (hourly), "15" (15 minutes), "5" (5 minutes), and "1" (1 minute).
2. *Session Times*: You can specify the start and end times for three different trading sessions - CBDR (Central Bank Dealer Range), Asia, and London - using the corresponding input options. These times are specified in Indian Standard Time (IST).
3. *Time Calculation*: The script calculates the start and end times for each session based on the specified hours and minutes. It uses the `timestamp` function to create time objects for these sessions.
4. *Session Highlighting*: The script creates rectangles on the chart to highlight each session:
- CBDR Session: A gray rectangle is drawn during the CBDR session time.
- Asia Session: Another gray rectangle is drawn during the Asia session time.
- London Session: A green rectangle is drawn at the top of the chart during the London session time.
5. *Transparency*: The rectangles have a transparency level of 90%, allowing you to see the price data beneath them while still marking the sessions.
6. *Overlay*: The indicator is set to overlay on the price chart, so it doesn't obstruct the price data.
7. *Customization*: You can customize the session times and appearance by adjusting the input values in the settings panel of the indicator.
Overall, this script provides a visual way to identify and highlight specific trading sessions on your TradingView chart, helping traders understand price action in different market sessions.

ICT Silver Bullet [LuxAlgo]The ICT Silver Bullet indicator is inspired from the lectures of "The Inner Circle Trader" (ICT) and highlights the Silver Bullet (SB) window which is a specific 1-hour interval where a Fair Value Gap (FVG) pattern can be formed.
When a FVG is formed during the Silver Bullet window, Support & Resistance lines will be drawn at the end of the SB session.
There are 3 different Silver Bullet windows (New York local time):
The London Open Silver Bullet (3 AM — 4 AM ~ 03:00 — 04:00)
The AM Session Silver Bullet (10 AM — 11 AM ~ 10:00 — 11:00)
The PM Session Silver Bullet (2 PM — 3 PM ~ 14:00 — 15:00)
🔶 USAGE
The ICT Silver Bullet indicator aims to provide users a comprehensive display as similar as possible to how anyone would manually draw the concept on their charts.
It's important to use anything below the 15-minute timeframe to ensure proper setups can display. In this section, we are purely using the 3-minute timeframe.
In the image below, we can see a bullish setup whereas a FVG was successfully retested during the Silver Bullet session. This was then followed by a move upwards to liquidity as our target.
Alternatively, you can also see below a bearish setup utilizing the ICT Silver Bullet indicator outlined.
At this moment, the indicator has removed all other FVGs within the Silver Bullet session & has confirmed this FVG as the retested one.
There is also a support level marked below to be used as a liquidity target as per the ICT Silver Bullet concept suggests.
In the below chart we can see 4 separate consecutive examples of bullish & bearish setups on the 3-minute chart.
🔶 CONCEPTS
This technique can visualize potential support/resistance lines, which can be used as targets.
The script contains 2 main components:
• forming of a Fair Value Gap (FVG)
• drawing support/resistance (S/R) lines
🔹 Forming of FVG
1 basic principle: when a FVG at the end of the SB session is not retraced, it will be made invisible.
Dependable on the settings, different FVG's will be shown.
• 'All FVG': all FVG's are shown, regardless the trend
• 'Only FVG's in the same direction of trend': Only FVG's are shown that are similar to the trend at that moment (trend can be visualized by enabling ' Show ' -> ' Trend ')
-> only bearish FVG when the trend is bearish vs. bullish FVG when trend is bullish
• 'strict': Besides being similar to the trend, only FVG's are shown when the closing price at the end of the SB session is:
– below the top of the FVG box (bearish FVG)
– above bottom of the FVG box (bullish FVG)
• 'super-strict': Besides being similar to the trend, only FVG's are shown when the FVG box is NOT broken
in the opposite direction AND the closing price at the end of the SB session is:
– below bottom of the FVG box (bearish FVG)
– above the top of the FVG box (bullish FVG)
' Super-Strict ' mode resembles ICT lectures the most.
🔹 Drawing support/resistance lines
When the SB session has ended, the script draws potential support/resistance lines, again, dependable on the settings.
• Previous session (any): S/R lines are fetched between current and previous session.
For example, when current session is ' AM SB Session (10 AM — 11 AM) ', then previous session is
' London Open SB (3 AM — 4 AM) ', S/R lines between these 2 sessions alone will be included.
• Previous session (similar): S/R lines are fetched between current and previous - similar - session.
For example, when current session is ' London Open SB (3 AM — 4 AM)' , only S/R lines between
current session and previous ' London Open SB (3 AM — 4 AM) ' session are included.
When a new session starts, S/R lines will be removed, except when enabling ' Keep lines (only in strict mode) '
This is not possible in ' All FVG ' or ' Only FVG's in the same direction of trend ' mode, since the chart would be cluttered.
Note that in ' All FVG ' or ' Only FVG's in the same direction of trend ' mode, both, Support/Resistance lines will be shown,
while in Strict/Super-Strict mode:
• only Support lines will be shown if a bearish FVG appears
• only Resistance lines if a bullish FVG is shown
The lines will still be drawn the the end of the SB session, when a valid FVG appears,
but the S/R lines will remain visible and keep being updated until price reaches that line.
This publication contains a "Minimum Trade Framework (mTFW)", which represents the best-case expected price delivery, this is not your actual trade entry - exit range.
• 40 ticks for index futures or indices
• 15 pips for Forex pairs.
When on ' Strict/Super-Strict ' mode, only S/R lines will be shown which are:
• higher than the lowest FVG bottom + mTFW, in a bullish scenario
• lower than the highest FVG bottom - mTFW, in a bearish scenario
When on ' All FVG/Only FVG's in the same direction of trend ' mode, or on non-Forex/Futures/Indices symbols, S/R needs to be higher/lower than SB session high/low.
🔶 SETTINGS
(Check CONCEPTS for deeper insights and explanation)
🔹 Swing settings (left): Sets the length, which will set the lookback period/sensitivity of the Zigzag patterns (which directs the trend)
🔹 Silver Bullet Session; Show SB session: show lines and labels of SB session
Labels can be disabled separately in the ' Style ' section, color is set at the ' Inputs ' section.
🔹 FVG
– Mode
• All FVG
• Only FVG's in the same direction of trend
• Strict
• Super-Strict
– Colors
– Extend: extend till last bar of SB session
🔹 Targets – support/resistance lines
– Previous session (any): S/R lines fetched between current and previous SB session
– Previous session (similar): S/R lines fetched between current and previous similar SB session
– Colors
– Keep lines (only in strict mode)
🔹 Show
– MSS ~ Session: Show Market Structure Shift , only when this happens during a SB session
– Trend: Show trend (Zigzag, colored ~ trend)

Statistics: High & Low timings of custom session; 1yr historyGet statistics of the Session High and Session Low timings for any custom session; based on around 1yr of data.
//Purpose:
-To get data on the 'time of day' tendencies of an asset.
-Narrow in on a custom defined session and get statistics on that session.
//Notes:
-Input times are always in New York time (but changing the timezone after setting WILL adust both table stats and background highlight correctly.
-For particularly long sessions, make sure text size is set to 'tiny' (very long vertical table), or adjust table to display horizontally.
-You'll notice most assets show higher readings around NY equities open (9:30am NY time). Other assets will have 'hot-spots' at other times too.
-Timings represent the beginning of a 15m candle. i.e. reading for 15:45 represents a high occurring between 15:45 and 1600.
-Premium users should get 20k bars => around 1year's worth of data on a 15minute chart. Days of history is displayed in the top left corner of the table.
//Limitations
-only designed and working on 15minute timeframe (to gather a full year of meaningful/comparable % stats, need 15minute 'buckets' of time.
-sessions cannot cross through midnight, or start at midnight (00:15 is ok). 00:15 >> 23:45 is the max session length. On BTC, same applies but 01:00 instead of midnight (all in NY time).
-if your session crosses through 'dead time' (e.g. 17:00-18:00 S&P NY time); table will correctly omit these non-existent candles, but it will add on the missing hour before the start time.
//Cautionary note:
-Since markets are not uncommonly in a trending state when your defined session starts or ends, the high/low timings % readings for start and end of session may be misleadingly high. Try to look for unusually high readings that are not at the start/end of your session.
Wheat (ZW1!) 15min chart; Table displayed vertically:
Nasdaq (NQ1!) 15m chart; Table displayed horizontally and with smaller text to view a very long custom session:

Session TPO Market ProfileIntroduction
Wikipedia: A Market Profile is an intra-day charting technique (price vertical, time/activity horizontal) devised by J. Peter Steidlmayer, a trader at the Chicago Board of Trade (CBOT), ca 1959-1985. Steidlmayer was seeking a way to determine and to evaluate market value as it developed in the day time frame. The concept was to display price on a vertical axis against time on the horizontal, and the ensuing graphic generally is a bell shape--fatter at the middle prices, with activity trailing off and volume diminished at the extreme higher and lower prices. In this structure he recognized the 'normal', Gaussian distribution he had been introduced to in college statistics.
Important : The market profile tool is designed to be used on the 30min timeframe, however, you can modify its parameters and use it on lower timeframes (15/10/5min)
This indicators displays the following information
Session open
TPO
Value area calculation zone
POC
Highlight of Single prints
Session High/Low
The current price (TPO Profile is often used isolated without any candlesticks on it)
Parameters
Session beginning configuration (not coded with a session input yet)
Number of candles to use for calculation (default 13 for a single session)
Extend yesterday's levels (VAH/VAL/POC)
Show/Hide Market profile calculation area (background color)
Bars number (number of rows that will be used to draw the profile)
Show/Hide TPO's
TPO Colors customization (For in/out of VA, VAL/VAH/POC/High/Low levels and single prints)
Show/Hide High/Low levels
Show/Hide VAL/VAH/POC Levels as lines
Enable/Disable Single prints highlighting
Value area size (as percent)
Show/Hide current price (corresponding to a line scaled on the "close" price)
Additional Notes
Each session is drawn when the day is over
To use as much space as possible, TPO's are not directly drawn on the area of their calculation (which can be confusing if you use candlesticks directly over it)
This script will probably be updated in the future (especially concerning its implementation which is a bit spaghetti coded for now) .
If you have interesting suggestions about new features that are usual within market profile tools and missing from this script , don't hesitate to suggest it.

ICT Asian Range |MC|ICT Asian Range |MC| Indicator
💎 Overview 💎
Automatically highlights the Asian trading session on the chart with session High, Low, Midline, and a shaded box. Shows both current and previous sessions for quick reference.
Range Definition: Identify the highest and lowest prices during this session
Trading Setup: Use the defined range to anticipate future breakouts or liquidity sweeps
💎 Key Inputs 💎
ICT Session Range Time: 7:00pm – 0:00am EST (default, 👉 customizable)
Label Text customizable: e.g. “ASIA RANGE”
Line Colors: High/Low (customizable)
Line Style & Width:(customizable)
Midline: optional, calculated as session average
Box Color: (customizable)
Extension: how far lines extend into the future (customizable)
Happy Trading!

NYSE Open Close Session Map by o0psiNYSE Open Close Session Map by o0psi
This indicator highlights the regular US cash session window (default 09:30–16:00 New York time) and makes the key session bars obvious on the chart.
What it shows
A marker on the session OPEN bar
A marker on the session CLOSE bar (last in-session candle)
Optional background highlight for the full session window
Optional labels for the session high and session low bars (based on intraday price during the session)
How it works
The script detects bars inside the selected session window (New York timezone). It anchors OPEN on the first in-session bar, updates the session high/low while the session is active, then anchors CLOSE on the final in-session bar and labels the high/low bars where they occurred.
Notes
Session range precision depends on chart timeframe (lower timeframes capture extremes more precisely).
This is a charting/visualization tool and does not provide trading advice.
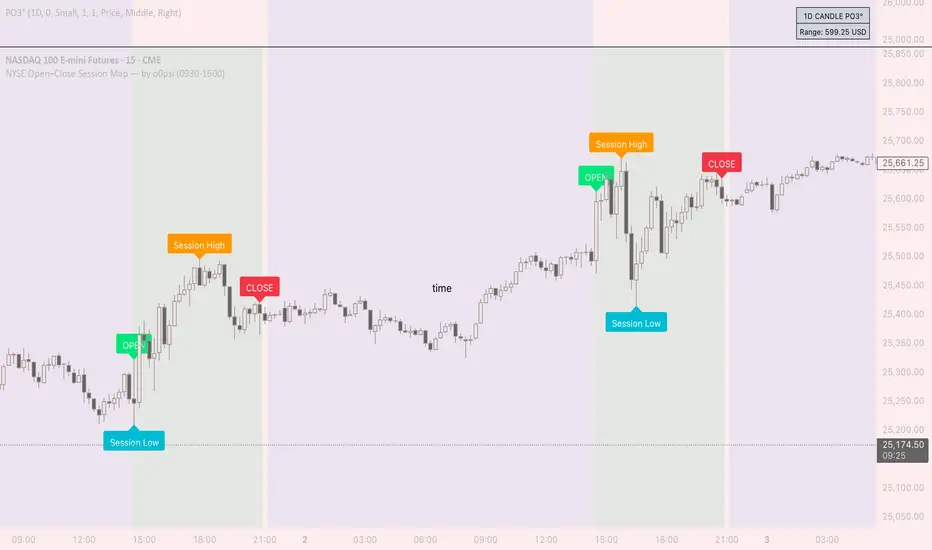
J&A Sessions & NewsProject J&A: Session Ranges is a precision-engineered tool designed for professional traders who operate based on Time & Price. Unlike standard session indicators that clutter the chart with background colors, this tool focuses on Dynamic Price Ranges to help you visualize the Highs, Lows, and liquidity pools of each session.
It is pre-configured for Frankfurt Time (Europe/Berlin) but is fully customizable for any global location.
Key Features
1. Dynamic Session Ranges (The Boxes) Instead of vertical stripes, this indicator draws Boxes that encapsulate the entire price action of a session.
Real-Time Tracking: The box automatically expands to capture the Highest High and Lowest Low of the current session.
Visual Clarity: Instantly see the trading range of Asia, London, and New York to identify breakouts or range-bound conditions.
2. The "Lunch Break" Logic (Unique Feature) Institutional volume often dies down during lunch hours. This indicator allows you to Split the Session to account for these breaks.
Enabled: The script draws two separate boxes (Morning Session vs. Afternoon Session), allowing you to see fresh ranges after the lunch accumulation.
Disabled: The script draws one continuous box for the full session.
3. Manual High-Impact News Scheduler Never get caught on the wrong side of a spike. Since TradingView scripts cannot access live calendars, this tool includes a Manual Scheduler for risk management.
Input: Simply input the time of high-impact events (e.g., CPI, NFP) from ForexFactory into the settings.
Visual: A dashed line appears on the chart at the exact news time.
Audio Alert: The system triggers an alarm 10 minutes before the event, giving you time to manage positions or exit trades.
Default Configuration (Frankfurt Time)
Asian Session: 01:00 - 10:00 (Lunch disabled)
London Session: 09:00 - 17:30 (Lunch: 12:00-13:00)
New York Session: 14:00 - 22:00 (Lunch: 18:00-19:00)
How to Use
Setup: Apply the indicator. The default timezone is Europe/Berlin. If you live elsewhere, simply change the "Your Timezone" setting to your local time (e.g., America/New_York), and the boxes will align automatically.
Daily Routine: Check the economic calendar in the morning. If there is a "Red Folder" event at 14:30, open the indicator settings and enter 14:30 into the News Scheduler.
Trade: Use the Session Highs and Lows as liquidity targets or breakout levels.
Settings & Customization
Timezone: Full support for major global trading hubs.
Colors: Customize the Box fill and Border colors for every session.
Labels: Rename sessions (e.g., "Tokyo" instead of "Asia") via the settings menu.
