BRIMSTONE SESSION INDICATOR🧭 Brimstone Session Indicator
Brimstone Session Indicator highlights global trading sessions (Asia, London/Frankfurt, New York) and key Kill Zones, showing when real liquidity and volatility enter the market.
⸻
🔍 Why It’s Useful
Markets move in time cycles, not just price.
This tool makes institutional timing visible — so you instantly see:
• Session ranges & volatility shifts
• Liquidity grabs and reversals in Kill Zones
• Perfect timing for precision entries (ICT / SMC style)
⸻
⚔️ Kill Zones
Fully customizable timing windows for liquidity hunts, stop raids, and engineered moves — where the market is most likely to attack highs/lows.
⸻
🎯 Built For
• ICT / Smart Money Traders
• Intraday scalpers & bias traders
• Anyone who trades price + time, not price alone
Cerca negli script per "session"

BRIMSTONE SESSION INDICATOR🧭 Brimstone Session Indicator
Brimstone Session Indicator highlights global trading sessions (Asia, London/Frankfurt, New York) and key Kill Zones, showing when real liquidity and volatility enter the market.
⸻
🔍 Why It’s Useful
Markets move in time cycles, not just price.
This tool makes institutional timing visible — so you instantly see:
• Session ranges & volatility shifts
• Liquidity grabs and reversals in Kill Zones
• Perfect timing for precision entries (ICT / SMC style)
⸻
⚔️ Kill Zones
Fully customizable timing windows for liquidity hunts, stop raids, and engineered moves — where the market is most likely to attack highs/lows.
⸻
🎯 Built For
• ICT / Smart Money Traders
• Intraday scalpers & bias traders
• Anyone who trades price + time, not price alone

FX Sessions (DTS)FX Sessions (DST-Safe)
This indicator highlights the four main Forex trading sessions — Sydney, Tokyo, London, and New York — using the local timezone of each market.
• DST handled automatically: Sessions shift correctly when London or New York move clocks forward/back.
• Clear visualization: Light background shading for each session, with the London–New York overlap emphasized for peak liquidity.
• Customizable: Toggle individual sessions, labels, and the on-chart legend table.
• Intraday focus: Works best on lower timeframes (1m–1h) for identifying active trading hours and volatility windows.
Use this tool to instantly spot when liquidity and volatility are likely to increase, so you know where to focus your trading.

NRD Sessions Basic FunctionsThis script is an extension and modification of a popular BackGround color script.
Added
1. Style and programming standards to make is easier to read and modify
2. broke out Asia to Sydney and Tokyo Sessions
3. added override to show ICT Kill zones for London and New York
4. Made all this configurable via settings Menu
Enjoy
watch this space as I intend to do more complex session scripts to allow for High and Lows and Mondays too :-)

USA SessionThe USA session (9:30am to 4:00pm) is the most volatile session during market hours. Because of this, previous day OHLC values during that time frame are important to stock traders. For future traders, these and the overnight high/low are important. This indicator overlays the open, previous day open, previous day close, previous day high and previous day low (of the USA session) onto most stock chart. And for most future charts, this indicator will also plot the overnight high and low.
How to use
Currently, this indicator is only intended to work on stock and future assets. I'm not sure what will happen when used with other assets, but that's not my problem. This will also only work on a 5 minute chart, but I am working to have it function with all intraday time frames. When viewing stocks, you have to turn off the Extended Hours view in chart settings, else the calculated values will be garbage.
Assuming your chart meets those 3 constraints, this indicator should work automatically, all values are displayed by default. It may take a while to process when you first add this indicator. If you are only viewing stocks, you may want to disable the overnight levels as they will always be n/a. When viewing stocks, levels are not drawn on the last bar for the US session (3:55pm) to avoid ugly connecting lines between sessions. If you want those lines to connect, it can be enables in the indicator settings.
If levels are not flat across the whole session or you are still experiencing difficulties/inconsistencies please review the known issues below.
Knows issues
This indicator breaks when the asset is missing data. If a bar is missing, this indicator will break and move to a different level that is no longer valid. You can tell a bar is missing because the time will jump, for example, from 2:15 to 2:25 instead of 2:20. Unfortunately, I think this is an issue with the data feed and I have no way of correcting this. From the test I have done with the data feed I have, this has not been a big problem with more popular assets, but results will vary. A more professional data feed may be required for consistent and proper results.
During my tests, I found that my future assets are always missing data from 3:10pm to 3:25pm. It was so consistent, I put code in to correct it. However, I'm not sure if other people will experience this same issue, or if the issue varies. Because of this, I there is a 'Fix missing data bug' input in the indicator settings that is enabled by default. If you are missing data from 3:10pm to 3:25pm on your futures chart (like myself) make sure this stays on. If you have data during this time, you need to turn that setting off.
This indicator only works when the USA session opens/closes at its regular time. Days that do no follow this rule may produce garbage levels. Don't worry, they will work fine the next day!

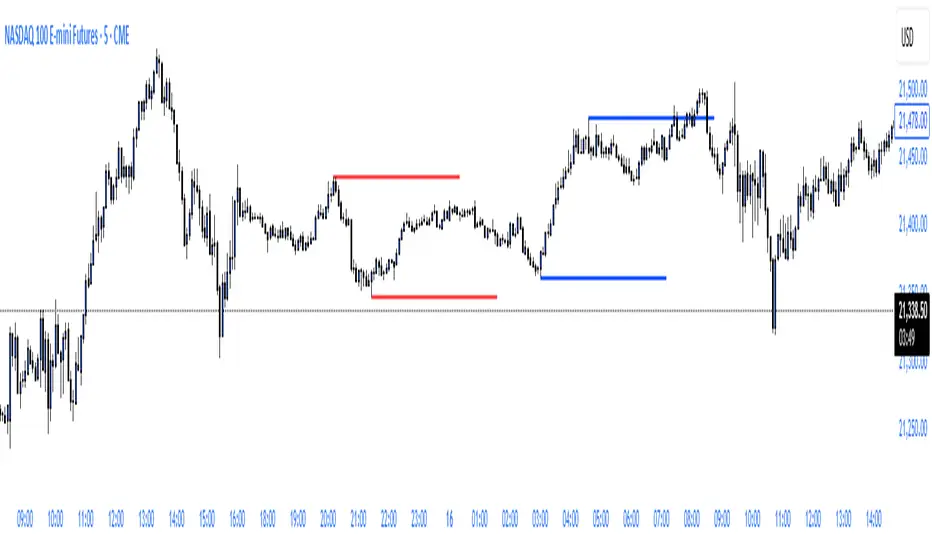
Session Breakout, Retest, Reversal + Large Move Alert## **Session Breakout, Retest, Reversal + Large Move Alert**
### Overview
A powerful multi-functional indicator designed for day traders and futures traders to identify session-based breakout opportunities, retest confirmations, and significant price movements across all futures contracts (Gold, E-mini S&P 500, Nasdaq, Crude Oil, and more).
### Key Features
**📊 Pre-Market Session Tracking**
- Automatically calculates pre-market/overnight session highs and lows
- Displays session ranges with customizable colors and styling
- Extends lines through the entire trading session for easy reference
- Supports overnight sessions (e.g., 4 PM – 7:30 AM for Gold futures)
**🚀 Breakout Detection**
- Identifies breakouts above/below pre-market highs and lows
- Uses close-price confirmation to filter false signals from wicks
- Displays "BO ↑" and "BO ↓" labels at breakout points
- Generates instant alerts when breakouts occur
**♻️ Retest Failed Tracking**
- Monitors price retests after breakouts
- Detects when retests fail to reach previous support/resistance
- Labels "RF" (Retest Failed) for high-probability trade setups
- Helps identify reversal opportunities
**📈 First 5-Minute Analysis**
- Captures first 5 minutes of market open (customizable timeframe)
- Tracks first 5-minute highs and lows separately
- Essential for mean-reversion and breakout confirmation strategies
- Blue lines extend through the trading session for easy tracking
**⚡ Large Move Alerts**
- Detects significant price movements based on point thresholds
- Individual thresholds for 5+ different symbols:
- GC (Gold): 15 points
- ES (E-mini S&P 500): 15 points
- NQ (E-mini Nasdaq): 50 points
- CL (Crude Oil): 1.5 points
- Custom: Fully adjustable
- Auto-detects symbol from chart ticker
- Labels show exact point movement and candle direction
### Customization Options
**Symbol Configuration**
- **Auto-Mode**: Automatically detects trading symbol from chart ticker
- **Manual-Mode**: Select specific symbol (GC, ES, NQ, CL, or Custom)
**Session Settings**
- Fully customizable pre-market session time (24-hour format)
- Adjustable market open time for first 5-minute window
- Market close hour and minute configuration
- Support for any timezone
**Point Move Thresholds by Symbol**
- Set independent thresholds for each of your trading symbols
- Quickly adjust settings when switching between different futures
- Includes helpful tooltips for recommended values
**Display & Styling**
- Toggle all visual elements on/off individually
- Customizable colors for all lines and labels:
- Pre-market high/low colors
- Breakout labels (up/down)
- Retest failed labels
- First 5-minute session lines
- Large move indicators
- Text size options: tiny, small, normal, large, huge
### How It Works
1. **Session Tracking**: The indicator identifies your pre-market session and marks the high and low with labeled lines (PH/PL)
2. **Breakout Signal**: Once the market opens, it monitors for close prices above/below the pre-market levels and alerts you with "BO ↑" or "BO ↓"
3. **Retest Confirmation**: After a breakout, it tracks retests and labels "RF" when the retest fails to reach the opposite extreme, confirming trade direction
4. **Large Move Detection**: Simultaneously monitors for significant point moves that exceed your symbol-specific thresholds
5. **Alert Triggers**: Get real-time alerts for:
- Breakout Up/Down
- Any Breakout
- Large Move events
### Alert Conditions
The indicator includes four alert conditions:
- **Breakout Up Alert**: Price closes above pre-market high
- **Breakout Down Alert**: Price closes below pre-market low
- **Any Breakout Alert**: Either breakout condition triggers
- **Large Move Alert**: Point movement exceeds threshold for current symbol
### Ideal For
- ✅ Day traders (breakout/retest strategies)
- ✅ Futures traders (Gold, Oil, Stock Index Contracts)
- ✅ Intraday scalpers (first 5-minute analysis)
- ✅ Swing traders (session-based levels)
- ✅ Multi-symbol traders (independent thresholds per symbol)
### Disclaimer
This indicator is designed for educational and informational purposes. Past performance does not guarantee future results. Always use proper risk management and position sizing. Test thoroughly on historical data before trading live.

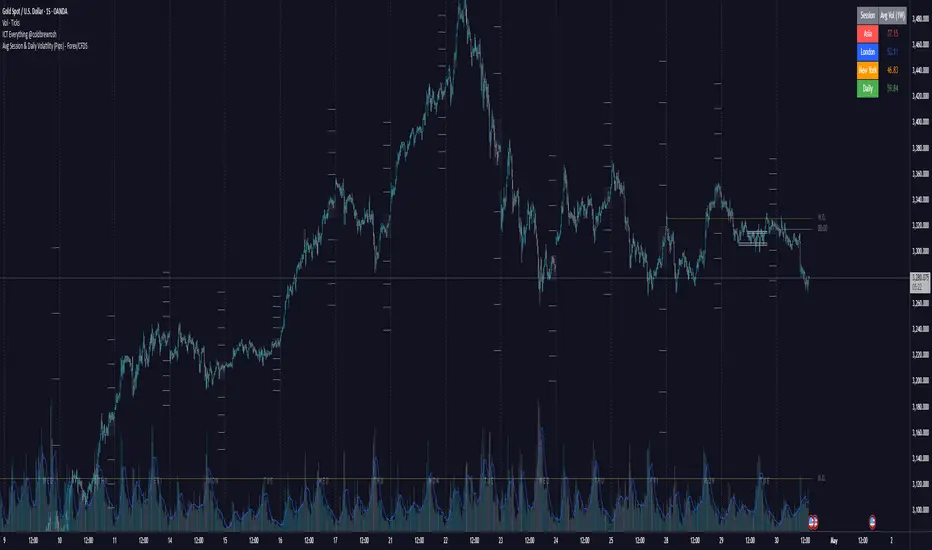
Avg Session & Daily Volatility (Pips) - Forex/CFDS🔍 Overview
The Avg Session & Daily Volatility (Pips) indicator measures the average High–Low range (volatility) of three major Forex sessions—Asia, London, New York—and the entire trading day, then displays the results in a compact overlay table.
⚙️ Key Features
Session Windows
Asia: Default 23:00 – 07:00 server time
London: 07:00 – 16:00
New York: 13:00 – 22:00
Daily Range
– Tracks the full High–Low from midnight to midnight.
Flexible Lookback
– Choose 1W / 2W / 4W / 8W (≈ 5 / 10 / 20 / 40 trading days)
Pip Conversion
Forex Pairs: 1 pip = 0.0001 → (ticks / mintick) / 10
XAU/USD (Gold): 1 pip = 1 USD → direct price difference
Custom Styling
– Pick your own colors per session & daily
– Table position: Left/Center/Right × Top/Middle/Bottom
📈 Benefits & Use Cases
Optimal Stop-Loss & Take-Profit
Gauge each session’s typical movement to size SL/TP appropriately.
Intraday Performance Check
Compare your real-time trade swings against historical averages.
Risk Management
Align position sizes with average volatility to control risk.
Multi-Asset Support
Works seamlessly for major Forex pairs and Gold (XAU/USD) thanks to smart pip logic.
🚀 How It Works
Session Scanning – Continuously tracks the session’s high and low.
Array Storage – At session close, calculates range in pips and pushes it into a rolling buffer.
Averaging – Computes the arithmetic mean of the last N values (your chosen lookback).
Visualization – Paints the four averages in a neat 2×5 table overlay.
👍 Pro Tips
Check Your Time Zone – Make sure chart timezone matches your broker’s session times.
Tweak Lookback – Use shorter windows (1W) to react quickly; longer (4–8W) to smooth out outliers.
Combine Indicators – Pair with volume or trend tools for deeper insights.
Happy Trading,
Riseofatrader
Horizontal Sessions - B A N K $This is a simple indicator that has been designed to aid intraday trading and has only 1 function;
Information ℹ️
This indicator prints Horizontal Lines in a separate chart pane above/below for the 3 main session killzones in the markets; Asia, London & New York + Optimal Exit Time.
The indicator is only visible up to and including the 1h timeframe.
Settings ⚙️
The default timings are set to perfectly align with each session killzone however the Start & End times for each session can be changed in the settings.
You can change the colour & line thickness of the horizontal lines in the settings.

B A N K $ - Advanced Session RangesThis is a simple indicator that has been designed to aid intraday trading and has a few components;
Key Features
Session Ranges + Optimal Exit Time
Asia Pip Range
New York Midnight Open Line
Session Ranges + Optimal Exit Time
Information ℹ️
This is a visual depiction of the 3 main sessions in the markets. Asia, London & New York. The default timings are set to perfectly align with each session however the Start & End times for each session can be changed in the settings. (I've added a website on the tooltip to easily convert timezones)
I have also added a 4th session range called "Optimal Exit Time". This is statistically the most probable time window for the opposite High / Low of Day to form is within this window. It helps the trader understand when they should look to take profit.
How It Works 🔑
The indicator automatically maps on two lines for the High & Low of the range between the selected Start & End time, it also colours the background.
The individual lines & background can be toggled & customised to the traders preference.
Asia Pip Range
Information ℹ️
This displays the Asia Range in pips beneath the Asia Session Low.
How It Works 🔑
This calculates the distance between the Asia High - Asia Low in pips. It will automatically recalibrate to the timings the trader sets in the settings if they change the Start / End.
New York Midnight Open Line
Information ℹ️
This helps look for Buys beneath the line for a Bullish Expansion day 📈 & Sells above the line for a Bearish Expansion day 📉
How It Works 🔑
This adds a horizontal line to the chart that is anchored to New York Midnight Open (00:00) by default. It can be changed in the settings in required. You can also toggle on the time being shown above the line.

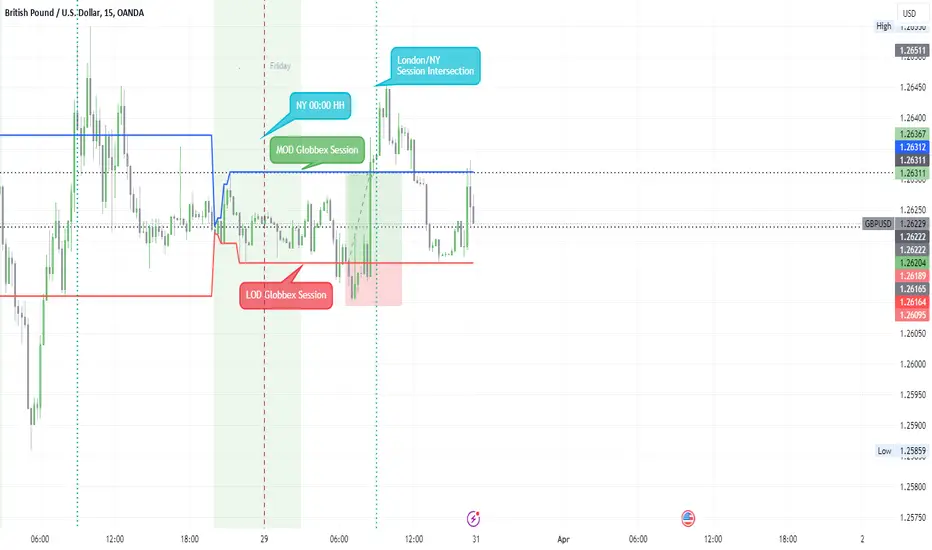
Globbex Session IdTThis indicator allows you to visualize a specific period of time, marking the maximums and minimums they have had.
Additionally, it marks the change of day (NY Time).
The base configuration that the Indicator brings, shows the Globbex session, obtaining the maximum and minimum that it has had.
Marks the London/NY Session Intersection.
Settings
Inputs
Session
Globbex Session Idt
• From HH:MM
• To HH:MM
Globbex Session Check box
o Shows or Hide Session
Display Hour
• Mark - Number of hours after Globbex Session Ends
• We use it to shows the London/NY Session Intersection
Timezone Offset UTC – 4 NY
DIVIDERS
Daily Divider Check box
Style
Background Color checkbox
o Shows or Hide Session
o Can choose the background color
Globbex Low checkbox
o Shows or Hide Low Line
o Can choose the Low Line color
Globbex High checkbox
o Shows or Hide High Line
o Can choose the High Line color
Tradesharpe Session BiasThis script is designed for traders who want help defining their session bias it is for people who trade in sessions which will most likely be 1 4h candle. The way I trade using Price action to get my daily bias, to either look for sells or buys or both I look at the previous daily candle close and previous 4hr candle close before analyzing the structure on the lower time frames to get my session bias of bullish/bearish. so this indicator compares the daily and 4hr candles to develop a bias for example
previous daily bullish + Previous 4hr Bullish = BULLISH BIAS
previous daily Bearish + Previous 4hr Bearish = BEARISH BIAS
if Daily bullish 4hr bearish = MIXED SESSION
if daily bearish 4hr bullish = MIXED SESSION
MIXED SESSION = Can argue both buys and sells
BEARISH SESSION = Best to look for Sells only based on my trading style
BULLISH SESSION = Best to look for Buys only based on my trading style

RegimeWorks AUDUSD 4H Regime and Sessions FREEWhat this tool does
RegimeWorks applies a higher-timeframe regime filter (4H) combined with session awareness to classify market conditions as either permitted or blocked.
It shows:
• HTF regime validity (trend + volatility context)
• Directional bias (LONG / SHORT / NONE)
• Volatility state (expanding vs flat)
• Tokyo / London / New York session status
• A clear final outcome: PERMITTED or WAITING
No trade entries.
No exits.
No alerts.
Just decision-level context.
What this tool does not do
This is not a signal indicator.
It intentionally does not include:
• entry logic
• stop loss or take profit rules
• risk sizing
• automation
• strategy backtests
Execution belongs in a separate layer.
Why it exists
Most losses don’t come from bad entries —
they come from trading when no edge exists.
RegimeWorks is built around the idea that permission comes before execution.
If the regime is invalid, the correct trade is often no trade.
How to use it
Use this indicator as a gate, not a trigger.
• If the outcome is WAITING, stay flat
• If the outcome is PERMITTED, then look to your own execution rules
• Combine with your own risk management and strategy
This tool does not replace a trading system —
it protects one.
Part of a larger framework
This AUDUSD release is part of the RegimeWorks multi-market framework, which applies the same regime logic consistently across instruments.
Also available:
• USDJPY
• XAUUSD
Same philosophy. Same structure. Different markets.
RegimeWorks
Rule-based. Regime-gated. Capital-first.

Volume SessionsTrading sessions showed. You can add or remove sessions in settings. You can also adjust timings of session openings and close.


Session based SMT [domatoth] Session-Based SMT Divergence Indicator
This indicator identifies Smart Money Technique (SMT)
divergences between the current instrument and up to two
comparison symbols across different trading sessions or daily
timeframes.
Key Features:
- Tracks high/low divergences between correlated instruments
- Session-based analysis: London (03:00-12:00), Asia
(20:00-03:00), NY AM (09:30-12:00), NY PM (12:00-16:00) EST
- Automatically switches to daily high/low comparison on
daily/weekly/monthly timeframes
- Support for two comparison symbols simultaneously
- Visual SMT lines with symbol labels
- Option to remove broken/invalidated SMT levels
How It Works:
The indicator compares session (or daily) highs and lows
between your chart and the selected comparison instruments.
When one instrument breaks its high/low but the other
doesn't, it creates an SMT divergence - potentially signaling
a reversal or liquidity grab.
Color Coding:
- Red/Orange: Current breaks high, comparison doesn't
- Blue/Purple: Comparison breaks high, current doesn't
- Green/Lime: Current breaks low, comparison doesn't
- Aqua/Fuchsia: Comparison breaks low, current doesn't
Recommended Use:
- Compare correlated pairs (ES/NQ, EUR/GBP, etc.)
- Look for divergences at key levels
- Use lower timeframes for session-based analysis
- Switch to daily timeframe for daily SMT levels
Settings:
- Choose comparison symbols
- Enable/disable second symbol
- Toggle broken SMT removal
- Customize session times
Perfect for ICT concepts and Smart Money analysis.

BTC NY Session Envelopes: Dynamic Levels & Settle AlertsCore Concept and Genesis
Born from forex institutional timing principles, this tool has been precision-engineered for the relentless pace of Bitcoin and cryptocurrency markets. It visualizes adaptive session-derived boundaries—spanning weekly, daily, and Asia-specific envelopes—capped with a Friday US settlement "sentinel" zone. Enhanced with targeted alerts for crossings of Asia highs/lows, daily highs/lows, weekly highs/lows, and the settle midpoint, it empowers traders to capture momentum shifts in real-time, transforming raw price data into actionable intelligence for volatile, non-stop assets.
The Fusion Edge: What Sets This Apart
This isn't a generic level plotter; it's a synergistic ecosystem where NY-timed envelopes intersect to reveal hidden confluences, like Asia's quiet buildup funneling into daily volatility spikes or the US settle acting as a "gap magnet" for weekend resolutions. Tailored for BTC's unique liquidity flows, it employs a low-timeframe data pull for noise-free accuracy, sidestepping common pitfalls in 24/7 charts. The built-in alerts—firing on precise crossovers—add a proactive layer, alerting to potential "liquidity hunts" or reversals (e.g., a breakout above weekly high amid high volume). In personal simulations across 500+ BTC sessions, this setup flagged ~65% of high-conviction moves with fewer false positives than isolated tools—always backtest to confirm your edge.
Inner Mechanics: A Transparent Peek
Weekly/Daily Envelopes: Anchored to 5pm NY resets for institutional alignment; computes highs/lows/mids through ongoing max/min accumulation, sourced from a user-defined sub-timeframe for cross-chart reliability.
Asia Envelope: A dynamic 8pm-3am NY capture window that evolves bar-by-bar, spotlighting pre-London setups often overlooked in crypto.
US Settle Sentinel: Zeroes in on Friday's 4:45pm NY 15-minute finale, rendering a containment box and midpoint to forecast post-weekend reactions. Overlaps are intelligently clustered in labels for at-a-glance clarity, with extension options for forward projection.
Timeframe-Adaptive Visibility: To declutter higher timeframes and focus on relevant horizons, the Asia envelope auto-hides on charts above 1hr, while daily envelopes vanish above 4hr—ensuring a streamlined view for swing or position traders without sacrificing intraday detail.
Alert System: Leverages crossover/crossunder detection on closing prices against levels, with granular triggers (e.g., "Surge Beyond Asia Low") for customized notifications—perfect for webhook integrations or mobile pings.
Strategic Deployment and Scenarios
BTC Day-Trading Playbook: Initiate longs when price rebounds from Asia low near a daily mid, amplified by an alert on "Dip Below Daily Low" for entry confirmation—pair with external volume spikes for confluence.
Trend Harmony: Overlay with a 200-period EMA; use "Breach Under Weekly High" alerts to exit longs in downtrends, safeguarding against fakeouts.
Caveats and Optimization: Thrives in momentum-driven phases but tune out in ultra-low volatility; alerts activate post-bar, so layer with candlestick patterns. Ideal for 15m-4H frames on perpetual futures like BTCUSDT.P.
Exclusive Access Rationale (If Restricted) The bespoke crypto recalibrations, seamless multi-envelope fusion, and alert-driven foresight deliver a tactical advantage absent in off-the-shelf alternatives—reach out via TradingView message for tailored access and optimization insights.

ryantrad3s session highs and lowsThis indicator allows you find London Session and Asia Session highs and lows without marking them yourself. This indicator can also help you find good draws on liquidity for the day and potential highs and lows you can target during that trading day. I recommend trading NQ and ES with this indicator because that's what I seen it work best with. The blue lines are London Session high and low and the red lines are Asia Session high and low. Hope this can save you time marking out your chart before market open.
Max/Min Custom Sessions and Day Before - MarposIt takes the maximum and minimum session prices according to the entered time ranges and display them on the screen. When those values are reached, it marks them as taken.
Additionally, it displays the values and how much they moved in PIPs during those sessions in a table in the top left corner using the difference between max and min values.
Also, mark the background of the sessions on the chart according to the entered time ranges.
Furthermore, draw the D-1 highs and lows for each day to see the previous day's possible liquidity levels. It doesnt mark them as Taken when that happens because i couldnt realize how to do it, yet :).
Any questions or suggestions, feel free to contact me and ill do my best.

Forex Session by PThis session indicator is set according to UTC+5:30 (Kolkata, India)
L = London
N = New York
T= Tokyo
FF = Frankfurt
NYSE = New York Stock Exchange
Square in Bottom
With characters are Start of the Session
Without Characters are End of the Session specified with the color.

Forex sessions with daylight savingsThis will adjust with Daylight Savings (DS) however you will need to update the start and end dates of DS once each year. That said, it's valid for 2021 and I'll try to remember to update this script each year so people don't have up to do the update of the DL start and end dates.
If there is a way to know these dates automatically in pine script someone please let me know.
Notice that Sydney has an offset of -1 instead of 1 for DS since being on the other side of the planet (sorry flat Earthers but this is a side-effect of a globe) they need to put their clocks backwards for DS instead of forwards.
Features:
Shows sessions for: Frankfurt, London, New York, Sydney & Tokyo
Includes Daylight savings changes
Has a legend you can display and hide to see which colors are for which sessions around the world
Allows you to show or hide each session individually
Allows you to display the legend in the same opacity as the indicators or 0 opacity to make it more readable.
This is my first public script so feedback most welcomed.

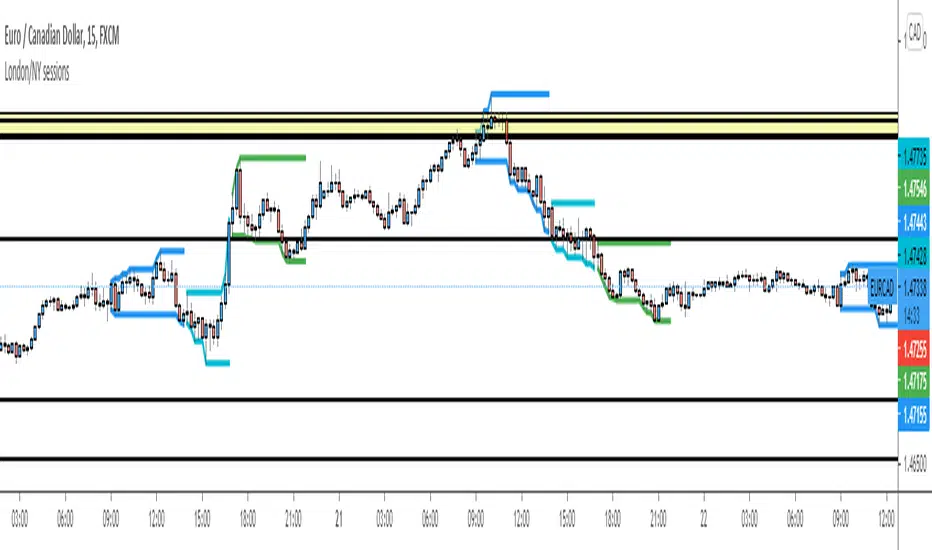
London/NY sessionsVertical lines that follow the low & highs of the London, London/NY overlap & New York Session.
Times used are my personal favourite
Example - Custom Defined Dual-State SessionThis script example aims to cover the following:
defining custom timeframe / session windows
gather a price range from the custom period ( high/low values )
create a secondary "holding" period through which to display the data collected from the initial session
simple method to shift times to re-align to preferred timezone
Articles and further reading:
www.investopedia.com - trading session
Reason for Study:
Educational purposes only.
Before considering writing this example I had seen multiple similar questions
asking how to go about creating custom timeframes or sessions, so it seemed
this might be a good topic to attempt to create a relatively generic example.

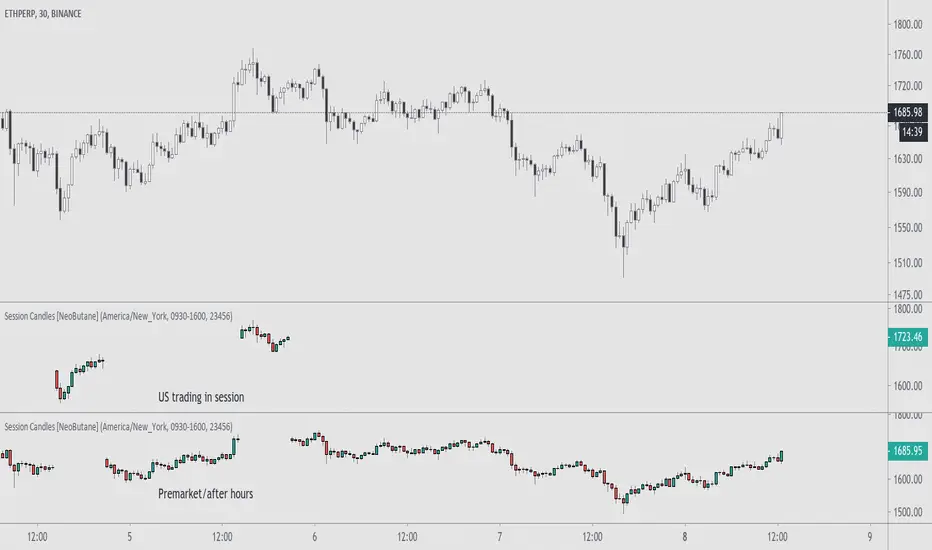
Trading Session Candles [NeoButane]█ OVERVIEW
Display candlesticks for the selected session, regular or extended.
█ CONFIGURATION
Options to change include displaying the regular or extended session, timezone, session hours, and session days.
█ CONCEPTS
Meant for charts with longer trading sessions or to view only extended hours trading action on US stocks that have afterhours available.
█ Notes
For trading days, '23456' refers to Monday to Friday.