TrendShift Pro v1.1TrendShift uses a unique series of moving average calculations to signal shifts in trend direction that goes above and beyond what is possible with common moving average trading techniques like simple moving average crosses.
What makes TrendShift different :
Unique moving average calculations - The unique calculations allow signals of shifts in trend direction to occur quickly but also avoid the chop and frequent flipflops that are common with standard moving average trading technique.
Trading filtering - A clear method of trade confirmation and additional trade filtering using popular indicators like the Ichimoku Cloud and Parabolic SAR which work synergistically with the unique moving average calculations and add additional layers of caution and refinement to filter out unreliable signals.
Dynamic trailing stoploss – A dynamically adjusted fractal stop which provides a unique and effective method of managing risk while capturing the duration of a trending move.
Strict trading criteria – Unambiguous and clearly signaled entries along with a comprehensive risk management framework and robust back-testing tools which are design to reduce discretion and subjective input as much as possible.
Features :
Clearly signaled shifts in trend direction.
Built in optimization for different trading instruments.
Custom inputs for self-optimization.
Adjustable methods of confirming trend shift signals.
Trading filtering using popular trend indicators.
Key support and resistance level displays.
Customizable display options.
Risk management using customizable adjustable trailing stop loss and position size management tools.
Customizable backtesting tools.
Customizable alert messages.
Settings :
Entry Settings:
Entry Type : for entering trades via signal candle or signal candle confirmation.
Trade type : for long only, short only, or long and short trading.
Trend Optimization : contains optimized settings for Bitcoin , Ether, and Altcoins as well as the ability to customize your own settings.
Trading Filters : allows refining signal strength by using EMAs, Ichimoku Cloud , and Parabolic SAR to filter trades.
Support and Resistance : displays traditional and DM based pivots on various time frames.
Risk Management:
Bars to Form Stoploss : allows for adjustment of bars necessary to dynamically adjust stoploss.
Risk Type : allows for backtesting calculations using % risk to account or leverage.
Display options : allows for displaying trade entry and stop loss levels either near candles or in a table.
Backtesting:
Session : allows filtering by trading session hours.
Day of Week Filter : allows filtering trading by specific day of the week.
Backtesting Time : allows adjustments to backtesting dates.
Alerts : allows for customized alert messages.
Usage :
The indicator is optimized for the 4 hour timeframe. A green bullish or red bearish signal candle indicates there has been a meaningful shift towards the respective trend direction. When a long/short entry signal is given, that means the signal candle has been confirmed and a trade can be entered accordingly.
Once a signal has been generated, a dynamically adjust stoploss will appear and self-adjust every 24-48 hours. Your stoploss should be trailed accordingly.
NOTE: Displayed back-testing results are on Binance:ADAUSDT default settings, from 2018-2023, using 3% risk, and 0.075% commission.
Cerca negli script per "session"

MACD with Support and Resistance - Signals, Alerts, TP and SLMACD with Support and Resistance - Signals Alerts SL and TP by Tech Store On
The script uses MACD for entering/exiting trades and support/resistance lines to take TP1 (take profit 1). Both MACD and support/resistance lines are fully configurable to your preference, and you can back-test it via TradingView. Once TP1 is taken, you can either set the indicator to close the trade at the end of the US trading session day (4PM ET) or you can continue taking partial profits where you wish or just wait until reversal signal alert.
For example: If you will be day trading SPY and you wish to close your positions no matter what right before the market closes (3:45PM ET > 15min before closes): Make sure to checkbox “Intraday – Close Position Before Market Closes” in the strategy/indicator Settings, so that you are alerted soon before the market closes, if you wish to continue holding the position – leave this checkbox unchecked.
SL: SL is set to be slightly above/below the MACD signal candle, which is best suited for this strategy from manual backtesting.
Strategy Take Profit Approach
While the initial position open and SL hit is always based on a closed candle bar (can’t do otherwise, as otherwise you will have 10s of fake signal alerts), there are 2 ways on trading this strategy in terms of TP1 / TP1 taken > back to Entry, which is based off Alert type.
You can switch this as you like within the indicator settings, “Checked: TP1/TP1 taken > back to Entry per Price Touch | Unchecked: per Candle Close”.
Candle Close vs Price Touch: with the Default method - Candle Close for an alert for TP1 or if price comes back to Entry after TP1 is taken will only be triggered once candle bar fully closes crossing the area, while Price Touch will alert when price touches the area before candle bar closes.
For example: your trade is running well, you grab TP1 and the price reverses and hits your trade Entry area. With Price Touch – you are immediately alerted to close your trade with no loss and with TP1 profit. With Candle Close - you will receive an alert only once candle bar fully closes on top of the Entry crossing it backwards, meaning it may lower your TP1 profit or even completely reverse the trade into loss in case it will be a huge candle bar for any reason. However, it may touch the Entry area, looking like the price is reversing, but then continue per initial trade direction, sometimes becoming a trend. So, while Price Touch seem like a more conservative approach, Candle Close can give you much bigger profits if you catch a trend, but you can always change it via the Settings.
Note: TradingView back-testing engine does not have a feature to open/close orders IMMEDIATELY via Price Touch trigger, but only when the candle closes after price touches the scripted area/line/etc., so you for the most accurate results, test your strategy out via Candle Close setting. Otherwise, decide yourself. I personally like more Candle Close since I can test it out via back-testing with the most accurate results.
Note: If you will be observing the strategy LIVE, during LIVE candle bar movement – it will look weird, like it’s placing an order after order during any trigger – this seem like a TradingView bug, but is only observational, once the candle bar is closed and you refresh TradingView it will all look correct.
Back-Testing
If you wish to do some back-testing, just modify the strategy/indicator Settings:
-----1) STRATEGY: This is for back-testing/experimenting with the script inputs.
----------a. You can setup a start date (date, month, year) from which it will start opening back-test trades, select a position size and select TP1 size, the idea here is to close half (or whatever you choose) portion of the trade once you hit your TP1, then to either close at small profit or to catch a trend and close the second portion of the position long way ahead from Entry, otherwise it will alert you to close the position if price comes back to Entry, at reversal signal or at the end of US trading session if the option for it is checked. If you wish to close the whole position at TP1, just enter the same amount for TP1 to match backtest position size. Otherwise you can experiment with TP1 sizing – try it out!
-----2) Feel free to experiment with MACD settings and with S&R Left/Right bars, you may be amazed how results will differ and find some really cool combinations!
-----3) Make sure you select/de-select “Intraday – Close Position Before Market Closes” setting depending on what you are back-testing and on which conditions
-----4) Note: If you wish to do some deep back-testing (1+ years), use the “Deep Backtesting” feature within Strategy Tester on the TradingView as otherwise it may show wrong results or even fail to compute the results
Add the alerts
-----Right-click anywhere on the TradingView chart
-----Click on Add alert
-----Condition: MACD with Support and Resistance - Signals
----------o Right underneath the condition click on the drop-down menu and select “alert() function calls only”
-----Expiration time: Whatever you wish
-----Alert actions: Whatever notifications you wish
-----Alert name: DO NOT TOUCH THIS
-----Hit “Create”
-----Note: If you change ANY Settings within the indicator – you must DELETE the current alert and create a new one per steps above, otherwise it will continue triggering alerts per old Settings!
- Note: If you add the alert while the script is currently “In Position” it will not know that. So either wait when there will be no position open at all or close your position partially if the bot opens it twice bigger or so in case per script the bot will think it is already in position.
Note: Because of the slippage and the order processing time between TradingView, AutoView and the Broker (it’s usually about a second or so), it is suggested to not use a timeframe lower than 1min. The script is working really well with 15M/H1 timeframes per my back-testing, but feel free to explore via Strategy Back-testing what’s best for the instrument you wish to trade.

[BUBBLENUKE] BOB The Reversal Trader=============================================================: BOB The Reversal Trader :=============================================================
COMPONENTS:
- VWAP Anchored at Friday CME close
- Bitcoin CME close
- Volume bars
SETTINGS:
- Asset: BTCUSDTPERP
- Time frame: 30M
- Hard TP %: 1.5
- Hard SL %: 40
- Trading Session Start (UTC): 4
- Trading Session End (UTC): 17
DESCRIPTION:
BOB is a mean-reversion trading system focused in BTCUSDT asset in the 30M time frame. The system is divided into 2 types of entries:
WEEKENDS:
BOB will trigger his entry when the price of Bitcoin is at one of the two deviations from the VWAP anchored at Friday CME close and BOB will take your profits when the price returns to the VWAP. When BOB hits Sunday and the CME reopens, BOB will close all your open positions.
INTRA-WEEK:
BOB will trigger its entry when the price of Bitcoin is at one of the two deviations from the VWAP anchored at the Friday CME close or when a volume candle indicates a reversal. BOB will take your profits when the price returns to the VWAP or when the HARD TP % is reached (1.5% by default). When BOB hits Friday and the CME closes, BOB will close all your open positions.

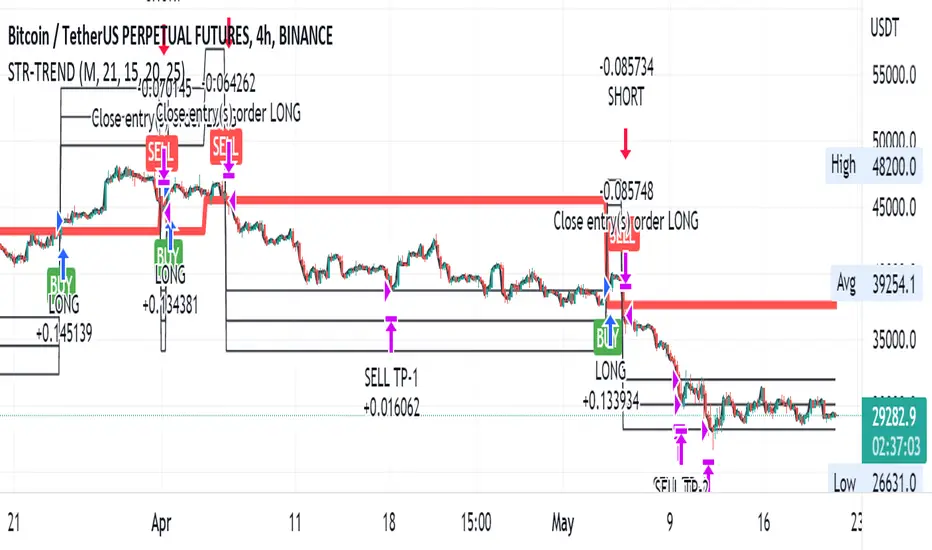
Straight Trend V1Hello everyone,
We are proud to present you our "Straight Trend" Strategy.
Strategy is use a specified timeline's opening price as reference and draw a line between the current price and trend line.
Trend line is smoothed with last X times of highest and lowest values ( Donchian Methodology) in order to create less noise and fake alerts , therefore creates a channel of current prices time based opening price.
The timeline can be adjusted according to your specifications in the settings.
------
Why opening price ?
We are traders ,no matter what we do ,we always make a benchmark at the end of a day , week or at the end of a specified time line.
Example :
X commodity's price increased %15 in last days or Y commodity's price dropped %30 in last 2 weeks etc. etc.
Thats why the opening price have a hidden and much more important role in our trading sessions.
------
After the channel is created we remove the unnecessary lines from our output by filtering the direction with closing price.
IF the closing price is higher than Chanel reference price and direction goes upward the script gives you a BUY signal.
The same methodology is applied for SELL operations.
When to Take Profit?
We put a setting for profit percentage in scripts setting you can adjust the ratio as your choices.
When to Stop Loss or change direction of the trade?
The Straight Trends previously mentioned channel's inverse line was set as STOP LOSS and direction changer in the strategy with "STR-X" Marker.
Note : Strategy is much more effective with heikin-ashi bars due methodology of heikin ashi and with this bars it creates less signals with more accuracy, use at your own discretion.
Please don't hesitate to write us if you need support or assistance, we also appreciate your feedbacks.
Please be advised that this strategy is published with Educational Purposes and it is not a investment advice.
Thank you in advance.
Parabolic SAR Heikin Ashi MTF Candle ScalperThis is scalper strategy designed around parabolic sar indicator, where as an input candle value it uses the heikinashi from a higher timeframe.
This example has been adapted to SPY/SPX chart
In this case ,we are using a 5 min chart, but the calculations are made on a 15 min heikin ashi chart for the PSAR and then on 5 min chart we plot the results.
At the same time we are conditioning the entry to be base on a time/session for daytrading/scalper mentality
In this case we only enter within the first 30 min of SPY opening session , and then we exit after 3-4 hours of staying in the position ( unless we hit a reverse condition).
For long condition we enter when the mtf ha candle close is above the mtf psar and for short condition we enter when the mtf ha candle close is below the mtf psar
This script is made with an educational purpose to show the power of multiple time frame approach compared to a single chart.
If you have any questions, let me know !

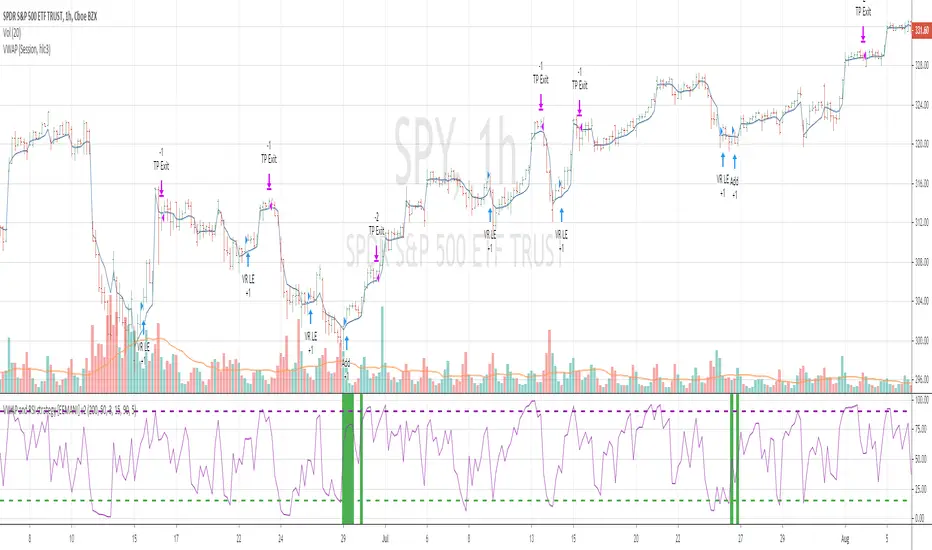
Top 40 High Low Strategy for SPY, 5minThis strategy is developed based on my High Low Index SPY Top 40 indicator
Notes:
- this strategy is only developed for SPY on the 5 min chart . It seems to work with QQQ as well, but it isn't optimized for it
- P/L shown is based on 10 SPY option contracts, call or put, with strike price closest to the entry SPY price and expiry of 0 to 1 day. This includes commissions (can be changed). This is only an estimate calculated using an arbitrary multiplier factor, this can be changed in the setting
- P/L is based on $5000 initial capital
- Works with both regular / extended trading session turned on/off. However, max drawdown is 1/2 with extended trading session ON
- there is still a bug that doesn't allow alert to be created due to calculation error, will update once fixed
This strategy combines signals from the following indicators to determine entry signals:
- High Low Index SPY Top 40
- MACD
- Linear Regression Slope
Entry signal is triggered when:
- High Low Index line crosses the EMA line
- MACD trending in the same direction
- Linear Regression slope is accelerating above a threshold in the same direction, indicating a strong trend
Profit target(PT) and stop loss(SL) are determined using ATR value, with 2:1 Reward to Risk ratio as default.
Exit signal may be triggered prior to PT or SL trigger when:
- High Low Index SPY Top 40 shows a reversal after overbought or oversold conditions (optional)
- Opposite entry signal is triggered
There are a number of optional settings:
- Turn on/off "option trading", P/L will be calculated using share price only without multiplication factor for trading option contracts
- # of options per trade, default to 10
- Reinvest with profit made
- Trade with trailing SL after PT hit
- Take profit early based on Top 40 overbought/oversold
- Trade 0/1 day expiry. This will signal exit by the end of the day on Mon/Wed/Fri, and only exits 1/2 of positions (if in profit) on Tues/Thurs
- Can reduce the SL level without impacting PT
- No entry between 10:05 - 10:20 (don't ask me why, but statistically it performs better)
Consider donating me some of your profit if you make $$$ hahaha~ ;)
Enjoy~~

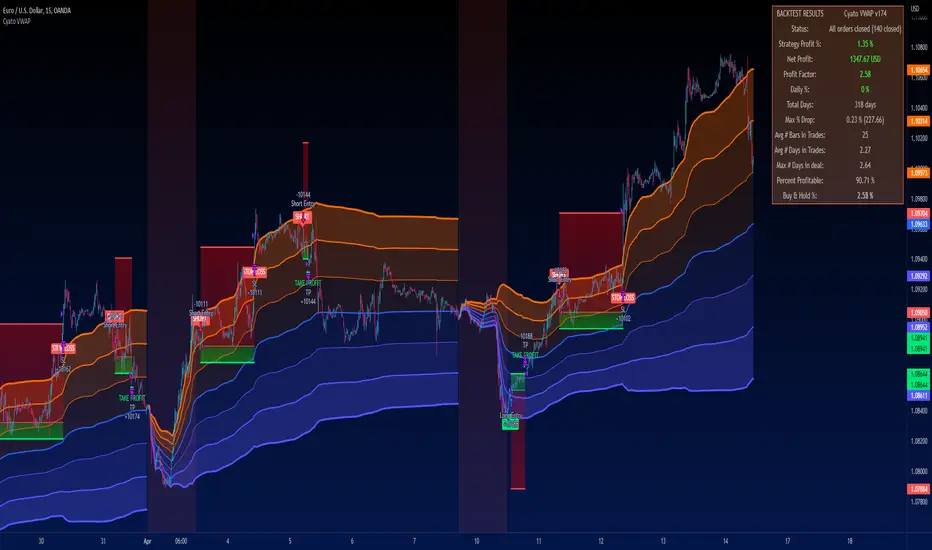
Cyatophilum VWAP StrategyAn indicator to backtest and automate VWAP custom strategies.
Use the Trend Mode to create Swing Trading strategies or Rotation Mode for Intraday Trading.
Configure your strategy using the Entry Condition Builder and Risk Management features, such as Trailing Stop & Take Profits, Safety Orders, and VWAP Exit conditions.
═════════════════════════════════════════════════════════════════════════
█ HOW IT WORKS
VWAP stands for Volume Weighted Average Price.
It is like a simple moving average that takes volume into account.
It is used by a lot of traders since it has everything one needs to know: price and volume.
The cummulated volume calculation resets every session, which interval can be configured.
From that we can calculate the MVWAP and the Standard Deviation Bands and create strategies around that.
█ HOW TO USE
Trend Mode
Trend Mode is the name for strategies built upon VWAP and price/MVWAP cross, most often for Swing Trading on high timeframes trending markets.
The side traded is often long and trying to beat Buy & Hold.
The trade exit can be triggered by a reversal signal (top chart), or a trailing stop (bottom chart) and take profit.
Rotation Mode
This is the mode for Intraday on low timeframes. It will work best on ranging markets.
We use the Standard Deviation Bands to buy/sell the price at overbougth/oversold levels.
The indicator allows to create complex entry conditions such as "Break out of 3rd bands AND break back in 2nd bands" within a certain amount of time.
We will use either the exit options to close the trade when prices reach an opposite band, or the risk management features explained below.
█ FEATURES
• VWAP settings
Configure the VWAP.
• Entry settings
Choose to go long, short, and if the strategy should reverse or not.
• Trend Mode
Choose to create entries from VWAP cross with price or MVWAP.
• Rotation Mode
Configure the 3 bands and build a condition for entry. The multiple inputs allow to add up different events required to trigger an entry, using 3 logical gates that can be linked together using a AND or OR condition. The events being: "break out", "Break back in" or "Just touches" any of the 3 bands. The condition must be met within a certain period of time to be valid.
• Exit settings
Options to exit trades at the end of every session or when the price reaches an opposite band.
• Stop Loss & Take Profit
Configure your stop loss and take profit for long and short trades.
You can also make a trailing stoploss and a trailing take profit.
• Safety Orders (DCA)
Create a strategy with up to 100 safety orders.
Configure their placement and order size using the price deviation, step scale, take profit type (from base order or total volume), and volume scale settings.
Graphics
A Configuration panel with all the indicator settings, useful for sharing a strategy.
A Backtest Results panel with buy & Hold Comparator.
█ ALERTS
Configure your alert messages for all events in the indicator settings.
Then click "Add Alert". In the popup window, select the option "alert() function calls only", give the alert a name and you are good to go!
█ BACKTEST RESULTS
The backtest settings used in this snapshot are the following:
Initial Capital: 10 000€
Order size: 10% equity
Commission: 0.1€ per order
Slippage : 10 ticks
Please read the author instructions below for access.
Break of structure (BOS) forex StrategyPlease read all Details before using this indicator
This strategy is based on taking position after the break of a Previous High/Low swing happens (fixed time frame), the break of structure happens because of the swing happens then we go long or short respectively in this strategy.
I will be discussing the setting details through which you can make it work on different forex pairs.
Does it work on other pairs?
Yes, I have found similar back test results on other USD pairs.
Does it works on smaller time frame?
Yes it does work on smaller time frame , you have to understand the below concepts used and try different settings.
For the user the most important thing is to understand the settings of the indicator so that they can optimize the setting and get the best results:
This indicator contains the following IMPORTANT setting:
i. Fixed trading session for long trades (long position can be taken in that period of time only)
ii. Fixed trading session for short trades (Short position can be taken in that period of time only)
The concept behind restricting the time to go long or short is because in forex the particular pair move in a particular direction depending upon the currency and time zones.
This strategy works on different forex pairs, you need to find the best settings. I will be providing the best settings which works for this strategy and different pairs.
2. Choose Previous High/Low Timeframe
This is the most important option where you have to choose the timeframe for which you want H/L by default it is set to “D”. This timeframe H/L reference will be taken for taking trading decisions.
3.Setting for back test selection date range you can check the beck test of a particular time range.
4.You can check Long and Short positions performance separately, by unchecking the “Go_long” option it will remove all long positions from back test. Vice versa for “Go_short option”
5.Internal Bar Strength
IBS is simply an indicator where you buy on weakness and sell on strength, the cornerstone of any mean-reverting strategy.
It oscillates from zero to one and measures the relative position of the closing price relative to the High and Low.
IBS = (Close – Low) / (High – Low)
In the input setting the you can disable enable the IBS option from the strategy.
6. Parkinson volatility
Parkinson volatility is a volatility measure that uses the stock’s high and low price of the day (can be changed in the setting, instead of day it can be set to any bar length)
The main difference between regular volatility and Parkinson volatility is that the latter uses high and low prices for a day, rather than only the closing price.
In the setting you have three option
i. Enter Volatility Threshold
If the Parkinson volatility value is greater than the the threshold value then it lets the trade happen.
ii.Set the high/low bar time frame for calculating Parkinson volatility. ( Set 60m by default)
Formula used as below:
high_=security(syminfo.ticker, input("60"), high)
low_=security(syminfo.ticker, input("60"), low)
hourlyRangeSquared = pow((log(high_) - log(low_)), 2)
dailyParkinsonVol = sqrt(sum(hourlyRangeSquared, 24) / (4 * log(2)))
7. "Enter no of contract size"
This setting helps you to set the contract size , by default it is set to 100000.
8. “Zigzag Filter Length” this setting is for SWING H/L Lookback. With the help of this I have ploted Swing Support and Resistance.
9.Futrther confirmation of trade is done through the RSI criteria. In this I have provided four kind of RSI confirmation you can test all by selecting any one of the four.
i. filter trade on the basis of BB of RSI (as shown in the image)
ii. filter trade on the basis of RSI Levels (RSI>50 for long, vice versa for short)
iii. filter trade by rsi>basis of BB of RSI(for long) & rsi<50(for short)
iv. filter trade by rsi>50(long) & rsi< basis of BB of RSI(short)
SELECT ONLY ONE OF THE ABOVE IN SETTING.
10.For Exiting the trade I have used the trailing SL you can change it in setting.
You can exit the trade using two targets (two take profit) using different size for exiting the trade.
If you want to take only on target then you have to make QANTITY of shares for 1st Exit as 100. Then you will exit all your position in the first target.
A big thanks to kodify.net there articles are very helpful kodify.net
Thanks to Mickey for providing assistance.
Thanks to stack overflow community for clearing the doubts.
Trading view official documentation on V4 of pine script also helped me.

Ultimate Strategy TemplateHello Traders
As most of you know, I'm a member of the PineCoders community and I sometimes take freelance pine coding jobs for TradingView users.
Off the top of my head, users often want to:
- convert an indicator into a strategy, so as to get the backtesting statistics from TradingView
- add alerts to their indicator/strategy
- develop a generic strategy template which can be plugged into (almost) any indicator
My gift for the community today is my Ultimate Strategy Template
Step 1: Create your connector
Adapt your indicator with only 2 lines of code and then connect it to this strategy template.
For doing so:
1) Find in your indicator where are the conditions printing the long/buy and short/sell signals.
2) Create an additional plot as below
I'm giving an example with a Two moving averages cross.
Please replicate the same methodology for your indicator wether it's a MACD, ZigZag, Pivots, higher-highs, lower-lows or whatever indicator with clear buy and sell conditions
//@version=4
study(title='Moving Average Cross', shorttitle='Moving Average Cross', overlay=true, precision=6, max_labels_count=500, max_lines_count=500)
type_ma1 = input(title="MA1 type", defval="SMA", options= )
length_ma1 = input(10, title = " MA1 length", type=input.integer)
type_ma2 = input(title="MA2 type", defval="SMA", options= )
length_ma2 = input(100, title = " MA2 length", type=input.integer)
// MA
f_ma(smoothing, src, length) =>
iff(smoothing == "RMA", rma(src, length),
iff(smoothing == "SMA", sma(src, length),
iff(smoothing == "EMA", ema(src, length), src)))
MA1 = f_ma(type_ma1, close, length_ma1)
MA2 = f_ma(type_ma2, close, length_ma2)
// buy and sell conditions
buy = crossover(MA1, MA2)
sell = crossunder(MA1, MA2)
plot(MA1, color=color_ma1, title="Plot MA1", linewidth=3)
plot(MA2, color=color_ma2, title="Plot MA2", linewidth=3)
plotshape(buy, title='LONG SIGNAL', style=shape.circle, location=location.belowbar, color=color_ma1, size=size.normal)
plotshape(sell, title='SHORT SIGNAL', style=shape.circle, location=location.abovebar, color=color_ma2, size=size.normal)
/////////////////////////// SIGNAL FOR STRATEGY /////////////////////////
Signal = buy ? 1 : sell ? -1 : 0
plot(Signal, title="🔌Connector🔌", transp=100)
Basically, I identified my buy, sell conditions in the code and added this at the bottom of my indicator code
Signal = buy ? 1 : sell ? -1 : 0
plot(Signal, title="🔌Connector🔌", transp=100)
Important Notes
🔥 The Strategy Template expects the value to be exactly 1 for the bullish signal , and -1 for the bearish signal
Now you can connect your indicator to the Strategy Template using the method below or that one
Step 2: Connect the connector
1) Add your updated indicator to a TradingView chart
2) Add the Strategy Template as well to the SAME chart
3) Open the Strategy Template settings and in the Data Source field select your 🔌Connector🔌 (which comes from your indicator)
From then, you should start seeing the signals and plenty of other stuff on your chart
🔥 Note that whenever you'll update your indicator values, the strategy statistics and visual on your chart will update in real-time
Settings
- Color Candles : Color the candles based on the trade state (bullish, bearish, neutral)
- Close positions at market at the end of each session : useful for everything but cryptocurrencies
- Session time ranges : Take the signals from a starting time to an ending time
- Close Direction : Choose to close only the longs, shorts, or both
- Date Filter : Take the signals from a starting date to an ending date
- Set the maximum losing streak length with an input
- Set the maximum winning streak length with an input
- Set the maximum consecutive days with a loss
- Set the maximum drawdown (in % of strategy equity)
- Set the maximum intraday loss in percentage
- Limit the number of trades per day
- Limit the number of trades per week
- Stop-loss: None or Percentage or Trailing Stop Percentage or ATR
- Take-Profit: None or Percentage or ATR
- Risk-Reward based on ATR multiple for the Stop-Loss and Take-Profit
This script is open-source so feel free to use it, and optimize it as you want
Alerts
Maybe you didn't know it but alerts are available on strategy scripts.
I added them in this template - that's cool because:
- if you don't know how to code, now you can connect your indicator and get alerts
- you have now a cool template showing you how to create alerts for strategy scripts
Source: www.tradingview.com
I hope you'll like it, use it, optimize it and most importantly....make some optimizations to your indicators thanks to this Strategy template
Special Thanks
Special thanks to @JosKodify as I borrowed a few risk management snippets from his website: kodify.net
Additional features
I thought of plenty of extra filters that I'll add later on this week on this strategy template
Best
Dave

ak crude oil intradayHi friends this is Ak CRUDEOIL INTRADAY
It calculate rsi over bought and over sell from different period and generate buy and sell signale
It analyse price action when price makes higher high or higher low and it scalps and take profit ..It scalp on 1 min time frame..its occur in moment of time so for that algo trading require..it automatically take profit and stoploss and close trade near session end.it close all trade at 11pm..before commodity session close.. u can also change time for close trade...it automatically calculate previous candles high and low and when it breaks it generate buy and sell signal and take profit and loss
if u want to use this strategy pls personal message me

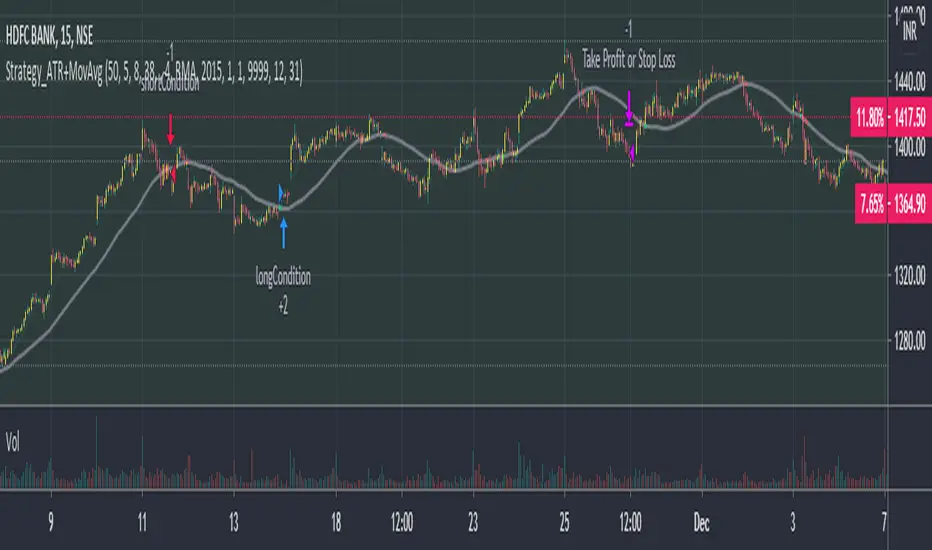
Phoenix085-Strategies==>MTF - Average True Range + MovAvgFIRSTLY, Here are a few who have influenced my pinescripting immensely recently:
@JustUncleL
@BigBitsIO
@TheArtofTrading
@QuantNomad
@SquigglesNiggles and many many many more.
Overview:
> This indicator is a simple crossover of Moving Averages.
> In addition I am using ATR rising as an indication for Trending Price.
> The entry is made once the smaller moving average crosses the bigger moving average, and also the Closes above the Smaller moving average.
> but the only twist here is,
- the ATR source is One timeframe Higher(In this case same as the session).whereas the source for the Moving averages is one Timeframe Lower.
>i.e., if the Session is 1D, the Indicator checks if the ATR is rising in the DAILY TIMEFRAME,
*_* the trade entry is made once the MOVING AVERAGE crossover happens on ONE TIME FRAME lower, as per example, ATR --> 1D = MA -->4H.
> Moving Average ->
- Thick -> Bigger MA,
- Thin and Transparent -> Smaller MA,
> Also, the Color of the Thicker MOVING AVERAGE Changes as Below:
- When LongCondition is satisfied --> Color=Lime
- When ShortCondition is satisfied --> Color=Red
- When neither condition is satisfied --> Color=Gray
NOTE:
1) There is a limitation in using the Securities function for FREE USERS --> Only 500 bars are allowed. So to use the indicators with more data, you need an upgraded TV account.
2) Strategy still needs Fine tuning, but for now, use the Thicker moving average color LIME FOR LONG ENTRIES and RED FOR SHORT ENTRIES.
This is Free for Use and share
MTF - Box Trading StrategyMultiTime Frame - Box Trading Strategies (MTF-BT))
How does it work ? The code uses dynamic levels and crossovers on higher time frames to identify trade calls.
Model 1 (Default) Uses a low risk model and Model 2 (Optional) Uses an aggressive model
How to Deploy / Use
As part of the Indicator there are a few choices the user can opt for
Box Resolution - The resolution of the higher time frame for analysis , typically set at 90 , can be customized by the users.
Use Long Strategy 1 - This would add long trades based on Model1 Algorithm for the users
Use Short Strategy 1 - This would add short trades based on Model1 Algorithm for the users
Use Long Strategy 2 - This would add long trades based on Model2 Algorithm for the users
Use Short Strategy 2 - This would add short trades based on Model2 Algorithm for the users
Check Range Val Validate the width of the channel on higher timeframe and trade only when the channel is wider than the value provided ,
The value of 0.14 is determined using series of back test across various assets
Use Stop Loss : Flag to check if Stop Loss should be done by the strategy
Stop Loss Limit : Stop Loss in Absolute terms
Use Profit Booking : Flag to check if Profit Booking should be done by the strategy
Stop Loss Limit : Profit Target in Absolute terms
Do Intraday Exit :Flag to check if trade should be taken as an Intraday only
Exit Window : Session time during which the trade should be closed , like 15:00 - 15:30 for NSE , 22:30 - 23:00 for MCX etc ,
it should be wide enough to accommodate the resolution the use has on the screen
Visual Checks - The user could manually validate the back test results on various assets they would like to use this strategy on before putting it live.
Usage/Markets : Index Trading / Equities and also well with Commodities and Currencies
Time Frame : works well between 3 and 30 , keep the Box resolution to at least 45 for 3/5 mins TF and you could move upto 180 (3 hrs ) for a 30 mins TF.
Strategy Settings Used/Assumed : All of this values are provided in the Properties Tab of the Indicator Settings
and the users can customize it to suit the broker or the product they are charting it against
Initial Capital : 100 000
Order Size : 10 Quantities for Equities , you may change it to 1 lot for Future contracts based on capital deployed
Commission : is set at 0.05%
Slippage : 20 ticks
Recalculate Option : After the Order is filled is selected by default
Disclaimer : There could be scenarios when the breakout/breakdown candle is rejected , especially when it is long one
so it is always recommended to have a confirmation candle that open-closes above the breakout candle / open-closes below the breakdown candle
If you like it and find it useful or if you find a defect or bug , Please let us know in the comments .. that would encouraging !! for us to develop it further
Thank you and have a beautiful and Profitable trading session !
How to get access
Please click on the link / email in the signature or send me a private message to get access
Feedback
Please click on the link/email in the signature or send me a private message for suggestions/feedbacks

VWAP and RSI strategyThis strategy combines VWAP and RSI indicators
BUY RULE
1. EMA50 > EMA 200
2. if current close > vwap session value and close>open
3. check if RSI3 is dipped below 10 for any of last 10 candles (as defined rsi_buy_level)
EXIT RULE
1. RSI3 crossing down 90 level (as defined in rsi_sell_level)
STOP LOSS EXIT
1. default is set to 5%
you need to add EMA 50 , EMA 200 and VWAP (session) indicators to the chart to see how these signals are generated
This strategy is tested on SPY and QQQ index stocks on hourly chart.
Warning
for educational purposes only
Close Trade at end of day script serves as an example how we can close trades at end of day.
can be session controlled or the time controlled.
the session should be adjusted to be earlier than the candle time.
OHO Trading Nifty50 15 Min 07.05.2020 IndicatorStudies Used:
We have used different type of moving averages, average true ranges, pivot points and relative strength indicator in this indicator.
Usage:
It can be used for scalping and intra-day trading. It works best on Nifty 15 Minutes time frame.
It provides easy to visualize multiple information:
1) It gives the correct Entry on Time.
2) Fake trends are shown on purple color of trend line.
3) Target levels.
4) It gives proper Exit on time. or Exit at the time of closing.
5) Trailing as per trend line.
How to read OHO Indicator?
Trend line color:
Red = Sell side trailing
Green = Buy side trailing
Purple = No trade zone or Trend Changing Time
Recommendations:
Trade is recommended to be closed when price is below UpTrend line (in case of buy side trade) or it is above DownTrend line (in case of sell side trade)
What time frame should I use?
15 Minutes is best time-frame, But you can check different time-frames in Strategy Testing section or as per your requirements.
Disclaimer:
Past performance is not the guarantee of future performance.
Best Indicator for range bound and volatile sessions.
For any type of queries kindly send us personal message.

GBP combine1. stop trading in one side market
- use what kind of TA to decide one side market?
2. TA might react differently in different session
- inactive session need to RSI 60-40?
3. need to stop trading once daily target is complete?
- what is the daily target?
4. How to loss less?
- (1)
- develop more restriction in strategy?

VWolf – Pivot VumanSkewOVERVIEW
This strategy blends a lightweight trend scaffold (EMA/DEMA) with a skew-of-volatility filter and VuManchu/WaveTrend momentum signals. It’s designed to participate only when trending structure, momentum alignment, and volatility asymmetry converge, while delegating execution management to either a standard SuperTrend or a Pivot-based SuperTrend. Position sizing is risk‑based, with optional two‑step profit taking and automatic stop movement once price confirms in favor.
RECOMMENDED USE
Markets: Designed for Forex and equities, and readily adaptable to indices or liquid futures.
Timeframes: Performs best from 15m to 4h where momentum and trend layers both matter; daily can be used for confirmation/context.
Conditions: Trending or range‑expansion phases with clear volatility asymmetry. Avoid extremely compressed sessions unless thresholds are relaxed.
Strengths
Multi‑layer confluence (trend + skew + momentum) reduces random signals.
Dual SuperTrend modes provide flexible trailing and regime control.
Built‑in hygiene (ADX/DMI, lockout after loss, ATR gap) curbs over‑trading.
Risk‑% sizing and two‑step exits support consistent, plan‑driven execution.
Precautions
Over‑tight thresholds can lead to missed opportunities; start from defaults and tune gradually.
High sensitivity in momentum settings may overfit to a single instrument/timeframe.
In very low volatility, ATR‑gap or skew filters may block entries—consider adaptive thresholds.
CONCLUSION
VWolf – Pivot VumanSkew is a disciplined trend‑participation strategy that waits for directional structure, volatility asymmetry, and synchronized momentum before acting. Its execution layer—selectable between Normal and Pivot SuperTrend—keeps management pragmatic: scale out early when appropriate, trail intelligently, and defend capital with volatility‑aware stops. For users building a diversified playbook, Pivot VumanSkew serves as a trend‑continuation workhorse that can be tightened for precision or relaxed for higher participation depending on the market’s rhythm.

ACD STRATEGYACD Opening Range Strategy based off of the strategy of Mark Fischer. It trades off the MGC opening range of all 3 sessions (LDN, ASN, NY)

Stochastic Hash Strat [Hash Capital Research]# Stochastic Hash Strategy by Hash Capital Research
## 🎯 What Is This Strategy?
The **Stochastic Slow Strategy** is a momentum-based trading system that identifies oversold and overbought market conditions to capture mean-reversion opportunities. Think of it as a "buy low, sell high" approach with smart mathematical filters that remove emotion from your trading decisions.
Unlike fast-moving indicators that generate excessive noise, this strategy uses **smoothed stochastic oscillators** to identify only the highest-probability setups when momentum truly shifts.
---
## 💡 Why This Strategy Works
Most traders fail because they:
- **Chase prices** after big moves (buying high, selling low)
- **Overtrade** in choppy, directionless markets
- **Exit too early** or hold losses too long
This strategy solves all three problems:
1. **Entry Discipline**: Only trades when the stochastic oscillator crosses in extreme zones (oversold for longs, overbought for shorts)
2. **Cooldown Filter**: Prevents revenge trading by forcing a waiting period after each trade
3. **Fixed Risk/Reward**: Pre-defined stop-loss and take-profit levels ensure consistent risk management
**The Math Behind It**: The stochastic oscillator measures where the current price sits relative to its recent high-low range. When it's below 25, the market is oversold (time to buy). When above 70, it's overbought (time to sell). The crossover with its moving average confirms momentum is shifting.
---
## 📊 Best Markets & Timeframes
### ⭐ OPTIMAL PERFORMANCE:
**Crude Oil (WTI) - 12H Timeframe**
- **Why it works**: Oil markets have predictable volatility patterns and respect technical levels
**AAVE/USD - 4H to 12H Timeframe**
- **Why it works**: DeFi tokens exhibit strong momentum cycles with clear extremes
### ✅ Also Works Well On:
- **BTC/USD** (12H, Daily) - Lower frequency but high win rate
- **ETH/USD** (8H, 12H) - Balanced volatility and liquidity
- **Gold (XAU/USD)** (Daily) - Classic mean-reversion asset
- **EUR/USD** (4H, 8H) - Lower volatility, requires patience
### ❌ Avoid Using On:
- Timeframes below 4H (too much noise)
- Low-liquidity altcoins (wide spreads kill performance)
- Strongly trending markets without pullbacks (Bitcoin in 2021)
- News-driven instruments during major events
---
## 🎛️ Understanding The Settings
### Core Stochastic Parameters
**Stochastic Length (Default: 16)**
- Controls the lookback period for price comparison
- Lower = faster reactions, more signals (10-14 for volatile markets)
- Higher = smoother signals, fewer trades (16-21 for stable markets)
- **Pro tip**: Use 10 for crypto 4H, 16 for commodities 12H
**Overbought Level (Default: 70)**
- Threshold for short entries
- Lower values (65-70) = more trades, earlier entries
- Higher values (75-80) = fewer but higher-conviction trades
- **Sweet spot**: 70 works for most assets
**Oversold Level (Default: 25)**
- Threshold for long entries
- Higher values (25-30) = more trades, earlier entries
- Lower values (15-20) = fewer but stronger bounce setups
- **Sweet spot**: 20-25 depending on market conditions
**Smooth K & Smooth D (Default: 7 & 3)**
- Additional smoothing to filter out whipsaws
- K=7 makes the indicator slower and more reliable
- D=3 is the signal line that confirms the trend
- **Don't change these unless you know what you're doing**
---
### Risk Management
**Stop Loss % (Default: 2.2%)**
- Automatically exits losing trades
- Should be 1.5x to 2x your average market volatility
- Too tight = death by a thousand cuts
- Too wide = uncontrolled losses
- **Calibration**: Check ATR indicator and set SL slightly above it
**Take Profit % (Default: 7%)**
- Automatically exits winning trades
- Should be 2.5x to 3x your stop loss (reward-to-risk ratio)
- This default gives 7% / 2.2% = 3.18:1 R:R
- **The golden rule**: Never have R:R below 2:1
---
### Trade Filters
**Bar Cooldown Filter (Default: ON, 3 bars)**
- **What it does**: Forces you to wait X bars after closing a trade before entering a new one
- **Why it matters**: Prevents emotional revenge trading and overtrading in choppy markets
- **Settings guide**:
- 3 bars = Standard (good for most cases)
- 5-7 bars = Conservative (oil, slow-moving assets)
- 1-2 bars = Aggressive (only for experienced traders)
**Exit on Opposite Extreme (Default: ON)**
- Closes your long when stochastic hits overbought (and vice versa)
- Acts as an early profit-taking mechanism
- **Leave this ON** unless you're testing other exit strategies
**Divergence Filter (Default: OFF)**
- Looks for price/momentum divergences for additional confirmation
- **When to enable**: Trending markets where you want fewer but higher-quality trades
- **Keep OFF for**: Mean-reverting markets (oil, forex, most of the time)
---
## 🚀 Quick Start Guide
### Step 1: Set Up in TradingView
1. Open TradingView and navigate to your chart
2. Click "Pine Editor" at the bottom
3. Copy and paste the strategy code
4. Click "Add to Chart"
5. The strategy will appear in a separate pane below your price chart
### Step 2: Choose Your Market
**If you're trading Crude Oil:**
- Timeframe: 12H
- Keep all default settings
- Watch for signals during London/NY overlap (8am-11am EST)
**If you're trading AAVE or crypto:**
- Timeframe: 4H or 12H
- Consider these adjustments:
- Stochastic Length: 10-14 (faster)
- Oversold: 20 (more aggressive)
- Take Profit: 8-10% (higher targets)
### Step 3: Wait for Your First Signal
**LONG Entry** (Green circle appears):
- Stochastic crosses up below oversold level (25)
- Price likely near recent lows
- System places limit order at take profit and stop loss
**SHORT Entry** (Red circle appears):
- Stochastic crosses down above overbought level (70)
- Price likely near recent highs
- System places limit order at take profit and stop loss
**EXIT** (Orange circle):
- Position closes either at stop, target, or opposite extreme
- Cooldown period begins
### Step 4: Let It Run
The biggest mistake? **Interfering with the system.**
- Don't close trades early because you're scared
- Don't skip signals because you "have a feeling"
- Don't increase position size after a big win
- Don't revenge trade after a loss
**Follow the system or don't use it at all.**
---
### Important Risks:
1. **Drawdown Pain**: You WILL experience losing streaks of 5-7 trades. This is mathematically normal.
2. **Whipsaw Markets**: Choppy, range-bound conditions can trigger multiple small losses.
3. **Gap Risk**: Overnight gaps can cause your actual fill to be worse than the stop loss.
4. **Slippage**: Real execution prices differ from backtested prices (factor in 0.1-0.2% slippage).
---
## 🔧 Optimization Guide
### When to Adjust Settings:
**Market Volatility Increased?**
- Widen stop loss by 0.5-1%
- Increase take profit proportionally
- Consider increasing cooldown to 5-7 bars
**Getting Too Few Signals?**
- Decrease stochastic length to 10-12
- Increase oversold to 30, decrease overbought to 65
- Reduce cooldown to 2 bars
**Getting Too Many Losses?**
- Increase stochastic length to 18-21 (slower, smoother)
- Enable divergence filter
- Increase cooldown to 5+ bars
- Verify you're on the right timeframe
### A/B Testing Method:
1. **Run default settings for 50 trades** on your chosen market
2. Document: Win rate, profit factor, max drawdown, emotional tolerance
3. **Change ONE variable** (e.g., oversold from 25 to 20)
4. Run another 50 trades
5. Compare results
6. Keep the better version
**Never change multiple settings at once** or you won't know what worked.
---
## 📚 Educational Resources
### Key Concepts to Learn:
**Stochastic Oscillator**
- Developed by George Lane in the 1950s
- Measures momentum by comparing closing price to price range
- Formula: %K = (Close - Low) / (High - Low) × 100
- Similar to RSI but more sensitive to price movements
**Mean Reversion vs. Trend Following**
- This is a **mean reversion** strategy (price returns to average)
- Works best in ranging markets with defined support/resistance
- Fails in strong trending markets (2017 Bitcoin, 2020 Tech stocks)
- Complement with trend filters for better results
**Risk:Reward Ratio**
- The cornerstone of profitable trading
- Winning 40% of trades with 3:1 R:R = profitable
- Winning 60% of trades with 1:1 R:R = breakeven (after fees)
- **This strategy aims for 45% win rate with 2.5-3:1 R:R**
### Recommended Reading:
- *"Trading Systems and Methods"* by Perry Kaufman (Chapter on Oscillators)
- *"Mean Reversion Trading Systems"* by Howard Bandy
- *"The New Trading for a Living"* by Dr. Alexander Elder
---
## 🛠️ Troubleshooting
### "I'm not seeing any signals!"
**Check:**
- Is your timeframe 4H or higher?
- Is the stochastic actually reaching extreme levels (check if your asset is stuck in middle range)?
- Is cooldown still active from a previous trade?
- Are you on a low-liquidity pair?
**Solution**: Switch to a more volatile asset or lower the overbought/oversold thresholds.
---
### "The strategy keeps losing money!"
**Check:**
- What's your win rate? (Below 35% is concerning)
- What's your profit factor? (Below 0.8 means serious issues)
- Are you trading during major news events?
- Is the market in a strong trend?
**Solution**:
1. Verify you're using recommended markets/timeframes
2. Increase cooldown period to avoid choppy markets
3. Reduce position size to 5% while you diagnose
4. Consider switching to daily timeframe for less noise
---
### "My stop losses keep getting hit!"
**Check:**
- Is your stop loss tighter than the average ATR?
- Are you trading during high-volatility sessions?
- Is slippage eating into your buffer?
**Solution**:
1. Calculate the 14-period ATR
2. Set stop loss to 1.5x the ATR value
3. Avoid trading right after market open or major news
4. Factor in 0.2% slippage for crypto, 0.1% for oil
---
## 💪 Pro Tips from the Trenches
### Psychological Discipline
**The Three Deadly Sins:**
1. **Skipping signals** - "This one doesn't feel right"
2. **Early exits** - "I'll just take profit here to be safe"
3. **Revenge trading** - "I need to make back that loss NOW"
**The Solution:** Treat your strategy like a business system. Would McDonald's skip making fries because the cashier "doesn't feel like it today"? No. Systems work because of consistency.
---
### Position Management
**Scaling In/Out** (Advanced)
- Enter 50% position at signal
- Add 50% if stochastic reaches 10 (oversold) or 90 (overbought)
- Exit 50% at 1.5x take profit, let the rest run
**This is NOT for beginners.** Master the basic system first.
---
### Market Awareness
**Oil Traders:**
- OPEC meetings = volatility spikes (avoid or widen stops)
- US inventory reports (Wed 10:30am EST) = avoid trading 2 hours before/after
- Summer driving season = different patterns than winter
**Crypto Traders:**
- Monday-Tuesday = typically lower volatility (fewer signals)
- Thursday-Sunday = higher volatility (more signals)
- Avoid trading during exchange maintenance windows
---
## ⚖️ Legal Disclaimer
This trading strategy is provided for **educational purposes only**.
- Past performance does not guarantee future results
- Trading involves substantial risk of loss
- Only trade with capital you can afford to lose
- No one associated with this strategy is a licensed financial advisor
- You are solely responsible for your trading decisions
**By using this strategy, you acknowledge that you understand and accept these risks.**
---
## 🙏 Acknowledgments
Strategy development inspired by:
- George Lane's original Stochastic Oscillator work
- Modern quantitative trading research
- Community feedback from hundreds of backtests
Built with ❤️ for retail traders who want systematic, disciplined approaches to the markets.
---
**Good luck, stay disciplined, and trade the system, not your emotions.**

Algosnipe trading day scalperThe Algosnipe Trading Day Scalper is an intraday trading strategy designed for active traders who aim to capture short-term price movements within the trading session. It blends price action, volatility, and volume-based logic to identify high-probability entry and exit zones while minimizing exposure time in the market.

US/SPY- Financial Regime Index Swing Strategy Credits: concept inspired by EdgeTools Bloomberg Financial Conditions Index (Proxy)
Improvements: eight component basket, inverse volatility weights, winsorization option( statistical technique used to limit the influence of outliers in a dataset by replacing extreme values with less extreme ones, rather than removing them entirely), slope and price gates, exit guards, table and gradients.
Summary in one paragraph
A macro regime swing strategy for index ETFs, futures, FX majors, and large cap equities on daily calculation with optional lower time execution. It acts only when a composite Financial Conditions proxy plus slope and an optional price filter align. Originality comes from an eight component macro basket with inverse volatility weights and winsorized return z scores that produce a portable yardstick.
Scope and intent
Markets: SPY and peers, ES futures, ACWI, liquid FX majors, BTC, large cap equities.
Timeframes: calculation daily by default, trade on any chart.
Default demo: SPY on Daily.
Purpose: convert broad financial conditions into clear swing bias and exits.
Originality and usefulness
Unique fusion: return z scores for eight liquid proxies with inverse volatility weighting and optional winsorization, then slope and price gates.
Failure mode addressed: false starts in chop and early shorts during easy liquidity.
Testability: all knobs are inputs and the table shows components and weights.
Portable yardstick: z scores center at zero so thresholds transfer across symbols.
Method overview in plain language
Base measures
Return basis: natural log return over a configurable window, standardized to a z score. Winsorization optional to cap extremes.
Components
EQ US and EQ GLB measure equity tone.
CREDIT uses LQD over HYG. Higher credit quality outperformance is risk off so sign is flipped after z score.
RATES2Y uses two year yield, sign flipped.
SLOPE uses ten minus two year yield spread.
USD uses DXY, sign flipped.
VOL uses VIX, sign flipped.
LIQ uses BIL over SPY, sign flipped.
Each component is smoothed by the composite EMA.
Fusion rule
Weighted sum where weights are equal or inverse volatility with exponent gamma, normalized to percent so they sum to one.
Signal rule
Long when composite crosses up the long threshold and its slope is positive and price is above the SMA filter, or when composite is above the configured always long floor.
Short when composite crosses down the short threshold and its slope is negative and price is below the SMA filter.
Long exit on cross down of the long exit line or on a fresh short signal.
Short exit on cross up of the short exit line or on a fresh long signal, or when composite falls below the force short exit guard.
What you will see on the chart
Markers on suggestion bars: L for long, S for short, LX and SX for exits.
Reference lines at zero and soft regime bands at plus one and minus one.
Optional background gradient by regime intensity.
Compact table with component z, weight percent, and composite readout.
Table fields and quick reading guide
Component: EQ US, EQ GLB, CREDIT, RATES2Y, SLOPE, USD, VOL, LIQ.
Z: current standardized value, green for positive risk tone where applicable.
Weight: contribution percent after normalization.
Composite: current index value.
Reading tip: a broadly green Z column with slope positive often precedes better long context.
Inputs with guidance
Setup
Calc timeframe: default Daily. Leave blank to inherit chart.
Lookback: 50 to 1500. Larger length stabilizes regimes and delays turns.
EMA smoothing: 1 to 200. Higher smooths noise and delays signals.
Normalization
Winsorize z at ±3: caps extremes to reduce one off shocks.
Return window for equities: 5 to 260. Shorter reacts faster.
Weighting
Weight lookback: 20 to 520.
Weight mode: Equal or InvVol.
InvVol exponent gamma: 0.1 to 3. Higher compresses noisy components more.
Signals
Trade side: Long Short or Both.
Entry threshold long and short: portable z thresholds.
Exit line long and short: soft exits that give back less.
Slope lookback bars: 1 to 20.
Always long floor bfci ≥ X: macro easy mode keep long.
Force short exit when bfci < Y: macro stress guard.
Confirm
Use price trend filter and Price SMA length.
View
Glow line and Show component table.
Symbols
SPY ACWI HYG LQD VIX DXY US02Y US10Y BIL are defaults and can be changed.
Realism and responsible publication
No performance claims. Past is not future.
Shapes can move intrabar and settle on close.
Execution is on standard candles only.
Honest limitations and failure modes
Major economic releases and illiquid sessions can break assumptions.
Very quiet regimes reduce contrast. Use longer windows or higher thresholds.
Component proxies are ETFs and indexes and cannot match a proprietary FCI exactly.
Strategy notice
Orders are simulated on standard candles. All security calls use lookahead off. Nonstandard chart types are not supported for strategies.
Entries and exits
Long rule: bfci cross above long threshold with positive slope and optional price filter OR bfci above the always long floor.
Short rule: bfci cross below short threshold with negative slope and optional price filter.
Exit rules: long exit on bfci cross below long exit or on a short signal. Short exit on bfci cross above short exit or on a long signal or on force close guard.
Position sizing
Percent of equity by default. Keep target risk per trade low. One percent is a sensible starting point. For this example we used 3% of the total capital
Commisions
We used a 0.05% comission and 5 tick slippage
Legal
Education and research only. Not investment advice. Test in simulation first. Use realistic costs.

Gold 15m: Trend + S/R + Liquidity Sweep (RR 1:2)This strategy is designed for short-term trading on XAUUSD (Gold) using the 15-minute timeframe. It combines trend direction, support/resistance pivots, liquidity sweep detection, and momentum confirmation to identify high-probability reversal setups in line with the dominant market trend.
⚙️ Core Logic:
Trend Filter (EMA 200):
The strategy only takes long positions when price is above the 200 EMA and short positions when price is below it.
Support/Resistance via Pivots:
Dynamic swing highs and lows are identified using pivot points. These act as local supply and demand levels where liquidity is likely to accumulate.
Liquidity Sweep Detection:
A bullish liquidity sweep occurs when price briefly breaks below the last pivot low (grabbing liquidity) and then closes back above it.
A bearish sweep occurs when price breaks above the last pivot high and then closes back below.
Momentum & Candle Strength:
The strategy filters signals based on candle range and body size to ensure entries occur during strong price reactions, not weak retracements.
Risk Management (1:2 RR):
Stop-loss is placed slightly beyond the last pivot level using ATR-based buffers, and take-profit is set at 2× the risk distance, maintaining a reward-to-risk ratio of 1:2.
💼 Trade Logic Summary:
Long Entry:
After a bullish liquidity sweep & reclaim, momentum confirmation, and trend alignment (above EMA 200).
Short Entry:
After a bearish sweep & reclaim, momentum confirmation, and trend alignment (below EMA 200).
Exit:
Automated via ATR-based Stop Loss and Take Profit targets.
📊 Customization Options:
Adjustable EMA length, pivot settings, ATR multipliers, and RR ratio.
Option to enable/disable trend filter.
Toggle display of S/R zones on chart.
🧠 Best Use:
Works best during London and New York sessions when Gold shows strong momentum.
Can be adapted for forex pairs and indices by tuning ATR and pivot parameters.

Larry Williams - Smash Day (SL/TP in %)This strategy implements Larry Williams’ “Smash Day” reversal concept on any symbol and timeframe (daily is the classic). A Smash Day is a bar that closes beyond a recent extreme and then potentially reverses on the next session.
