MP SESSIONS, DST, OTTMP SESSIONS, DST, OTT – What this indicator does
This script is a multi-session market timing tool that:
Draws full trading sessions on the chart (Asia, Sydney, Tokyo, Shanghai, Europe, London, New York, NYSE)
Automatically adjusts for Daylight Saving Time (DST) for Sydney, London, and New York
Shows a live info table with session times, DST status, and whether each session is currently open or closed
Adds optional custom “OTT” vertical lines at user-defined intraday times (for your own models, killzones, or time blocks)
Main Features (high level)
1. Market mode & time zone handling
Market Mode:
Forex
Stock
User Custom (you type your own session ranges)
TFlab suggestion (predefined “optimized” session times)
Time Zone Mode:
UTC
Session Local Time (local exchange time: Sydney, Tokyo, London, New York etc.)
Your Time Zone (converts to the user-selected TZ, e.g. UTC-4:00)
Handles separate time zones for:
Asia, Sydney, Tokyo, Shanghai, Europe, London, New York, NYSE
Has logic to recalculate session start/end depending on DST and the chosen mode.
2. Daylight Saving Time (DST) engine
The function DST_Detector:
Calculates when DST starts and ends for:
Australia/Sydney
Europe/London
America/New_York
Detects the correct Sunday (2nd, 4th, etc.) for start/end using day-of-week and week counts.
Returns 'Active' or 'Inactive' for each region.
These values are then used to shift the sessions (e.g. New York 13:00–21:00 vs 12:00–20:00 in UTC).
The script can also draw vertical lines on the chart when DST starts/ends and label them:
“Sydney DST Started / Ended”
“London DST Started / Ended”
“New York DST Started / Ended”
3. Session timing & sessions on the chart
The function Market_TimeZone_Calculator:
Based on Market Mode + Time Zone Mode + DST state, it returns:
Time ranges for: Sydney, Tokyo, Shanghai, Asia (combined), Europe, London, New York, NYSE
These ranges are in "HHMM-HHMM" format.
Then the script:
Converts these to time() conditions using the proper time zone
Creates boolean series like On_sesAsia, On_sesEurope, On_sesNewYork, etc., which are 1 when the session is open and 0 when closed.
4. Session high/low boxes & labels
The function LowHighSessionDetector:
Tracks high and low of each session while it’s active.
When a new session starts:
Resets and starts recording the session high/low.
While session is active:
Updates High with the max of current bar high and previous session high.
Updates Low with the min of current bar low and previous session low.
When the session is "on":
Draws a box from session low to high (box.new) and extends it to the right as long as the session continues.
Places a label with session name (Asia, London, New York, etc.) near the high:
Style depends on the session (down/right/left).
You have visibility toggles per session:
Asia Session, Sydney Session, Tokyo Session, Shanghai Session, Europe Session, London Session, New York Session, NYSE (for TFlab mode).
So you visually see:
A shaded box for each session
The full H/L range for that session
A text label with the session name.
5. Info table
The indicator builds a table in a corner of the chart showing:
Header:
“FOREX Session”, “Stock Market Trading Hours”, “User Custom Session”, or “TFlab suggestion” depending on mode.
Columns:
Session name (Asia, Sydney, Tokyo, Shanghai, Europe, London, New York, NYSE)
DST status for that region (“Active 🌞 / Inactive 🍂 / Not Observed”)
Session start time
Session end time
Current status (“Open / Closed”, with green/red background)
The function SplitFunction:
Parses the "HHMM-HHMM" strings for each session.
Converts them into:
Either raw times (if viewing in UTC/session local)
Or converted times in Your Time Zone using timestamp and hour/ minute with YourTZ.
Returns formatted Start and End strings like 9:30, 13:00, etc.
So the table is effectively a live session schedule that:
Auto-adjusts to DST
Can show times in your own time zone
Shows which session is open right now.
6. OTT vertical lines (custom intraday markers)
At the bottom, there is an OTT section which lets you draw up to three sets of vertical lines at specific times:
Each OTT block has:
Enable toggle (Enable OTT 1/2/3)
Start hour & minute
End hour & minute
Color
Global OTT settings:
Line style: Solid / Dashed / Dotted
Line width
Toggle: “Show OTT Labels?”
Logic:
is_ott_time() checks if current bar’s hour and minute match the OTT input time.
draw_ott():
When the bar time matches, draws a vertical line through the candle from low to high (extend.both).
Optionally adds a label above the bar, like "OTT1 Start", "OTT1 End", etc.
Use cases:
Marking open/close of your trading session
Defining killzones, news times, or custom model windows
Visual anchors for your intraday routine (NY open, 10 AM candle, etc.)
Cerca negli script per "session"

ALN Sessions Box Breakout — Auto- DSTDevoleper: Sheikh Rakib
What it does
This indicator draws session range boxes for Asia (Dhaka), London, and New York using each market’s own local time (DST-aware). After a session closes, it watches for the first close above the session high or below the session low and then marks that breakout once per session with clear chart markers and optional alerts.
Key features
Auto-DST, per-city timezones
London session uses Europe/London
New York session uses America/New_York
Asia session uses Asia/Dhaka
Your chart timezone doesn’t matter—the sessions track real local hours.
Clean range boxes with adjustable opacity and optional outlines.
Session labels that auto-center at the end of each session.
One-shot breakout signals per session:
Triangle up when price closes above the session high.
Triangle down when price closes below the session low.
Built-in alerts for: session starts and each breakout direction.
Inputs
London / New York / Asia (Dhaka)
Show Session: toggle each session on/off
Time Range: default London 08:00–17:00 (local), New York 08:00–17:00 (local), Asia 06:00–15:00 (Dhaka)
Colour: box color for each session
Settings
Show Session Labels
Show Range Outline
Opacity Preset: Dark / Medium / Light
(UTC Offset input is kept for display, not used in session detection.)
Visuals & alerts
Boxes extend from session open to close, continually updating the high/low.
When the session ends, the final high/low are locked in, the label is centered, and the indicator begins monitoring for a breakout.
Alerts
Session start: Asia/London/New York
Breakouts: “High Breakout” (close > high) and “Low Breakout” (close < low) for each session
Create alerts from the TradingView alert dialog and choose the desired alertcondition.
Logic notes (how signals fire)
While a session is open, its box grows to contain all highs/lows.
On the first bar after close, the script starts listening for a breakout:
Close > session high → one up signal (fires once)
Close < session low → one down signal (fires once)
When the next same session begins, internal flags reset and a new box starts—so signals are inherently scoped to the period between that session’s close and its next open.
Tips
Use on intraday timeframes (e.g., 1m–30m) for clearer box structure.
If you only want specific markets, toggle others off for a cleaner chart.
For systematic entries, combine with your trend/volatility filters and use the breakout alerts as triggers or confirmations—this script doesn’t place trades.
Disclaimer: Market timing and risk management are your responsibility. Past session behavior does not guarantee future performance.

Sakalau02 10 sessionsMarket Sessions: The Institutional Chronological Compass
The "Market Sessions - By Sakalau" indicator is a high-precision visualization tool designed to map the temporal structure of financial markets directly onto your chart. It acts as a chronological guide, helping traders identify volatility cycles and the institutional "changing of the guard" across global financial hubs.
Here is why this script is essential for your strategy:
🌐 Extensive Global Coverage
Unlike standard indicators that only track the "Big Three" (London, New York, Tokyo), this script by Sakalau supports up to 10 fully customizable sessions. This allows you to track specific liquidity pockets, such as the Frankfurt open, Hong Kong, or Mumbai.
📊 Visualizing Market Phases
The indicator uses a Box-based visual system to encapsulate price action within specific timeframes. This makes it easy to identify:
Accumulation Phases: Typically seen during low-volume sessions (Sydney/Asia) where price moves sideways in a tight range.
Expansion/Trend Phases: Identified when a new session (London/NY) breaks out of the previous session’s high or low.
Distribution/Reversals: Indicated when price reaches the boundaries of a session box and fails to sustain the move.
🧠 Advanced Technical Insights
The script does more than draw shapes; it extracts crucial data for execution:
Open/Close Lines: Highlights the session's starting price versus its current trajectory at a glance.
0.5 Median Level (Equilibrium): Automatically plots the midpoint of each session's range. In institutional trading, this is considered "Fair Value"—a magnet for price and a major support/resistance area.
Performance Management: The Lookback feature ensures your chart remains fast and responsive by limiting processing to a set number of days.
🎨 Customization & Clarity
Display Modes: Choose between Boxes, Zones (background highlights), or Timeline views.
Aesthetics: Total control over colors, opacity, and line styles (solid, dashed, dotted) for a premium visual experience.
P.S
Alții caută confirmări, eu desenez zonele ✍️. O unealtă creată pentru cei care înțeleg că în trading, CÂND tranzacționezi este la fel de important ca CE tranzacționezi — nu uitați să verificați 0.5-ul! — Semnat, Andrei (Sakalau02)🧭🎯⌛💎

Relative Average Extrapolation [ChartPrime]Relative Average Extrapolation (ChartPrime) is a new take on session averages, like the famous vwap . This indicator leverages patterns in the market by leveraging average-at-time to get a footprint of the average market conditions for the current time. This allows for a great estimate of market conditions throughout the day allowing for predictive forecasting. If we know what the market conditions are at a given time of day we can use this information to make assumptions about future market conditions. This is what allows us to estimate an entire session with fair accuracy. This indicator works on any intra-day time frame and will not work on time frames less than a minute, or time frames that are a day or greater in length. A unique aspect of this indicator is that it allows for analysis of pre and post market sessions independently from regular hours. This results in a cleaner and more usable vwap for each individual session. One drawback of this is that the indicator utilizes an average for the length of a session. Because of this, some after hour sessions will only have a partial estimation. The average and deviation bands will work past the point where it has been extrapolated to in this instance however. On low time frames due to the limited number of data points, the indicator can appear noisy.
Generally crypto doesn't have a consistent footprint making this indicator less suitable in crypto markets. Because of this we have implemented other weighting schemes to allow for more flexibility in the number of use cases for this indicator. Besides volume weighting we have also included time, volatility, and linear (none) weighting. Using any one of these weighting schemes will transform the vwap into a wma, volatility adjusted ma, or a simple moving average. All of the style are still session period and will become longer as the session progresses.
Relative Average Extrapolation (ChartPrime) works by storing data for each time step throughout the day by utilizing a custom indexing system. It takes the a key , ie hour/minute, and transforms it into an array index to stor the current data point in its unique array. From there we can take the current time of day and advance it by one step to retrieve the data point for the next bar index. This allows us to utilize the footprint the extrapolate into the future. We use the relative rate of change for the average, the relative deviation, and relative price position to extrapolate from the current point to the end of the session. This process is fast and effective and possibly easier to use than the built in map feature.
If you have used vwap before you should be familiar with the general settings for this indicator. We have made a point to make it as intuitive for anyone who is already used to using the standard vwap. You can pick the source for the average and adjust/enable the deviation bands multipliers in the settings group. The average period is what determines the number of days to use for the average-at-time. When it is set to 0 it will use all available data. Under "Extrapolation" you will find the settings for the estimation. "Direction Sensitivity" adjusts how sensitive the indicator is to the direction of the vwap. A higher number will allow it to change directions faster, where a lower number will make it more stable throughout the session. Under the "Style" section you will find all of the color and style adjustments to customize the appearance of this indicator.
Relative Average Extrapolation (ChartPrime) is an advanced and customizable session average indicator with the ability to estimate the direction and volatility of intra-day sessions. We hope you will find this script fascinating and useful in your trading and decision making. With its unique take on session weighting and forecasting, we believe it will be a secret weapon for traders for years to come.
Enjoy

Parent Session Sweeps + Alert Killzone Ranges with Parent Session Sweep
Key Features:
1. Multiple Session Support: The script tracks three major trading sessions - Asia, London, and New York. Users can customize the timing of these sessions.
2. Killzone Visualization: The strategy visually represents each session's range, either as filled boxes or lines, allowing traders to easily identify key price levels.
3. Parent Session Logic: The core of the strategy revolves around identifying a "parent" session - a session that encompasses the range of the following session. This parent session becomes the basis for potential trade setups.
4. Sweep and Reclaim Setups: The strategy looks for price movements that sweep (break above or below) the parent session's high or low, followed by a reclaim of that level. This price action often indicates a potential reversal.
5. Risk-Reward Filtering: Each potential setup is evaluated based on a user-defined minimum risk-reward ratio, ensuring that only high-quality trade opportunities are considered.
6. Candle Close Filter: An optional filter that checks the characteristics of the candle that reclaims the parent session level, adding an extra layer of confirmation to the setup.
7. Performance Tracking: The strategy keeps track of bullish and bearish setup success rates, providing valuable feedback on its performance over time.
8. Visual Aids: The script draws lines to mark the parent session's high and low, making it easy for traders to identify key levels.
How It Works:
1. The script continuously monitors price action across the defined sessions.
2. When a session fully contains the range of the next session, it's identified as a potential parent session.
3. The strategy then waits for price to sweep either the high or low of this parent session.
4. If a sweep occurs, it looks for a reclaim of the swept level within the parameters set by the user.
5. If a valid setup is identified, the script generates an alert and places a trade (if backtesting or running live).
6. The strategy continues to monitor the trade for either reaching the target (opposite level of the parent session) or hitting the stop loss.
Considerations for Signals:
- Sweep: A break of the parent session's high or low.
- Reclaim: A close back inside the parent session range after a sweep.
- Candle Characteristics: Optional filter for the reclaim candle (e.g., bullish candle for long setups).
- Risk-Reward: Each setup must meet or exceed the user-defined minimum risk-reward ratio.
- Session Timing: The strategy is sensitive to the defined session times, which should be set according to the trader's preferred time zone.
This strategy aims to capitalize on institutional order flow and liquidity patterns in the forex market, providing traders with a systematic approach to identifying potential reversal points with favorable risk-reward profiles.

Market Structure & Session Alerts### Market Structure & Session Alerts Indicator
#### Overview
The "Market Structure & Session Alerts" indicator is a comprehensive tool designed to assist traders in identifying key market structure levels, detecting liquidity sweeps, and receiving alerts for specific trading sessions. This indicator is particularly useful for traders who want to keep an eye on previous high and low levels and be alerted during pre-London and pre-New York sessions.
#### Features
1. **Previous High/Low Levels:**
- **Daily, Weekly, and Monthly Highs and Lows:** The indicator plots the previous day, week, and month high and low levels on the chart. These levels can be crucial for identifying support and resistance zones.
- **Toggle Display:** Users can choose to show or hide these levels using the "Show Previous Day/Week/Month High/Low" option.
2. **Liquidity Sweep Detection:**
- **Liquidity Sweep Identification:** The indicator detects liquidity sweeps when the current price closes above the previous day's high. This can signal potential reversals or continuations in the market.
- **Visual Alerts:** When a liquidity sweep is detected, a green triangle is plotted below the bar.
3. **Session Alerts:**
- **Session Timings:** Users can set specific start and end times for the pre-London and pre-New York sessions to match their timezone.
- **Visual Background Highlight:** The background of the chart is highlighted in yellow during the defined session times to provide a visual cue.
- **Alert Messages:** The indicator can generate alerts to notify traders when the market enters the pre-London or pre-New York session.
4. **Current Price Line:**
- The current price is plotted as a black line, providing a clear visual reference for the current market price.
#### How to Use
1. **Input Parameters:**
- `Show Previous Day/Week/Month High/Low`: Enable or disable the display of previous high/low levels.
- `Show Liquidity Sweep`: Enable or disable the detection and display of liquidity sweeps.
- `Show Session Alerts`: Enable or disable session alerts and background highlights.
2. **Session Timing Adjustments:**
- Set the `Pre-London Start`, `Pre-London End`, `Pre-New York Start`, and `Pre-New York End` times according to your timezone to ensure accurate session alerts.
3. **Alerts:**
- Make sure alerts are enabled in your TradingView settings to receive notifications when the market enters the pre-London or pre-New York sessions.
#### Example Use Cases
- **Day Traders:** Identify potential support and resistance levels using the previous day's high and low.
- **Swing Traders:** Use weekly and monthly high and low levels to determine significant market structure points.
- **Scalpers:** Detect liquidity sweeps to identify potential quick trades.
- **Session Traders:** Be alerted when the market enters key trading sessions to align your trading strategy with major market activities.
This indicator combines multiple market analysis tools into one, providing a robust system for traders to enhance their trading decisions and market awareness.

ICT KillZones + Pivot Points [TradingFinder] Support/Resistance 🟣 Introduction
Pivot Points are critical levels on a price chart where trading activity is notably high. These points are derived from the prior day's price data and serve as key reference markers for traders' decision-making processes.
Types of Pivot Points :
Floor
Woodie
Camarilla
Fibonacci
🔵 Floor Pivot Points
Widely utilized in technical analysis, floor pivot points are essential in identifying support and resistance levels. The central pivot point (PP) acts as the primary level, suggesting the trend's likely direction.
The additional resistance levels (R1, R2, R3) and support levels (S1, S2, S3) offer further insight into potential trend reversals or continuations.
🔵 Camarilla Pivot Points
Featuring eight distinct levels, Camarilla pivot points closely correspond with support and resistance, making them highly effective for setting stop-loss orders and profit targets.
🔵 Woodie Pivot Points
Similar to floor pivot points, Woodie pivot points differ by placing greater emphasis on the closing price, often resulting in different pivot levels compared to the floor method.
🔵 Fibonacci Pivot Points
Fibonacci pivot points combine the standard floor pivot points with Fibonacci retracement levels applied to the previous trading period's range. Common retracement levels used are 38.2%, 61.8%, and 100%.
🟣 Sessions
Financial markets are divided into specific time segments, known as sessions, each with unique characteristics and activity levels. These sessions are active at different times throughout the day.
The primary sessions in financial markets include :
Asian Session
European Session
New York Session
The timing of these major sessions in UTC is as follows :
Asian Session: 23:00 to 06:00
European Session: 07:00 to 14:25
New York Session: 14:30 to 22:55
🟣 Kill Zones
Kill zones are periods within a session marked by heightened trading activity. During these times, trading volume surges and price movements become more pronounced.
The timing of the major kill zones in UTC is :
Asian Kill Zone: 23:00 to 03:55
European Kill Zone: 07:00 to 09:55
New York Kill Zone: 14:30 to 16:55
Combining kill zones and pivot points in financial market analysis provides several advantages :
Enhanced Market Sentiment Analysis : Aligns key price levels with high-activity periods for a clearer market sentiment.
Improved Timing for Trade Entries and Exits : Helps better time trades based on when price movements are most likely.
Higher Probability of Successful Trades : Increases the accuracy of predicting market movements and placing profitable trades.
Strategic Stop-Loss and Profit Target Placement : Allows for precise risk management by strategically setting stop-loss and profit targets.
Versatility Across Different Time Frames : Effective in both short and long time frames, suitable for various trading strategies.
Enhanced Trend Identification and Confirmation : Confirms trends using both pivot levels and high-activity periods, ensuring stronger trend validation.
In essence, this integrated approach enhances decision-making, optimizes trading performance, and improves risk management.
🟣 How to Use
🔵 Two Approaches to Trading Pivot Points
There are two main strategies for trading pivot points: utilizing "pivot point breakouts" and "price reversals."
🔵 Pivot Point Breakout
When the price breaks through pivot lines, it signals a shift in market sentiment to the trader. In the case of an upward breakout, where the price crosses these pivot lines, a trader might enter a long position, placing their stop-loss just below the pivot point (P).
Conversely, if the price breaks downward, a short position can be initiated below the pivot point. When using the pivot point breakout strategy, the first and second support levels can serve as profit targets in an upward trend. In a downward trend, these roles are filled by the first and second resistance levels.
🔵 Price Reversal
An alternative method involves waiting for the price to reverse at the support and resistance levels. To implement this strategy, traders should take positions opposite to the prevailing trend as the price rebounds from the pivot point.
While this tool is commonly used in higher time frames, it tends to produce better results in shorter time frames, such as 1-hour, 30-minute, and 15-minute intervals.
Three Strategies for Trading the Kill Zone
There are three principal strategies for trading within the kill zone :
Kill Zone Hunt
Breakout and Pullback to Kill Zone
Trading in the Trend of the Kill Zone
🔵 Kill Zone Hunt
This strategy involves waiting until the kill zone concludes and its high and low lines are established. If the price reaches one of these lines within the same session and is strongly rejected, a trade can be executed.
🔵 Breakout and Pullback to Kill Zone
In this approach, once the kill zone ends and its high and low lines stabilize, a trade can be made if the price breaks one of these lines decisively within the same session and then pulls back to that level.
🔵 Trading in the Trend of the Kill Zone
Kill zones are characterized by high trading volumes and strong trends. Therefore, trades can be placed in the direction of the prevailing trend. For instance, if an upward trend dominates this area, a buy trade can be entered when the price reaches a demand order block.

Power Hour Trendlines [LuxAlgo]The Power Hour Trendlines indicator is based on Power Hours detection, and includes up to three displayed trendlines derived from the closing prices of all the bars within the last user-selected Power Hours.
Users can edit the time of Power Hours, choose how many sessions to take into account, enable or disable any trendlines, and change their colors.
🔶 USAGE
The Power Hour is defined as the last hour of the trading session and is set by default from 3:00 p.m. to 4:00 p.m. New York time. During this period, volume and volatility enter the market. Traders using higher timeframes may use this period to enter or exit positions by placing MOC (Market on Close) orders.
This tool works under the hypothesis that prices made during power hours (periods with high trading activity) are more relevant when used for the construction of trendlines.
An initial trendline is fit using linear regression; prices from power hours located above this initial fit are used for the upper trendline, while the ones below the fit are used for the lower one.
As with any trendline, traders can analyze the slope to determine the market's direction:
Positive slope: The market is trending up.
Negative slope: The market is trending down.
No slope: The market is trending sideways.
As we can see in the image, Nasdaq and Bitcoin are clearly in downtrends, gold is clearly in an uptrend, and the euro/U.S. dollar is in a sideways market over the last visible sessions.
As you can see, the trend lines may or may not be parallel to each other. The wider the area, the more volatile the data. The narrower the area, the less volatile the data. Let's look at an example.
In the image, the Dow30 and the euro/U.S. dollar have opposite behaviors. The volatility above the middle trendline is growing in the first case but shrinking in the second. In both cases, the volatility in the bottom area seems steady, so there are no big surprises there.
Traders can adjust the number of sessions for calculations, making the tool ideal for analyzing price behavior over different time frames.
As the image shows, we can clearly see how the market behaves over different time periods. XLY has been moving down over the last 10, 20, and 40 sessions, with a steeper decline over shorter periods. However, it has been moving sideways over the last 70 sessions.
One of the main uses of trendlines is to provide key support and resistance. In the image, SPY is shown with trendlines over the last 20 sessions. These lines provide excellent reference points for trading and observing price behavior in those areas, such as whether prices are accepted or rejected, which may trigger a response from other traders.
🔹 Not Allowed Timeframes
For obvious reasons, timeframes larger than 1H are not allowed. The Power Hour is defined as the last hour of the trading session. The tool will display a warning message if the timeframe is longer than 60 minutes.
🔶 SETTINGS
Power Hour (NY Time): Choose a custom Power Hour in New York time
Sessions Memory: Select how many Power Hours to take into account for calculations.
🔹 Style
Top: Enable or disable the top line and choose the line and background colors.
Middle: Enable or disable the middle line and choose the line color.
Bottom: Enable or disable the bottom line and choose the line and background colors.
Background: Enable or disable the background color for top and bottom lines.

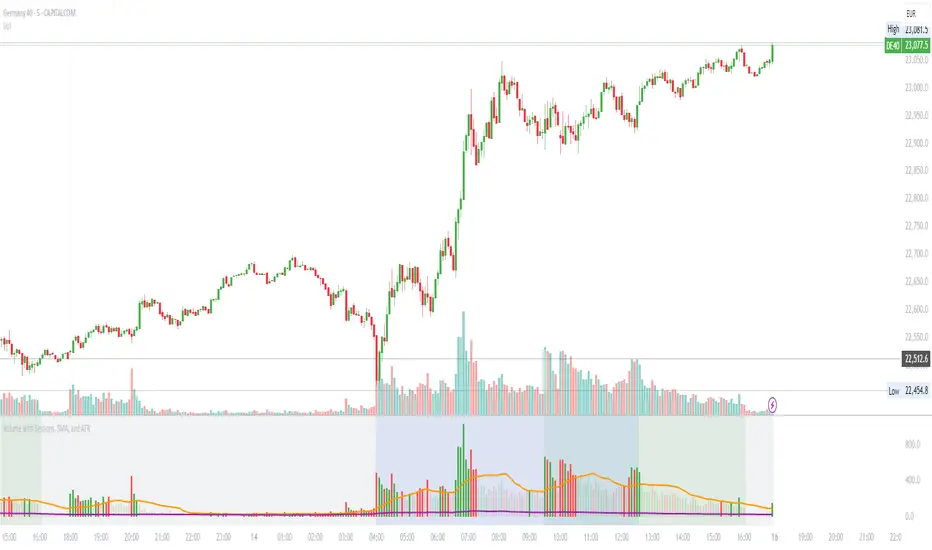
Volume with Sessions, SMA, and ATR Pine Script creates a custom volume indicator with several features, including:
SMA of Volume: It calculates the simple moving average (SMA) of the volume, which helps identify trends and determine if the current volume is above or below the average.
ATR (Average True Range): It calculates the ATR, which measures market volatility over a defined period.
Bullish/Bearish Volume Coloring: The script colors the volume bars depending on whether the price is moving up (bullish) or down (bearish), and whether the volume is above or below the SMA of volume.
Session Highlighting: It defines two major trading sessions:
NYSE (New York Stock Exchange) session from 9:30 AM to 4:00 PM Eastern Time.
LSE (London Stock Exchange) session from 8:00 AM to 4:30 PM GMT. These sessions are highlighted with background colors for easy identification.
Plotting: The volume is plotted as a histogram with varying colors depending on price movement and volume relative to its SMA. The ATR is also plotted as a purple line, and the SMA of volume is displayed as an orange line.
Background Colors: Background colors are applied during the NYSE and LSE sessions to visually differentiate between these trading periods.
Here's a breakdown of each section:
Key Inputs:
smaLength and atrLength: User-defined values for the lengths of the SMA and ATR calculations.
Main Calculations:
smaVolume: The SMA of the volume over the user-defined length (smaLength).
atrValue: The Average True Range over the user-defined length (atrLength).
Color Logic for Volume Bars:
If the current close is higher than the previous close, the volume is considered bullish, and the bar is colored green. If the volume is above the SMA, it’s a darker green; otherwise, it’s a lighter shade.
If the current close is lower than the previous close, the volume is considered bearish, and the bar is colored red. If the volume is above the SMA, it’s a darker red; otherwise, it’s a lighter red.
Plotting:
The script plots the volume as a histogram with dynamic coloring.
The SMA of the volume is plotted as a line.
ATR is plotted as a purple line for reference.
Background Color Highlighting:
The background is colored green during the NYSE session and blue during the LSE session.
MainFX session indicatorScript Title: MainFX Session Indicator with Customizable Lines
Overview:
This script is designed to help traders visually identify key market sessions on their TradingView charts. It marks both the opening and closing of major sessions (Frankfurt, London, New York, Sydney, and Tokyo) by drawing lines and labels on the chart. The indicator is highly customizable, allowing you to define specific session times, choose your preferred time zone, and adjust the visual appearance of all lines.
Key Features:
Custom Session Times:
Each session’s start and end times are defined by user inputs in a simple HHMM-HHMM format. This means you can adjust the sessions to match the exact market hours you follow, making the indicator flexible for different trading strategies and markets.
Time Zone Flexibility:
The "Chart/Local Time Zone" input lets you override the default time zone of your chart. By setting a specific time zone (e.g., "Africa/Lagos" or "Africa/Accra"), the script calculates session start and end events relative to that zone. This ensures that, regardless of where you are trading from, the session markers accurately reflect the intended market hours and adjust automatically for Daylight Saving Time if applicable.
Open Range Levels (ORH/ORL):
When a session opens or closes, the script draws horizontal lines at the high and low of the candle immediately before the event. These levels act as the Open Range High (ORH) and Open Range Low (ORL) markers. They serve as key reference points for traders to gauge price levels established just before a session change.
Customizable Visuals:
Every visual element is customizable. You can adjust the color, width, and style (defaulting to a dotted line) of both the ORH/ORL lines and the combined session lines that label open and close events. This allows you to tailor the indicator to match your charting style and ensure that the lines stand out clearly.
Session Event Detection:
The script utilizes helper functions to check each bar on the chart. It compares the current bar’s session status with that of the previous bar to determine whether a session has just started or ended. When such a transition is detected, it triggers the drawing of the appropriate lines and labels.
Optimized for Intraday Trading:
Since the script’s functionality is based on minute-level bar changes, it is best used on 1-minute or lower timeframes. This ensures precision in marking the exact moments when sessions transition, which is critical for intraday trading strategies.
How It Works:
Session Timing:
The script calculates the session periods using the time() function with the user-defined session strings and time zone. This makes it independent of the chart’s inherent time settings.
Event Triggering:
When the current bar transitions into or out of a session (i.e., the session status changes between bars), the script detects this change. It then draws horizontal lines at the previous candle’s high and low (marking ORH and ORL) and adds session labels for clarity.
Visual Customization:
Users can easily change the appearance of the drawn lines and session labels via the script’s input options, ensuring that the indicators are both aesthetically pleasing and functionally clear.
Usage:
For Traders:
Use this indicator to keep track of critical market sessions and to spot participants in the session.
Customization:
Adjust session times and the time zone to suit your local market or the specific market you are analyzing.
Visual Clarity:
Customize line styles to ensure that your chart remains clear and that the session markers are easy to interpret even during overlapping sessions.

Asia Sessions AutoPlotting**Asia Sessions AutoPlotting**
This script is designed to automatically detect and plot the Asia session high and low levels directly on your chart, providing key session data for trading analysis. It is highly customizable, making it an essential tool for traders who rely on session data for decision-making.
### Key Features:
- **Asia Session Detection**: Automatically identifies the Asia session based on user-defined time settings (default: 0000-0845 UTC).
- **High/Low Line Plotting**: Displays high and low price levels for the session with customizable colors and line styles.
- **Line Extensions**: Option to extend session high/low lines for future price action reference.
- **Session Background Fill**: Adds an optional colored background to highlight the Asia session period.
- **Day Labels**: Includes labels for the session high/low levels with the corresponding day of the week.
- **Dynamic Session History**: Limits the display to a user-specified number of past sessions (default: 7) to keep the chart clean and focused.
- **Customizable Colors**: Highlights Mondays with unique colors for easy identification, while other weekdays use a different scheme.
### Use Cases:
- Identify key session levels for trading strategies.
- Monitor Asia session dynamics and their impact on subsequent sessions.
- Spot significant price reactions around session highs/lows.
### Inputs:
- **Session Time**: Adjust the session time to match your preferred Asia trading hours.
- **Toggle High/Low Lines**: Enable or disable the plotting of session highs and lows.
- **Line Extensions**: Extend the session high/low lines into future bars for better visualization.
- **Background Highlight**: Toggle a colored background for the Asia session.
- **Maximum Sessions**: Define how many past sessions to display for clarity.
This script is perfect for intraday traders, scalpers, and swing traders looking to gain insight into the Asia session and its influence on global markets. Fully adjustable and easy to use, it enhances your chart with critical information at a glance.
Simply add it to your TradingView chart, configure your settings, and let it do the work for you!

ka66: FX Sessions High/LowThis indicator is specific to the 24-hour Forex Market. It provides 2 features:
Demarcating forex sessions with open and close lines. Note that looking at various sources online, we use the convention that the Asia session starts with the Tokyo market open, rather than the earlier Sydney session. Presumably this is better since we then have more liquidity in the market. Note that we have three sessions: Asia, London, New York.
At the end of each session, we begin plotting that (closed) session's high and low, which acts as a natural support and resistance for the Forex market. This is the key feature it provides. The first feature is mainly there for a visual guide, which can be turned off via the UI settings, but it certainly helps verifying the logic!
For more background, we are taking the idea of Previous Day High/Low (PDH/PDL), but adjusting it to a multi-session market like Forex. In essence, this is is a "Previous Session High/Low" indicator.
PDH/PDL works fine when you have a market with Regular Trading Hours, ignoring Extended Hours. However, in the Forex market, each session can have differing sentiments, e.g. we often see say London bringing prices up, and New York bringing them back down.
The break of session high/lows (or bouncing off them) can reflect where the potential direction price is going to take.
I also categorised this as a Sentiment indicator, because support and resistance areas where prices react do provide the sentiment of the market. They aren't just lines, they are prices of interest to major players.

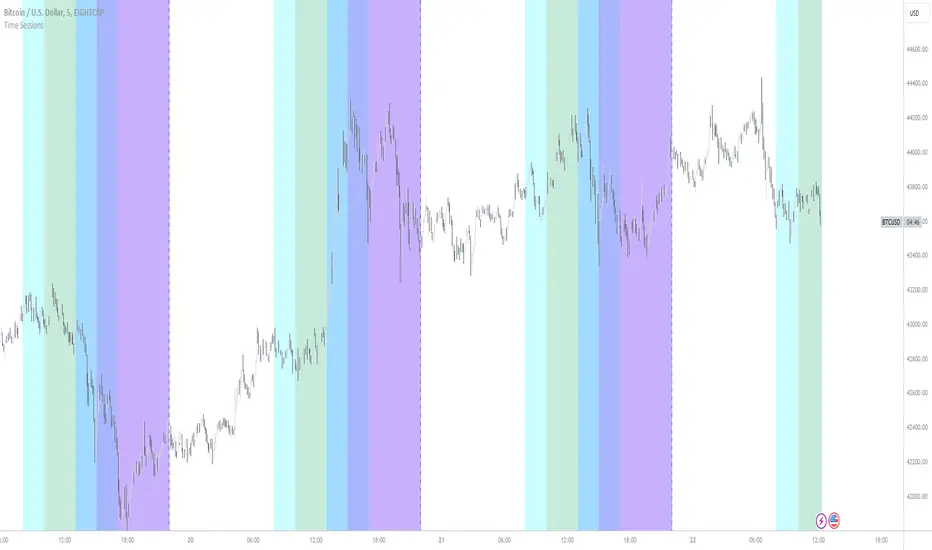
New York, London and custom trading sessionsHi Traders
The script :
The Time sessions script plots the trading sessions of both New York and London markets (background fills), In addition to the above the script also plots a user defined trading session period (vertical lines). All plots may be toggled true or false inorder to ensure you can focus on the respective market / markets / custom session.
Market sessions are useful for technical or quantitative analysis, as the majority of trading activity and net daily volume occurs in these zones, in fact the U.S./London market overlap tends to have the greatest volume accumulation across that range of time / bars than that range at any other time within the daily session. For FX traders it may also be important to take into account for many currency pairs the average exchange rate pip movement is greatest within these zones.
The custom session, is intended to be used for traders who trade only within specific intervals within the market session or day for 24/7 traded asset classes
Additional notes :
Not as of now, I have only added three optional trading sessions. If you would like to change the sessions, copy the scripts code and change the "ctm_session" default time range value, insuring the second time value is 1 min > than the first.
As always i Hope this is a useful script, and I will be updating this script in the near future.
TJR asia session sweep//@version=5
strategy("TJR asia session sweep", "TJR Asia Sweep", overlay=true, max_lines_count=500, max_labels_count=500)
// Input settings
show_asian = input.bool(true, "Show Asian Session", group="Visual Settings")
show_london = input.bool(true, "Show London Session", group="Visual Settings")
show_swing_points = input.bool(true, "Show Asian Swing Points", group="Visual Settings")
show_market_structure = input.bool(true, "Show Market Structure", group="Visual Settings")
show_bos = input.bool(true, "Show Break of Structure", group="Visual Settings")
// Session Time Settings
asian_start_hour_input = input.int(22, "Asian Session Start Hour", minval=0, maxval=23, group="Session Times")
asian_end_hour_input = input.int(3, "Asian Session End Hour", minval=0, maxval=23, group="Session Times")
london_start_hour_input = input.int(3, "London Session Start Hour", minval=0, maxval=23, group="Session Times")
london_end_hour_input = input.int(8, "London Session End Hour", minval=0, maxval=23, group="Session Times")
session_timezone = input.string("America/New_York", "Session Timezone", options= , group="Session Times")
// Risk Management Settings
use_atr_sl = input.bool(false, "Use ATR Multiplier for Stop Loss", group="Risk Management")
atr_length = input.int(14, "ATR Length", minval=1, maxval=50, group="Risk Management")
atr_multiplier = input.float(2.0, "ATR Multiplier for Stop Loss", minval=0.5, maxval=10.0, group="Risk Management")
force_london_close = input.bool(true, "Force Close at London Session End", group="Risk Management")
cutoff_minutes = input.int(60, "Minutes Before Session End to Stop New Trades", minval=0, maxval=300, group="Risk Management")
// Position Sizing Settings
position_sizing_method = input.string("USD Risk", "Position Sizing Method", options= , group="Position Sizing")
usd_risk_per_trade = input.float(100.0, "USD Risk Per Trade", minval=1.0, maxval=10000.0, group="Position Sizing")
fixed_contracts = input.float(1.0, "Fixed Number of Contracts", minval=0.01, maxval=1000.0, step=0.01, group="Position Sizing")
// Color settings
asian_color = input.color(color.red, "Asian Session Color")
london_color = input.color(color.blue, "London Session Color")
swing_high_color = input.color(color.orange, "Swing High Color")
swing_low_color = input.color(color.lime, "Swing Low Color")
bullish_structure_color = input.color(color.green, "Bullish Structure Color")
bearish_structure_color = input.color(color.red, "Bearish Structure Color")
bos_color = input.color(color.orange, "Break of Structure Color")
// Line settings
line_width = input.int(2, "Line Width", minval=1, maxval=5)
// ATR calculation for stop loss
atr = ta.atr(atr_length)
// Position size calculation function
calculate_position_size(entry_price, stop_loss_price) =>
var float position_size = na
if position_sizing_method == "Fixed Contracts"
position_size := fixed_contracts
else // USD Risk method
stop_distance = math.abs(entry_price - stop_loss_price)
if stop_distance > 0
// Calculate position size based on USD risk per trade
// For forex: position_size = risk_amount / (stop_distance * point_value)
// For most forex pairs, point value = 1 (since we're dealing with price differences directly)
position_size := usd_risk_per_trade / stop_distance
else
position_size := fixed_contracts // Fallback to fixed contracts if stop distance is 0
position_size
// Session time definitions (using input variables)
asian_start_hour = asian_start_hour_input
asian_end_hour = asian_end_hour_input
london_start_hour = london_start_hour_input
london_end_hour = london_end_hour_input
// Get current hour using selected timezone
current_hour = hour(time, session_timezone)
// Previous hour for transition detection
prev_hour = hour(time , session_timezone)
// Session transition detection
asian_start = current_hour == asian_start_hour and prev_hour != asian_start_hour
asian_end = current_hour == asian_end_hour and prev_hour != asian_end_hour
london_start = current_hour == london_start_hour and prev_hour != london_start_hour
london_end = current_hour == london_end_hour and prev_hour != london_end_hour
// Session activity detection
asian_active = (current_hour >= asian_start_hour) or (current_hour < asian_end_hour)
london_active = (current_hour >= london_start_hour) and (current_hour < london_end_hour)
// Session boxes - keep previous sessions visible
var box asian_session_box = na
var box london_session_box = na
// Create Asian session box
if show_asian and asian_start
// Create new box at session start (previous box remains visible)
asian_session_box := box.new(bar_index, high, bar_index + 1, low,
border_color=asian_color, bgcolor=color.new(asian_color, 90),
border_width=2, border_style=line.style_solid)
// Pre-calculate session highs and lows for consistency
asian_session_length = asian_active and not na(asian_session_box) ? bar_index - box.get_left(asian_session_box) + 1 : 1
current_asian_high = ta.highest(high, asian_session_length)
current_asian_low = ta.lowest(low, asian_session_length)
// Update Asian session box continuously during session
if show_asian and asian_active and not na(asian_session_box)
box.set_right(asian_session_box, bar_index)
// Update box to contain session highs and lows
box.set_top(asian_session_box, current_asian_high)
box.set_bottom(asian_session_box, current_asian_low)
// Create London session box
if show_london and london_start
// Create new box at session start (previous box remains visible)
london_session_box := box.new(bar_index, high, bar_index + 1, low,
border_color=london_color, bgcolor=color.new(london_color, 90),
border_width=2, border_style=line.style_solid)
// Pre-calculate London session highs and lows for consistency
london_session_length = london_active and not na(london_session_box) ? bar_index - box.get_left(london_session_box) + 1 : 1
current_london_high = ta.highest(high, london_session_length)
current_london_low = ta.lowest(low, london_session_length)
// Update London session box continuously during session
if show_london and london_active and not na(london_session_box)
box.set_right(london_session_box, bar_index)
// Update box to contain session highs and lows
box.set_top(london_session_box, current_london_high)
box.set_bottom(london_session_box, current_london_low)
// Asian Session Swing Points Detection
var float asian_session_high = na
var float asian_session_low = na
var int asian_high_bar = na
var int asian_low_bar = na
// Asian Session Absolute High/Low for TP levels
var float asian_absolute_high = na
var float asian_absolute_low = na
var line asian_high_line = na
var line asian_low_line = na
var label asian_high_label = na
var label asian_low_label = na
var bool high_broken = false
var bool low_broken = false
// London Session High/Low tracking for stop loss
var float london_session_high = na
var float london_session_low = na
// Market structure tracking variables
var string breakout_direction = na // "bullish" or "bearish"
var float last_hh_level = na // Last Higher High level
var float last_hl_level = na // Last Higher Low level
var float last_ll_level = na // Last Lower Low level
var float last_lh_level = na // Last Lower High level
var int structure_count = 0
var string last_structure_type = na // "HH", "HL", "LL", "LH"
// Legacy variables for compatibility
var float last_swing_high = na
var float last_swing_low = na
var int last_high_bar = na
var int last_low_bar = na
// Market structure state tracking
var float pending_high = na
var float pending_low = na
var int pending_high_bar = na
var int pending_low_bar = na
var bool waiting_for_confirmation = false
// Break of Structure tracking variables
var float most_recent_hl = na
var float most_recent_lh = na
var int most_recent_hl_bar = na
var int most_recent_lh_bar = na
var bool bos_detected = false
// Trading variables
var bool trade_taken = false
// Trade visualization boxes (based on Casper strategy approach)
var box current_profit_box = na
var box current_sl_box = na
// Update swing points during Asian session
if asian_active and show_swing_points
// Always track absolute high/low for both TP levels and breakout detection
if na(asian_absolute_high) or high > asian_absolute_high
asian_absolute_high := high
if na(asian_absolute_low) or low < asian_absolute_low
asian_absolute_low := low
// Use absolute high/low for breakout levels (simplified logic)
if na(asian_session_high) or high > asian_session_high
asian_session_high := high
asian_high_bar := bar_index
if na(asian_session_low) or low < asian_session_low
asian_session_low := low
asian_low_bar := bar_index
// Track London session high/low for stop loss levels
if london_active
if na(london_session_high) or high > london_session_high
london_session_high := high
if na(london_session_low) or low < london_session_low
london_session_low := low
// Draw initial lines when Asian session ends
if asian_end and show_swing_points
if not na(asian_session_high) and not na(asian_high_bar)
// Draw extending line for high
asian_high_line := line.new(asian_high_bar, asian_session_high, bar_index + 200, asian_session_high,
color=swing_high_color, width=2, style=line.style_dashed, extend=extend.right)
asian_high_label := label.new(bar_index + 5, asian_session_high, "Asian High: " + str.tostring(asian_session_high, "#.####"), style=label.style_label_left, color=swing_high_color, textcolor=color.white, size=size.small)
if not na(asian_session_low) and not na(asian_low_bar)
// Draw extending line for low
asian_low_line := line.new(asian_low_bar, asian_session_low, bar_index + 200, asian_session_low,
color=swing_low_color, width=2, style=line.style_dashed, extend=extend.right)
asian_low_label := label.new(bar_index + 5, asian_session_low, "Asian Low: " + str.tostring(asian_session_low, "#.####"), style=label.style_label_left, color=swing_low_color, textcolor=color.white, size=size.small)
// Reset break flags for new session
high_broken := false
low_broken := false
// Check for breakouts during London session
if london_active and show_swing_points and not na(asian_session_high) and not na(asian_session_low)
// Check if Asian high is broken
if not high_broken and not low_broken and high > asian_session_high
high_broken := true
// Update high line to end at break point
if not na(asian_high_line)
line.set_x2(asian_high_line, bar_index)
line.set_extend(asian_high_line, extend.none)
// Remove the low line (first break wins)
if not na(asian_low_line)
line.delete(asian_low_line)
if not na(asian_low_label)
label.delete(asian_low_label)
// Add break marker
label.new(bar_index, asian_session_high * 1.001, "HIGH BREAK!",
style=label.style_label_down, color=color.red, textcolor=color.white, size=size.normal)
// Set breakout direction and initialize structure tracking
breakout_direction := "bullish"
last_swing_high := asian_session_high
last_swing_low := asian_session_low
last_high_bar := bar_index
structure_count := 0
// Check if Asian low is broken
if not low_broken and not high_broken and low < asian_session_low
low_broken := true
// Update low line to end at break point
if not na(asian_low_line)
line.set_x2(asian_low_line, bar_index)
line.set_extend(asian_low_line, extend.none)
// Remove the high line (first break wins)
if not na(asian_high_line)
line.delete(asian_high_line)
if not na(asian_high_label)
label.delete(asian_high_label)
// Add break marker
label.new(bar_index, asian_session_low * 0.999, "LOW BREAK!",
style=label.style_label_up, color=color.red, textcolor=color.white, size=size.normal)
// Set breakout direction and initialize structure tracking
breakout_direction := "bearish"
last_swing_high := asian_session_high
last_swing_low := asian_session_low
last_low_bar := bar_index
structure_count := 0
// Stop extending lines when London session ends (if not already broken)
if london_end and show_swing_points
if not high_broken and not na(asian_high_line)
line.set_x2(asian_high_line, bar_index)
line.set_extend(asian_high_line, extend.none)
if not low_broken and not na(asian_low_line)
line.set_x2(asian_low_line, bar_index)
line.set_extend(asian_low_line, extend.none)
// Force close all trades at London session end (if enabled)
if london_end and force_london_close
if strategy.position_size != 0
// Extend boxes immediately before session close to prevent timing issues
if not na(current_profit_box)
// Ensure minimum 8 bars width or extend to current bar, whichever is longer
box_left = box.get_left(current_profit_box)
min_right = box_left + 8
final_right = math.max(min_right, bar_index)
box.set_right(current_profit_box, final_right)
current_profit_box := na // Clear reference after extending
if not na(current_sl_box)
// Ensure minimum 8 bars width or extend to current bar, whichever is longer
box_left = box.get_left(current_sl_box)
min_right = box_left + 8
final_right = math.max(min_right, bar_index)
box.set_right(current_sl_box, final_right)
current_sl_box := na // Clear reference after extending
strategy.close_all(comment="London Close")
trade_taken := false // Reset trade flag for next session
// Market structure detection after breakout (only during London session and before first BoS)
if show_market_structure and not na(breakout_direction) and london_active and not bos_detected
// Bullish structure tracking (HH, HL alternating)
if breakout_direction == "bullish"
// Check for Higher High pattern: Bullish candle followed by bearish candle
pattern_high = math.max(high , high)
prev_hh = na(last_hh_level) ? last_swing_high : last_hh_level
// HH Detection: Only if we expect HH next (no last structure or last was HL)
if (na(last_structure_type) or last_structure_type == "HL") and close > open and close < open and pattern_high > prev_hh and close > prev_hh
// Check consolidation
is_too_close = not na(last_high_bar) and (bar_index - last_high_bar) <= 4
should_create_hh = true
if is_too_close and structure_count > 0 and pattern_high <= last_hh_level
should_create_hh := false
if should_create_hh
structure_count := structure_count + 1
label.new(bar_index - 1, high + (high * 0.0003), "HH" + str.tostring(structure_count),
style=label.style_none, color=color.new(color.white, 100),
textcolor=color.white, size=size.small)
last_hh_level := pattern_high
last_swing_high := pattern_high
last_high_bar := bar_index
last_structure_type := "HH"
// HL Detection: Only if we expect HL next (last was HH)
pattern_low = math.min(low , low)
prev_hl = na(last_hl_level) ? last_swing_low : last_hl_level
if last_structure_type == "HH" and close < open and close > open and pattern_low > prev_hl and close > prev_hl
// Check consolidation
is_too_close = not na(last_low_bar) and (bar_index - last_low_bar) <= 4
should_create_hl = true
if is_too_close and pattern_low <= last_hl_level
should_create_hl := false
if should_create_hl
structure_count := structure_count + 1
label.new(bar_index - 1, low - (low * 0.0003), "HL" + str.tostring(structure_count),
style=label.style_none, color=color.new(color.white, 100),
textcolor=color.white, size=size.small)
last_hl_level := pattern_low
most_recent_hl := pattern_low // Update most recent HL for BoS detection
most_recent_hl_bar := bar_index - 1 // Store HL bar position
last_low_bar := bar_index
last_structure_type := "HL"
// Bearish structure tracking (LL, LH alternating)
if breakout_direction == "bearish"
// Check for Lower Low pattern: Bearish candle followed by bullish candle
pattern_low = math.min(low , low)
prev_ll = na(last_ll_level) ? last_swing_low : last_ll_level
// LL Detection: Only if we expect LL next (no last structure or last was LH)
if (na(last_structure_type) or last_structure_type == "LH") and close < open and close > open and pattern_low < prev_ll and close < prev_ll
// Check consolidation
is_too_close = not na(last_low_bar) and (bar_index - last_low_bar) <= 4
should_create_ll = true
if is_too_close and structure_count > 0 and pattern_low >= last_ll_level
should_create_ll := false
if should_create_ll
structure_count := structure_count + 1
label.new(bar_index - 1, low - (low * 0.0003), "LL" + str.tostring(structure_count),
style=label.style_none, color=color.new(color.white, 100),
textcolor=color.white, size=size.small)
last_ll_level := pattern_low
last_swing_low := pattern_low
last_low_bar := bar_index
last_structure_type := "LL"
// LH Detection: Only if we expect LH next (last was LL)
pattern_high = math.max(high , high)
prev_lh = na(last_lh_level) ? last_swing_high : last_lh_level
if last_structure_type == "LL" and close > open and close < open and pattern_high < prev_lh and close < prev_lh
// Check consolidation
is_too_close = not na(last_high_bar) and (bar_index - last_high_bar) <= 4
should_create_lh = true
if is_too_close and pattern_high >= last_lh_level
should_create_lh := false
if should_create_lh
structure_count := structure_count + 1
label.new(bar_index - 1, high + (high * 0.0003), "LH" + str.tostring(structure_count),
style=label.style_none, color=color.new(color.white, 100),
textcolor=color.white, size=size.small)
last_lh_level := pattern_high
most_recent_lh := pattern_high // Update most recent LH for BoS detection
most_recent_lh_bar := bar_index - 1 // Store LH bar position
last_high_bar := bar_index
last_structure_type := "LH"
// Check if we're within the cutoff period before London session end
current_minute = minute(time, session_timezone)
london_end_time_minutes = london_end_hour * 60 // Convert London end hour to minutes
current_time_minutes = current_hour * 60 + current_minute // Current time in minutes
// Calculate minutes remaining in London session
london_session_minutes_remaining = london_end_time_minutes - current_time_minutes
// Handle day rollover case (e.g., if london_end is 8:00 (480 min) and current is 23:30 (1410 min))
if london_session_minutes_remaining < 0
london_session_minutes_remaining := london_session_minutes_remaining + (24 * 60) // Add 24 hours in minutes
// Only allow trades if more than cutoff_minutes remaining in London session
allow_new_trades = london_session_minutes_remaining > cutoff_minutes
// Break of Structure (BoS) Detection and Trading Logic - Only first BoS per London session and outside cutoff period
if show_bos and london_active and show_market_structure and not bos_detected and not trade_taken and allow_new_trades
// Bullish BoS: Price closes below the most recent HL (after bullish breakout) - SELL SIGNAL
if breakout_direction == "bullish" and not na(most_recent_hl) and not na(most_recent_hl_bar)
// Check minimum distance requirement (at least 4 candles between BoS and HL)
if close < most_recent_hl and (bar_index - most_recent_hl_bar) >= 4
// Draw dotted line from HL position to BoS point
line.new(most_recent_hl_bar, most_recent_hl, bar_index, most_recent_hl,
color=bos_color, width=2, style=line.style_dotted, extend=extend.none)
// Calculate center position for BoS label
center_bar = math.round((most_recent_hl_bar + bar_index) / 2)
// Draw BoS label below the line for HL break
label.new(center_bar, most_recent_hl - (most_recent_hl * 0.0005), "BoS",
style=label.style_none, color=color.new(color.white, 100),
textcolor=bos_color, size=size.normal)
// SELL ENTRY
if not na(london_session_high) and not na(asian_absolute_low)
// Calculate stop loss based on settings
stop_loss_level = use_atr_sl ? close + (atr * atr_multiplier) : london_session_high
take_profit_level = asian_absolute_low
entry_price = close
// Calculate position size based on user settings
position_size = calculate_position_size(entry_price, stop_loss_level)
strategy.entry("SELL", strategy.short, qty=position_size, comment="BoS Sell")
strategy.exit("SELL EXIT", "SELL", stop=stop_loss_level, limit=take_profit_level, comment="SL/TP")
// Create trade visualization boxes (TradingView style) - minimum 8 bars width
// Blue profit zone box (from entry to take profit)
current_profit_box := box.new(left=bar_index, top=take_profit_level, right=bar_index + 8, bottom=entry_price,
bgcolor=color.new(color.blue, 70), border_width=0)
// Red stop loss zone box (from entry to stop loss)
current_sl_box := box.new(left=bar_index, top=entry_price, right=bar_index + 8, bottom=stop_loss_level,
bgcolor=color.new(color.red, 70), border_width=0)
trade_taken := true
bos_detected := true // Mark BoS as detected for this session
// Bearish BoS: Price closes above the most recent LH (after bearish breakout) - BUY SIGNAL
if breakout_direction == "bearish" and not na(most_recent_lh) and not na(most_recent_lh_bar)
// Check minimum distance requirement (at least 4 candles between BoS and LH)
if close > most_recent_lh and (bar_index - most_recent_lh_bar) >= 4
// Draw dotted line from LH position to BoS point
line.new(most_recent_lh_bar, most_recent_lh, bar_index, most_recent_lh,
color=bos_color, width=1, style=line.style_dotted, extend=extend.none)
// Calculate center position for BoS label
center_bar = math.round((most_recent_lh_bar + bar_index) / 2)
// Draw BoS label above the line for LH break
label.new(center_bar, most_recent_lh + (most_recent_lh * 0.0005), "BoS",
style=label.style_none, color=color.new(color.white, 100),
textcolor=bos_color, size=size.normal)
// BUY ENTRY
if not na(london_session_low) and not na(asian_absolute_high)
// Calculate stop loss based on settings
stop_loss_level = use_atr_sl ? close - (atr * atr_multiplier) : london_session_low
take_profit_level = asian_absolute_high
entry_price = close
// Calculate position size based on user settings
position_size = calculate_position_size(entry_price, stop_loss_level)
strategy.entry("BUY", strategy.long, qty=position_size, comment="BoS Buy")
strategy.exit("BUY EXIT", "BUY", stop=stop_loss_level, limit=take_profit_level, comment="SL/TP")
// Create trade visualization boxes (TradingView style) - minimum 8 bars width
// Blue profit zone box (from entry to take profit)
current_profit_box := box.new(left=bar_index, top=entry_price, right=bar_index + 8, bottom=take_profit_level,
bgcolor=color.new(color.blue, 70), border_width=0)
// Red stop loss zone box (from entry to stop loss)
current_sl_box := box.new(left=bar_index, top=stop_loss_level, right=bar_index + 8, bottom=entry_price,
bgcolor=color.new(color.red, 70), border_width=0)
trade_taken := true
bos_detected := true // Mark BoS as detected for this session
// Position close detection for extending boxes (based on Casper strategy)
if barstate.isconfirmed and strategy.position_size == 0 and strategy.position_size != 0
// Extend trade visualization boxes to exact exit point when position closes
if not na(current_profit_box)
// Ensure minimum 8 bars width or extend to current bar, whichever is longer
box_left = box.get_left(current_profit_box)
min_right = box_left + 8
final_right = math.max(min_right, bar_index)
box.set_right(current_profit_box, final_right)
current_profit_box := na // Clear reference after extending
if not na(current_sl_box)
// Ensure minimum 8 bars width or extend to current bar, whichever is longer
box_left = box.get_left(current_sl_box)
min_right = box_left + 8
final_right = math.max(min_right, bar_index)
box.set_right(current_sl_box, final_right)
current_sl_box := na // Clear reference after extending
// Backup safety check - extend boxes if position is closed but boxes still active
if not na(current_profit_box) and strategy.position_size == 0
box_left = box.get_left(current_profit_box)
min_right = box_left + 8
final_right = math.max(min_right, bar_index)
box.set_right(current_profit_box, final_right)
current_profit_box := na
if not na(current_sl_box) and strategy.position_size == 0
box_left = box.get_left(current_sl_box)
min_right = box_left + 8
final_right = math.max(min_right, bar_index)
box.set_right(current_sl_box, final_right)
current_sl_box := na
// Reset everything when new Asian session starts
if asian_start and show_swing_points
asian_session_high := na
asian_session_low := na
asian_high_bar := na
asian_low_bar := na
// Reset absolute levels
asian_absolute_high := na
asian_absolute_low := na
asian_high_line := na
asian_low_line := na
asian_high_label := na
asian_low_label := na
high_broken := false
low_broken := false
// Reset London session levels
london_session_high := na
london_session_low := na
// Reset market structure tracking
breakout_direction := na
last_hh_level := na
last_hl_level := na
last_ll_level := na
last_lh_level := na
last_swing_high := na
last_swing_low := na
last_high_bar := na
last_low_bar := na
structure_count := 0
last_structure_type := na
pending_high := na
pending_low := na
pending_high_bar := na
pending_low_bar := na
waiting_for_confirmation := false
// Reset BoS tracking
most_recent_hl := na
most_recent_lh := na
most_recent_hl_bar := na
most_recent_lh_bar := na
bos_detected := false
// Reset trading
trade_taken := false
// Reset current trade boxes
current_profit_box := na
current_sl_box := na
// Debug info (optional)
show_debug = input.bool(false, "Show Debug Info")
if show_debug
var table debug_table = table.new(position.top_right, 2, 3, bgcolor=color.white, border_width=1)
if barstate.islast
table.cell(debug_table, 0, 0, "Current Hour:", text_color=color.black)
table.cell(debug_table, 1, 0, str.tostring(current_hour), text_color=color.black)
table.cell(debug_table, 0, 1, "Asian Active:", text_color=color.black)
table.cell(debug_table, 1, 1, str.tostring((current_hour >= asian_start_hour) or (current_hour < asian_end_hour)), text_color=color.black)
table.cell(debug_table, 0, 2, "London Active:", text_color=color.black)
table.cell(debug_table, 1, 2, str.tostring((current_hour >= london_start_hour) and (current_hour < london_end_hour)), text_color=color.black)

Market Sessions — VerticalA clean visual guide to global market sessions.
This indicator plots vertical lines at the opening and closing times of the four major forex sessions:
London, New York, Tokyo, and Sydney.
Fully customizable — toggle each session on/off, choose separate colors for open/close, and enable/disable labels.
Supports both Local (auto-DST) and GMT (fixed) modes — switch between realistic market-clock times or the standardized UTC schedule used by most trading resources.
Helps you visually identify session overlaps (e.g., London–New York) where volatility typically increases.
Ideal for forex, indices, and commodities traders who trade around session opens.
Default session times (GMT mode):
Sydney 21:00 – 06:00 GMT
Tokyo 00:00 – 09:00 GMT
London 08:00 – 17:00 GMT
New York 13:00 – 22:00 GMT
Tip: Set Anchor times by → Local (auto-DST) if you want the lines to follow each region’s real-world daylight-saving adjustments automatically.
Clean, lightweight, and built for traders who want precise, minimal clutter — just the key time windows that move the market.

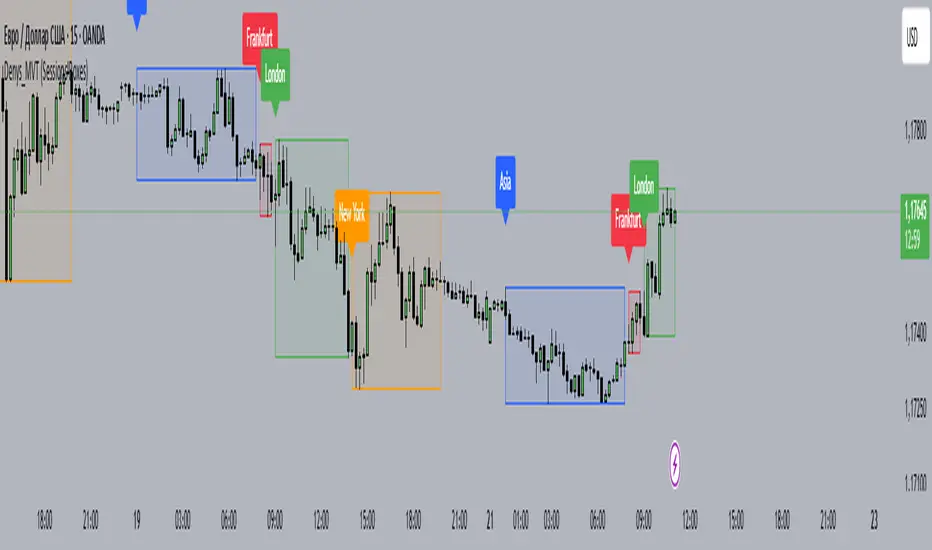
Denys_MVT (Sessions Boxes)Denys_MVT (Sessions Boxes)
This indicator highlights the main trading sessions — Asia, Frankfurt, London, and New York — directly on the chart.
It helps traders visually separate market activity during different times of the day and quickly understand which session is currently active.
🔹 How it works
You can choose between Box Mode (draws a box around the session’s high and low) or Fill Mode (background color for the session).
Each session has its own customizable time range and color.
Labels can be placed automatically at the beginning of each session.
The script uses the time() function with your selected UTC offset to precisely map session times.
🔹 Features
Displays Asia, Frankfurt, London, and New York sessions.
Option to toggle between boxes and background shading.
Adjustable transparency and session colors.
Session labels for easier visual reference.
Works on any symbol and timeframe.
🔹 How to use
Add the indicator to your chart.
Set your local UTC offset in the settings (default: UTC+2).
Enable/disable sessions, change colors, or switch between Box/Fill mode.
Use the session highlights to better understand when volatility typically increases and how different sessions interact.
RTH Session Range Position (0-100) with EMAA Pine Script indicator designed to help traders understand where the current price is located within the Regular Trading Hours (RTH) session range, from 0 (session low) to 100 (session high). It also plots a smoothed EMA of this position to provide insight into momentum or trend during the RTH session.
What the Indicator Does
Defines RTH (Regular Trading Hours):
Start: 9:30 AM
End: 4:00 PM
These are typical US equity market hours.
Tracks the session's high and low during RTH:
sessionHigh and sessionLow update only during RTH.
Calculates position of the current price within the RTH range:
Formula: ((close - sessionLow) / (sessionHigh - sessionLow)) * 100
Result is a percentage:
0 = at session low
100 = at session high
50 = middle of session range
Calculates an EMA of that position (posEMA):
Smooths out the raw position to help visualize momentum within the range.
Plots and table:
Plots pos and posEMA on a separate chart pane.
Adds horizontal lines at key levels (0, 30, 50, 70, 100).
Table shows current values for Position, EMA, and Range.
Visual cues:
bgcolor highlights when pos crosses over or under the EMA — potential momentum shifts.
Alerts:
Cross above/below 50 (session midpoint).
Cross above/below EMA.
How to Use It Effectively
1. Session Strength & Momentum
Position above 70: Price is near session highs — strong upward momentum.
Position below 30: Price is near session lows — strong downward momentum.
Use the EMA of position to filter out noise and identify trends.
2. Breakout or Reversal Detection
Cross above EMA: Momentum may be turning bullish.
Cross below EMA: Momentum may be turning bearish.
These crosses (especially near mid-levels like 50) can hint at session trend shifts.
3. Range Context for Entries
If you're a mean-reversion trader, look for:
Price > 70 + turning down below EMA → possible short.
Price < 30 + turning up above EMA → possible long.
For breakout traders, you might wait for:
Crosses above 70 with EMA support.
Crosses below 30 with EMA resistance.
4. Confirmation Tool
Use this indicator alongside others to confirm:
Whether price action has strength within the day.
Whether breakouts have real momentum or are extended already.

ICT Silver Bullet Zones (All Sessions)This Pine Script v6 indicator highlights the ICT Silver Bullet windows (10:00–11:00 local time) for all major forex/trading sessions: London, New York AM, New York PM, and Asia.
✅ Features:
Clearly visualizes Silver Bullet zones for each session.
Labels are centered inside each zone for easy identification.
Fully compatible with Pine Script v6 and TradingView.
Adjustable opacity and label size for better chart visibility.
Works on any timeframe and keeps historical zones visible.
Use Case:
Perfect for ICT strategy traders who want to identify high-probability trading windows during major market sessions. Helps in planning entries and understanding liquidity timing without cluttering the chart.
Instructions:
Add the script to your TradingView chart.
Adjust opacity and label size to suit your chart style.
Observe the SB zones for all sessions and plan trades according to ICT methodology.

Multi-Session ORBThe Multi-Session ORB Indicator is a customizable Pine Script (version 6) tool designed for TradingView to plot Opening Range Breakout (ORB) levels across four major trading sessions: Sydney, Tokyo, London, and New York. It allows traders to define specific ORB durations and session times in Central Daylight Time (CDT), making it adaptable to various trading strategies.
Key Features:
1. Customizable ORB Duration: Users can set the ORB duration (default: 15 minutes) via the inputMax parameter, determining the time window for calculating the high and low of each session’s opening range.
2. Flexible Session Times: The indicator supports user-defined session and ORB times for:
◦ Sydney: Default ORB (17:00–17:15 CDT), Session (17:00–01:00 CDT)
◦ Tokyo: Default ORB (19:00–19:15 CDT), Session (19:00–04:00 CDT)
◦ London: Default ORB (02:00–02:15 CDT), Session (02:00–11:00 CDT)
◦ New York: Default ORB (08:30–08:45 CDT), Session (08:30–16:00 CDT)
3. Session-Specific ORB Levels: For each session, the indicator calculates and tracks the high and low prices during the specified ORB period. These levels are updated dynamically if new highs or lows occur within the ORB timeframe.
4. Visual Representation:
◦ ORB high and low lines are plotted only during their respective session times, ensuring clarity.
◦ Each session’s lines are color-coded for easy identification:
▪ Sydney: Light Yellow (high), Dark Yellow (low)
▪ Tokyo: Light Pink (high), Dark Pink (low)
▪ London: Light Blue (high), Dark Blue (low)
▪ New York: Light Purple (high), Dark Purple (low)
◦ Lines are drawn with a linewidth of 2 and disappear when the session ends or if the timeframe is not intraday (or exceeds the ORB duration).
5. Intraday Compatibility: The indicator is optimized for intraday timeframes (e.g., 1-minute to 15-minute charts) and only displays when the chart’s timeframe multiplier is less than or equal to the ORB duration.
How It Works:
• Session Detection: The script uses the time() function to check if the current bar falls within the user-defined ORB or session time windows, accounting for all days of the week.
• ORB Logic: At the start of each session’s ORB period, the script initializes the high and low based on the first bar’s prices. It then updates these levels if subsequent bars within the ORB period exceed the current high or fall below the current low.
• Plotting: ORB levels are plotted as horizontal lines during the respective session, with visibility controlled to avoid clutter outside session times or on incompatible timeframes.
Use Case:
Traders can use this indicator to identify key breakout levels for each trading session, facilitating strategies based on price action around the opening range. The flexibility to adjust ORB and session times makes it suitable for various markets (e.g., forex, stocks, or futures) and time zones.
Limitations:
• The indicator is designed for intraday timeframes and may not display on higher timeframes (e.g., daily or weekly) or if the timeframe multiplier exceeds the ORB duration.
• Time inputs are in CDT, requiring users to adjust for their local timezone or market requirements.
• If you need to use this for GC/CL/SPY/QQQ you have to adjust the times by one hour.
This indicator is ideal for traders focusing on session-based breakout strategies, offering clear visualization and customization for global market sessions.

E9 ASIA Session
*note: Upon updating the script the conversion from V4 to v5 has lost the weekend extended lines and now prints an asia session for each day. It is recommended (esp for crypto) to extend these lines across the weekend like in the chart example above.
The E9 Asia Session Indicator is a valuable tool for traders aiming to track and analyze the Asia trading session on financial charts. This indicator provides insights into price behavior during the Asia session, which is crucial for making informed trading decisions. Here's an overview of its key functionalities and uses:
1. Session Highs and Lows
Purpose:
The indicator calculates and plots the high and low of the Asia session.
It helps identify key levels of support and resistance established during this trading period.
Importance:
These levels can act as significant reference points for future price movements.
Price action that occurs near these levels often provides clues about potential breakouts or reversals.
2. Session Background Color
Purpose:
The indicator can shade the background of the chart during the Asia session.
Importance:
This visual cue helps quickly identify the session's timeframe, enhancing the trader’s ability to observe price behavior within this specific period.
It aids in distinguishing between different trading sessions and understanding their influence on price action.
3. Start of Session Marker
Purpose:
A visual marker (such as a circle) is plotted at the beginning of each Asia session.
Importance:
This marker helps traders visually pinpoint the start of the session, making it easier to analyze how the price reacts from the session's opening.
4. End of Session Marker
Purpose:
A marker is plotted at the end of the Asia session, indicating where the session closes.
Importance:
This marker is useful for tracking the end of the session and observing price behavior around this critical juncture.
It helps in analyzing whether the session's high or low gets revisited or broken in subsequent sessions.
Practical Uses:
Strategic Planning: Traders can use the plotted high and low levels to set their trading strategies, stop-loss orders, and profit targets.
Market Analysis: Understanding how price interacts with the Asia session’s high and low levels can provide insights into market sentiment and potential price movements.
By incorporating the E9 Asia Session Indicator into your trading toolkit, you can gain a deeper understanding of the Asia session's impact on price dynamics, enhancing your overall trading strategy and decision-making process.
Disclaimer: The information contained in this article does not constitute financial advice or a solicitation to buy or sell any securities. All investments involve risk, and past performance does not guarantee future results. Always evaluate your financial circumstances and investment objectives before making trading decisions.
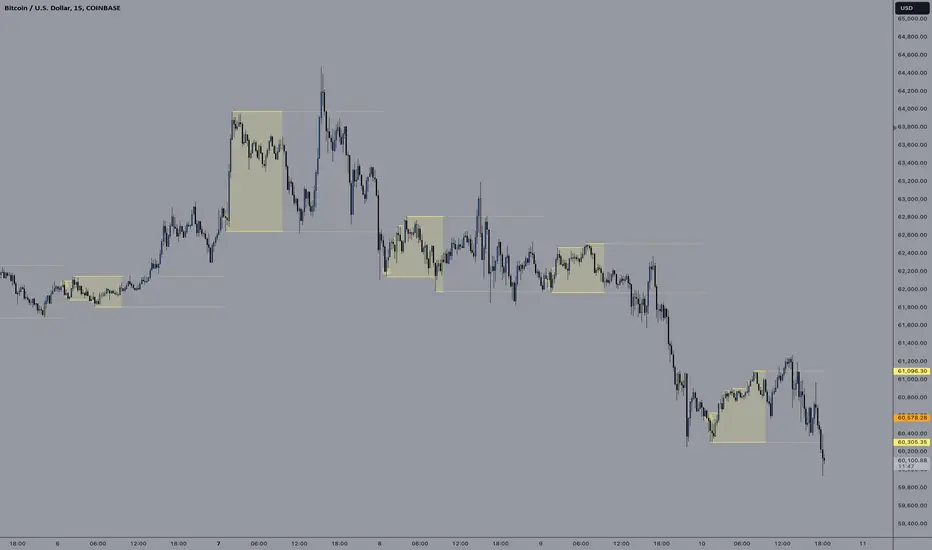
Forex Session Volume ExplorerFigure out the best time to trade your favorite Currency Pair, Commodity, or Crypto!
This indicator is an exploration of how Forex Sessions affect volume. The colored plots below represent the accumulative volume during each of the four major trading sessions: London, New York, Tokyo, and Sydney.
Plots have been normalized as a percentage of total volume, i.e. London = 34.2 signifies that 34.2% of all volume occurs during the London Session.
Trading the session with the highest volume will greatly benefit your Win Rate, especially when using "typical" indicators and strategies.
Use in conjunction with my previous tool for a clean & customizable visual representation of Forex Sesssions:
Forex Trading Sessions
Cheers,
EFX (@DasanC)

Asia & London Session High/Low – EOD Segments (v4.5)What it does
Plots the Asia and London session high & low each day.
When a session ends, its high/low are locked (non-repainting) and drawn as horizontal segments that auto-extend to the end of that same day (no infinite rays).
Optional labels show the exact level at session close.
Toggle whether to keep prior days on the chart or auto-clear them on the first bar of a new day.
Why traders use it
Quickly see overnight liquidity levels that often act as magnets or barriers during the U.S. session.
Map session range extremes for breakout/reversal planning, partials, and invalidation.
Works great alongside VWAP, 8/20/200 MAs, or your NY session tools to build confluence.
How it works
You define the session windows (defaults: Asia 00:00–06:00, London 07:00–11:00).
While a session is active, the script tracks running high/low.
On the bar after the session ends, the level is finalized and drawn; the segment’s right edge updates each bar until EOD, then stops automatically.
Inputs
Session Timezone: “Exchange”, UTC, or a specific region (set this to match your venue).
Asia / London Session: editable HHMM-HHMM windows.
Show Asia / Show London: enable either/both sessions.
Keep history: keep or auto-delete previous days.
Show labels: price labels at session close.
Colors & width: customize high/low colors and line width.
Best practices
Use on intraday timeframes (1–60m).
For equities/futures, set timezone to your exchange (e.g., America/New_York). For FX/crypto, pick what matches your workflow.
Common tweak: London 08:00–12:00 local; Asia 00:00–05:00 or your broker’s definition.
Notes
Non-repainting: levels only print once the session is complete.
Designed to be light and reliable—no boxes, just clean lines and labels.
If you want NY session levels, midlines (50%), anchored stop-time, or alerts on touches, this script can be extended.
For educational use only. Not financial advice.

KEY MARKET SESSION EU/US RANGE LEVELS - KLT🔹 KEY MARKET SESSION EU/US RANGE LEVELS - KLT
This indicator highlights critical trading levels during the European and U.S. sessions, with Overbought (OB) and Oversold (OS) markers derived from each session's price range.
It’s designed to support traders in identifying key zones of interest and historical price reactions across sessions.
✳️ Features
🕒 Session Recognition
European Session (EU): 08:00 to 14:00 UTC
United States Session (US): 14:30 to 21:00 UTC
The indicator automatically detects the current session and updates levels in real time.
📈 Overbought / Oversold (OB/OS) Levels
Helps identify potential reversal or reaction zones.
🔁 Previous Session OB/OS Crosses
OB/OS levels from the previous session are plotted as white crosses during the opposite session:
EU OB/OS shown during the US session
US OB/OS shown during the EU session
These levels act as potential price targets or reaction areas based on prior session behavior.
🎨 Session-Based Color Coding
EU Session
High/Low: Orange / Fuchsia
OB/OS: Orange / Lime
Previous OB/OS: White crosses during the US session
US Session
High/Low: Aqua / Teal
OB/OS: Aqua / Lime
Previous OB/OS: White crosses during the EU session
🧠 How to Use
Use the OB/OS levels to gauge potential turning points or extended moves.
Watch for previous session crosses to spot historically relevant zones that may attract price.
Monitor extended High/Low lines as potential magnets for price continuation.
🛠 Additional Notes
No repainting; levels are session-locked and tracked in real time.
Optimized for intraday strategies, scalping, and session-based planning.
Works best on assets with clear session behavior (e.g., forex, indices, major commodities).
