Session Statistical Mapping° [Pro+] (Joshuuu)Introduction:
Dive into the dynamic world of statistical market analysis with Session Statistical Mapping Pro+, an advanced tool designed for intraday traders of all asset classes.
Description:
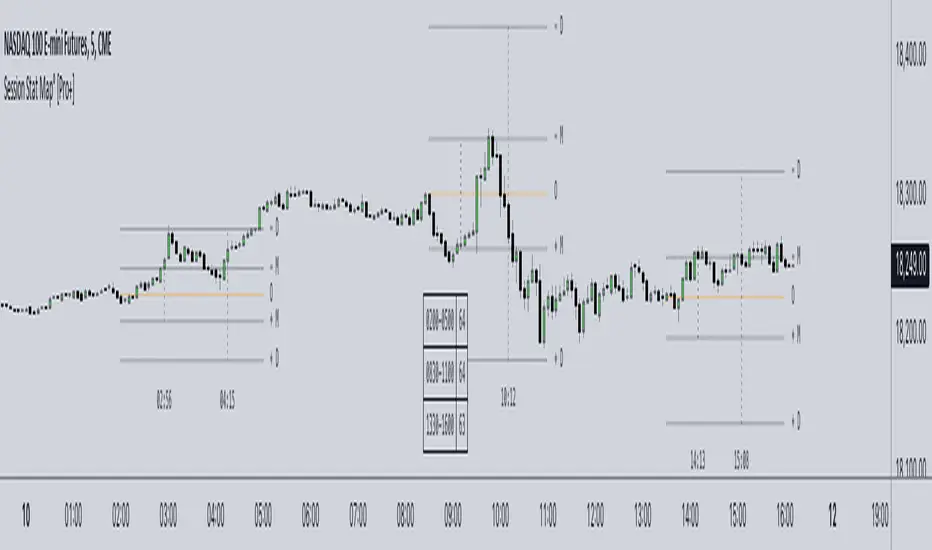
This indicator offers a detailed algorithmic statistical measurement of Time and price, integrating the principles of Inner Circle Trader (ICT) to analyze the market behaviours such as Manipulation, and Distribution. This tool supercharges your trading strategies with data-driven insights.
ICT traders classify manipulation as a movement to trap market participants in the "wrong" direction. This allows analysts to anticipate the intended real direction of the distribution phase.
On the other hand, when price distributes, it's looking to expand for higher – or lower – prices. Analysts can therefore note distribution levels for a draw on liquidity, retracement, or reversal.
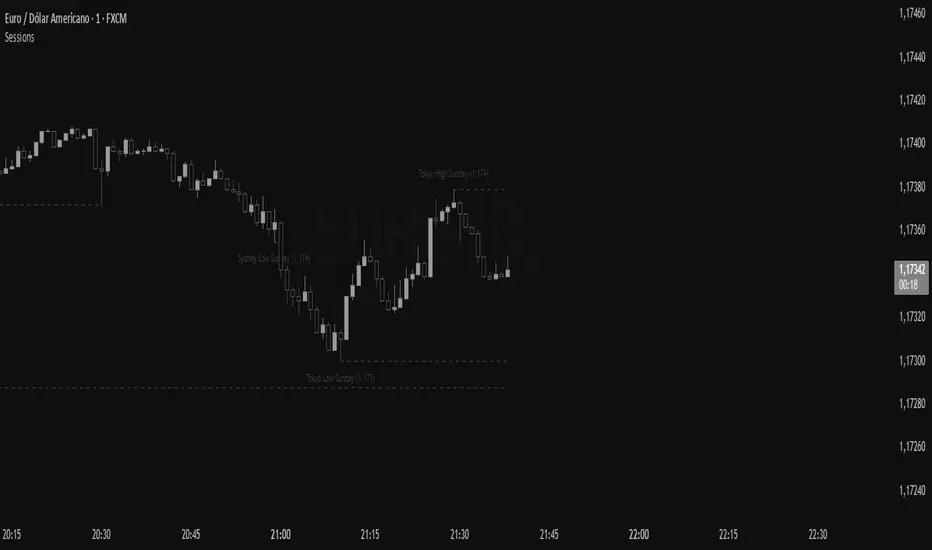
These levels and the Time at which they are reached during the selected session, will provide important information about orderflow when price trades through them and the sequence in which the delivery occurs.
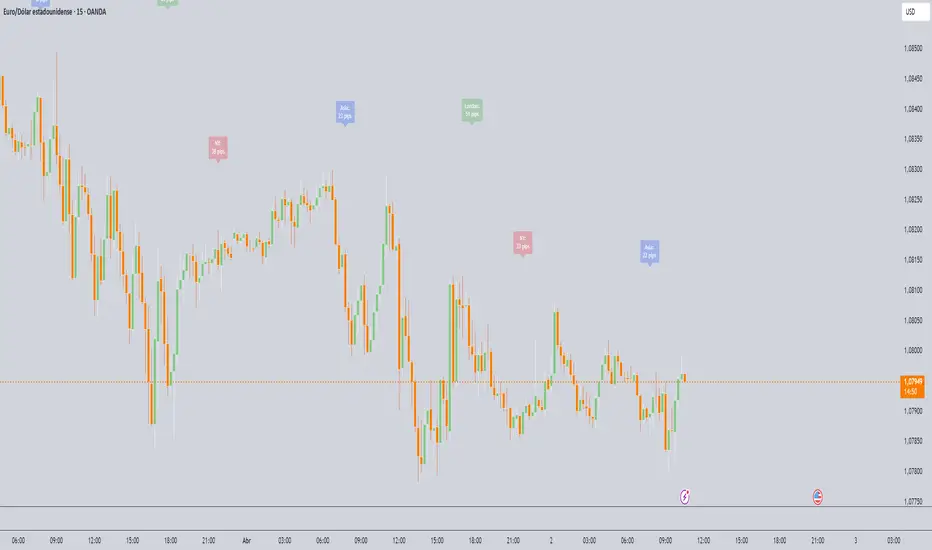
Additionally, to amplify the price mapping, this tool plots the average Time at which its manipulation and distribution phases should complete. This feature allows traders to utilize historical Timings in conjunction with the price levels of manipulation and distribution.
As with any historical data driven tool, analysts should not expect past behaviour to match future performance. This tool was created with a data driven edge to bring attention to when sessions are likely to turn after their manipulations, or retrace after completing set distributions.
Key Features:
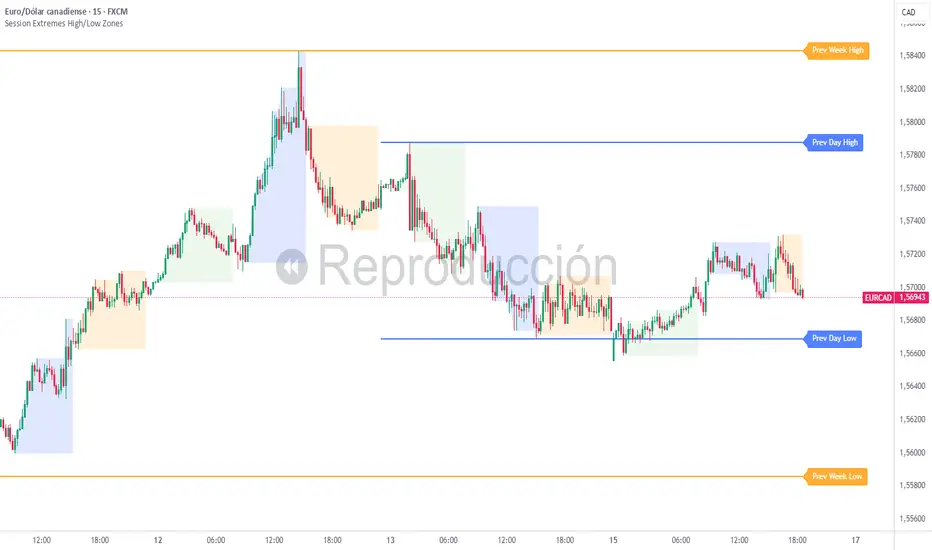
Algorithmic Measurement of Price: Leverage algorithmic theory to measure price movements with precision. This tool calculates average session manipulation and distribution price levels, providing traders with actionable insights based on historical data – key manipulation and distribution levels.
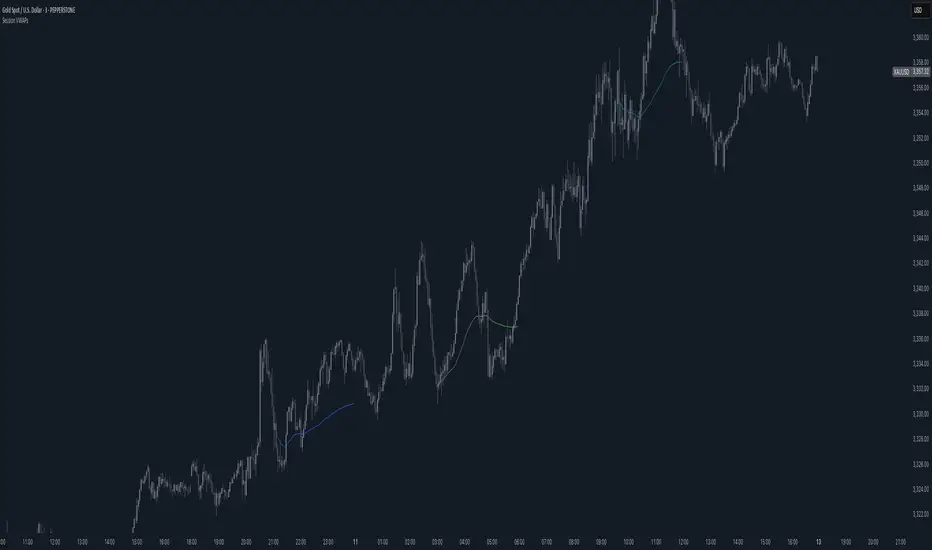
Algorithmic Measurement of Time: Utilize algorithmic theory to measure time-based movements within specific sessions. This tool calculates the projected average Time at which the manipulation and distribution phases are completed during a given session. This feature enhances traders' ability to interpret market movements and align their strategies with Time data.
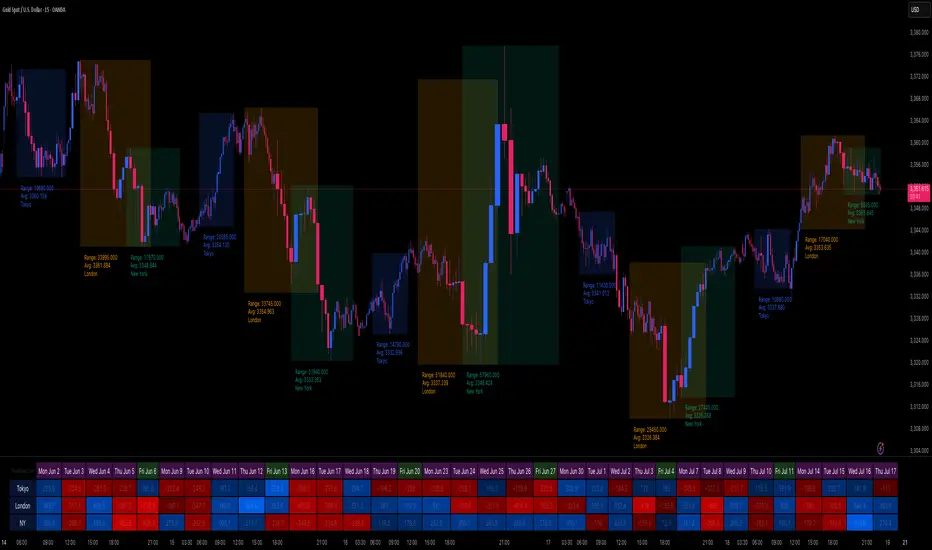
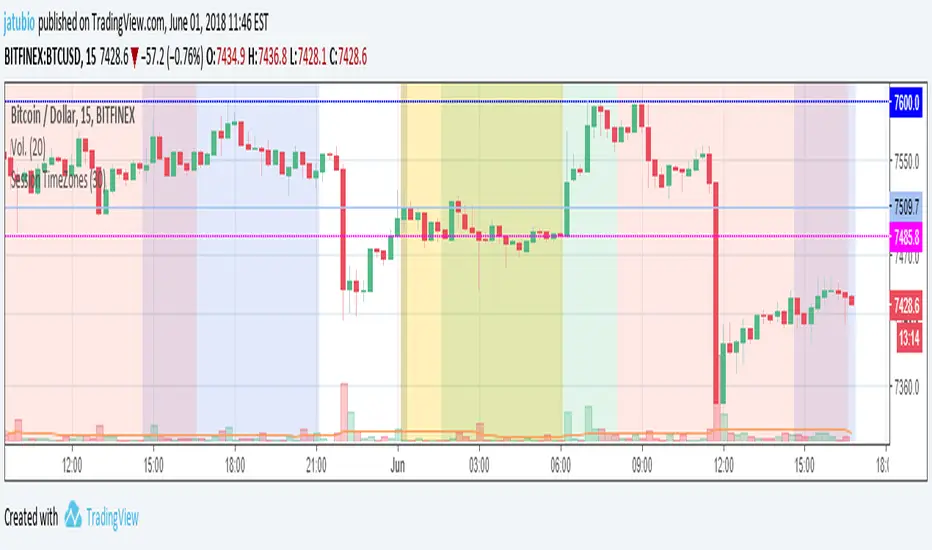
Four Sessions Times: Customize up to four Time ranges to focus on specific trading sessions, such as the European, US, or Asian market sessions. This allows traders to align their analysis with the operational hours of major market participants, capturing the most relevant price movements. Traders can also create unique sessions based on their trading Time to study market behaviour when they usually operate in the markets – unlocking a level of understanding towards their personal backtested model and strategies.
Flexible Calculation: The sample size of the sessions can be set to a specific number – the default is 1000. This allows traders to adjust the depth of historical data used in their analysis, balancing detail and performance.
Further Customization:
Custom Appearance: Adjust the style of session lines with options like dotted, solid, and various colors. This helps traders visually distinguish between different types of market activities (e.g., Open, Manipulation, Distribution) on their charts.
Lookback Periods: Option to show available lookback periods for a deeper historical analysis, providing context and historical benchmarks for current market conditions.
Extended Visualization: Pre-extend lines until session close for better visualization of market phases. This helps traders see the continuation of trends and market behaviours beyond the immediate session.
Clean Chart Layout: Options to delete old labels and abbreviate labels maintain a clean and organized chart, enhancing readability and focus.
Conclusion
By incorporating algorithmic theory Time and price measurements, historical data insights, and the principles of Inner Circle Trader (ICT), this indicator offers a comprehensive approach to understanding market behaviour. Whether you're analyzing price patterns, timing market movements, or combining both, Session Statistical Mapping Pro+ equips you with the potential roadmap of an asset, allowing you to navigate the complexities of the market’s volatility.
Usage Guidance:
Add Session Statistical Mapping Pro to your Tradingview chart.
Choose up to 4 sessions for the mapping to plot on your chart, be sure to adjust your style and visual preferences to differentiate the sessions’ levels.
Observe how calculated manipulation, distributions, and delivery times align together with predetermined analysis.
Leverage this information with other models and insights to create a stronger narrative for your analysis.
These tools are available ONLY on the TradingView platform.
Terms and Conditions
Our charting tools are products provided for informational and educational purposes only and do not constitute financial, investment, or trading advice. Our charting tools are not designed to predict market movements or provide specific recommendations. Users should be aware that past performance is not indicative of future results and should not be relied upon for making financial decisions. By using our charting tools, the purchaser agrees that the seller and the creator are not responsible for any decisions made based on the information provided by these charting tools. The purchaser assumes full responsibility and liability for any actions taken and the consequences thereof, including any loss of money or investments that may occur as a result of using these products. Hence, by purchasing these charting tools, the customer accepts and acknowledges that the seller and the creator are not liable nor responsible for any unwanted outcome that arises from the development, the sale, or the use of these products. Finally, the purchaser indemnifies the seller from any and all liability. If the purchaser was invited through the Friends and Family Program, they acknowledge that the provided discount code only applies to the first initial purchase of the Toodegrees Premium Suite subscription. The purchaser is therefore responsible for cancelling – or requesting to cancel – their subscription in the event that they do not wish to continue using the product at full retail price. If the purchaser no longer wishes to use the products, they must unsubscribe from the membership service, if applicable. We hold no reimbursement, refund, or chargeback policy. Once these Terms and Conditions are accepted by the Customer, before purchase, no reimbursements, refunds or chargebacks will be provided under any circumstances.
By continuing to use these charting tools, the user acknowledges and agrees to the Terms and Conditions outlined in this legal disclaimer.
Script a pagamento