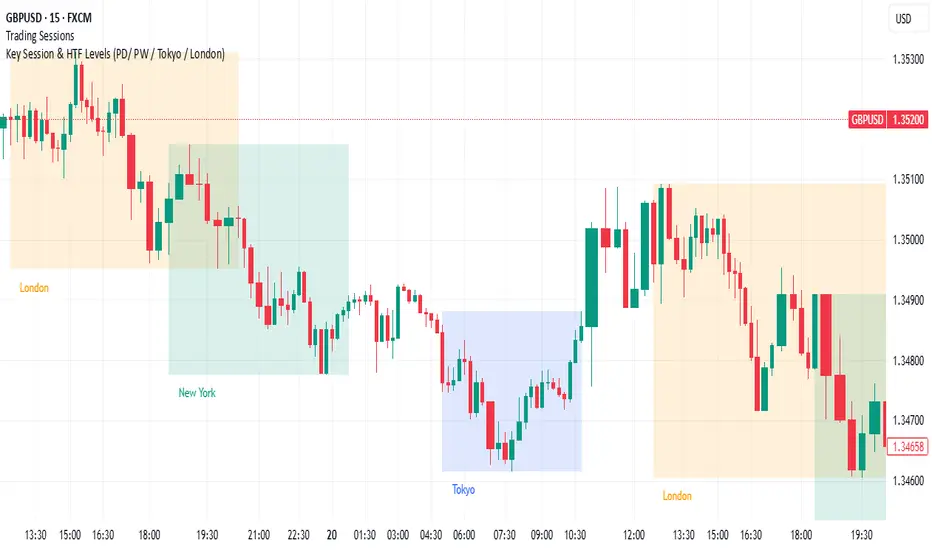
Key Session & LevelsThis indicator helps traders track key price levels for multiple timeframes and trading sessions. It plots:
Previous Day's High and Low (PD): Highlighting the high and low of the previous trading day.
Previous Week's High and Low (PW): Plotting the highest and lowest price levels for the past week.
Tokyo Session High and Low (Today): Displays the high and low levels for the Tokyo trading session (adjustable to your preferred time window).
London Session High and Low (Today): Tracks the high and low for the London trading session (also adjustable for your timezone and desired session window).
Features:
Customizable Time Zones: The indicator uses your preferred timezone to calculate session highs/lows.
Extendable Lines: Lines for each level extend to the right of the chart, providing continuous reference throughout the trading day.
Adjustable Settings: Fine-tune the visibility and width of the lines, and choose which levels to display (Previous Day, Previous Week, Tokyo, and London sessions).
Non-Repainting: This script uses historical data and only updates when new bars are confirmed, ensuring accurate and reliable signals.
Whether you're a day trader, swing trader, or just tracking key levels for strategic entries and exits, this tool provides quick visual reference to important price points across different trading sessions.
Cerca negli script per "session"
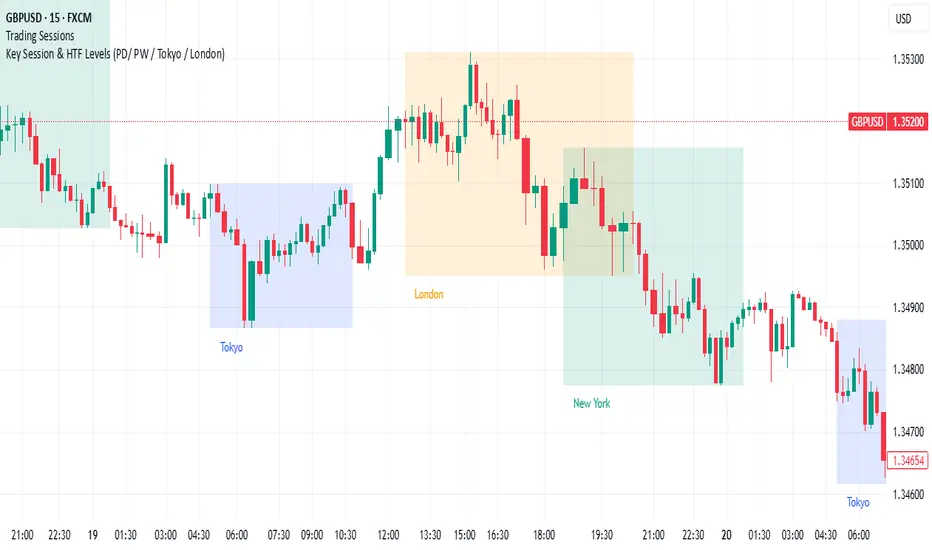
Key Session & LevelsThis indicator helps traders track key price levels for multiple timeframes and trading sessions. It plots:
Previous Day's High and Low (PD): Highlighting the high and low of the previous trading day.
Previous Week's High and Low (PW): Plotting the highest and lowest price levels for the past week.
Tokyo Session High and Low (Today): Displays the high and low levels for the Tokyo trading session (adjustable to your preferred time window).
London Session High and Low (Today): Tracks the high and low for the London trading session (also adjustable for your timezone and desired session window).
Features:
Customizable Time Zones: The indicator uses your preferred timezone to calculate session highs/lows.
Extendable Lines: Lines for each level extend to the right of the chart, providing continuous reference throughout the trading day.
Adjustable Settings: Fine-tune the visibility and width of the lines, and choose which levels to display (Previous Day, Previous Week, Tokyo, and London sessions).
Non-Repainting: This script uses historical data and only updates when new bars are confirmed, ensuring accurate and reliable signals.
Whether you're a day trader, swing trader, or just tracking key levels for strategic entries and exits, this tool provides quick visual reference to important price points across different trading sessions.
London & NY Session Markers + Pip MovementThis indicator visually marks the London and New York trading sessions on your chart and optionally calculates the pip range (high-low movement) during each session. It's specifically designed for Forex traders, helping you identify volatility windows and analyze market movement within major session times.
🔍 Key Features:
✅ Session Open/Close Markers
Draws vertical dotted lines at:
London Open (08:00 UK time)
London Close (11:00 UK time)
New York Open (14:00 UK time)
New York Close (17:00 UK time)
Each marker is labeled clearly ("London Open", "NY Close", etc.)
Uses color-coding for easy identification:
Aqua for London
Lime for New York
✅ Pip Range Display (Optional)
Measures the high-low price movement during each session.
Converts this movement into pips, using:
0.0001 pip size for most pairs
0.01 pip size for JPY pairs (auto-detected)
Displays a label (e.g., "London: 42.5 pips") above the candle at session close.
This feature can be toggled on/off via the settings panel.
✅ Time-Zone Aware
Session times are aligned to Europe/London time zone.
Adjusts automatically for Daylight Saving Time (DST).
✅ User Controls
Toggle visibility for:
London session markers
New York session markers
Pip range labels
📊 Use Cases:
Identify when liquidity and volatility increase, especially during session overlaps.
Analyze historical session-based volatility (e.g., compare NY vs. London pip ranges).
Combine with price action or indicator signals that work best in high-volume hours.
Optimize entry and exit timing based on session structure.
⚙️ Best Timeframes:
5-min to 1-hour charts for precise session tracking.
Works on Forex and CFD pairs with standard tick sizes.
⚠️ Notes:
This tool does not repaint and uses only completed bar data.
Pip calculation is based on the chart’s current symbol and tick size.
Designed for spot FX, not intended for cryptocurrencies or synthetic indices.
✅ Ideal For:
Forex Day Traders
Session-based Strategy Developers
London Breakout or NY Reversal Traders
Anyone analyzing volatility by session windows

London Session 15-min Range – Clean AEST Timestamp Fix (w/ EMAs)London Session 15-min Range – Clean AEST Timestamp Fix (with EMAs)
What it does:
This script is made for traders who want to track the high and low of the first 15-minute candle of the London session, using AEST (UTC+10) as the time reference. It also plots the 50 EMA and 200 EMA to help identify trend direction.
How it works:
Session Timing:
The London session is defined as starting at 6:00 PM AEST.
The session ends at 2:00 AM AEST the next day.
Detects the first 15 minutes of the London session:
During this time, it records the highest and lowest price.
Draws lines once the 15-minute window is over:
A red horizontal line is drawn at the session high.
A green horizontal line is drawn at the session low.
These lines extend 50 bars into the future.
It only draws these once per day/session.
Includes EMAs:
A 50-period EMA is calculated and plotted in yellow.
A 200-period EMA is calculated and plotted in white.
Why use it:
It helps visualise important price levels from the start of the London session and pairs that with moving averages to spot trends or potential breakouts.

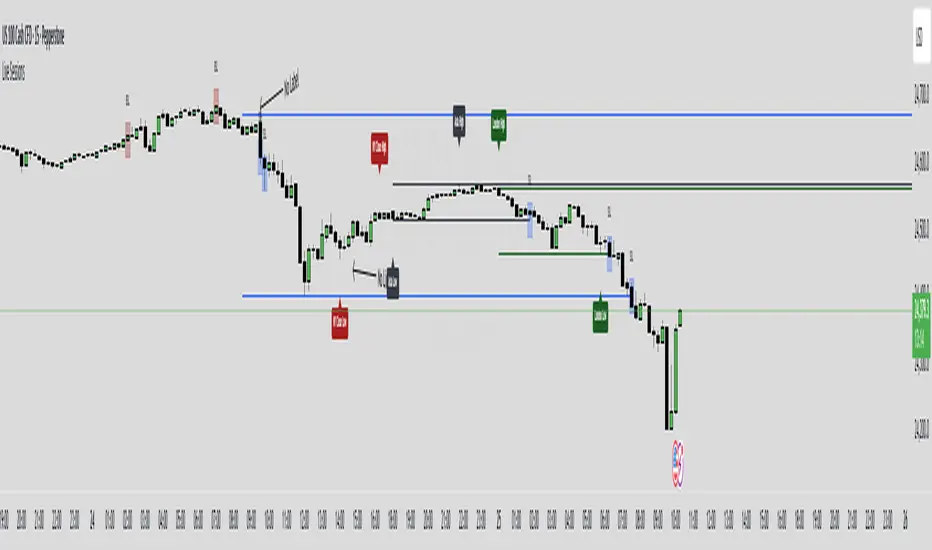
ICT Sessions (Kill Zones)Inspired by the work of ICT (Inner Circle Trader - @ICT_MHuddleston)
What are ICT KillZones:
All ICT students know that certain moments of the day are more indicated to search for good frameworks. These moments are indicated like "Kill Zones".
The best kill zones to search for profittable tradings are during the London session and during the New York session.
How This Indicator Can Help You:
With this indicator you'll see plotted in the charts the London Kill Zone and the New York Kill Zone, you'll see exactly when they start and finish, so you'll be able to understand better the price action and recognize if there are ICT framework to trade. You'll also will see when the New York lunch hour happen (this moment is not favorable for searching frameworks) and you'll see also 2 very important moments of the day, the 8.30 New York Time and the 9.30 New York Time, infact in these 2 particular moments it is most likely that some very profittable framework will appear as there are alway important economic news released in these 2 hours.
Also you'll see the New York Midnight Open, that always forms a very important level for the day trading, you could see the New York Midnight open as a real opening for markets.
Why This Indicator:
I looked for indicators working with these concepts and I could not find one that offered the kill zones sections in the way are showed in my indicator, also they just had the kill zones without showing the 8.30 and 9.30 hours and without the Ney York midnight opening, and these are very important time frames for who works with ICT concepts.
About The Indicator:
In this indicator you'll have displayed:
The regular trading sessions displayed, that is: Asian Session, London Session, New York Session.
The London Kill Zone
The New York Kill Zone
The New York Midnight Open
The New York Lunch Hour
The 8:30 News Release Hour
The 9:30 News Release Hour
All these level can be adjusted and changed as you prefer.

3 Sessions Box (ON/OFF)📖 The Story of the Three Gatekeepers (English Version)
Every trading day is a journey through three different worlds.
The chart is like a city, and price is like a crowd that never stops moving.
To bring structure into this movement, I built a script that summons three gatekeepers — each one guarding a different trading session, drawing a box that marks the boundaries of that time period.
These boxes are not just visuals.
They represent the true ranges where liquidity is built, tested, and finally released.
🌙 Session 1 — The Midnight Shadow
From 00:00 to 08:00 (MYT), the market enters its quietest state.
This is the time when price moves slowly, but it often sets the foundation for the entire day.
The first gatekeeper observes every candle, recording the highest high and lowest low, then seals it into a blue box.
This box becomes the “silent range” — a zone that later sessions may break, retest, or manipulate.
☀️ Session 2 — The Daylight Order
From 08:00 to 16:00 (MYT), the market wakes up.
Liquidity begins to flow, and structure starts to form.
The second gatekeeper draws a green box to capture this session’s true range.
He does not chase price.
He protects order — because real trends often begin here.
🔥 Session 3 — The Night Battlefield
From 16:00 to 23:59 (MYT), the market becomes a battlefield.
Volatility increases, and decisive moves are made.
The third gatekeeper draws a red box, locking in the highs and lows of the final session.
Red means war:
breakouts, fakeouts, liquidity sweeps, and explosive continuations.
This is often where winners and losers are separated.
🎛️ The Most Powerful Feature — You Control the Switch
This script is not fixed.
You can decide:
Focus only on Session 1 ✅
Turn off Session 2 completely ✅
Trade only Session 3 breakouts ✅
Because you are the commander.
The gatekeepers simply execute your rules.

Europe Session LinesThis simple script marks the start of the European trading sessions:
08:00 a.m. London trading session
09:00 a.m. Frankfurt trading session
The settings of the lines can be changed. (thickness, colour, type).
It can be used on Futures and CFDs for example for FDAX, FTSE100 but also for GOLD, Silver and EURO- and GBP based FX pairs as supply or demand zone with the change of character trading setup.

M5 Session Rectangles (GMT+2) - Last 30 Sessions Rectangles on the M5 timeframe showing the MAX and MIN of the New York Session:
OPEN SESSION (15:30 - 16:20)
MID SESSION (16:20 - 19:00)
POWER HOUR (19:00 - 22:00)
The indicator tracks the last 30 days, and the rectangle for the current day is drawn only after the respective session closes.

80% Rule Indicator (ETH Session + SVP Prior Session)I created this script to show the 80% opportunity on chart if setting lines up.
"80% rule: Open outside the vah or Val. Spend 30 mins outside there then break back inside spend 15 mins below or above depending which way u broke. Then come back and retest the vah/val and take it to the poc as a first target with the final target being the other Val/vah "
📌 Script Summary
The "80% Rule Indicator (ETH Session + SVP Prior Session)" overlays your chart with prior session value area levels (VAH, VAL, and POC) calculated from extended-hours 30-minute data. It tracks when the price reenters the value area and confirms 80% Rule setups during your chosen trading session. You can optionally trigger alerts, show/hide market sessions, and fine-tune line appearance for a clean, modular workflow.
⚙️ Options & Settings Breakdown
- Use 24-Hour Session (All Markets)
When checked, the indicator ignores time zones and tracks signals during a full 24-hour period (0000-0000), helpful if you're outside U.S. trading hours or want consistent behavior globally.
- Market Session
Dropdown to select one of three key market zones:
- New York (09:30–16:00 ET)
- London (08:00–16:30 local)
- Tokyo (09:00–15:00 local)
Used to gate entry signals during relevant hours unless you choose the 24-hour option.
- Show PD VAH/VAL/POC Lines
Toggle to show or hide prior day’s levels (based on the 30-min extended session). Turning this off removes both the lines and their white text labels.
- Extend Lines Right
When enabled, the VAH/VAL/POC lines extend into the current day’s session. If disabled, they appear only at their anchor point.
- Highlight Selected Session
Adds a soft blue background to help visualize the active session you selected.
- Enable Alert Conditions
Allows TradingView alerts to be created for long/short 80% Rule entries.
- Enable Audible Alerts
Plays an in-chart sound with a popup message (“80% Rule LONG” or “SHORT”) when signals trigger. Requires the chart to be active and sounds enabled in TradingView.

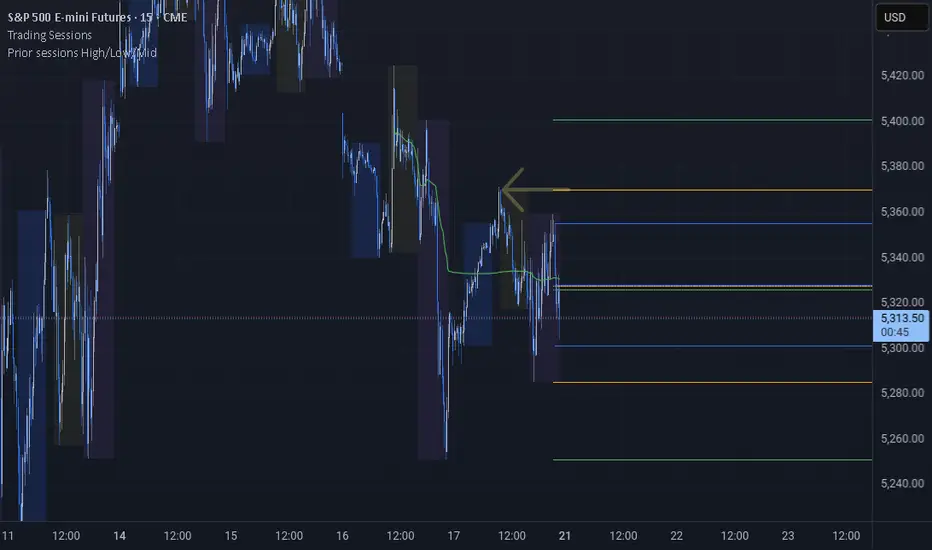
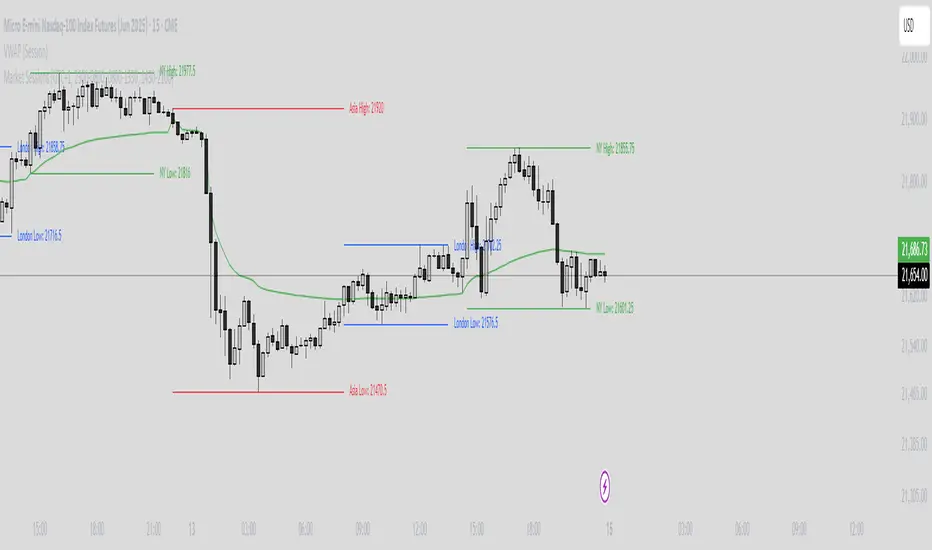
Prior sessions High/Low/MidThis indicator highlights the High, Low, and Midpoint of the most recently completed trading sessions. It helps traders visualize key price levels from the previous session that often act as support, resistance, or reaction zones.
It draws horizontal lines for the high and low of the last completed session, as well as the midpoint, which is calculated as the average of the high and low. These lines extend to the right side of the chart, remaining visible as reference levels throughout the day.
You can independently enable or disable the Tokyo, London, and New York sessions depending on your preferences. Each session has adjustable start and end times, as well as time zone settings, so you can align them accurately with your trading strategy.
This indicator is particularly useful for intraday and swing traders who use session-based levels to define market structure, bias, or areas of interest. Session highs and lows often align with institutional activity and can be key turning points in price action.
Please note that this script is designed to be used only on intraday timeframes such as 1-minute to 4-hour charts. It will not function on daily or higher timeframes.
Live SessionsLive sessions plots the highs and lows of the previous for sessions.
It also marks when these are broken by price.
Default Time Frames are:
London Session = "0000-0600", "UTC-4"
New York Session = "0830-1230", "UTC-4"
Asia Session = "1800-0000", "UTC-4"
New York Close Session = "1330-1630", "UTC-4"
Useful for highlighting when price has gone through a previous session high or low and quickly seeing where liquidity still lies.
Daily Open [Kintsugi Trading]Daily Open
The "Daily Open" indicator by Kintsugi Trading is designed to give traders clear and immediate access to daily open prices, enhancing their ability to spot key market levels and make informed trading decisions. The indicator dynamically changes the color of the plotted line based on the current price's relationship to the opening price of the regular market session. This visual aid helps traders quickly assess whether the current price is trading above or below the opening price of the session.
Key Features:
Daily Open Visualization: Automatically plots the daily open price on your chart, providing a clear reference point for daily price action.
Configurable Market Open Time: The indicator allows users to input the start time of the regular market session (default is set to 9:30 AM).
Color-Coded: The indicator dynamically adjusts the color of the daily open line and price labels based on whether the price is above or below the open, giving you quick visual cues about market sentiment.
Customization Options: Users can modify the line's appearance, including the color and style, to better fit their chart preferences.
Ideal For:
This indicator is particularly useful for day traders and those looking to closely monitor price action in relation to the market's opening level. It serves as a quick reference point for identifying potential bullish or bearish sentiment throughout the trading day.
Good luck with your trading!

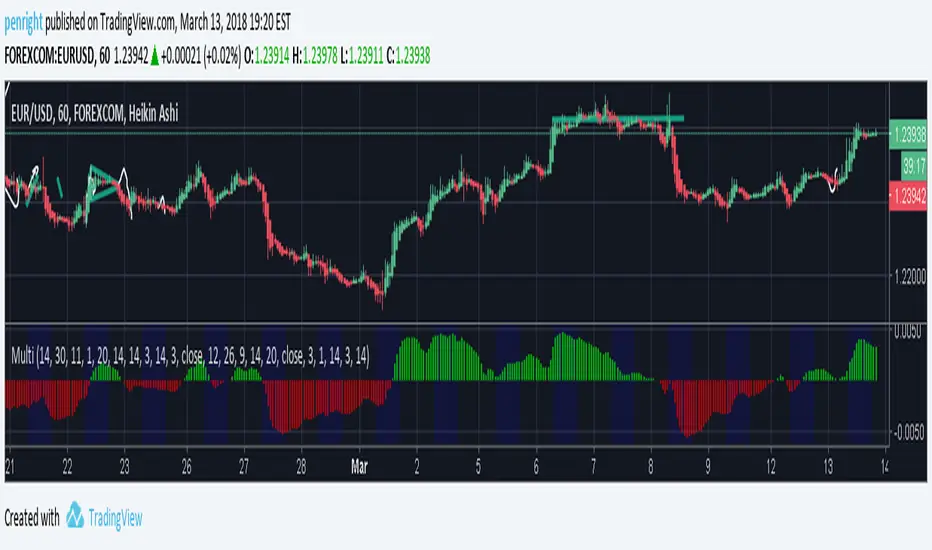
A Multi 10 indicatorREAD NOTE BEFORE APPLYING or you may think indicator doesnt work.
This indicator is a revise of another i made and contains 10 Optional Indicators allowing you to load more then 3 indicators at once if you so choose and dont pay for the platform!
Hopefully someone will find use for this script besides me :) I dont suggest turning all on at once because it
will not look right. Alot will overlap if you wish but i only use the Session and trend bar at once in
conjuction with a Oscillator setting like MacD , RSI , Stoch , Aroon or CCI .
In the chart you see i only have a few indicators active ENJOY!!
---------- NOTE ----------- ( Everything is OFF by default and indicator SHOULD show up BLANK when loaded) ------------ NOTE -------------
(Can turn EVERYTHING on AND change any values in the format tab once indicator loads)
Indicators included are listed below
Sessions, including, NY session, Aussie session, Asian session, and Europe market sessions.
MacD Split Colored , aroon oscillator
CCI Oscillator , classic aroon
RSI Oscillator , Elliot wave
Stoch RSI Oscillator , ATR%
My own Trend bar
---------- NOTE ----------- ( Everything is OFF by default and indicator SHOULD show up BLANK when loaded) ------------ NOTE -------------
(Can turn EVERYTHING on AND change any values in the format tab once indicator loads) CODE probably looks messey but this is something i made for me so i didnt really care lol
Asia Session + London ORB (NY Time)This TradingView indicator automatically identifies and marks key price levels from the **Asia trading session** and the **London Opening Range Breakout (ORB)** in **New York time (NY)**. It is designed for traders who want a clear visual reference for breakout and reversal strategies across major sessions.
**Features:**
1. **Asia Session High, Low, and Midpoint:**
* Automatically detects the high, low, and midpoint of the Asia session (default: 7:00 PM – 3:00 AM NY time).
* Draws a semi-transparent box to visualize the Asia session range.
* Extends levels forward for breakout or range-trading reference.
2. **London ORB High, Low, and Midpoint:**
* Marks the first 15-minute opening range of the London session (default: 3:00 AM – 3:15 AM NY time).
* Draws a semi-transparent box for the London ORB.
* Calculates midpoint and extends lines for easy breakout observation.
3. **Customizable Colors and Line Widths:**
* Users can set colors for session highs, lows, midpoints, and session boxes.
* Adjustable line width for better visibility on charts.
4. **Fully Automated:**
* No manual drawing required.
* Works for futures, forex, indices, or any market symbol.
**Use Case:**
* Identify breakout levels for **London session** relative to **Asia session range**.
* Spot potential reversals or continuation patterns at session highs/lows.
* Quick visual reference for high-probability intraday setups.
**Technical Notes:**
* Built in **Pine Script v6** for TradingView.
* Uses NY timezone by default but sessions can be customized.
* Compatible with intraday and higher timeframes.

Multi-Session Volume Profile [MarkitTick]💡 This comprehensive Multi-Session Volume Profile indicator offers a sophisticated, array-based approach to Auction Market Theory. By simultaneously processing Daily, Weekly, Monthly, and Custom Session profiles, it empowers traders to visualize the migration of value across multiple timeframes without the performance overhead of standard heavy profile scripts. It is designed to identify key liquidity nodes, support/resistance zones defined by volume, and the directional bias of the market through Point of Control (POC) shifts.
✨ Originality and Utility
● Multi-Dimensional Value Analysis
Unlike standard volume profiles that often restrict users to a single timeframe or require multiple instances of an indicator, this script consolidates four distinct profile calculations into a single, efficient tool. It leverages Pine Script® arrays and custom types (`VPSlot`, `VolumeProfile`) to dynamically calculate volume distribution, ensuring minimal lag while maintaining high data granularity.
● Dynamic POC Shift Tracking
A standout feature of this utility is the "Shift Analysis." The indicator does not merely plot the current Point of Control; it calculates the delta between the current session's POC and the previous session's POC. This provides immediate visual feedback on "Value Migration"—whether the market is accepting higher prices (Bullish Shift) or lower prices (Bearish Shift).
● Granular Control via Custom Types
The script utilizes a custom quantitative structure (`type VolumeProfile`) to manage raw volume, highs, lows, and volatility slots independently for each timeframe. This allows for precise "row" calculations, ensuring that the volume distribution accurately reflects price action within the specific session, rather than broad approximations.
🔬 Methodology and Concepts
● Array-Based Bucketing
The core engine relies on a "Row Size" input to divide the session's price range into horizontal buckets (slots). As new price bars form, the script distributes the bar's volume across these slots. If a bar spans multiple slots, volume is distributed proportionally; if a bar is contained within a single slot, the total volume accumulates there. This mimics a true TPO (Time Price Opportunity) calculation using volume as the weight.
● Statistical Value Area Calculation
The Value Area (VA) is determined using a standard deviation proxy. The script identifies the POC (the slot with the highest accumulated volume) and then iteratively adds the next highest volume slots above or below the POC until the total accumulated volume reaches the user-defined percentage (default 70%).
● Session Logic and Reset
The indicator employs state-logic variables (`isNewDay`, `isNewWeek`, `isNewMonth`) to detect session boundaries. Upon a boundary cross, the `reset()` method clears the arrays and initializes a new profile, while the `draw()` method finalizes the visualization of the completed session. This ensures that the lines on the chart always represent the developing or completed structure of the specific time period.
🎨 Visual Guide
The indicator renders up to four distinct profiles, each color-coded for rapid identification.
● Daily Profile (Default: Yellow)
Solid Yellow Line: Represents the Daily POC (Point of Control)—the price level with the most volume traded today.
Dashed/Dotted Yellow Lines: Represent the Value Area High (VAH) and Value Area Low (VAL).
Yellow Background Box: Highlights the 70% Value Area, showing where the bulk of the day's trading occurred.
● Weekly Profile (Default: Blue)
Solid Blue Line: The Weekly POC. Use this to gauge the medium-term trend direction.
Blue Background: Encapsulates the weekly value area. A breakout from this zone often signals a significant trend continuation.
● Monthly Profile (Default: Purple)
Solid Purple Line: The Monthly POC. This is a high-timeframe magnet level, often acting as major support or resistance.
Purple Background: Shows the macro acceptance zone for the asset.
● Custom Session Profile (Default: Cyan)
Solid Cyan Line: Tracks the POC for a specific time window (e.g., 09:30-16:00). Ideal for isolating RTH (Regular Trading Hours) from electronic sessions.
● Labels and Shift Arrows
Right-Side Labels: Display the exact price of the POC for each active profile.
Shift Indicators (▲ / ▼): Located inside the label. A "▲" indicates the current POC is higher than the previous session's POC (Value Migration Up), while "▼" indicates the opposite.
📖 How to Use
● Trend Confirmation via Value Migration
Observe the Shift Arrows in the labels. If the Daily and Weekly profiles both show "▲" (Up Shift), it confirms that value is migrating higher, suggesting a healthy uptrend. Do not short the market when value is migrating up unless price breaks below the VAL.
● Mean Reversion Trades
When price extends far away from the POC but fails to establish value (volume) at those new levels, it often reverts back to the POC. Use the POC lines as profit targets for mean reversion strategies.
● Breakout Validation
A breakout is considered valid if price closes outside the Value Area (Background Box) and volume begins to build at the new levels. If price spikes out of the VAH but quickly returns inside the box, it is a "Failed Auction," and a rotation to the VAL is probable.
● Confluence Zones
Look for price levels where the Daily POC and Weekly VAL/VAH overlap. These "clusters" of volume act as reinforced support or resistance levels.
⚙️ Inputs and Settings
● General Settings
Row Size: Determines the resolution of the profile. Higher numbers (e.g., 100) give smoother, more precise profiles but use more resources. Lower numbers (e.g., 24) are blockier but faster.
Value Area %: The percentage of total volume to include in the VA. Standard is 70.0.
Show POC Shift Analysis: Toggles the display of the ▲/▼ drift comparison.
● Profile Toggles (Daily, Weekly, Monthly, Session)
Each section has individual toggles for Show Profile , Show Value Area , and Show Background .
Start of Week Day: Allows you to define when the weekly profile resets (e.g., Sunday or Monday).
● Alert Settings
Approach Distance (Ticks): Defines how close price must get to a POC/VAH/VAL level to trigger an "Approaching" alert.
Enable Alerts: Master switch to turn on internal alert condition checks.
🔍 Deconstruction of the Underlying Scientific and Academic Framework
● Auction Market Theory (AMT)
The script is grounded in Auction Market Theory, which posits that the market's primary purpose is to facilitate trade. Price advertises opportunity, and Volume records the acceptance of that opportunity. The "Value Area" represents the fair value established by buyers and sellers, while the POC represents the price of maximum consensus.
● Gaussian Distribution Application
The calculation of the Value Area at 70% is derived from the statistical properties of a Normal (Gaussian) Distribution, where approximately 68.2% of data points typically fall within one standard deviation of the mean. In this script, the POC acts as the mode (peak frequency), and the Value Area represents that first standard deviation of transactional volume.
● Volume-Price Integration
By integrating volume into price buckets (`VPSlot`), the indicator transforms two-dimensional time/price data into three-dimensional data (Time, Price, Volume). This reveals the "texture" of the market structure, distinguishing between high-volume nodes (strong acceptance) and low-volume nodes (rejection or emotional trading).
⚠️ Disclaimer
All provided scripts and indicators are strictly for educational exploration and must not be interpreted as financial advice or a recommendation to execute trades. I expressly disclaim all liability for any financial losses or damages that may result, directly or indirectly, from the reliance on or application of these tools. Market participation carries inherent risk where past performance never guarantees future returns, leaving all investment decisions and due diligence solely at your own discretion.

RiskCraft - Advanced Risk Management SystemRiskCraft – Risk Intelligence Dashboard
Trade like you actually respect risk
"I know the setup looks good… but how much am I actually risking right now?"
RiskCraft is an open-source Pine Script v6 indicator that keeps risk transparent directly on the chart. It is not a signal generator; it is a risk desk that calculates size, frames volatility, and reminds you when your behaviour drifts away from the plan.
Core utilities
Calculates professional-style position sizing in real time.
Reads volatility and market regime before position size is confirmed.
Adjusts risk based on the trader’s emotional state and confidence inputs.
Maps session risk across Asian, London, and New York hours.
Draws exactly one stop line and one target line in the preferred direction.
Provides rotating education tips plus contextual warnings when risk escalates.
It is intentionally conservative and keeps you in the game long enough for any separate entry logic to matter.
---
Chart layout checklist
Use a clean chart on a liquid symbol (e.g., AMEX:SPY or major FX pairs).
Main RiskCraft dashboard placed on the right edge.
Session Risk box on the left with UTC time visible.
Floating risk badge above price.
Stop/target guide lines enabled.
Education panel visible in the bottom-right corner.
---
1. On-chart components
Right-side dashboard : account risk %, position size/value, stop, target, risk/reward, regime, trend strength, emotional state, behavioural score, correlation, and preferred trade direction.
Session Risk box : highlights active session (Asian, London, NY), current UTC time, and risk label (High/Med/Low) per session.
Floating risk badge : keeps actual account risk percent visible with colour-coded wording from Ultra Cautious to Very Aggressive.
Stop/target lines : exactly one dashed stop and one dashed target aligned with the preferred bias.
Education panel : rotates core principles and AI-style warnings tied to volatility, risk %, and behaviour flags.
---
2. Volatility engine – ATR with context 📈
atr = ta.atr(atrLength)
atrPercent = (atr / close) * 100
atrSMA = ta.sma(atr, atrLength)
volatilityRatio = atr / atrSMA
isHighVol = volatilityRatio > volThreshold
ATR vs ATR SMA shows how wild price is relative to recent history.
Volatility ratio above the threshold flips isHighVol , which immediately trims risk.
An ATR percentile rank over the last 100 bars indicates calm versus chaotic regimes.
Daily ATR sampling via request.security() gives higher time-frame context for intraday sessions.
When volatility spikes the script dials position size down automatically instead of cheering for maximum exposure.
---
3. Market regime radar – Danger or Drift 🌊
ema20 = ta.ema(close, 20)
ema50 = ta.ema(close, 50)
ema200 = ta.ema(close, 200)
trendScore = (close > ema20 ? 1 : -1) +
(ema20 > ema50 ? 1 : -1) +
(ema50 > ema200 ? 1 : -1)
= ta.dmi(14, 14)
Regimes covered:
Danger : high volatility with weak trend.
Volatile : volatility elevated but structure still directional.
Choppy : low ADX and noisy action.
Trending : directional flows without extreme volatility.
Mixed : anything between.
Each regime maps to a 1–10 risk score and a multiplier that feeds the final position size. Danger and Choppy clamp size; Trending restores normal risk.
---
4. Behaviour engine – trader inputs matter 🧠
You provide:
Emotional state : Confident, Neutral, FOMO, Revenge, Fearful.
Confidence : slider from 1 to 10.
Toggle for behavioural adjustment on/off.
Behind the scenes:
Each state triggers an emotional multiplier .
Confidence produces a confidence multiplier .
Combined they form behavioralFactor and a 0–100 Behavioural Score .
High-risk emotions or low conviction clamp the final risk. Calm inputs allow normal size. The dashboard prints both fields to keep accountability on-screen.
---
5. Correlation guardrail – avoid stacking identical risk 📊
Optional correlation mode compares the active symbol to a reference (default AMEX:SPY ):
corrClose = request.security(correlationSymbol, timeframe.period, close)
priceReturn = ta.change(close) / close
corrReturn = ta.change(corrClose) / corrClose
correlation = calcCorrelation()
Absolute correlation above the threshold applies a correlation multiplier (< 1) to reduce size.
Dashboard row shows the live correlation and reference ticker.
When disabled, the row simply echoes the current symbol, keeping the table readable.
---
6. Position sizing engine – heart of the script 💰
baseRiskAmount = accountSize * (baseRiskPercent / 100)
adjustedRisk = baseRiskAmount * behavioralFactor *
regimeAdjustment * volAdjustment *
correlationAdjustment
finalRiskAmount = math.min(adjustedRisk,
accountSize * (maxRiskCap / 100))
stopDistance = atr * atrStopMultiplier
takeProfit = atr * atrTargetMultiplier
positionSize = stopDistance > 0 ? finalRiskAmount / stopDistance : 0
positionValue = positionSize * close
Outputs shown on the dashboard:
Position size in units and value in currency.
Actual risk % back on account after adjustments.
Risk/Reward derived from ATR-based stop and target.
---
7. Intelligent trade direction – bias without signals 🎯
Direction score ingredients:
EMA stack alignment.
Price versus EMA20.
RSI momentum relative to 50.
MACD line vs signal.
Directional Movement (DI+/DI–).
The resulting Trade Direction row prints LONG, SHORT, or NEUTRAL. No orders are generated—this is guidance so you only risk capital when the structure supports it.
---
8. Stop/target guide lines – two lines only ✂️
if showStopLines
if preferLong
// long stop below, target above
else if preferShort
// short stop above, target below
Lines refresh each bar to keep clutter low.
When the direction score is neutral, no lines appear.
Use them as visual anchors, not auto-orders.
---
9. Session Risk map – global volatility clock 🌍
Tracks Asian, London, and New York windows via UTC.
Computes average ATR per session versus global ATR SMA.
Labels each session High/Med/Low and colours the cells accordingly.
Top row shows the active session plus current UTC time so you always know the regime you are trading.
One glance tells you whether you are trading quiet drift or the part of the day that hunts stops.
---
10. Floating risk badge – honesty above price 🪪
Text ranges from Ultra Cautious through Very Aggressive.
Colour matches the risk palette inputs (High/Med/Low).
Updates on the last bar only, keeping historical clutter off the chart.
Account risk becomes impossible to ignore while you stare at price.
---
11. Education engine & warnings 📚
Rotates evergreen principles (risk 1–2%, journal trades, respect plan).
Triggers contextual warnings when volatility and risk % conflict.
Flags when emotional state = FOMO or Revenge.
Highlights sub-standard risk/reward setups.
When multiple danger flags stack, an AI-style warning overrides the tip text so you can course-correct before capital is exposed.
---
12. Alerts – hard guard rails 🚨
Excessive Risk Alert : actual risk % crosses custom threshold.
High Volatility Alert : ATR behaviour signals danger regime.
Emotional State Warning : FOMO or Revenge selected.
Poor Risk/Reward Alert : risk/reward drops below your standard.
All alerts reinforce discipline; none suggest entries or exits.
---
13. Multi-market behaviour 🕒
Intraday (1m–1h): session box and badge react quickly; ideal for scalpers needing constant risk context.
Higher time frames (1D–1W): dashboard shifts slowly, supporting swing planning.
Asset classes confirmed in validation: crypto majors, large-cap equities, indices, major FX pairs, and liquid commodities.
Risk logic is price-based, so it adapts across markets without bespoke tuning.
15. Key inputs & recommended defaults
Account Size : 10,000 (modify to match actual account; min 100).
Base Risk % : 1.0 with a Maximum Risk Cap of 2.5%.
ATR Period : 14, Stop Multiplier 2.0, Target Multiplier 3.0.
High Vol Threshold : 1.5 for ATR ratio.
Behavioural Adjustment : enabled by default; disable for fixed risk.
Correlation Check : optional; default symbol AMEX:SPY , threshold 0.7.
Display toggles : main dashboard, risk badge, session map, education panel, and stop lines can be individually disabled to reduce clutter.
16. Usage notes & limits
Indicator mode only; no automated entries or exits.
Trade history panel intentionally disabled (requires strategy context).
Correlation analysis depends on additional data requests and may lag slightly on illiquid symbols.
Session timing uses UTC; adjust expectations if you trade localized instruments.
HTF ATR sampling uses daily data, so bar replay on lower charts may show brief data gaps while HTF loads.
What does everyone think RISK really means?

ICT Silver Bullet Zones (All Sessions, Custom Labels)CT Silver Bullet Zones
This indicator is designed for traders who follow the ICT *Silver Bullet* concept.
It automatically marks the **Silver Bullet window** (10:00–11:00 by default) across the **London, New York AM, New York PM, and Asia sessions**, with customizable settings for each session.
### Features:
* Separate adjustable time windows for **London, NY AM, NY PM, and Asia Silver Bullet sessions**.
* Colored session boxes with individual **opacity controls**.
* **Session labels placed at the top** of each zone, with customizable text size, color, and background opacity.
* Works on all timeframes and highlights only the Silver Bullet trading windows.
This tool is meant to help traders quickly identify ICT Silver Bullet opportunities in all major sessions without manual plotting.

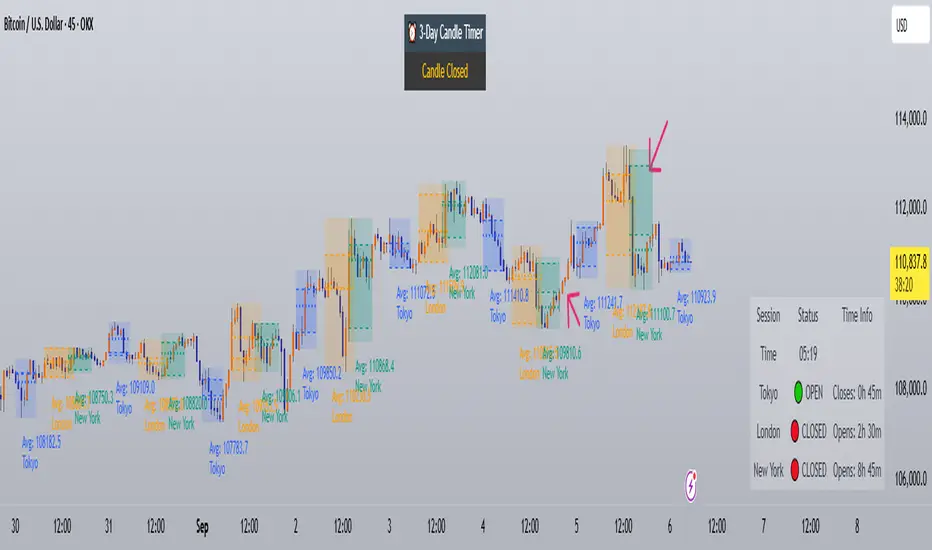
Trading Sessions with Holidays & Timer🌍 Trading Sessions Matter
Markets breathe in cycles. When Tokyo, London, or New York steps in, liquidity shifts and price often reacts fast.
Example: New York closed BTC at $110K, and when traders woke up, the price was already $113K. That gap says everything about overnight pressure and the next move.
⚡ Indicator Features
✅ Session boxes (Tokyo, London, NY) with custom colors & time zones
✅ Open/close lines → spot gaps & momentum
✅ Average price per session → see where pressure builds
✅ Tick range → quick volatility check
✅ 🏖 Holiday markers → avoid false quiet markets
✅ Live status table → session OPEN / CLOSED + countdown timer
🚀 How to Use
Works on intraday timeframes (1m–4h)
Watch session opens/closes → liquidity shift points
Compare ranges & averages between Tokyo, London, NY
Use the timer to prep before the next wave
This tool helps you visualize the heartbeat of global markets session by session.
🔖 #BTCUSDT #Forex #TradingSessions #Crypto #DayTrading
Time Range Marker By BCB ElevateThe Time Range Marker is a simple yet powerful visual tool for traders who want to focus on specific time intervals within the trading day. This indicator highlights a custom time range on your chart using a background color, helping you visually isolate key trading sessions or event windows such as:
Market open/close hours
News release periods
High-volatility trading zones
Personal strategy testing windows
⚙️ Key Features:
Customizable start and end time (hour & minute)
Works across all intraday timeframes
Adjustable highlight color to match your chart theme
Built using Pine Script v5 for speed and flexibility
🔧 Settings:
Start Hour / Minute – Set the beginning of the time range (in 24-hour format)
End Hour / Minute – Define when the range ends
Highlight Color – Choose the background color for better visibility
🕒 Timezone Note:
The indicator uses UTC time by default to ensure accuracy across markets. If your broker uses a different timezone (like EST, IST, etc.), the script can be adjusted to reflect your local market hours.
✅ How to Use the Time Range Marker Indicator
This indicator is used to visually highlight a specific time window each trading day, such as:
Market open or close sessions (e.g., NYSE, London, Tokyo)
High-impact news release periods
Custom time slots for strategy testing or scalping
🛠️ Installation Steps
Open TradingView and go to any chart.
Click on Pine Editor at the bottom of the screen.
Copy and paste the full Pine Script (shared above) into the editor.
Click the “Add to Chart” ▶️ button.
The indicator will appear on the chart with a highlighted background during the time range you set.
⚙️ How to Customize the Time Range
After adding the indicator:
Click the gear icon ⚙️ next to the indicator’s name on the chart.
Adjust the following settings:
Start Hour / Start Minute: The beginning of your time range (in 24-hour format).
End Hour / End Minute: When the highlight should stop.
Highlight Color: Pick a color and transparency for visual clarity.
Click OK to apply changes.
🕒 Timezone Consideration
By default, the indicator uses UTC (Coordinated Universal Time).
To match your broker’s timezone (e.g., EST, IST, etc.), you'll need to adjust the script by changing:
sessStart = timestamp("Etc/UTC", ...)
sessEnd = timestamp("Etc/UTC", ...)
to your correct timezone, like "Asia/Kolkata" for IST or "America/New_York" for EST.
Let me know your broker or local timezone, and I’ll update it for you.
📈 Tips for Traders
Combine this with volume, price action, or breakout indicators to focus your strategy on high-probability time windows.
Use multiple versions of this script if you want to highlight more than one time range in a day.

Market Sessions Indicator by NomadTradesCustomisable Market session indicator
This indicator visually marks the high and low price levels for the Asia, London, and New York trading sessions directly on the chart, using distinct horizontal lines and color-coding for each session. Each session’s high and low are labelled for easy identification, allowing traders to quickly assess key support and resistance levels established during major global market hours. The indicator is designed for clear session demarcation, helping users identify price reactions at these significant levels and supporting multi-session analysis for intraday and swing trading strategies
RH_Previous Session CloseRaghee Horner Previous Session Close (PSC)
The RH_PSC is an automated Previous Session Close (PSC) indicator to show, at a glance, general market sentiment -- whether the market is generally bullish, bearish or neutral --for the current trading session.
The PSC plots the previous session close from the Daily candle, with a customizable table of data to show the previous price, whether or not the current price is above or below that previous close and the percentage move above or below.
It includes the ability to enable only the last session or to plot for all previous sessions continuously.
The data table is configurable for bearish, bullish or sideways coloring and can be moved to different locations to suite users preferences and charts. It can also be fully disabled.
Defaults are to show all previous sessions in a continuous plot and the data table is disabled.
What is “sentiment”?
Market sentiment reflects investors’ overall attitude toward a symbol, influenced by news, economic reports, and perceptions. It can be bullish, bearish, or neutral and significantly affects trading behavior and price movements. Bullish sentiment typically drives prices up, while bearish sentiment can cause them to fall. Understanding market sentiment is key for trend follow-through.
Why does it matter?
Effectively using sentiment allows for quicker, smarter trading decisions. As an active trader, understanding market sentiment is vital for follow-through. It shows real-time investor feelings, affecting price movements. Gauging sentiment helps you:
Anticipate Breakouts.
Time Entries and Exits.
Increase Probability of Continuation.

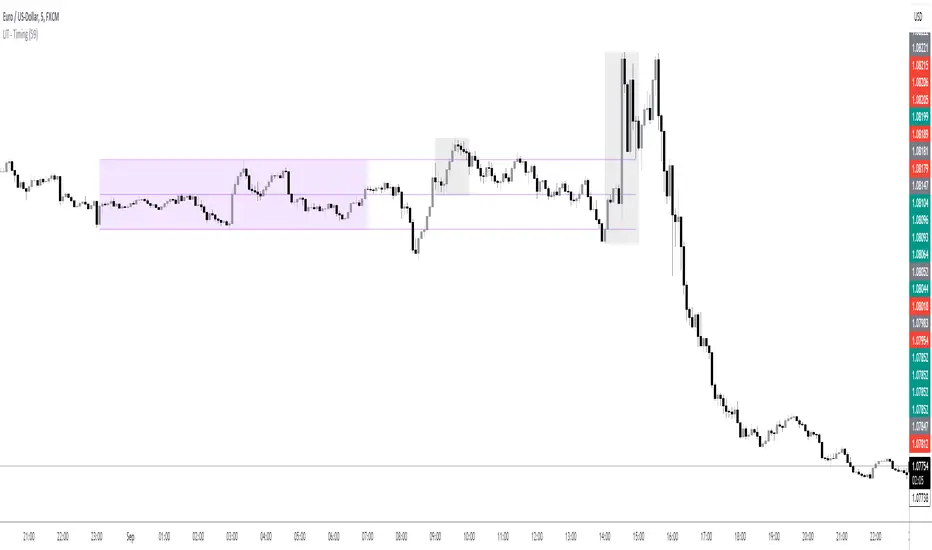
LIT - TimingIntroduction
This Script displays the Asia Session Range, the London Open Inducement Window, the NY Open Inducement Window, the Previous Week's high and low, the Previous Day's highs and lows, and the Day Open price in the cleanest way possible.
Description
The Indicator is based on UTC -7 timing but displays the Session Boxes automatically correct at your chart so you do not have to adjust any timings based on your Time Zone and don't have to do any calculations based on your UTC. It is already perfect.
You will see on default settings the purple Asia Box and 2 grey boxes, the first one is for the London Open Inducement Window (1 hour) and the second grey box is for the NY Open Inducement Window (also 1 hour)
Asia Range comes with default settings with the Asia Range high, low, and midline, you can remove these 3 lines in the settings "style" and untick the "Lines" box, that way you only will have the boxes displayed.
Special Feature
Most Timing-based Indicators have "bugged" boxes or don't show clean boxes at all and don't adjust at daylight savings times, we made sure that everything automatically gets adjusted so you don't have to! So the timings will always display at the correct time regarding the daylight savings times.
Combining Timing with Liquidity Zones the right way and in a clear, clean, and simple format.
Different than others this script also shows the "true" Asia range as it respects the "day open gap" which affects the Asia range in other scripts and it also covers the full 8 hours of Asia Session.
Additions
You can add in the settings menu the last week's high and low, the previous day's high and low, and also the day's open price by ticking the boxes in the settings menu
All colors of the boxes are fully adjustable and customizable for your personal preferences. Same for the previous weeks and day highs and lows. Just go to "Style" and you can adjust the Line types or colors to your preferred choice.
Recommended Use
The most beautiful display is on the M5 Timeframe as you have a clear overview of all sessions without losing the intraday view. You can also use it on the M1 for more details or the M15 for the bigger picture. The Template can hide on higher time frames starting from the H1 to not flood your chart with boxes.
How to use the Asia Session Range Box
Use the Asia Range Box as your intraday Guide, keep in mind that a Breakout of Asia high or low induces Liquidity and a common price behavior is a reversal after the fake breakout of that range.
How to use the London Open and NY Open Inducement Windows
Both grey boxes highlight the Open of either London Open or NY Open and you should keep an eye out for potential Liquditiy Graps or Mitigations during that times as this is when they introduce major Liquidity for the regarding Session.
How to use the Asia high, low and midline and day open price
After Asia Range got taken out in one direction, often price comes back to those levels to mitigate or bounce off, so you can imagine those zones as support and resistance on some occasions, recommended in combination with Imbalances.
How to use the previous day and week's highs and lows
Once added in the settings, you can display those price levels, you can use them either as Liquidity Targets or as Inducement Levels once they are taken out.
Enjoy!
FX SessionsForex Sessions Indicator
FX Sessions Indicator
This indicator is designed for high-precision Forex trading, focusing on the core liquidity windows of the global currency markets.
-Core Purpose: Tracks and visualizes the three major global trading sessions—Asia, London, and New York.
-Visual Style: Uses a clean, non-intrusive dotted-line box to define the high and low range of each session.
-Key Metric: Automatically calculates and displays the total Pip Range for each session, allowing for a quick assessment of volatility.
C-ustomization: Features a streamlined settings menu where you can toggle sessions on/off, adjust names, and modify time zones (defaulting to GMT-5).
-Lookback Logic: Optimized to maintain chart clarity by cleaning up historical data based on a user-defined lookback period.
