MM Future Session TimesThis script projects the Open/Close of the Asia, UK and US sessions highlighting the Gaps & Deadzone within the market Maker Model.
Dead Zone 5 - 8pm
Asia Gap - 8:00 - 8.30pm | Asia Open 08.30pm | Asia Close 3am
London Gap 3:00 - 3:30am | London Open 3.30am | London Close 9am
US Gap 09:00 - 9.30am | NY Open 9.30am | NY Close 5pm
Note this does not differentiate between the weekend and week day
Cerca negli script per "session"

Asian Session Bollinger BandsThis is a fairly simple adjustment of the Bollinger Bands highlighting and giving the character to the Asian session.

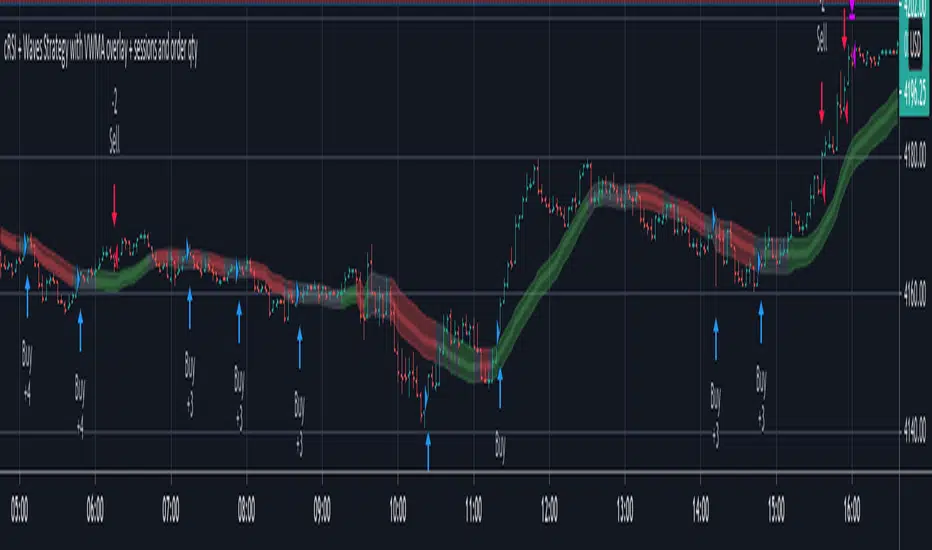
cRSI + Waves Strategy with VWMA overlay + sessions and order qtyThis is a fork of the cRSI + Waves Strategy with VWMA overlay strategy by Dr_Roboto , which adds two additional features, namely:
the ability to limit trade signals to certain defined periods of time ("Sessions") during the trading day and, optionally, to close any open position at the end of either or both "Sessions"
the ability to control the maximum order size suggested by the strategy on the "Inputs" tab of the strategy's "Settings" window
If you are trading on a daily chart (or longer) you must disable the Limit Signals to Trading Sessions? option in order for the strategy to produce signals.
All other features are identical to the original strategy (revision 2.0).
Reivaj MA - PreSession This script contains 9 moving averages which can be changed each between "sma", "ema", "wma", "vwma.
The values of the moving averages are:
MMA20 = SMA20
MMA50 = SMA50
MMA100 = SMA100
MMA200 = SMA200
MMA300 = SMA300.
MMAextra1 = ema 8
MMAextra2 = ema21
MMAextra3 = sma400
MMAextra4 = sma500.
It has an Asian range that goes from 21: 00-07: 00 UTC which turns the color of the candle in green.
And pre-sessions that is one hour before the opening, the time of the opening and the hour after the opening of London and New York.

Trading Sessions GMT+8 By ShoThis indicator show the trading session for GMT+8. Might be slight vary with some broker

Price Action and 3 EMAs Momentum plus Sessions FilterThis indicator plots on the chart the parameters and signals of the Price Action and 3 EMAs Momentum plus Sessions Filter Algorithmic Strategy. The strategy trades based on time-series (absolute) and relative momentum of price close, highs, lows and 3 EMAs.
I am still learning PS and therefore I have only been able to write the indicator up to the Signal generation. I plan to expand the indicator to Entry Signals as well as the full Strategy.
The strategy works best on EURUSD in the 15 minutes TF during London and New York sessions with 1 to 1 TP and SL of 30 pips with lots resulting in 3% risk of the account per trade. I have already written the full strategy in another language and platform and back tested it for ten years and it was profitable for 7 of the 10 years with average profit of 15% p.a which can be easily increased by increasing risk per trade. I have been trading it live in that platform for over two years and it is profitable.
Contributions from experienced PS coders in completing the Indicator as well as writing the Strategy and back testing it on Trading View will be appreciated.
STRATEGY AND INDICATOR PARAMETERS
Three periods of 12, 48 and 96 in the 15 min TF which are equivalent to 3, 12 and 24 hours i.e (15 min * period / 60 min) are the foundational inputs for all the parameters of the PA & 3 EMAs Momentum + SF Algo Strategy and its Indicator.
3 EMAs momentum parameters and conditions
• FastEMA = ema of 12 periods
• MedEMA = ema of 48 periods
• SlowEMA = ema of 96 periods
• All the EMAs analyse price close for up to 96 (15 min periods) equivalent to 24 hours
• There’s Upward EMA momentum if price close > FastEMA and FastEMA > MedEMA and MedEMA > SlowEMA
• There’s Downward EMA momentum if price close < FastEMA and FastEMA < MedEMA and MedEMA < SlowEMA
PA momentum parameters and conditions
• HH = Highest High of 48 periods from 1st closed bar before current bar
• LL = Lowest Low of 48 periods from 1st closed bar from current bar
• Previous HH = Highest High of 84 periods from 12th closed bar before current bar
• Previous LL = Lowest Low of 84 periods from 12th closed bar before current bar
• All the HH & LL and prevHH & prevLL are within the 96 periods from the 1st closed bar before current bar and therefore indicative of momentum during the past 24 hours
• There’s Upward PA momentum if price close > HH and HH > prevHH and LL > prevLL
• There’s Downward PA momentum if price close < LL and LL < prevLL and HH < prevHH
Signal conditions and Status (BuySignal, SellSignal or Neutral)
• The strategy generates Buy or Sell Signals if both 3 EMAs and PA momentum conditions are met for each direction and these occur during the London and New York sessions
• BuySignal if price close > FastEMA and FastEMA > MedEMA and MedEMA > SlowEMA and price close > HH and HH > prevHH and LL > prevLL and timeinrange (LDN&NY) else Neutral
• SellSignal if price close < FastEMA and FastEMA < MedEMA and MedEMA < SlowEMA and price close < LL and LL < prevLL and HH < prevHH and timeinrange (LDN&NY) else Neutral
Entry conditions and Status (EnterBuy, EnterSell or Neutral)(NOT CODED YET)
• ENTRY IS NOT AT THE SIGNAL BAR but at the current bar tick price retracement to FastEMA after the signal
• EnterBuy if current bar tick price <= FastEMA and current bar tick price > prevHH at the time of the Buy Signal
• EnterSell if current bar tick price >= FastEMA and current bar tick price > prevLL at the time of the Sell Signal

Neom Traders Market SessionThis Indicator show the 3 main sections of Forex Market. You can choose between London, New York and Asia Session. It will appear at the background of the main chart.


Day Session with TZThis will paint a grey bar each day at 0 o'clock. So the area between two grey bars is a day session. This script also has timezone support. This is especially useful if you trade crypto.

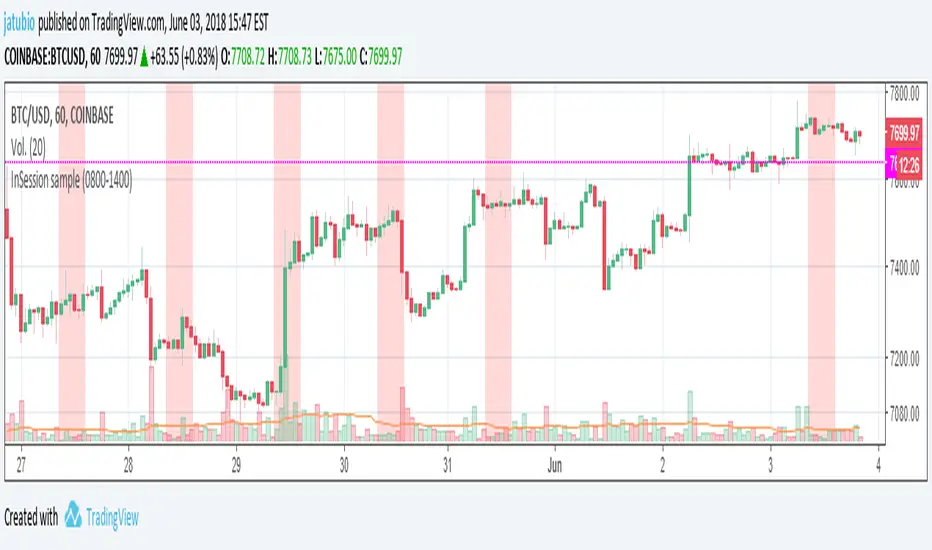
InSession sampleThis indicators it's a programming sample of how to check if hours are inside one session range excluding/including weekends days
EMA + Sessions + RSI This is a simple on-demand indicator. It includes 3 customizable exponential moving averages, three customizable market sessions, and a table showing the status of the RSI
-3 Custom EMAs
-3 Custom Sessions
-1 RSI Table

ATR + EMA + Sessions ProATR + EMA + Sessions Pro By Saeed Fadi to save indicator space, it,s for atr, emas, sessions etc.

Dynamic Sessions - Asia, London, New YorkThis indicator lets you set trading sessions (custom sessions) and print them out as dynamic polyboxes instead of traditional rectangles which lets you identify strong moves and trends easier.

Market Sessions & Daily Range ProThis tool is designed for market visualization. It displays the real trading sessions (Asia, Europe, and America) together with the daily range (00:00–24:00). Boxes and labels show daily highs, lows, open/close levels, and current extremes. The purpose is to provide traders with a clear visual map of how price behaves across sessions and within the daily structure.

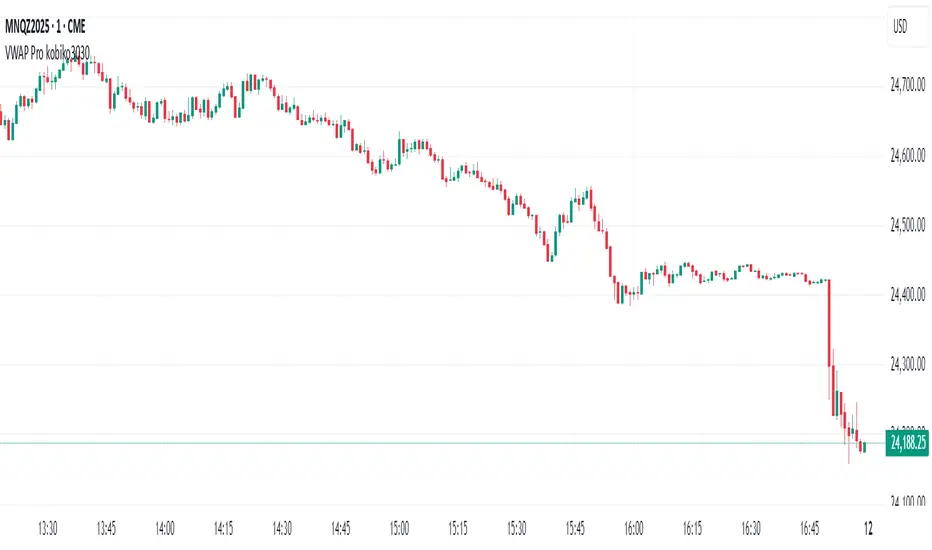
VWAP Bands Pro - Session Based by kobiko3030
📊 Advanced Professional Trading Indicator
VWAP Bands Pro is an advanced indicator that combines the power of VWAP with 4 dynamic bands for precise identification of support and resistance zones. This indicator is designed for professional traders who want deep and accurate market movement analysis.
✨ Key Features
🎯 Smart VWAP Bands
4 adjustable bands based on standard deviation
Optional band 4 hiding for beginner traders
Precise calculation based on volume-weighted price
🌏 Global Session Support
New York Session (9:30 EST)
Asia Session (18:00 EST)
Automatic reset at the beginning of each session
📱 Flexible User Interface
Dynamic labels (V, VR1-4, VS1-4)
Custom color selection
Adjustable line thickness for each band
Multiple display modes
🔔 Advanced Alert System
VWAP breakout alerts
Alerts for all bands (3 & 4)
Clear and precise messages
🛠️ Customization Options
Band Settings
Standard deviation multipliers: 1.0, 2.0, 3.0, 4.0 (default)
Each band independently adjustable
Range: 0.1 to 5.0
Display Settings
Continuous trading start - display from session beginning
Limited candle count - show last X candles
Current day only - no historical data
Visual Design
VWAP, support, and resistance colors
Individual line thickness
Hideable labels
📈 Trading Strategies
Support and Resistance Zones
VS1-VS4: Support bands (green)
VR1-VR4: Resistance bands (red)
V: Central VWAP line
Entry Points
Breakouts above/below VWAP
Bounces from outer bands
Band retests
Risk Management
Use bands as Stop Loss levels
Identify oversold/overbought zones
Adapt to different market conditions
🎖️ Indicator Advantages
✅ Precise calculation based on volume weighting
✅ Complete flexibility in customization
✅ Global session support
✅ User-friendly interface
✅ Built-in alert system
✅ Suitable for all trading styles
📋 Usage Instructions
Add the indicator to your chart
Select trading session (New York/Asia)
Adjust bands according to your trading style
Set up alerts for important breakouts
Start trading with precise key zone identification
💡 Trading Tips
Use outer bands to identify extremes
Combine with additional indicators for confirmation
Adjust bands to asset volatility
Follow alerts to spot opportunities
Consider session-specific behavior patterns
🔧 Technical Specifications
Pine Script Version: 5
Overlay: Yes
Timeframe: All timeframes supported
Markets: Suitable for all markets (Forex, Stocks, Crypto, Futures)
Session Support: New York & Asia with EST timezone
Volume Calculation: HLC3 * Volume weighted
📊 What Makes This Different
Unlike standard VWAP indicators, this pro version offers:
Session-based reset for intraday precision
4 customizable bands instead of basic 2
Professional labeling system for quick identification
Advanced alert conditions for all key levels
Flexible display options for different trading approaches
⚡ Performance Features
Efficient calculation - minimal lag
Clean visual design - no chart clutter
Responsive labels - update in real-time
Session breaks - clear visual separation
Volume validation - ensures accurate VWAP calculation
Custom Session Tracker (KN)**Custom Session Tracker (KN)**
Visually highlight any intraday session’s high, low, and midpoint on your chart with full styling control.
**Description**
Custom Session Tracker (KN) lets you define any trading session (e.g. 09:30–16:00 NY time) and automatically draws:
* A translucent box spanning the session’s High and Low
* A horizontal line marking the session midpoint
All elements update in real time and persist after session close.
**Features**
* **Session Range Box**: Plots from session open through close
* **Mid-Price Line**: Marks the exact midpoint of High/Low
* **Timezone Input**: Aligns session to any GMT offset
* **Custom Colors**: Fill, border, and mid-line colors
* **Line & Border Styles**: Choose solid or dashed
**Inputs**
* **Timezone** – GMT offset for your market
* **Session** – Hours in `HHMM-HHMM` format
* **Fill Color** – Box interior transparency
* **Border Color** – Box outline
* **Box Border Style** – Solid or dashed
* **Midline Color** – Mid-price line color
* **Mid Price Line Style** – Solid or dashed
**How to Use**
1. Add the script to your chart.
2. Set your session hours and timezone.
3. Customize colors and styles.
4. Watch each session’s high, low, and midpoint appear automatically.
Perfect for session-overlap strategies, mean-reversion signals, or simply keeping key levels in view.

Time Zone / Market SessionsTime Zone / Market Sessions indicator is a handy tool to display current major Market Open / Close condition along with present time at that Exchange. Sydney, Tokyo, London, New York market sessions are included. Clear display of Overlap Zones and Kill Zones.. Can be used to estimate market Pumping and Dumping. Alerts can be set when a market opens.
Time is Displayed in Table Layout
Active Market is displayed as Dots on top and bottom
You can select as Timeline or Table display
Overlap is clearly displayed on top and bottom without any mess
Gray color in Table layout Shows Closed Markets
You are free to reuse this code No Limitations.
Kill Zones are indicated in Table format. When some of the markets are closed
Alerts included for market openings
London & New York Sessions ESTThis is a sessions displayer that displays only Lond and New York for EST. It is customizable for other sessions as well
MTF Session Range FibonacciMTF Session Range Fibonacci is a multi-timeframe indicator designed to map high-probability price reaction levels using a fixed intraday session range and Fibonacci projections.
The indicator first identifies a user-defined session window and records the session high and low. Once the session completes, it builds a complete Fibonacci structure from that range, including retracements and extensions above and below the session boundaries. These levels act as support, resistance, targets, and extreme reaction zones, commonly used for intraday and swing trading.
All calculations can be sourced from a higher or custom timeframe, allowing traders to project higher-timeframe structure onto lower-timeframe charts. This helps align entries with broader market context rather than relying on isolated chart data.
To provide trend confirmation, the indicator includes:
A Parabolic Weighted Moving Average (PWMA) to highlight directional bias and momentum strength.
A 50 / 200 EMA crossover system to identify potential trend shifts and dominant market direction.
Visual elements such as color-coded Fibonacci levels, informative tooltips, crossover markers, and optional fills between price and PWMA improve readability while keeping the chart structured.
This indicator is best suited for traders who rely on session-based structure, Fibonacci reactions, and multi-timeframe trend alignment, particularly in indices, forex, and futures markets.

Value Area PRO (TPO/Volume Session VAH/VAL/POC) 📌 AP Capital Value Area PRO (TPO / Volume)
AP Capital Value Area PRO is a session-based value area indicator designed for Gold (XAUUSD), NASDAQ (NAS100), and other CFD instruments.
It focuses on where the market has accepted price during the current session and highlights high-probability interaction zones used by professional traders.
Unlike rolling lookback volume profiles, this indicator builds a true session value area and provides actionable signals around VAH, VAL, and POC.
🔹 Core Features
Session-Anchored Value Area
Value Area is built only during the selected session
Resets cleanly at session start
Levels develop during the session and can be extended forward
No repainting or shifting due to lookback changes
TPO or Volume Mode
TPO (Time-at-Price) mode – ideal for CFDs and tick-volume data
Volume mode – uses broker volume if preferred
Same logic, different weighting method
Fixed Price Bin Size
Uses a fixed bin size (e.g. 0.10 for Gold, 0.25–0.50 for NAS100)
Produces cleaner, more realistic VAH/VAL levels
Avoids distorted profiles caused by dynamic bin scaling
VAH / VAL / POC Levels
VAH (Value Area High)
VAL (Value Area Low)
POC (Point of Control) (optional)
Lines can be extended to act as forward reference levels
🔹 Trading Signals & Alerts
Value Re-Entry
Identifies false breakouts where price:
Trades outside value
Then closes back inside
Often seen before strong mean-reversion or continuation moves.
Acceptance
Detects initiative activity using:
Multiple consecutive closes outside value
Filters out weak single-candle breaks
Rejection
Flags strong rejection candles:
Large candle body
Wick outside value
Close back inside the value area
These conditions are especially effective on Gold intraday.
🔹 Optional Profile Histogram
Right-side volume/TPO histogram
Buy/sell imbalance visualization
Fully optional to reduce chart clutter and improve performance
🔹 Best Use Cases
Recommended markets
XAUUSD (Gold)
NAS100 / US100
Other index or metal CFDs
Recommended timeframes
5m, 15m, 30m
Suggested settings
Mode: TPO
Value Area: 70%
Bin size:
Gold: 0.10
NAS100: 0.25 or 0.50
🔹 How Traders Use It
Trade rejections at VAH / VAL
Look for acceptance to confirm trend days
Use re-entries to fade failed breakouts
Combine with trend filters, EMA structure, or session context
⚠️ Disclaimer
This indicator is provided for educational and analytical purposes only and does not constitute financial advice. Always manage risk appropriately.

SA Range Rank NQ 1.13.2026 PM SESSION15 MINUTE — PREPARE / POSITION MODE
Developer Note: Bias & Position Framing
This daily view is preparatory, not executable.
The purpose of the Daily timeframe is to define directional bias, not entries.
It helps frame which side of the market deserves attention and which activity should be ignored.
The goal here is context, not action.
________________________________________
Purpose on Daily
The Daily timeframe is used to:
• Define directional bias for the week
• Prepare position-building zones
• Identify environments where participation is unnecessary or elevated-risk
• Reduce overtrading by narrowing focus
Daily charts answer one question only:
“If I participate this week, which side makes sense?”
________________________________________
What Matters Most (Public View)
SA Range Indicator (RI):
→ Is the market transitioning or trending?
→ Is energy building, releasing, or rotating?
SA ZoneEngine (visual context only):
→ Are daily moves aligned with higher-timeframe structure?
→ Is price operating with or against dominant bias?
These visuals explain environment, not decisions.
________________________________________
How to Interpret Public Daily Posts
• Daily is not timing
• Daily is not execution
• Daily is not a signal
Daily charts prepare the trader mentally and structurally by clarifying:
• what deserves patience
• what deserves caution
• what deserves no attention at all
________________________________________
Messaging Line
“Daily charts prepare the trade — they don’t execute it.”
________________________________________
SEO Intent
daily equity bias, position preparation, market structure analysis
________________________________________
🤝 For Those Who Find Value
If these daily posts help you see the market more clearly:
• Follow, boost, and share my scripts, Ideas, and MINDS posts
• Feel free to message me directly with questions or build requests
• Constructive feedback and collaboration are always welcome
For traders who want to go deeper, optional memberships may include:
• Additional signal access
• Early previews
• Occasional free tools and upgrades
🔗 Membership & Signals
trianchor.gumroad.com
________________________________________
________________________________________
⏱ 15-MIN — PREPARE / POSITION MODE
Developer Note: Setup Formation Phase
The 15-minute timeframe is where setups begin to form, not where they are acted on.
This view exists to separate developing structure from noise.
________________________________________
Purpose on 15-Minute
The 15-minute timeframe is used to:
• Spot trap-prone conditions
• Identify developing structure
• Observe compression, rotation, or early expansion
• Prepare for execution — without acting
This timeframe answers a different question:
“Is something forming — or is this noise?”
________________________________________
What Matters Most (Public View)
SA Range Indicator (RI):
→ Compression → expansion transitions
→ Energy buildup vs premature release
SA CloudRegimes (visual only):
→ Whether price behavior reflects continuation, pullback, or contraction
→ Whether movement is controlled or impulsive
These visuals describe behavior, not entries.
________________________________________
How to Interpret Public 15-Minute Posts
• 15m is setup formation
• 15m is environmental awareness
• 15m is not execution
Most errors occur when traders act before structure has finished forming.
This timeframe exists to slow that impulse down.
________________________________________
Messaging Line
“Preparation happens before the move — not during it.”
________________________________________
________________________________________
🤝 For Those Who Find Value
If these posts help you better recognize developing structure:
• Follow, boost, and share my scripts, Ideas, and MINDS posts
• Feel free to message me directly with questions or build requests
• Constructive feedback and collaboration are always welcome
For traders who want to go deeper, optional memberships may include:
• Additional signal access
• Early previews
• Occasional free tools and upgrades
🔗 Membership & Signals
trianchor.gumroad.com
15 Minute (15m) — Tactical Entry Alignment / “Permission + Timing”
Goal: Convert higher-timeframe permission into tradable timing.
How to use:
• Trade the first clean reclaim after a pullback.
• Avoid taking a reclaim if price is already extended far beyond the wake edge (late reclaim).
Best conditions:
• Works extremely well when:
o 1H agrees
o session structure is active (open/close windows)
o reclaim occurs near VWAP or a key level you already respect
Settings:
• dispMult 0.75–1.05
• reclaimWindow 6–14
• cooldown 3–6
🟠 15-MINUTE — Intraday Structure & Session Logic
1️⃣ Range Indicator (RI)
• Session compression → impulse likely
• Expansion → follow, don’t fade
Use:
Defines session behavior.
________________________________________
2️⃣ ZoneEngine (Structure)
• Filters session traps
• Explains failed breakouts
Use:
Keeps you aligned with real participation.
________________________________________
3️⃣ Cloud / Reclaim (Behavior)
• Identifies pullback vs continuation
• Reclaim confirms acceptance
Use:
Contextual confirmation.
________________________________________
4️⃣ Stop-Hunt Proxy
• Session liquidity sweeps
• Common near opens and transitions
Use:
Stop-hunt + compression = likely session impulse.

Golden hour 1130 1230 Session LinesGolden Hour 11:30–12:30 Session Lines
Overview :
Calculate the session high and low between 11:30 AM and 12:30 PM and mark the lines.
Trading Rule
Once the price breaks either side (high or low), it will continue to move further in that direction.
Session Time : 11:30 AM – 12:30 PM
Key Levels : Session High & Session Low
Strategy : Breakout continuation in the direction of the break
