GKD-BT Full Giga Kaleidoscope Backtest [Loxx]Giga Kaleidoscope GKD-BT Full Giga Kaleidoscope Backtest is a Backtesting module included in Loxx's "Giga Kaleidoscope Modularized Trading System".
█ GKD-BT Full Giga Kaleidoscope Backtest
The Full Giga Kaleidoscope Backtest module enables users to backtest Full GKD Long and Short signals, allowing the creation of a comprehensive NNFX trading system consisting of two confirmation indicators, a baseline, a measure of volatility/volume, and continuations.
This module offers two types of backtests: Trading and Full. The Trading backtest allows users to evaluate individual Long and Short trades one by one. On the other hand, the Full backtest enables the analysis of Longs or Shorts separately by toggling between them in the settings, providing insights into the results for each signal type. The Trading backtest simulates actual trading conditions, while the Full backtest evaluates all signals regardless of their Long or Short nature.
Additionally, the backtest module allows testing with 1 to 3 take profits and 1 stop loss. The Trading backtest supports 1 to 3 take profits, while the Full backtest is limited to 1 take profit. The Trading backtest also includes a trailing take profit feature.
Regarding the percentage of trade removed at each take profit, the backtest module incorporates the following predefined values:
Take profit 1: 50% of the trade is removed.
Take profit 2: 25% of the trade is removed.
Take profit 3: 25% of the trade is removed.
Stop loss: 100% of the trade is removed.
After achieving each take profit, the stop loss level is adjusted accordingly. When take profit 1 is reached, the stop loss is moved to the entry point. Similarly, when take profit 2 is reached, the stop loss is shifted to take profit 1. The trailing take profit feature comes into effect after take profit 2 or take profit 3, depending on the number of take profits selected in the settings. The trailing take profit is always activated on the final take profit when 2 or more take profits are chosen.
The backtest module also provides the option to restrict testing to a specific date range, allowing for simulated forward testing using past data. Additionally, users can choose to display or hide a trading panel that provides relevant information about the backtest, statistics, and the current trade. It is also possible to activate alerts and toggle sections of the trading panel on or off. Historical take profit and stop loss levels are displayed as overlaid horizontal lines on the chart for reference.
To utilize this strategy, follow these steps:
1. GKD-B Baseline Import: Import the value "Input into NEW GKD-BT Backtest" from the GKD-B Baseline module into the GKD-BT Full Giga Kaleidoscope Backtest module setting named "Import GKD-B Baseline."
2. GKD-V Volatility/Volume Import: Import the value "Input into NEW GKD-BT Backtest" from the GKD-V Volatility/Volume module into the GKD-BT Full Giga Kaleidoscope Backtest module setting named "Import GKD-V Volatility/Volume."
3. Adjust the "Confirmation 1 Type" in the GKD-C Confirmation Indicator to "GKD New."
4. GKD-C Confirmation 1 Import: Import the value "Input into NEW GKD-BT Backtest" from the GKD-C Confirmation 1 module into the GKD-BT Full Giga Kaleidoscope Backtest module setting named "Import GKD-C Confirmation 1."
5. Adjust the "Confirmation 2 Type" in the GKD-C Confirmation 2 Indicator to "GKD New."
6. GKD-C Confirmation 2 Import: Import the value "Input into NEW GKD-BT Backtest" from the GKD-C Confirmation 2 module into the GKD-BT Full Giga Kaleidoscope Backtest module setting named "Import GKD-C Confirmation 2."
7. Adjust the "Confirmation Type" in the GKD-C Continuation Indicator to "GKD New."
8. GKD-C Continuation Import: Import the value "Input into NEW GKD-BT Backtest" from the GKD-C Continuation module into the GKD-BT Full Giga Kaleidoscope Backtest module setting named "Import GKD-C Confirmation."
The GKD system utilizes volatility-based take profits and stop losses, where each take profit and stop loss is calculated as a multiple of volatility. Users have the flexibility to adjust the multiplier values in the settings to suit their preferences.
In a future update, the Full Giga Kaleidoscope Backtest module will include the option to incorporate a GKD-E Exit indicator, completing the full trading strategy.
█ Full Giga Kaleidoscope Backtest Entries
Within this module, there are ten distinct types of entries available, which are outlined below:
Standard Entry
1-Candle Standard Entry
Baseline Entry
1-Candle Baseline Entry
Volatility/Volume Entry
1-Candle Volatility/Volume Entry
Confirmation 2 Entry
1-Candle Confirmation 2 Entry
PullBack Entry
Continuation Entry
Each of these entry types can generate either long or short signals, resulting in a total of 20 signal variations. The user has the flexibility to enable or disable specific entry types and choose which qualifying rules within each entry type are applied to price to determine the final long or short signal.
The following section provides an overview of the various entry types and their corresponding qualifying rules:
Standard Entry
1. GKD-C Confirmation gives signal
2. Baseline agrees
3. Price inside Goldie Locks Zone Minimum
4. Price inside Goldie Locks Zone Maximum
5. Confirmation 2 agrees
6. Volatility/Volume agrees
1-Candle Standard Entry
1a. GKD-C Confirmation gives signal
2a. Baseline agrees
3a. Price inside Goldie Locks Zone Minimum
4a. Price inside Goldie Locks Zone Maximum
Next Candle
1b. Price retraced
2b. Baseline agrees
3b. Confirmation 1 agrees
4b. Confirmation 2 agrees
5b. Volatility/Volume agrees
Baseline Entry
1. GKD-B Basline gives signal
2. Confirmation 1 agrees
3. Price inside Goldie Locks Zone Minimum
4. Price inside Goldie Locks Zone Maximum
5. Confirmation 2 agrees
6. Volatility/Volume agrees
7. Confirmation 1 signal was less than 'Maximum Allowable PSBC Bars Back' prior
1-Candle Baseline Entry
1a. GKD-B Baseline gives signal
2a. Confirmation 1 agrees
3a. Price inside Goldie Locks Zone Minimum
4a. Price inside Goldie Locks Zone Maximum
5a. Confirmation 1 signal was less than 'Maximum Allowable PSBC Bars Back' prior
Next Candle
1b. Price retraced
2b. Baseline agrees
3b. Confirmation 1 agrees
4b. Confirmation 2 agrees
5b. Volatility/Volume agrees
Volatility/Volume Entry
1. GKD-V Volatility/Volume gives signal
2. Confirmation 1 agrees
3. Price inside Goldie Locks Zone Minimum
4. Price inside Goldie Locks Zone Maximum
5. Confirmation 2 agrees
6. Baseline agrees
7. Confirmation 1 signal was less than 7 candles prior
1-Candle Volatility/Volume Entry
1a. GKD-V Volatility/Volume gives signal
2a. Confirmation 1 agrees
3a. Price inside Goldie Locks Zone Minimum
4a. Price inside Goldie Locks Zone Maximum
5a. Confirmation 1 signal was less than 'Maximum Allowable PSVVC Bars Back' prior
Next Candle
1b. Price retraced
2b. Volatility/Volume agrees
3b. Confirmation 1 agrees
4b. Confirmation 2 agrees
5b. Baseline agrees
Confirmation 2 Entry
1. GKD-C Confirmation 2 gives signal
2. Confirmation 1 agrees
3. Price inside Goldie Locks Zone Minimum
4. Price inside Goldie Locks Zone Maximum
5. Volatility/Volume agrees
6. Baseline agrees
7. Confirmation 1 signal was less than 7 candles prior
1-Candle Confirmation 2 Entry
1a. GKD-C Confirmation 2 gives signal
2a. Confirmation 1 agrees
3a. Price inside Goldie Locks Zone Minimum
4a. Price inside Goldie Locks Zone Maximum
5a. Confirmation 1 signal was less than 'Maximum Allowable PSC2C Bars Back' prior
Next Candle
1b. Price retraced
2b. Confirmation 2 agrees
3b. Confirmation 1 agrees
4b. Volatility/Volume agrees
5b. Baseline agrees
PullBack Entry
1a. GKD-B Baseline gives signal
2a. Confirmation 1 agrees
3a. Price is beyond 1.0x Volatility of Baseline
Next Candle
1b. Price inside Goldie Locks Zone Minimum
2b. Price inside Goldie Locks Zone Maximum
3b. Confirmation 1 agrees
4b. Confirmation 2 agrees
5b. Volatility/Volume agrees
Continuation Entry
1. Standard Entry, 1-Candle Standard Entry, Baseline Entry, 1-Candle Baseline Entry, Volatility/Volume Entry, 1-Candle Volatility/Volume Entry, Confirmation 2 Entry, 1-Candle Confirmation 2 Entry, or Pullback entry triggered previously
2. Baseline hasn't crossed since entry signal trigger
4. Confirmation 1 agrees
5. Baseline agrees
6. Confirmation 2 agrees
█ Volatility Types Included
This module includes 17 types of volatility:
Close-to-Close
Parkinson
Garman-Klass
Rogers-Satchell
Yang-Zhang
Garman-Klass-Yang-Zhang
Exponential Weighted Moving Average
Standard Deviation of Log Returns
Pseudo GARCH(2,2)
Average True Range
True Range Double
Standard Deviation
Adaptive Deviation
Median Absolute Deviation
Efficiency-Ratio Adaptive ATR
Mean Absolute Deviation
Static Percent
Close-to-Close
Close-to-Close volatility is a classic and widely used volatility measure, sometimes referred to as historical volatility.
Volatility is an indicator of the speed of a stock price change. A stock with high volatility is one where the price changes rapidly and with a larger amplitude. The more volatile a stock is, the riskier it is.
Close-to-close historical volatility is calculated using only a stock's closing prices. It is the simplest volatility estimator. However, in many cases, it is not precise enough. Stock prices could jump significantly during a trading session and return to the opening value at the end. That means that a considerable amount of price information is not taken into account by close-to-close volatility.
Despite its drawbacks, Close-to-Close volatility is still useful in cases where the instrument doesn't have intraday prices. For example, mutual funds calculate their net asset values daily or weekly, and thus their prices are not suitable for more sophisticated volatility estimators.
Parkinson
Parkinson volatility is a volatility measure that uses the stock’s high and low price of the day.
The main difference between regular volatility and Parkinson volatility is that the latter uses high and low prices for a day, rather than only the closing price. This is useful as close-to-close prices could show little difference while large price movements could have occurred during the day. Thus, Parkinson's volatility is considered more precise and requires less data for calculation than close-to-close volatility.
One drawback of this estimator is that it doesn't take into account price movements after the market closes. Hence, it systematically undervalues volatility. This drawback is addressed in the Garman-Klass volatility estimator.
Garman-Klass
Garman-Klass is a volatility estimator that incorporates open, low, high, and close prices of a security.
Garman-Klass volatility extends Parkinson's volatility by taking into account the opening and closing prices. As markets are most active during the opening and closing of a trading session, it makes volatility estimation more accurate.
Garman and Klass also assumed that the process of price change follows a continuous diffusion process (Geometric Brownian motion). However, this assumption has several drawbacks. The method is not robust for opening jumps in price and trend movements.
Despite its drawbacks, the Garman-Klass estimator is still more effective than the basic formula since it takes into account not only the price at the beginning and end of the time interval but also intraday price extremes.
Researchers Rogers and Satchell have proposed a more efficient method for assessing historical volatility that takes into account price trends. See Rogers-Satchell Volatility for more detail.
Rogers-Satchell
Rogers-Satchell is an estimator for measuring the volatility of securities with an average return not equal to zero.
Unlike Parkinson and Garman-Klass estimators, Rogers-Satchell incorporates a drift term (mean return not equal to zero). As a result, it provides better volatility estimation when the underlying is trending.
The main disadvantage of this method is that it does not take into account price movements between trading sessions. This leads to an underestimation of volatility since price jumps periodically occur in the market precisely at the moments between sessions.
A more comprehensive estimator that also considers the gaps between sessions was developed based on the Rogers-Satchel formula in the 2000s by Yang-Zhang. See Yang Zhang Volatility for more detail.
Yang-Zhang
Yang Zhang is a historical volatility estimator that handles both opening jumps and the drift and has a minimum estimation error.
Yang-Zhang volatility can be thought of as a combination of the overnight (close-to-open volatility) and a weighted average of the Rogers-Satchell volatility and the day’s open-to-close volatility. It is considered to be 14 times more efficient than the close-to-close estimator.
Garman-Klass-Yang-Zhang
Garman-Klass-Yang-Zhang (GKYZ) volatility estimator incorporates the returns of open, high, low, and closing prices in its calculation.
GKYZ volatility estimator takes into account overnight jumps but not the trend, i.e., it assumes that the underlying asset follows a Geometric Brownian Motion (GBM) process with zero drift. Therefore, the GKYZ volatility estimator tends to overestimate the volatility when the drift is different from zero. However, for a GBM process, this estimator is eight times more efficient than the close-to-close volatility estimator.
Exponential Weighted Moving Average
The Exponentially Weighted Moving Average (EWMA) is a quantitative or statistical measure used to model or describe a time series. The EWMA is widely used in finance, with the main applications being technical analysis and volatility modeling.
The moving average is designed such that older observations are given lower weights. The weights decrease exponentially as the data point gets older – hence the name exponentially weighted.
The only decision a user of the EWMA must make is the parameter lambda. The parameter decides how important the current observation is in the calculation of the EWMA. The higher the value of lambda, the more closely the EWMA tracks the original time series.
Standard Deviation of Log Returns
This is the simplest calculation of volatility. It's the standard deviation of ln(close/close(1)).
Pseudo GARCH(2,2)
This is calculated using a short- and long-run mean of variance multiplied by ?.
?avg(var;M) + (1 ? ?) avg(var;N) = 2?var/(M+1-(M-1)L) + 2(1-?)var/(M+1-(M-1)L)
Solving for ? can be done by minimizing the mean squared error of estimation; that is, regressing L^-1var - avg(var; N) against avg(var; M) - avg(var; N) and using the resulting beta estimate as ?.
Average True Range
The average true range (ATR) is a technical analysis indicator, introduced by market technician J. Welles Wilder Jr. in his book New Concepts in Technical Trading Systems, that measures market volatility by decomposing the entire range of an asset price for that period.
The true range indicator is taken as the greatest of the following: current high less the current low; the absolute value of the current high less the previous close; and the absolute value of the current low less the previous close. The ATR is then a moving average, generally using 14 days, of the true ranges.
True Range Double
A special case of ATR that attempts to correct for volatility skew.
Standard Deviation
Standard deviation is a statistic that measures the dispersion of a dataset relative to its mean and is calculated as the square root of the variance. The standard deviation is calculated as the square root of variance by determining each data point's deviation relative to the mean. If the data points are further from the mean, there is a higher deviation within the data set; thus, the more spread out the data, the higher the standard deviation.
Adaptive Deviation
By definition, the Standard Deviation (STD, also represented by the Greek letter sigma ? or the Latin letter s) is a measure that is used to quantify the amount of variation or dispersion of a set of data values. In technical analysis, we usually use it to measure the level of current volatility.
Standard Deviation is based on Simple Moving Average calculation for mean value. This version of standard deviation uses the properties of EMA to calculate what can be called a new type of deviation, and since it is based on EMA, we can call it EMA deviation. Additionally, Perry Kaufman's efficiency ratio is used to make it adaptive (since all EMA type calculations are nearly perfect for adapting).
The difference when compared to the standard is significant--not just because of EMA usage, but the efficiency ratio makes it a "bit more logical" in very volatile market conditions.
Median Absolute Deviation
The median absolute deviation is a measure of statistical dispersion. Moreover, the MAD is a robust statistic, being more resilient to outliers in a data set than the standard deviation. In the standard deviation, the distances from the mean are squared, so large deviations are weighted more heavily, and thus outliers can heavily influence it. In the MAD, the deviations of a small number of outliers are irrelevant.
Because the MAD is a more robust estimator of scale than the sample variance or standard deviation, it works better with distributions without a mean or variance, such as the Cauchy distribution.
Efficiency-Ratio Adaptive ATR
Average True Range (ATR) is a widely used indicator for many occasions in technical analysis. It is calculated as the RMA of the true range. This version adds a "twist": it uses Perry Kaufman's Efficiency Ratio to calculate adaptive true range.
Mean Absolute Deviation
The mean absolute deviation (MAD) is a measure of variability that indicates the average distance between observations and their mean. MAD uses the original units of the data, which simplifies interpretation. Larger values signify that the data points spread out further from the average. Conversely, lower values correspond to data points bunching closer to it. The mean absolute deviation is also known as the mean deviation and average absolute deviation.
This definition of the mean absolute deviation sounds similar to the standard deviation (SD). While both measure variability, they have different calculations. In recent years, some proponents of MAD have suggested that it replace the SD as the primary measure because it is a simpler concept that better fits real life.
Static Percent
Static Percent allows the user to insert their own constant percent that will then be used to create take profits and stoploss
█ Giga Kaleidoscope Modularized Trading System
Core components of an NNFX algorithmic trading strategy
The NNFX algorithm is built on the principles of trend, momentum, and volatility. There are six core components in the NNFX trading algorithm:
1. Volatility - price volatility; e.g., Average True Range, True Range Double, Close-to-Close, etc.
2. Baseline - a moving average to identify price trend
3. Confirmation 1 - a technical indicator used to identify trends
4. Confirmation 2 - a technical indicator used to identify trends
5. Continuation - a technical indicator used to identify trends
6. Volatility/Volume - a technical indicator used to identify volatility/volume breakouts/breakdown
7. Exit - a technical indicator used to determine when a trend is exhausted
What is Volatility in the NNFX trading system?
In the NNFX (No Nonsense Forex) trading system, ATR (Average True Range) is typically used to measure the volatility of an asset. It is used as a part of the system to help determine the appropriate stop loss and take profit levels for a trade. ATR is calculated by taking the average of the true range values over a specified period.
True range is calculated as the maximum of the following values:
-Current high minus the current low
-Absolute value of the current high minus the previous close
-Absolute value of the current low minus the previous close
ATR is a dynamic indicator that changes with changes in volatility. As volatility increases, the value of ATR increases, and as volatility decreases, the value of ATR decreases. By using ATR in NNFX system, traders can adjust their stop loss and take profit levels according to the volatility of the asset being traded. This helps to ensure that the trade is given enough room to move, while also minimizing potential losses.
Other types of volatility include True Range Double (TRD), Close-to-Close, and Garman-Klass
What is a Baseline indicator?
The baseline is essentially a moving average, and is used to determine the overall direction of the market.
The baseline in the NNFX system is used to filter out trades that are not in line with the long-term trend of the market. The baseline is plotted on the chart along with other indicators, such as the Moving Average (MA), the Relative Strength Index (RSI), and the Average True Range (ATR).
Trades are only taken when the price is in the same direction as the baseline. For example, if the baseline is sloping upwards, only long trades are taken, and if the baseline is sloping downwards, only short trades are taken. This approach helps to ensure that trades are in line with the overall trend of the market, and reduces the risk of entering trades that are likely to fail.
By using a baseline in the NNFX system, traders can have a clear reference point for determining the overall trend of the market, and can make more informed trading decisions. The baseline helps to filter out noise and false signals, and ensures that trades are taken in the direction of the long-term trend.
What is a Confirmation indicator?
Confirmation indicators are technical indicators that are used to confirm the signals generated by primary indicators. Primary indicators are the core indicators used in the NNFX system, such as the Average True Range (ATR), the Moving Average (MA), and the Relative Strength Index (RSI).
The purpose of the confirmation indicators is to reduce false signals and improve the accuracy of the trading system. They are designed to confirm the signals generated by the primary indicators by providing additional information about the strength and direction of the trend.
Some examples of confirmation indicators that may be used in the NNFX system include the Bollinger Bands, the MACD (Moving Average Convergence Divergence), and the MACD Oscillator. These indicators can provide information about the volatility, momentum, and trend strength of the market, and can be used to confirm the signals generated by the primary indicators.
In the NNFX system, confirmation indicators are used in combination with primary indicators and other filters to create a trading system that is robust and reliable. By using multiple indicators to confirm trading signals, the system aims to reduce the risk of false signals and improve the overall profitability of the trades.
What is a Continuation indicator?
In the NNFX (No Nonsense Forex) trading system, a continuation indicator is a technical indicator that is used to confirm a current trend and predict that the trend is likely to continue in the same direction. A continuation indicator is typically used in conjunction with other indicators in the system, such as a baseline indicator, to provide a comprehensive trading strategy.
What is a Volatility/Volume indicator?
Volume indicators, such as the On Balance Volume (OBV), the Chaikin Money Flow (CMF), or the Volume Price Trend (VPT), are used to measure the amount of buying and selling activity in a market. They are based on the trading volume of the market, and can provide information about the strength of the trend. In the NNFX system, volume indicators are used to confirm trading signals generated by the Moving Average and the Relative Strength Index. Volatility indicators include Average Direction Index, Waddah Attar, and Volatility Ratio. In the NNFX trading system, volatility is a proxy for volume and vice versa.
By using volume indicators as confirmation tools, the NNFX trading system aims to reduce the risk of false signals and improve the overall profitability of trades. These indicators can provide additional information about the market that is not captured by the primary indicators, and can help traders to make more informed trading decisions. In addition, volume indicators can be used to identify potential changes in market trends and to confirm the strength of price movements.
What is an Exit indicator?
The exit indicator is used in conjunction with other indicators in the system, such as the Moving Average (MA), the Relative Strength Index (RSI), and the Average True Range (ATR), to provide a comprehensive trading strategy.
The exit indicator in the NNFX system can be any technical indicator that is deemed effective at identifying optimal exit points. Examples of exit indicators that are commonly used include the Parabolic SAR, the Average Directional Index (ADX), and the Chandelier Exit.
The purpose of the exit indicator is to identify when a trend is likely to reverse or when the market conditions have changed, signaling the need to exit a trade. By using an exit indicator, traders can manage their risk and prevent significant losses.
In the NNFX system, the exit indicator is used in conjunction with a stop loss and a take profit order to maximize profits and minimize losses. The stop loss order is used to limit the amount of loss that can be incurred if the trade goes against the trader, while the take profit order is used to lock in profits when the trade is moving in the trader's favor.
Overall, the use of an exit indicator in the NNFX trading system is an important component of a comprehensive trading strategy. It allows traders to manage their risk effectively and improve the profitability of their trades by exiting at the right time.
How does Loxx's GKD (Giga Kaleidoscope Modularized Trading System) implement the NNFX algorithm outlined above?
Loxx's GKD v2.0 system has five types of modules (indicators/strategies). These modules are:
1. GKD-BT - Backtesting module (Volatility, Number 1 in the NNFX algorithm)
2. GKD-B - Baseline module (Baseline and Volatility/Volume, Numbers 1 and 2 in the NNFX algorithm)
3. GKD-C - Confirmation 1/2 and Continuation module (Confirmation 1/2 and Continuation, Numbers 3, 4, and 5 in the NNFX algorithm)
4. GKD-V - Volatility/Volume module (Confirmation 1/2, Number 6 in the NNFX algorithm)
5. GKD-E - Exit module (Exit, Number 7 in the NNFX algorithm)
(additional module types will added in future releases)
Each module interacts with every module by passing data to A backtest module wherein the various components of the GKD system are combined to create a trading signal.
That is, the Baseline indicator passes its data to Volatility/Volume. The Volatility/Volume indicator passes its values to the Confirmation 1 indicator. The Confirmation 1 indicator passes its values to the Confirmation 2 indicator. The Confirmation 2 indicator passes its values to the Continuation indicator. The Continuation indicator passes its values to the Exit indicator, and finally, the Exit indicator passes its values to the Backtest strategy.
This chaining of indicators requires that each module conform to Loxx's GKD protocol, therefore allowing for the testing of every possible combination of technical indicators that make up the six components of the NNFX algorithm.
What does the application of the GKD trading system look like?
Example trading system:
Backtest: Full Giga Kaleidoscope Backtest as shown on the chart above
Baseline: Hull Moving Average as shown on the chart above
Volatility/Volume: Hurst Exponent as shown on the chart above
Confirmation 1: Vorext as shown on the chart above
Confirmation 2: Coppock Curve as shown on the chart above
Continuation: Fisher Transform as shown on the chart above
Exit: Rex Oscillator
Each GKD indicator is denoted with a module identifier of either: GKD-BT, GKD-B, GKD-C, GKD-V, or GKD-E. This allows traders to understand to which module each indicator belongs and where each indicator fits into the GKD system.
Cerca negli script per "session"

GKD-BT Solo Confirmation Super Complex Backtest [Loxx]Giga Kaleidoscope GKD-BT Solo Confirmation Super Complex Backtest is a Backtesting module included in Loxx's "Giga Kaleidoscope Modularized Trading System".
█ GKD-BT Solo Confirmation Super Complex Backtest
The Solo Confirmation Super Complex Backtest module allows users to perform backtesting on Full GKD Long and Short signals using GKD-C confirmation indicators. These signals are further refined by GKD-B Baseline and GKD-V Volatility/Volume indicators and augmented by an additional GKD-C Confirmation indicator acting as a Continuation indicator. This module serves as a comprehensive tool that falls just below a Full GKD trading system. The key difference is that the GKD-BT Solo Confirmation Super Complex utilizes a single GKD-C Confirmation indicator, while the Full GKD system employs two GKD-C Confirmation indicators. Both the Solo Confirmation Super Complex and the Full GKD systems incorporate an extra GKD-C Confirmation indicator to identify Continuation signals, which provide both longs and shorts on developing trends following an initial trend change.
This module encompasses two types of backtests: Trading and Full. The Trading backtest permits users to evaluate individual trades, whether Long or Short, one at a time. Conversely, the Full backtest allows users to analyze either Longs or Shorts separately by toggling between them in the settings, enabling the examination of results for each signal type. The Trading backtest emulates actual trading conditions, while the Full backtest assesses all signals, regardless of being Long or Short.
Additionally, this backtest module provides the option to test the core GKD-C Confirmation and GKD-C Continuation indicators with 1 to 3 take profits and 1 stop loss. The Trading backtest allows for the use of 1 to 3 take profits, while the Full backtest is limited to 1 take profit. The Trading backtest also offers the capability to apply a trailing take profit.
In terms of the percentage of trade removed at each take profit, this backtest module has the following hardcoded values:
Take profit 1: 50% of the trade is removed.
Take profit 2: 25% of the trade is removed.
Take profit 3: 25% of the trade is removed.
Stop loss: 100% of the trade is removed.
After each take profit is achieved, the stop loss level is adjusted. When take profit 1 is reached, the stop loss is moved to the entry point. Similarly, when take profit 2 is reached, the stop loss is shifted to take profit 1. The trailing take profit feature comes into play after take profit 2 or take profit 3, depending on the number of take profits selected in the settings. The trailing take profit is always activated on the final take profit when 2 or more take profits are chosen.
The backtest module also offers the capability to restrict by a specific date range, allowing for simulated forward testing based on past data. Additionally, users have the option to display or hide a trading panel that provides relevant information about the backtest, statistics, and the current trade. It is also possible to activate alerts and toggle sections of the trading panel on or off. On the chart, historical take profit and stop loss levels are represented by horizontal lines overlaid for reference.
To utilize this strategy, follow these steps:
1. GKD-B Baseline Import: Import the value "Input into NEW GKD-BT Backtest" from the GKD-B Baseline module into the GKD-BT Solo Confirmation Super Complex Backtest module setting named "Import GKD-B Baseline."
2. GKD-V Volatility/Volume Import: Import the value "Input into NEW GKD-BT Backtest" from the GKD-V Volatility/Volume module into the GKD-BT Solo Confirmation Super Complex Backtest module setting named "Import GKD-V Volatility/Volume."
3. Adjust the "Confirmation Type" in the GKD-C Confirmation Indicator to "GKD New."
4. GKD-C Confirmation Import: Import the value "Input into NEW GKD-BT Backtest" from the GKD-C Confirmation module into the GKD-BT Solo Confirmation Super Complex Backtest module setting named "Import GKD-C Confirmation."
5. Adjust the "Confirmation Type" in the GKD-C Continuation Indicator to "GKD New."
6. GKD-C Continuation Import: Import the value "Input into NEW GKD-BT Backtest" from the GKD-C Continuation module into the GKD-BT Solo Confirmation Super Complex Backtest module setting named "Import GKD-C Continuation."
The GKD system utilizes volatility-based take profits and stop losses. Each take profit and stop loss is calculated as a multiple of volatility. Users can also adjust the multiplier values in the settings.
In a future update, the option to include a GKD-E Exit indicator will be added to this module to complete a full trading strategy.
█ Solo Confirmation Super Complex Backtest Entries
Within this module, there are eight distinct types of entries available, which are outlined below:
Standard Entry
1-Candle Standard Entry
Baseline Entry
1-Candle Baseline Entry
Volatility/Volume Entry
1-Candle Volatility/Volume Entry
PullBack Entry
Continuation Entry
Each of these entry types can generate either long or short signals, resulting in a total of 16 signal variations. The user has the flexibility to enable or disable specific entry types and choose which qualifying rules within each entry type are applied to price to determine the final long or short signal. You'll notice that these signals are different form the core GKD signals mentioned towards the end of this description. Signals from the GKD-BT Solo Confirmation Super Complex Backtest are modifided to add additional qualifications to make your finalized trading strategy more dynamic and robust.
The following section provides an overview of the various entry types and their corresponding qualifying rules:
Standard Entry
1. GKD-C Confirmation gives signal
2. Baseline agrees
3. Price inside Goldie Locks Zone Minimum
4. Price inside Goldie Locks Zone Maximum
5. Volatility/Volume agrees
1-Candle Standard Entry
1a. GKD-C Confirmation gives signal
2a. Baseline agrees
3a. Price inside Goldie Locks Zone Minimum
4a. Price inside Goldie Locks Zone Maximum
Next Candle:
1b. Price retraced
2b. Baseline agrees
3b. Confirmation 1 agrees
4b. Volatility/Volume agrees
Baseline Entry
1. GKD-B Basline gives signal
2. Confirmation 1 agrees
3. Price inside Goldie Locks Zone Minimum
4. Price inside Goldie Locks Zone Maximum
5. Volatility/Volume agrees
6. Confirmation 1 signal was less than 'Maximum Allowable PSBC Bars Back' prior
1-Candle Baseline Entry
1a. GKD-B Basline gives signal
2a. Confirmation 1 agrees
3a. Price inside Goldie Locks Zone Minimum
4a. Price inside Goldie Locks Zone Maximum
5a. Confirmation 1 signal was less than 'Maximum Allowable PSBC Bars Back' prior
Next Candle:
1b. Price retraced
2b. Baseline agrees
3b. Confirmation 1 agrees
4b. Volatility/Volume agrees
Volatility/Volume Entry
1. GKD-V Volatility/Volume gives signal
2. Confirmation 1 agrees
3. Price inside Goldie Locks Zone Minimum
4. Price inside Goldie Locks Zone Maximum
5. Baseline agrees
6. Confirmation 1 signal was less than 7 candles prior
1-Candle Volatility/Volume Entry
1a. GKD-V Volatility/Volume gives signal
2a. Confirmation 1 agrees
3a. Price inside Goldie Locks Zone Minimum
4a. Price inside Goldie Locks Zone Maximum
5a. Confirmation 1 signal was less than 'Maximum Allowable PSVVC Bars Back' prior
Next Candle:
1b. Price retraced
2b. Volatility/Volume agrees
3b. Confirmation 1 agrees
4b. Baseline agrees
PullBack Entry
1a. GKD-B Baseline gives signal
2a. Confirmation 1 agrees
3a. Price is beyond 1.0x Volatility of Baseline
Next Candle:
1b. Price inside Goldie Locks Zone Minimum
2b. Price inside Goldie Locks Zone Maximum
3b. Confirmation 1 agrees
4b. Volatility/Volume agrees
Continuation Entry
1. Standard Entry, 1-Candle Standard Entry, Baseline Entry, 1-Candle Baseline Entry, Volatility/Volume Entry, 1-Candle Volatility/Volume Entry, or Pullback entry triggered previously
2. Baseline hasn't crossed since entry signal trigger
4. Confirmation 1 agrees
5. Baseline agrees
█ Volatility Types Included
This module includes 17 types of volatility:
Close-to-Close
Parkinson
Garman-Klass
Rogers-Satchell
Yang-Zhang
Garman-Klass-Yang-Zhang
Exponential Weighted Moving Average
Standard Deviation of Log Returns
Pseudo GARCH(2,2)
Average True Range
True Range Double
Standard Deviation
Adaptive Deviation
Median Absolute Deviation
Efficiency-Ratio Adaptive ATR
Mean Absolute Deviation
Static Percent
Close-to-Close
Close-to-Close volatility is a classic and widely used volatility measure, sometimes referred to as historical volatility.
Volatility is an indicator of the speed of a stock price change. A stock with high volatility is one where the price changes rapidly and with a larger amplitude. The more volatile a stock is, the riskier it is.
Close-to-close historical volatility is calculated using only a stock's closing prices. It is the simplest volatility estimator. However, in many cases, it is not precise enough. Stock prices could jump significantly during a trading session and return to the opening value at the end. That means that a considerable amount of price information is not taken into account by close-to-close volatility.
Despite its drawbacks, Close-to-Close volatility is still useful in cases where the instrument doesn't have intraday prices. For example, mutual funds calculate their net asset values daily or weekly, and thus their prices are not suitable for more sophisticated volatility estimators.
Parkinson
Parkinson volatility is a volatility measure that uses the stock’s high and low price of the day.
The main difference between regular volatility and Parkinson volatility is that the latter uses high and low prices for a day, rather than only the closing price. This is useful as close-to-close prices could show little difference while large price movements could have occurred during the day. Thus, Parkinson's volatility is considered more precise and requires less data for calculation than close-to-close volatility.
One drawback of this estimator is that it doesn't take into account price movements after the market closes. Hence, it systematically undervalues volatility. This drawback is addressed in the Garman-Klass volatility estimator.
Garman-Klass
Garman-Klass is a volatility estimator that incorporates open, low, high, and close prices of a security.
Garman-Klass volatility extends Parkinson's volatility by taking into account the opening and closing prices. As markets are most active during the opening and closing of a trading session, it makes volatility estimation more accurate.
Garman and Klass also assumed that the process of price change follows a continuous diffusion process (Geometric Brownian motion). However, this assumption has several drawbacks. The method is not robust for opening jumps in price and trend movements.
Despite its drawbacks, the Garman-Klass estimator is still more effective than the basic formula since it takes into account not only the price at the beginning and end of the time interval but also intraday price extremes.
Researchers Rogers and Satchell have proposed a more efficient method for assessing historical volatility that takes into account price trends. See Rogers-Satchell Volatility for more detail.
Rogers-Satchell
Rogers-Satchell is an estimator for measuring the volatility of securities with an average return not equal to zero.
Unlike Parkinson and Garman-Klass estimators, Rogers-Satchell incorporates a drift term (mean return not equal to zero). As a result, it provides better volatility estimation when the underlying is trending.
The main disadvantage of this method is that it does not take into account price movements between trading sessions. This leads to an underestimation of volatility since price jumps periodically occur in the market precisely at the moments between sessions.
A more comprehensive estimator that also considers the gaps between sessions was developed based on the Rogers-Satchel formula in the 2000s by Yang-Zhang. See Yang Zhang Volatility for more detail.
Yang-Zhang
Yang Zhang is a historical volatility estimator that handles both opening jumps and the drift and has a minimum estimation error.
Yang-Zhang volatility can be thought of as a combination of the overnight (close-to-open volatility) and a weighted average of the Rogers-Satchell volatility and the day’s open-to-close volatility. It is considered to be 14 times more efficient than the close-to-close estimator.
Garman-Klass-Yang-Zhang
Garman-Klass-Yang-Zhang (GKYZ) volatility estimator incorporates the returns of open, high, low, and closing prices in its calculation.
GKYZ volatility estimator takes into account overnight jumps but not the trend, i.e., it assumes that the underlying asset follows a Geometric Brownian Motion (GBM) process with zero drift. Therefore, the GKYZ volatility estimator tends to overestimate the volatility when the drift is different from zero. However, for a GBM process, this estimator is eight times more efficient than the close-to-close volatility estimator.
Exponential Weighted Moving Average
The Exponentially Weighted Moving Average (EWMA) is a quantitative or statistical measure used to model or describe a time series. The EWMA is widely used in finance, with the main applications being technical analysis and volatility modeling.
The moving average is designed such that older observations are given lower weights. The weights decrease exponentially as the data point gets older – hence the name exponentially weighted.
The only decision a user of the EWMA must make is the parameter lambda. The parameter decides how important the current observation is in the calculation of the EWMA. The higher the value of lambda, the more closely the EWMA tracks the original time series.
Standard Deviation of Log Returns
This is the simplest calculation of volatility. It's the standard deviation of ln(close/close(1)).
Pseudo GARCH(2,2)
This is calculated using a short- and long-run mean of variance multiplied by ?.
?avg(var;M) + (1 ? ?) avg(var;N) = 2?var/(M+1-(M-1)L) + 2(1-?)var/(M+1-(M-1)L)
Solving for ? can be done by minimizing the mean squared error of estimation; that is, regressing L^-1var - avg(var; N) against avg(var; M) - avg(var; N) and using the resulting beta estimate as ?.
Average True Range
The average true range (ATR) is a technical analysis indicator, introduced by market technician J. Welles Wilder Jr. in his book New Concepts in Technical Trading Systems, that measures market volatility by decomposing the entire range of an asset price for that period.
The true range indicator is taken as the greatest of the following: current high less the current low; the absolute value of the current high less the previous close; and the absolute value of the current low less the previous close. The ATR is then a moving average, generally using 14 days, of the true ranges.
True Range Double
A special case of ATR that attempts to correct for volatility skew.
Standard Deviation
Standard deviation is a statistic that measures the dispersion of a dataset relative to its mean and is calculated as the square root of the variance. The standard deviation is calculated as the square root of variance by determining each data point's deviation relative to the mean. If the data points are further from the mean, there is a higher deviation within the data set; thus, the more spread out the data, the higher the standard deviation.
Adaptive Deviation
By definition, the Standard Deviation (STD, also represented by the Greek letter sigma ? or the Latin letter s) is a measure that is used to quantify the amount of variation or dispersion of a set of data values. In technical analysis, we usually use it to measure the level of current volatility.
Standard Deviation is based on Simple Moving Average calculation for mean value. This version of standard deviation uses the properties of EMA to calculate what can be called a new type of deviation, and since it is based on EMA, we can call it EMA deviation. Additionally, Perry Kaufman's efficiency ratio is used to make it adaptive (since all EMA type calculations are nearly perfect for adapting).
The difference when compared to the standard is significant--not just because of EMA usage, but the efficiency ratio makes it a "bit more logical" in very volatile market conditions.
Median Absolute Deviation
The median absolute deviation is a measure of statistical dispersion. Moreover, the MAD is a robust statistic, being more resilient to outliers in a data set than the standard deviation. In the standard deviation, the distances from the mean are squared, so large deviations are weighted more heavily, and thus outliers can heavily influence it. In the MAD, the deviations of a small number of outliers are irrelevant.
Because the MAD is a more robust estimator of scale than the sample variance or standard deviation, it works better with distributions without a mean or variance, such as the Cauchy distribution.
Efficiency-Ratio Adaptive ATR
Average True Range (ATR) is a widely used indicator for many occasions in technical analysis. It is calculated as the RMA of the true range. This version adds a "twist": it uses Perry Kaufman's Efficiency Ratio to calculate adaptive true range.
Mean Absolute Deviation
The mean absolute deviation (MAD) is a measure of variability that indicates the average distance between observations and their mean. MAD uses the original units of the data, which simplifies interpretation. Larger values signify that the data points spread out further from the average. Conversely, lower values correspond to data points bunching closer to it. The mean absolute deviation is also known as the mean deviation and average absolute deviation.
This definition of the mean absolute deviation sounds similar to the standard deviation (SD). While both measure variability, they have different calculations. In recent years, some proponents of MAD have suggested that it replace the SD as the primary measure because it is a simpler concept that better fits real life.
Static Percent
Static Percent allows the user to insert their own constant percent that will then be used to create take profits and stoploss
█ Giga Kaleidoscope Modularized Trading System
Core components of an NNFX algorithmic trading strategy
The NNFX algorithm is built on the principles of trend, momentum, and volatility. There are six core components in the NNFX trading algorithm:
1. Volatility - price volatility; e.g., Average True Range, True Range Double, Close-to-Close, etc.
2. Baseline - a moving average to identify price trend
3. Confirmation 1 - a technical indicator used to identify trends
4. Confirmation 2 - a technical indicator used to identify trends
5. Continuation - a technical indicator used to identify trends
6. Volatility/Volume - a technical indicator used to identify volatility/volume breakouts/breakdown
7. Exit - a technical indicator used to determine when a trend is exhausted
What is Volatility in the NNFX trading system?
In the NNFX (No Nonsense Forex) trading system, ATR (Average True Range) is typically used to measure the volatility of an asset. It is used as a part of the system to help determine the appropriate stop loss and take profit levels for a trade. ATR is calculated by taking the average of the true range values over a specified period.
True range is calculated as the maximum of the following values:
-Current high minus the current low
-Absolute value of the current high minus the previous close
-Absolute value of the current low minus the previous close
ATR is a dynamic indicator that changes with changes in volatility. As volatility increases, the value of ATR increases, and as volatility decreases, the value of ATR decreases. By using ATR in NNFX system, traders can adjust their stop loss and take profit levels according to the volatility of the asset being traded. This helps to ensure that the trade is given enough room to move, while also minimizing potential losses.
Other types of volatility include True Range Double (TRD), Close-to-Close, and Garman-Klass
What is a Baseline indicator?
The baseline is essentially a moving average, and is used to determine the overall direction of the market.
The baseline in the NNFX system is used to filter out trades that are not in line with the long-term trend of the market. The baseline is plotted on the chart along with other indicators, such as the Moving Average (MA), the Relative Strength Index (RSI), and the Average True Range (ATR).
Trades are only taken when the price is in the same direction as the baseline. For example, if the baseline is sloping upwards, only long trades are taken, and if the baseline is sloping downwards, only short trades are taken. This approach helps to ensure that trades are in line with the overall trend of the market, and reduces the risk of entering trades that are likely to fail.
By using a baseline in the NNFX system, traders can have a clear reference point for determining the overall trend of the market, and can make more informed trading decisions. The baseline helps to filter out noise and false signals, and ensures that trades are taken in the direction of the long-term trend.
What is a Confirmation indicator?
Confirmation indicators are technical indicators that are used to confirm the signals generated by primary indicators. Primary indicators are the core indicators used in the NNFX system, such as the Average True Range (ATR), the Moving Average (MA), and the Relative Strength Index (RSI).
The purpose of the confirmation indicators is to reduce false signals and improve the accuracy of the trading system. They are designed to confirm the signals generated by the primary indicators by providing additional information about the strength and direction of the trend.
Some examples of confirmation indicators that may be used in the NNFX system include the Bollinger Bands, the MACD (Moving Average Convergence Divergence), and the MACD Oscillator. These indicators can provide information about the volatility, momentum, and trend strength of the market, and can be used to confirm the signals generated by the primary indicators.
In the NNFX system, confirmation indicators are used in combination with primary indicators and other filters to create a trading system that is robust and reliable. By using multiple indicators to confirm trading signals, the system aims to reduce the risk of false signals and improve the overall profitability of the trades.
What is a Continuation indicator?
In the NNFX (No Nonsense Forex) trading system, a continuation indicator is a technical indicator that is used to confirm a current trend and predict that the trend is likely to continue in the same direction. A continuation indicator is typically used in conjunction with other indicators in the system, such as a baseline indicator, to provide a comprehensive trading strategy.
What is a Volatility/Volume indicator?
Volume indicators, such as the On Balance Volume (OBV), the Chaikin Money Flow (CMF), or the Volume Price Trend (VPT), are used to measure the amount of buying and selling activity in a market. They are based on the trading volume of the market, and can provide information about the strength of the trend. In the NNFX system, volume indicators are used to confirm trading signals generated by the Moving Average and the Relative Strength Index. Volatility indicators include Average Direction Index, Waddah Attar, and Volatility Ratio. In the NNFX trading system, volatility is a proxy for volume and vice versa.
By using volume indicators as confirmation tools, the NNFX trading system aims to reduce the risk of false signals and improve the overall profitability of trades. These indicators can provide additional information about the market that is not captured by the primary indicators, and can help traders to make more informed trading decisions. In addition, volume indicators can be used to identify potential changes in market trends and to confirm the strength of price movements.
What is an Exit indicator?
The exit indicator is used in conjunction with other indicators in the system, such as the Moving Average (MA), the Relative Strength Index (RSI), and the Average True Range (ATR), to provide a comprehensive trading strategy.
The exit indicator in the NNFX system can be any technical indicator that is deemed effective at identifying optimal exit points. Examples of exit indicators that are commonly used include the Parabolic SAR, the Average Directional Index (ADX), and the Chandelier Exit.
The purpose of the exit indicator is to identify when a trend is likely to reverse or when the market conditions have changed, signaling the need to exit a trade. By using an exit indicator, traders can manage their risk and prevent significant losses.
In the NNFX system, the exit indicator is used in conjunction with a stop loss and a take profit order to maximize profits and minimize losses. The stop loss order is used to limit the amount of loss that can be incurred if the trade goes against the trader, while the take profit order is used to lock in profits when the trade is moving in the trader's favor.
Overall, the use of an exit indicator in the NNFX trading system is an important component of a comprehensive trading strategy. It allows traders to manage their risk effectively and improve the profitability of their trades by exiting at the right time.
How does Loxx's GKD (Giga Kaleidoscope Modularized Trading System) implement the NNFX algorithm outlined above?
Loxx's GKD v2.0 system has five types of modules (indicators/strategies). These modules are:
1. GKD-BT - Backtesting module (Volatility, Number 1 in the NNFX algorithm)
2. GKD-B - Baseline module (Baseline and Volatility/Volume, Numbers 1 and 2 in the NNFX algorithm)
3. GKD-C - Confirmation 1/2 and Continuation module (Confirmation 1/2 and Continuation, Numbers 3, 4, and 5 in the NNFX algorithm)
4. GKD-V - Volatility/Volume module (Confirmation 1/2, Number 6 in the NNFX algorithm)
5. GKD-E - Exit module (Exit, Number 7 in the NNFX algorithm)
(additional module types will added in future releases)
Each module interacts with every module by passing data to A backtest module wherein the various components of the GKD system are combined to create a trading signal.
That is, the Baseline indicator passes its data to Volatility/Volume. The Volatility/Volume indicator passes its values to the Confirmation 1 indicator. The Confirmation 1 indicator passes its values to the Confirmation 2 indicator. The Confirmation 2 indicator passes its values to the Continuation indicator. The Continuation indicator passes its values to the Exit indicator, and finally, the Exit indicator passes its values to the Backtest strategy.
This chaining of indicators requires that each module conform to Loxx's GKD protocol, therefore allowing for the testing of every possible combination of technical indicators that make up the six components of the NNFX algorithm.
What does the application of the GKD trading system look like?
Example trading system:
Backtest: Solo Confirmation Complex Backtest as shown on the chart above
Baseline: Hull Moving Average as shown on the chart above
Volatility/Volume: Hurst Exponent as shown on the chart above
Confirmation 1: Fisher Trasnform as shown on the chart above
Confirmation 2: Williams Percent Range
Continuation: Vortex as shown on the chart above
Exit: Rex Oscillator
Each GKD indicator is denoted with a module identifier of either: GKD-BT, GKD-B, GKD-C, GKD-V, or GKD-E. This allows traders to understand to which module each indicator belongs and where each indicator fits into the GKD system.
Giga Kaleidoscope Modularized Trading System Signals (based on the NNFX algorithm)
Standard Entry
1. GKD-C Confirmation 1 Signal
2. GKD-B Baseline agrees
3. Price is within a range of 0.2x Volatility and 1.0x Volatility of the Goldie Locks Mean
4. GKD-C Confirmation 2 agrees
5. GKD-V Volatility/Volume agrees
Baseline Entry
1. GKD-B Baseline signal
2. GKD-C Confirmation 1 agrees
3. Price is within a range of 0.2x Volatility and 1.0x Volatility of the Goldie Locks Mean
4. GKD-C Confirmation 2 agrees
5. GKD-V Volatility/Volume agrees
6. GKD-C Confirmation 1 signal was less than 7 candles prior
Volatility/Volume Entry
1. GKD-V Volatility/Volume signal
2. GKD-C Confirmation 1 agrees
3. Price is within a range of 0.2x Volatility and 1.0x Volatility of the Goldie Locks Mean
4. GKD-C Confirmation 2 agrees
5. GKD-B Baseline agrees
6. GKD-C Confirmation 1 signal was less than 7 candles prior
Continuation Entry
1. Standard Entry, Baseline Entry, or Pullback; entry triggered previously
2. GKD-B Baseline hasn't crossed since entry signal trigger
3. GKD-C Confirmation Continuation Indicator signals
4. GKD-C Confirmation 1 agrees
5. GKD-B Baseline agrees
6. GKD-C Confirmation 2 agrees
1-Candle Rule Standard Entry
1. GKD-C Confirmation 1 signal
2. GKD-B Baseline agrees
3. Price is within a range of 0.2x Volatility and 1.0x Volatility of the Goldie Locks Mean
Next Candle:
1. Price retraced (Long: close < close or Short: close > close )
2. GKD-B Baseline agrees
3. GKD-C Confirmation 1 agrees
4. GKD-C Confirmation 2 agrees
5. GKD-V Volatility/Volume agrees
1-Candle Rule Baseline Entry
1. GKD-B Baseline signal
2. GKD-C Confirmation 1 agrees
3. Price is within a range of 0.2x Volatility and 1.0x Volatility of the Goldie Locks Mean
4. GKD-C Confirmation 1 signal was less than 7 candles prior
Next Candle:
1. Price retraced (Long: close < close or Short: close > close )
2. GKD-B Baseline agrees
3. GKD-C Confirmation 1 agrees
4. GKD-C Confirmation 2 agrees
5. GKD-V Volatility/Volume Agrees
1-Candle Rule Volatility/Volume Entry
1. GKD-V Volatility/Volume signal
2. GKD-C Confirmation 1 agrees
3. Price is within a range of 0.2x Volatility and 1.0x Volatility of the Goldie Locks Mean
4. GKD-C Confirmation 1 signal was less than 7 candles prior
Next Candle:
1. Price retraced (Long: close < close or Short: close > close)
2. GKD-B Volatility/Volume agrees
3. GKD-C Confirmation 1 agrees
4. GKD-C Confirmation 2 agrees
5. GKD-B Baseline agrees
PullBack Entry
1. GKD-B Baseline signal
2. GKD-C Confirmation 1 agrees
3. Price is beyond 1.0x Volatility of Baseline
Next Candle:
1. Price is within a range of 0.2x Volatility and 1.0x Volatility of the Goldie Locks Mean
2. GKD-C Confirmation 1 agrees
3. GKD-C Confirmation 2 agrees
4. GKD-V Volatility/Volume Agrees

GKD-BT Solo Confirmation Complex Backtest [Loxx]Giga Kaleidoscope GKD-BT Solo Confirmation Complex Backtest is a Backtesting module included in Loxx's "Giga Kaleidoscope Modularized Trading System".
█ GKD-BT Solo Confirmation Complex Backtest
The Solo Confirmation Complex Backtest module enables users to perform backtesting on Standard Long and Short signals from GKD-C confirmation indicators, filtered by GKD-B Baseline and GKD-V Volatility/Volume indicators. This module represents a complex form of the Solo Confirmation Backtest in the GKD trading system. It includes two types of backtests: Trading and Full. The Trading backtest allows users to test individual trades, both Long and Short, one at a time. On the other hand, the Full backtest allows users to test either Longs or Shorts by toggling between them in the settings to view the results for each signal type. The Trading backtest simulates real trading, while the Full backtest tests all signals, whether Long or Short.
Additionally, this backtest module provides the option to test the GKD-C Confirmation indicator with 1 to 3 take profits and 1 stop loss. The Trading backtest allows for the use of 1 to 3 take profits, while the Full backtest is limited to 1 take profit. The Trading backtest also offers the capability to apply a trailing take profit.
In terms of the percentage of trade removed at each take profit, this backtest module has the following hardcoded values:
Take profit 1: 50% of the trade is removed.
Take profit 2: 25% of the trade is removed.
Take profit 3: 25% of the trade is removed.
Stop loss: 100% of the trade is removed.
After each take profit is achieved, the stop loss level is adjusted. When take profit 1 is reached, the stop loss is moved to the entry point. Similarly, when take profit 2 is reached, the stop loss is shifted to take profit 1. The trailing take profit feature comes into play after take profit 2 or take profit 3, depending on the number of take profits selected in the settings. The trailing take profit is always activated on the final take profit when 2 or more take profits are chosen.
The backtest module also offers the capability to restrict by a specific date range, allowing for simulated forward testing based on past data. Additionally, users have the option to display or hide a trading panel that provides relevant information about the backtest, statistics, and the current trade. It is also possible to activate alerts and toggle sections of the trading panel on or off. On the chart, historical take profit and stop loss levels are represented by horizontal lines overlaid for reference.
The GKD system utilizes volatility-based take profits and stop losses. Each take profit and stop loss is calculated as a multiple of volatility. Users can also adjust the multiplier values in the settings.
To utilize this strategy, follow these steps:
1. GKD-B Baseline Import: Import the value "Input into NEW GKD-BT Backtest" from the GKD-B Baseline module into the GKD-BT Solo Confirmation Complex Backtest module setting named "Import GKD-B Baseline indicator."
Adjust the "Confirmation Type" in the GKD-C Confirmation Indicator to "GKD New."
2. GKD-C Confirmation Import: Import the value "Input into NEW GKD-BT Backtest" from the GKD-C Confirmation module into the GKD-BT Solo Confirmation Complex Backtest module setting named "Import GKD-C Confirmation indicator."
3. GKD-V Volatility/Volume Import: Import the value "Input into NEW GKD-BT Backtest" from the GKD-V Volatility/Volume module into the GKD-BT Solo Confirmation Complex Backtest module setting named "Import GKD-V Volatility/Volume indicator."
4. The Solo Confirmation Complex Backtest module exclusively supports Standard Entries, both Long and Short. However, please note that this module uses a modified version of the Standard Entry. In this modified version, long and short signals are directly imported from the Confirmation indicator, and then baseline and volatility filtering is applied.
The GKD-B Baseline filter ensures that only trades aligning with the GKD-B Baseline's current trend are accepted. This filter takes into consideration the Goldie Locks Zone, which allows trades where the closing price of the last candle has moved within a minimum XX volatility and a maximum YY volatility range. The GKD-V Volatility/Volume filter allows only trades that meet a minimum threshold of ZZ GKD-V Volatility/Volume, which varies based on the specific GKD-V Volatility/Volume indicator used.
The Solo Confirmation Complex Backtest execution engine determines whether signals from the GKD-C Confirmation indicator are accepted or rejected based on two criteria:
1. The GKD-C Confirmation signal must be qualified by the direction of the GKD-B Baseline trend and the GKD-B Baseline's sweet-spot Goldie Locks Zone.
2. Sufficient Volatility/Volume, as indicated by the GKD-V Volatility/Volume indicator, must be present to execute a trade.
The purpose of the Solo Confirmation Complex Backtest is to test a GKD-C Confirmation indicator in the presence of macro trend and volatility/volume filtering.
Volatility Types Included
17 types of volatility are included in this indicator
Close-to-Close
Parkinson
Garman-Klass
Rogers-Satchell
Yang-Zhang
Garman-Klass-Yang-Zhang
Exponential Weighted Moving Average
Standard Deviation of Log Returns
Pseudo GARCH(2,2)
Average True Range
True Range Double
Standard Deviation
Adaptive Deviation
Median Absolute Deviation
Efficiency-Ratio Adaptive ATR
Mean Absolute Deviation
Static Percent
Close-to-Close
Close-to-Close volatility is a classic and widely used volatility measure, sometimes referred to as historical volatility.
Volatility is an indicator of the speed of a stock price change. A stock with high volatility is one where the price changes rapidly and with a larger amplitude. The more volatile a stock is, the riskier it is.
Close-to-close historical volatility is calculated using only a stock's closing prices. It is the simplest volatility estimator. However, in many cases, it is not precise enough. Stock prices could jump significantly during a trading session and return to the opening value at the end. That means that a considerable amount of price information is not taken into account by close-to-close volatility.
Despite its drawbacks, Close-to-Close volatility is still useful in cases where the instrument doesn't have intraday prices. For example, mutual funds calculate their net asset values daily or weekly, and thus their prices are not suitable for more sophisticated volatility estimators.
Parkinson
Parkinson volatility is a volatility measure that uses the stock’s high and low price of the day.
The main difference between regular volatility and Parkinson volatility is that the latter uses high and low prices for a day, rather than only the closing price. This is useful as close-to-close prices could show little difference while large price movements could have occurred during the day. Thus, Parkinson's volatility is considered more precise and requires less data for calculation than close-to-close volatility.
One drawback of this estimator is that it doesn't take into account price movements after the market closes. Hence, it systematically undervalues volatility. This drawback is addressed in the Garman-Klass volatility estimator.
Garman-Klass
Garman-Klass is a volatility estimator that incorporates open, low, high, and close prices of a security.
Garman-Klass volatility extends Parkinson's volatility by taking into account the opening and closing prices. As markets are most active during the opening and closing of a trading session, it makes volatility estimation more accurate.
Garman and Klass also assumed that the process of price change follows a continuous diffusion process (Geometric Brownian motion). However, this assumption has several drawbacks. The method is not robust for opening jumps in price and trend movements.
Despite its drawbacks, the Garman-Klass estimator is still more effective than the basic formula since it takes into account not only the price at the beginning and end of the time interval but also intraday price extremes.
Researchers Rogers and Satchell have proposed a more efficient method for assessing historical volatility that takes into account price trends. See Rogers-Satchell Volatility for more detail.
Rogers-Satchell
Rogers-Satchell is an estimator for measuring the volatility of securities with an average return not equal to zero.
Unlike Parkinson and Garman-Klass estimators, Rogers-Satchell incorporates a drift term (mean return not equal to zero). As a result, it provides better volatility estimation when the underlying is trending.
The main disadvantage of this method is that it does not take into account price movements between trading sessions. This leads to an underestimation of volatility since price jumps periodically occur in the market precisely at the moments between sessions.
A more comprehensive estimator that also considers the gaps between sessions was developed based on the Rogers-Satchel formula in the 2000s by Yang-Zhang. See Yang Zhang Volatility for more detail.
Yang-Zhang
Yang Zhang is a historical volatility estimator that handles both opening jumps and the drift and has a minimum estimation error.
Yang-Zhang volatility can be thought of as a combination of the overnight (close-to-open volatility) and a weighted average of the Rogers-Satchell volatility and the day’s open-to-close volatility. It is considered to be 14 times more efficient than the close-to-close estimator.
Garman-Klass-Yang-Zhang
Garman-Klass-Yang-Zhang (GKYZ) volatility estimator incorporates the returns of open, high, low, and closing prices in its calculation.
GKYZ volatility estimator takes into account overnight jumps but not the trend, i.e., it assumes that the underlying asset follows a Geometric Brownian Motion (GBM) process with zero drift. Therefore, the GKYZ volatility estimator tends to overestimate the volatility when the drift is different from zero. However, for a GBM process, this estimator is eight times more efficient than the close-to-close volatility estimator.
Exponential Weighted Moving Average
The Exponentially Weighted Moving Average (EWMA) is a quantitative or statistical measure used to model or describe a time series. The EWMA is widely used in finance, with the main applications being technical analysis and volatility modeling.
The moving average is designed such that older observations are given lower weights. The weights decrease exponentially as the data point gets older – hence the name exponentially weighted.
The only decision a user of the EWMA must make is the parameter lambda. The parameter decides how important the current observation is in the calculation of the EWMA. The higher the value of lambda, the more closely the EWMA tracks the original time series.
Standard Deviation of Log Returns
This is the simplest calculation of volatility. It's the standard deviation of ln(close/close(1)).
Pseudo GARCH(2,2)
This is calculated using a short- and long-run mean of variance multiplied by ?.
?avg(var;M) + (1 ? ?) avg(var;N) = 2?var/(M+1-(M-1)L) + 2(1-?)var/(M+1-(M-1)L)
Solving for ? can be done by minimizing the mean squared error of estimation; that is, regressing L^-1var - avg(var; N) against avg(var; M) - avg(var; N) and using the resulting beta estimate as ?.
Average True Range
The average true range (ATR) is a technical analysis indicator, introduced by market technician J. Welles Wilder Jr. in his book New Concepts in Technical Trading Systems, that measures market volatility by decomposing the entire range of an asset price for that period.
The true range indicator is taken as the greatest of the following: current high less the current low; the absolute value of the current high less the previous close; and the absolute value of the current low less the previous close. The ATR is then a moving average, generally using 14 days, of the true ranges.
True Range Double
A special case of ATR that attempts to correct for volatility skew.
Standard Deviation
Standard deviation is a statistic that measures the dispersion of a dataset relative to its mean and is calculated as the square root of the variance. The standard deviation is calculated as the square root of variance by determining each data point's deviation relative to the mean. If the data points are further from the mean, there is a higher deviation within the data set; thus, the more spread out the data, the higher the standard deviation.
Adaptive Deviation
By definition, the Standard Deviation (STD, also represented by the Greek letter sigma ? or the Latin letter s) is a measure that is used to quantify the amount of variation or dispersion of a set of data values. In technical analysis, we usually use it to measure the level of current volatility.
Standard Deviation is based on Simple Moving Average calculation for mean value. This version of standard deviation uses the properties of EMA to calculate what can be called a new type of deviation, and since it is based on EMA, we can call it EMA deviation. Additionally, Perry Kaufman's efficiency ratio is used to make it adaptive (since all EMA type calculations are nearly perfect for adapting).
The difference when compared to the standard is significant--not just because of EMA usage, but the efficiency ratio makes it a "bit more logical" in very volatile market conditions.
Median Absolute Deviation
The median absolute deviation is a measure of statistical dispersion. Moreover, the MAD is a robust statistic, being more resilient to outliers in a data set than the standard deviation. In the standard deviation, the distances from the mean are squared, so large deviations are weighted more heavily, and thus outliers can heavily influence it. In the MAD, the deviations of a small number of outliers are irrelevant.
Because the MAD is a more robust estimator of scale than the sample variance or standard deviation, it works better with distributions without a mean or variance, such as the Cauchy distribution.
Efficiency-Ratio Adaptive ATR
Average True Range (ATR) is a widely used indicator for many occasions in technical analysis. It is calculated as the RMA of the true range. This version adds a "twist": it uses Perry Kaufman's Efficiency Ratio to calculate adaptive true range.
Mean Absolute Deviation
The mean absolute deviation (MAD) is a measure of variability that indicates the average distance between observations and their mean. MAD uses the original units of the data, which simplifies interpretation. Larger values signify that the data points spread out further from the average. Conversely, lower values correspond to data points bunching closer to it. The mean absolute deviation is also known as the mean deviation and average absolute deviation.
This definition of the mean absolute deviation sounds similar to the standard deviation (SD). While both measure variability, they have different calculations. In recent years, some proponents of MAD have suggested that it replace the SD as the primary measure because it is a simpler concept that better fits real life.
Static Percent
Static Percent allows the user to insert their own constant percent that will then be used to create take profits and stoploss
█ Giga Kaleidoscope Modularized Trading System
Core components of an NNFX algorithmic trading strategy
The NNFX algorithm is built on the principles of trend, momentum, and volatility. There are six core components in the NNFX trading algorithm:
1. Volatility - price volatility; e.g., Average True Range, True Range Double, Close-to-Close, etc.
2. Baseline - a moving average to identify price trend
3. Confirmation 1 - a technical indicator used to identify trends
4. Confirmation 2 - a technical indicator used to identify trends
5. Continuation - a technical indicator used to identify trends
6. Volatility/Volume - a technical indicator used to identify volatility/volume breakouts/breakdown
7. Exit - a technical indicator used to determine when a trend is exhausted
What is Volatility in the NNFX trading system?
In the NNFX (No Nonsense Forex) trading system, ATR (Average True Range) is typically used to measure the volatility of an asset. It is used as a part of the system to help determine the appropriate stop loss and take profit levels for a trade. ATR is calculated by taking the average of the true range values over a specified period.
True range is calculated as the maximum of the following values:
-Current high minus the current low
-Absolute value of the current high minus the previous close
-Absolute value of the current low minus the previous close
ATR is a dynamic indicator that changes with changes in volatility. As volatility increases, the value of ATR increases, and as volatility decreases, the value of ATR decreases. By using ATR in NNFX system, traders can adjust their stop loss and take profit levels according to the volatility of the asset being traded. This helps to ensure that the trade is given enough room to move, while also minimizing potential losses.
Other types of volatility include True Range Double (TRD), Close-to-Close, and Garman-Klass
What is a Baseline indicator?
The baseline is essentially a moving average, and is used to determine the overall direction of the market.
The baseline in the NNFX system is used to filter out trades that are not in line with the long-term trend of the market. The baseline is plotted on the chart along with other indicators, such as the Moving Average (MA), the Relative Strength Index (RSI), and the Average True Range (ATR).
Trades are only taken when the price is in the same direction as the baseline. For example, if the baseline is sloping upwards, only long trades are taken, and if the baseline is sloping downwards, only short trades are taken. This approach helps to ensure that trades are in line with the overall trend of the market, and reduces the risk of entering trades that are likely to fail.
By using a baseline in the NNFX system, traders can have a clear reference point for determining the overall trend of the market, and can make more informed trading decisions. The baseline helps to filter out noise and false signals, and ensures that trades are taken in the direction of the long-term trend.
What is a Confirmation indicator?
Confirmation indicators are technical indicators that are used to confirm the signals generated by primary indicators. Primary indicators are the core indicators used in the NNFX system, such as the Average True Range (ATR), the Moving Average (MA), and the Relative Strength Index (RSI).
The purpose of the confirmation indicators is to reduce false signals and improve the accuracy of the trading system. They are designed to confirm the signals generated by the primary indicators by providing additional information about the strength and direction of the trend.
Some examples of confirmation indicators that may be used in the NNFX system include the Bollinger Bands, the MACD (Moving Average Convergence Divergence), and the MACD Oscillator. These indicators can provide information about the volatility, momentum, and trend strength of the market, and can be used to confirm the signals generated by the primary indicators.
In the NNFX system, confirmation indicators are used in combination with primary indicators and other filters to create a trading system that is robust and reliable. By using multiple indicators to confirm trading signals, the system aims to reduce the risk of false signals and improve the overall profitability of the trades.
What is a Continuation indicator?
In the NNFX (No Nonsense Forex) trading system, a continuation indicator is a technical indicator that is used to confirm a current trend and predict that the trend is likely to continue in the same direction. A continuation indicator is typically used in conjunction with other indicators in the system, such as a baseline indicator, to provide a comprehensive trading strategy.
What is a Volatility/Volume indicator?
Volume indicators, such as the On Balance Volume (OBV), the Chaikin Money Flow (CMF), or the Volume Price Trend (VPT), are used to measure the amount of buying and selling activity in a market. They are based on the trading volume of the market, and can provide information about the strength of the trend. In the NNFX system, volume indicators are used to confirm trading signals generated by the Moving Average and the Relative Strength Index. Volatility indicators include Average Direction Index, Waddah Attar, and Volatility Ratio. In the NNFX trading system, volatility is a proxy for volume and vice versa.
By using volume indicators as confirmation tools, the NNFX trading system aims to reduce the risk of false signals and improve the overall profitability of trades. These indicators can provide additional information about the market that is not captured by the primary indicators, and can help traders to make more informed trading decisions. In addition, volume indicators can be used to identify potential changes in market trends and to confirm the strength of price movements.
What is an Exit indicator?
The exit indicator is used in conjunction with other indicators in the system, such as the Moving Average (MA), the Relative Strength Index (RSI), and the Average True Range (ATR), to provide a comprehensive trading strategy.
The exit indicator in the NNFX system can be any technical indicator that is deemed effective at identifying optimal exit points. Examples of exit indicators that are commonly used include the Parabolic SAR, the Average Directional Index (ADX), and the Chandelier Exit.
The purpose of the exit indicator is to identify when a trend is likely to reverse or when the market conditions have changed, signaling the need to exit a trade. By using an exit indicator, traders can manage their risk and prevent significant losses.
In the NNFX system, the exit indicator is used in conjunction with a stop loss and a take profit order to maximize profits and minimize losses. The stop loss order is used to limit the amount of loss that can be incurred if the trade goes against the trader, while the take profit order is used to lock in profits when the trade is moving in the trader's favor.
Overall, the use of an exit indicator in the NNFX trading system is an important component of a comprehensive trading strategy. It allows traders to manage their risk effectively and improve the profitability of their trades by exiting at the right time.
How does Loxx's GKD (Giga Kaleidoscope Modularized Trading System) implement the NNFX algorithm outlined above?
Loxx's GKD v2.0 system has five types of modules (indicators/strategies). These modules are:
1. GKD-BT - Backtesting module (Volatility, Number 1 in the NNFX algorithm)
2. GKD-B - Baseline module (Baseline and Volatility/Volume, Numbers 1 and 2 in the NNFX algorithm)
3. GKD-C - Confirmation 1/2 and Continuation module (Confirmation 1/2 and Continuation, Numbers 3, 4, and 5 in the NNFX algorithm)
4. GKD-V - Volatility/Volume module (Confirmation 1/2, Number 6 in the NNFX algorithm)
5. GKD-E - Exit module (Exit, Number 7 in the NNFX algorithm)
(additional module types will added in future releases)
Each module interacts with every module by passing data to A backtest module wherein the various components of the GKD system are combined to create a trading signal.
That is, the Baseline indicator passes its data to Volatility/Volume. The Volatility/Volume indicator passes its values to the Confirmation 1 indicator. The Confirmation 1 indicator passes its values to the Confirmation 2 indicator. The Confirmation 2 indicator passes its values to the Continuation indicator. The Continuation indicator passes its values to the Exit indicator, and finally, the Exit indicator passes its values to the Backtest strategy.
This chaining of indicators requires that each module conform to Loxx's GKD protocol, therefore allowing for the testing of every possible combination of technical indicators that make up the six components of the NNFX algorithm.
What does the application of the GKD trading system look like?
Example trading system:
Backtest: Solo Confirmation Complex Backtest as shown on the chart above
Baseline: Hull Moving Average as shown on the chart above
Volatility/Volume: Hurst Exponent as shown on the chart above
Confirmation 1: Fisher Trasnform as shown on the chart above
Confirmation 2: Williams Percent Range
Continuation: Volatility-Adaptive Rapid RSI T3
Exit: Rex Oscillator
Each GKD indicator is denoted with a module identifier of either: GKD-BT, GKD-B, GKD-C, GKD-V, or GKD-E. This allows traders to understand to which module each indicator belongs and where each indicator fits into the GKD system.
Giga Kaleidoscope Modularized Trading System Signals (based on the NNFX algorithm)
Standard Entry
1. GKD-C Confirmation 1 Signal
2. GKD-B Baseline agrees
3. Price is within a range of 0.2x Volatility and 1.0x Volatility of the Goldie Locks Mean
4. GKD-C Confirmation 2 agrees
5. GKD-V Volatility/Volume agrees
Baseline Entry
1. GKD-B Baseline signal
2. GKD-C Confirmation 1 agrees
3. Price is within a range of 0.2x Volatility and 1.0x Volatility of the Goldie Locks Mean
4. GKD-C Confirmation 2 agrees
5. GKD-V Volatility/Volume agrees
6. GKD-C Confirmation 1 signal was less than 7 candles prior
Volatility/Volume Entry
1. GKD-V Volatility/Volume signal
2. GKD-C Confirmation 1 agrees
3. Price is within a range of 0.2x Volatility and 1.0x Volatility of the Goldie Locks Mean
4. GKD-C Confirmation 2 agrees
5. GKD-B Baseline agrees
6. GKD-C Confirmation 1 signal was less than 7 candles prior
Continuation Entry
1. Standard Entry, Baseline Entry, or Pullback; entry triggered previously
2. GKD-B Baseline hasn't crossed since entry signal trigger
3. GKD-C Confirmation Continuation Indicator signals
4. GKD-C Confirmation 1 agrees
5. GKD-B Baseline agrees
6. GKD-C Confirmation 2 agrees
1-Candle Rule Standard Entry
1. GKD-C Confirmation 1 signal
2. GKD-B Baseline agrees
3. Price is within a range of 0.2x Volatility and 1.0x Volatility of the Goldie Locks Mean
Next Candle:
1. Price retraced (Long: close < close or Short: close > close )
2. GKD-B Baseline agrees
3. GKD-C Confirmation 1 agrees
4. GKD-C Confirmation 2 agrees
5. GKD-V Volatility/Volume agrees
1-Candle Rule Baseline Entry
1. GKD-B Baseline signal
2. GKD-C Confirmation 1 agrees
3. Price is within a range of 0.2x Volatility and 1.0x Volatility of the Goldie Locks Mean
4. GKD-C Confirmation 1 signal was less than 7 candles prior
Next Candle:
1. Price retraced (Long: close < close or Short: close > close )
2. GKD-B Baseline agrees
3. GKD-C Confirmation 1 agrees
4. GKD-C Confirmation 2 agrees
5. GKD-V Volatility/Volume Agrees
1-Candle Rule Volatility/Volume Entry
1. GKD-V Volatility/Volume signal
2. GKD-C Confirmation 1 agrees
3. Price is within a range of 0.2x Volatility and 1.0x Volatility of the Goldie Locks Mean
4. GKD-C Confirmation 1 signal was less than 7 candles prior
Next Candle:
1. Price retraced (Long: close < close or Short: close > close)
2. GKD-B Volatility/Volume agrees
3. GKD-C Confirmation 1 agrees
4. GKD-C Confirmation 2 agrees
5. GKD-B Baseline agrees
PullBack Entry
1. GKD-B Baseline signal
2. GKD-C Confirmation 1 agrees
3. Price is beyond 1.0x Volatility of Baseline
Next Candle:
1. Price is within a range of 0.2x Volatility and 1.0x Volatility of the Goldie Locks Mean
2. GKD-C Confirmation 1 agrees
3. GKD-C Confirmation 2 agrees
4. GKD-V Volatility/Volume Agrees

GKD-BT Solo Confirmation Simple Backtest [Loxx]Giga Kaleidoscope GKD-BT Solo Confirmation Simple Backtest is a Backtesting module included in Loxx's "Giga Kaleidoscope Modularized Trading System".
█ GKD-BT Solo Confirmation Simple Backtest
The Solo Confirmation Simple Backtest module enables users to perform Standard Long and Short signals on GKD-C confirmation indicators. This module represents the simplest form of Backtest in the GKD trading system. It includes two types of backtests: Trading and Full. The Trading backtest allows users to test individual trades, both long and short, one at a time. On the other hand, the Full backtest allows users to test either longs or shorts by toggling between them in the settings to view the results for each signal type. The Trading backtest simulates real trading, while the Full backtest tests all signals, whether long or short.
Additionally, this backtest module provides the option to test the GKD-C indicator with 1 to 3 take profits and 1 stop loss. The Trading backtest allows for the use of 1 to 3 take profits, while the Full backtest is limited to 1 take profit. The Trading backtest also offers the capability to apply a trailing take profit.
In terms of the percentage of trade removed at each take profit, this backtest module has the following hardcoded values:
Take profit 1: 50% of the trade is removed
Take profit 2: 25% of the trade is removed
Take profit 3: 25% of the trade is removed
Stop loss: 100% of the trade is removed
After each take profit is achieved, the stop loss level is adjusted. When take profit 1 is reached, the stop loss is moved to the entry point. Similarly, when take profit 2 is reached, the stop loss is shifted to take profit 1. The trailing take profit feature comes into play after take profit 2 or take profit 3, depending on the number of take profits selected in the settings. The trailing take profit is always activated on the final take profit when 2 or more take profits are chosen.
The backtest also offers the capability to restrict by a specific date range, allowing for simulated forward testing based on past data. Additionally, users have the option to display or hide a trading panel that provides relevant information about the backtest, statistics, and the current trade. It is also possible to activate alerts and toggle sections of the trading panel on or off. On the chart, historical take profit and stop loss levels are represented by horizontal lines overlaid for reference.
The GKD system utilizes volatility-based take profits and stop losses. Each take profit and stop loss is calculated as a multiple of volatility. You can change the values of the multipliers in the settings as well.
To utilize this strategy, follow these steps:
1. Adjust the "Confirmation Type" in the GKD-C Confirmation Indicator to "GKD New."
2. Import the value "Input into NEW GKD-BT Backtest" into the GKD-BT Solo Confirmation Simple Backtest module (this strategy backtest).
**The GKD-BT Solo Confirmation Simple Backtest module exclusively supports Standard Entries, both Long and Short. However, please note that this module uses a modified version of the standard entry, where long and short signals are directly imported from the Confirmation indicator without any baseline or volatility filtering applied.**
Volatility Types Included
17 types of volatility are included in this indicator
Close-to-Close
Parkinson
Garman-Klass
Rogers-Satchell
Yang-Zhang
Garman-Klass-Yang-Zhang
Exponential Weighted Moving Average
Standard Deviation of Log Returns
Pseudo GARCH(2,2)
Average True Range
True Range Double
Standard Deviation
Adaptive Deviation
Median Absolute Deviation
Efficiency-Ratio Adaptive ATR
Mean Absolute Deviation
Static Percent
Close-to-Close
Close-to-Close volatility is a classic and widely used volatility measure, sometimes referred to as historical volatility.
Volatility is an indicator of the speed of a stock price change. A stock with high volatility is one where the price changes rapidly and with a larger amplitude. The more volatile a stock is, the riskier it is.
Close-to-close historical volatility is calculated using only a stock's closing prices. It is the simplest volatility estimator. However, in many cases, it is not precise enough. Stock prices could jump significantly during a trading session and return to the opening value at the end. That means that a considerable amount of price information is not taken into account by close-to-close volatility.
Despite its drawbacks, Close-to-Close volatility is still useful in cases where the instrument doesn't have intraday prices. For example, mutual funds calculate their net asset values daily or weekly, and thus their prices are not suitable for more sophisticated volatility estimators.
Parkinson
Parkinson volatility is a volatility measure that uses the stock’s high and low price of the day.
The main difference between regular volatility and Parkinson volatility is that the latter uses high and low prices for a day, rather than only the closing price. This is useful as close-to-close prices could show little difference while large price movements could have occurred during the day. Thus, Parkinson's volatility is considered more precise and requires less data for calculation than close-to-close volatility.
One drawback of this estimator is that it doesn't take into account price movements after the market closes. Hence, it systematically undervalues volatility. This drawback is addressed in the Garman-Klass volatility estimator.
Garman-Klass
Garman-Klass is a volatility estimator that incorporates open, low, high, and close prices of a security.
Garman-Klass volatility extends Parkinson's volatility by taking into account the opening and closing prices. As markets are most active during the opening and closing of a trading session, it makes volatility estimation more accurate.
Garman and Klass also assumed that the process of price change follows a continuous diffusion process (Geometric Brownian motion). However, this assumption has several drawbacks. The method is not robust for opening jumps in price and trend movements.
Despite its drawbacks, the Garman-Klass estimator is still more effective than the basic formula since it takes into account not only the price at the beginning and end of the time interval but also intraday price extremes.
Researchers Rogers and Satchell have proposed a more efficient method for assessing historical volatility that takes into account price trends. See Rogers-Satchell Volatility for more detail.
Rogers-Satchell
Rogers-Satchell is an estimator for measuring the volatility of securities with an average return not equal to zero.
Unlike Parkinson and Garman-Klass estimators, Rogers-Satchell incorporates a drift term (mean return not equal to zero). As a result, it provides better volatility estimation when the underlying is trending.
The main disadvantage of this method is that it does not take into account price movements between trading sessions. This leads to an underestimation of volatility since price jumps periodically occur in the market precisely at the moments between sessions.
A more comprehensive estimator that also considers the gaps between sessions was developed based on the Rogers-Satchel formula in the 2000s by Yang-Zhang. See Yang Zhang Volatility for more detail.
Yang-Zhang
Yang Zhang is a historical volatility estimator that handles both opening jumps and the drift and has a minimum estimation error.
Yang-Zhang volatility can be thought of as a combination of the overnight (close-to-open volatility) and a weighted average of the Rogers-Satchell volatility and the day’s open-to-close volatility. It is considered to be 14 times more efficient than the close-to-close estimator.
Garman-Klass-Yang-Zhang
Garman-Klass-Yang-Zhang (GKYZ) volatility estimator incorporates the returns of open, high, low, and closing prices in its calculation.
GKYZ volatility estimator takes into account overnight jumps but not the trend, i.e., it assumes that the underlying asset follows a Geometric Brownian Motion (GBM) process with zero drift. Therefore, the GKYZ volatility estimator tends to overestimate the volatility when the drift is different from zero. However, for a GBM process, this estimator is eight times more efficient than the close-to-close volatility estimator.
Exponential Weighted Moving Average
The Exponentially Weighted Moving Average (EWMA) is a quantitative or statistical measure used to model or describe a time series. The EWMA is widely used in finance, with the main applications being technical analysis and volatility modeling.
The moving average is designed such that older observations are given lower weights. The weights decrease exponentially as the data point gets older – hence the name exponentially weighted.
The only decision a user of the EWMA must make is the parameter lambda. The parameter decides how important the current observation is in the calculation of the EWMA. The higher the value of lambda, the more closely the EWMA tracks the original time series.
Standard Deviation of Log Returns
This is the simplest calculation of volatility. It's the standard deviation of ln(close/close(1)).
Pseudo GARCH(2,2)
This is calculated using a short- and long-run mean of variance multiplied by ?.
?avg(var;M) + (1 ? ?) avg(var;N) = 2?var/(M+1-(M-1)L) + 2(1-?)var/(M+1-(M-1)L)
Solving for ? can be done by minimizing the mean squared error of estimation; that is, regressing L^-1var - avg(var; N) against avg(var; M) - avg(var; N) and using the resulting beta estimate as ?.
Average True Range
The average true range (ATR) is a technical analysis indicator, introduced by market technician J. Welles Wilder Jr. in his book New Concepts in Technical Trading Systems, that measures market volatility by decomposing the entire range of an asset price for that period.
The true range indicator is taken as the greatest of the following: current high less the current low; the absolute value of the current high less the previous close; and the absolute value of the current low less the previous close. The ATR is then a moving average, generally using 14 days, of the true ranges.
True Range Double
A special case of ATR that attempts to correct for volatility skew.
Standard Deviation
Standard deviation is a statistic that measures the dispersion of a dataset relative to its mean and is calculated as the square root of the variance. The standard deviation is calculated as the square root of variance by determining each data point's deviation relative to the mean. If the data points are further from the mean, there is a higher deviation within the data set; thus, the more spread out the data, the higher the standard deviation.
Adaptive Deviation
By definition, the Standard Deviation (STD, also represented by the Greek letter sigma ? or the Latin letter s) is a measure that is used to quantify the amount of variation or dispersion of a set of data values. In technical analysis, we usually use it to measure the level of current volatility.
Standard Deviation is based on Simple Moving Average calculation for mean value. This version of standard deviation uses the properties of EMA to calculate what can be called a new type of deviation, and since it is based on EMA, we can call it EMA deviation. Additionally, Perry Kaufman's efficiency ratio is used to make it adaptive (since all EMA type calculations are nearly perfect for adapting).
The difference when compared to the standard is significant--not just because of EMA usage, but the efficiency ratio makes it a "bit more logical" in very volatile market conditions.
Median Absolute Deviation
The median absolute deviation is a measure of statistical dispersion. Moreover, the MAD is a robust statistic, being more resilient to outliers in a data set than the standard deviation. In the standard deviation, the distances from the mean are squared, so large deviations are weighted more heavily, and thus outliers can heavily influence it. In the MAD, the deviations of a small number of outliers are irrelevant.
Because the MAD is a more robust estimator of scale than the sample variance or standard deviation, it works better with distributions without a mean or variance, such as the Cauchy distribution.
Efficiency-Ratio Adaptive ATR
Average True Range (ATR) is a widely used indicator for many occasions in technical analysis. It is calculated as the RMA of the true range. This version adds a "twist": it uses Perry Kaufman's Efficiency Ratio to calculate adaptive true range.
Mean Absolute Deviation
The mean absolute deviation (MAD) is a measure of variability that indicates the average distance between observations and their mean. MAD uses the original units of the data, which simplifies interpretation. Larger values signify that the data points spread out further from the average. Conversely, lower values correspond to data points bunching closer to it. The mean absolute deviation is also known as the mean deviation and average absolute deviation.
This definition of the mean absolute deviation sounds similar to the standard deviation (SD). While both measure variability, they have different calculations. In recent years, some proponents of MAD have suggested that it replace the SD as the primary measure because it is a simpler concept that better fits real life.
Static Percent
Static Percent allows the user to insert their own constant percent that will then be used to create take profits and stoploss
█ Giga Kaleidoscope Modularized Trading System
Core components of an NNFX algorithmic trading strategy
The NNFX algorithm is built on the principles of trend, momentum, and volatility. There are six core components in the NNFX trading algorithm:
1. Volatility - price volatility; e.g., Average True Range, True Range Double, Close-to-Close, etc.
2. Baseline - a moving average to identify price trend
3. Confirmation 1 - a technical indicator used to identify trends
4. Confirmation 2 - a technical indicator used to identify trends
5. Continuation - a technical indicator used to identify trends
6. Volatility/Volume - a technical indicator used to identify volatility/volume breakouts/breakdown
7. Exit - a technical indicator used to determine when a trend is exhausted
What is Volatility in the NNFX trading system?
In the NNFX (No Nonsense Forex) trading system, ATR (Average True Range) is typically used to measure the volatility of an asset. It is used as a part of the system to help determine the appropriate stop loss and take profit levels for a trade. ATR is calculated by taking the average of the true range values over a specified period.
True range is calculated as the maximum of the following values:
-Current high minus the current low
-Absolute value of the current high minus the previous close
-Absolute value of the current low minus the previous close
ATR is a dynamic indicator that changes with changes in volatility. As volatility increases, the value of ATR increases, and as volatility decreases, the value of ATR decreases. By using ATR in NNFX system, traders can adjust their stop loss and take profit levels according to the volatility of the asset being traded. This helps to ensure that the trade is given enough room to move, while also minimizing potential losses.
Other types of volatility include True Range Double (TRD), Close-to-Close, and Garman-Klass
What is a Baseline indicator?
The baseline is essentially a moving average, and is used to determine the overall direction of the market.
The baseline in the NNFX system is used to filter out trades that are not in line with the long-term trend of the market. The baseline is plotted on the chart along with other indicators, such as the Moving Average (MA), the Relative Strength Index (RSI), and the Average True Range (ATR).
Trades are only taken when the price is in the same direction as the baseline. For example, if the baseline is sloping upwards, only long trades are taken, and if the baseline is sloping downwards, only short trades are taken. This approach helps to ensure that trades are in line with the overall trend of the market, and reduces the risk of entering trades that are likely to fail.
By using a baseline in the NNFX system, traders can have a clear reference point for determining the overall trend of the market, and can make more informed trading decisions. The baseline helps to filter out noise and false signals, and ensures that trades are taken in the direction of the long-term trend.
What is a Confirmation indicator?
Confirmation indicators are technical indicators that are used to confirm the signals generated by primary indicators. Primary indicators are the core indicators used in the NNFX system, such as the Average True Range (ATR), the Moving Average (MA), and the Relative Strength Index (RSI).
The purpose of the confirmation indicators is to reduce false signals and improve the accuracy of the trading system. They are designed to confirm the signals generated by the primary indicators by providing additional information about the strength and direction of the trend.
Some examples of confirmation indicators that may be used in the NNFX system include the Bollinger Bands, the MACD (Moving Average Convergence Divergence), and the MACD Oscillator. These indicators can provide information about the volatility, momentum, and trend strength of the market, and can be used to confirm the signals generated by the primary indicators.
In the NNFX system, confirmation indicators are used in combination with primary indicators and other filters to create a trading system that is robust and reliable. By using multiple indicators to confirm trading signals, the system aims to reduce the risk of false signals and improve the overall profitability of the trades.
What is a Continuation indicator?
In the NNFX (No Nonsense Forex) trading system, a continuation indicator is a technical indicator that is used to confirm a current trend and predict that the trend is likely to continue in the same direction. A continuation indicator is typically used in conjunction with other indicators in the system, such as a baseline indicator, to provide a comprehensive trading strategy.
What is a Volatility/Volume indicator?
Volume indicators, such as the On Balance Volume (OBV), the Chaikin Money Flow (CMF), or the Volume Price Trend (VPT), are used to measure the amount of buying and selling activity in a market. They are based on the trading volume of the market, and can provide information about the strength of the trend. In the NNFX system, volume indicators are used to confirm trading signals generated by the Moving Average and the Relative Strength Index. Volatility indicators include Average Direction Index, Waddah Attar, and Volatility Ratio. In the NNFX trading system, volatility is a proxy for volume and vice versa.
By using volume indicators as confirmation tools, the NNFX trading system aims to reduce the risk of false signals and improve the overall profitability of trades. These indicators can provide additional information about the market that is not captured by the primary indicators, and can help traders to make more informed trading decisions. In addition, volume indicators can be used to identify potential changes in market trends and to confirm the strength of price movements.
What is an Exit indicator?
The exit indicator is used in conjunction with other indicators in the system, such as the Moving Average (MA), the Relative Strength Index (RSI), and the Average True Range (ATR), to provide a comprehensive trading strategy.
The exit indicator in the NNFX system can be any technical indicator that is deemed effective at identifying optimal exit points. Examples of exit indicators that are commonly used include the Parabolic SAR, the Average Directional Index (ADX), and the Chandelier Exit.
The purpose of the exit indicator is to identify when a trend is likely to reverse or when the market conditions have changed, signaling the need to exit a trade. By using an exit indicator, traders can manage their risk and prevent significant losses.
In the NNFX system, the exit indicator is used in conjunction with a stop loss and a take profit order to maximize profits and minimize losses. The stop loss order is used to limit the amount of loss that can be incurred if the trade goes against the trader, while the take profit order is used to lock in profits when the trade is moving in the trader's favor.
Overall, the use of an exit indicator in the NNFX trading system is an important component of a comprehensive trading strategy. It allows traders to manage their risk effectively and improve the profitability of their trades by exiting at the right time.
How does Loxx's GKD (Giga Kaleidoscope Modularized Trading System) implement the NNFX algorithm outlined above?
Loxx's GKD v2.0 system has five types of modules (indicators/strategies). These modules are:
1. GKD-BT - Backtesting module (Volatility, Number 1 in the NNFX algorithm)
2. GKD-B - Baseline module (Baseline and Volatility/Volume, Numbers 1 and 2 in the NNFX algorithm)
3. GKD-C - Confirmation 1/2 and Continuation module (Confirmation 1/2 and Continuation, Numbers 3, 4, and 5 in the NNFX algorithm)
4. GKD-V - Volatility/Volume module (Confirmation 1/2, Number 6 in the NNFX algorithm)
5. GKD-E - Exit module (Exit, Number 7 in the NNFX algorithm)
(additional module types will added in future releases)
Each module interacts with every module by passing data to A backtest module wherein the various components of the GKD system are combined to create a trading signal.
That is, the Baseline indicator passes its data to Volatility/Volume. The Volatility/Volume indicator passes its values to the Confirmation 1 indicator. The Confirmation 1 indicator passes its values to the Confirmation 2 indicator. The Confirmation 2 indicator passes its values to the Continuation indicator. The Continuation indicator passes its values to the Exit indicator, and finally, the Exit indicator passes its values to the Backtest strategy.
This chaining of indicators requires that each module conform to Loxx's GKD protocol, therefore allowing for the testing of every possible combination of technical indicators that make up the six components of the NNFX algorithm.
What does the application of the GKD trading system look like?
Example trading system:
Backtest: Solo Confirmation Simple Backtest as shown on the chart above
Baseline: Hull Moving Average
Volatility/Volume: Hurst Exponent
Confirmation 1: Fisher Trasnform as shown on the chart above
Confirmation 2: Williams Percent Range
Continuation: Volatility-Adaptive Rapid RSI T3
Exit: Rex Oscillator
Each GKD indicator is denoted with a module identifier of either: GKD-BT, GKD-B, GKD-C, GKD-V, or GKD-E. This allows traders to understand to which module each indicator belongs and where each indicator fits into the GKD system.
Giga Kaleidoscope Modularized Trading System Signals (based on the NNFX algorithm)
Standard Entry
1. GKD-C Confirmation 1 Signal
2. GKD-B Baseline agrees
3. Price is within a range of 0.2x Volatility and 1.0x Volatility of the Goldie Locks Mean
4. GKD-C Confirmation 2 agrees
5. GKD-V Volatility/Volume agrees
Baseline Entry
1. GKD-B Baseline signal
2. GKD-C Confirmation 1 agrees
3. Price is within a range of 0.2x Volatility and 1.0x Volatility of the Goldie Locks Mean
4. GKD-C Confirmation 2 agrees
5. GKD-V Volatility/Volume agrees
6. GKD-C Confirmation 1 signal was less than 7 candles prior
Volatility/Volume Entry
1. GKD-V Volatility/Volume signal
2. GKD-C Confirmation 1 agrees
3. Price is within a range of 0.2x Volatility and 1.0x Volatility of the Goldie Locks Mean
4. GKD-C Confirmation 2 agrees
5. GKD-B Baseline agrees
6. GKD-C Confirmation 1 signal was less than 7 candles prior
Continuation Entry
1. Standard Entry, Baseline Entry, or Pullback; entry triggered previously
2. GKD-B Baseline hasn't crossed since entry signal trigger
3. GKD-C Confirmation Continuation Indicator signals
4. GKD-C Confirmation 1 agrees
5. GKD-B Baseline agrees
6. GKD-C Confirmation 2 agrees
1-Candle Rule Standard Entry
1. GKD-C Confirmation 1 signal
2. GKD-B Baseline agrees
3. Price is within a range of 0.2x Volatility and 1.0x Volatility of the Goldie Locks Mean
Next Candle:
1. Price retraced (Long: close < close or Short: close > close )
2. GKD-B Baseline agrees
3. GKD-C Confirmation 1 agrees
4. GKD-C Confirmation 2 agrees
5. GKD-V Volatility/Volume agrees
1-Candle Rule Baseline Entry
1. GKD-B Baseline signal
2. GKD-C Confirmation 1 agrees
3. Price is within a range of 0.2x Volatility and 1.0x Volatility of the Goldie Locks Mean
4. GKD-C Confirmation 1 signal was less than 7 candles prior
Next Candle:
1. Price retraced (Long: close < close or Short: close > close )
2. GKD-B Baseline agrees
3. GKD-C Confirmation 1 agrees
4. GKD-C Confirmation 2 agrees
5. GKD-V Volatility/Volume Agrees
1-Candle Rule Volatility/Volume Entry
1. GKD-V Volatility/Volume signal
2. GKD-C Confirmation 1 agrees
3. Price is within a range of 0.2x Volatility and 1.0x Volatility of the Goldie Locks Mean
4. GKD-C Confirmation 1 signal was less than 7 candles prior
Next Candle:
1. Price retraced (Long: close < close or Short: close > close)
2. GKD-B Volatility/Volume agrees
3. GKD-C Confirmation 1 agrees
4. GKD-C Confirmation 2 agrees
5. GKD-B Baseline agrees
PullBack Entry
1. GKD-B Baseline signal
2. GKD-C Confirmation 1 agrees
3. Price is beyond 1.0x Volatility of Baseline
Next Candle:
1. Price is within a range of 0.2x Volatility and 1.0x Volatility of the Goldie Locks Mean
2. GKD-C Confirmation 1 agrees
3. GKD-C Confirmation 2 agrees
4. GKD-V Volatility/Volume Agrees

Self Optimizing Supertrend [Starbots]Self Optimizing Supertrend Strategy. (non-repainting)
Script constantly tests 15 Supertrend combinations for maximum profitability and trades based on the best performing combination.
You will notice that signal lines switch after a bar close sometimes, this is when the strategy optimizes to the better combination and change plots, strategy is dynamic.
---------------------------------------------------------------------------------------------------------
# Average True Range (ATR)
The Average True Range (ATR) is a tool used in technical analysis to measure volatility. Unlike many of today's popular indicators, the ATR is not used to indicate the direction of price. Rather, it is a metric used solely to measure volatility, especially volatility caused by price gaps or limit moves.
# Supertrend
A Super Trend is a trend following indicator similar to moving averages. It is plotted on price and the current trend can simply be determined by its placement vis-a-vis price. It is a very simple indicator and is constructed with the help of just two parameters- period and multiplier.
When we construct the Supertrend indicator strategy, the default parameters are 10 for Average True Range (ATR) and 3 for its multiplier. The average true range (ATR) plays a key role in ‘Supertrend’ as the indicator uses ATR to compute its value and it signals the degree of price volatility.
-----------------------------------------------------------------------------------------------------------
-Turn on Supertrend Profit Dashboard and spot the worst/best performing combination. You can change them to get the best performance overall.
-Backtesting Range - backtest within your desired time window. Example: 'from 01 / 01 /2020 to 01 / 01 /2023'.
-Optimizing range - you can decrease the amount of bars/data for optimizing script. This way you can keep it up to date to more recent market by selecting optimizing range to optimize it just from the recent 3-6months of data for example. Strategy before this selected range will normally trade (backtest) based on the fifth buying condition (5. Supertrend Factor) parameter in your menu (1.6 by default) if you turn this on.
*I recommend 'Optimizing Range' turned off actually, use max amount of available bars in your history for optimization script.
- Strategy is trading on the bar close without repaint. You can trade Long-Sell or Long- Short. Alerts available, insert webhook messages.
- Turn on Profit Calendar for better overview of how your strategy performs monthly/annualy
- Recommended ATR Length : 10 (default), higher timeframes usually performs good on the shorter period lengths 6-10, smaller timeframes on the larger ATR period length 10-20.
- Recommended Sources : hl2 (default Supertrend), close, hlc3, hlcc4 (when scalping/day trading and market is uptrending good, you can use 'volume' as a source, comes in handy)
- Recommended Smoothing Moving Average for ATR : We smooth the ATR calculation with moving average, traders usually use SMA as a moving average here, but you can use alternatives like EMA, HMA. Try them if this improves your results.
- Recommended TF : 15min, 30min, 1h, 2h, 4h, 8h, 1d (low timeframes works good if you have no fees like Binance currently do on BTC for example otherwise you probably want to use 1/2h+ chart)
- Supertrend Factor parameters : pre-set Supertrend Factors are very good and common in trading world, you don't need to change them, but you can do it at free will. Traders usually use Supertrend factor of 2 or 3, use parameters around this numbers.
- Notes window : add your custom comments in or save your webhook message text inside here for later use.
- Trading Session: in a session, you have to specify the time range for every day. It will trade only within this window and close trades when it's out. Session from 9am to 5pm will look like that: 0900-1700 or 7am to 4:30pm 0700-1630. After the colon, you can specify days of the week for your trading session. 1234567 trading all days, 23456 – Monday to Friday ('1 is Sunday here'). 0000-0000:1234567 by default will trade every day nonstop. 00.00am to 00.00pm and 1234567 every day of the week for example - Cryptocurrencies.
This script is simple to use for any trader as it saves a lot of time for searching good parameters on your own. It's self-optimizing and adjusting to the markets on the go.

Self Optimizing MACD [Starbots]Self Optimizing MACD Strategy. (non-repainting)
Script constantly tests 15 MACD combinations for maximum profitability and trades based on the best performing combination.
You will notice that signal lines switch sometimes, this is when the strategy optimizes to the better combination and change plots, strategy is dynamic.
There are a lot of black - shadow lines, this are the signals that are not currently active, but script keeps checking and valuating every one of them on every bar close. I recommend using dark mode chart for better view.
MACD /Signal lines in Blue/ Orange are the best performing combination and active at the moment.
*Histogram bars are always displayed based on the default MACD setting (12,26,9) - to keep the script running fast and smoothly. It's not changing plots unlike MACD /Signal lines.
-Turn on MACD Profit Dashboard and spot the worst performing combination to change it and get the better performance overall.
-Backtesting Range - backtest within your desired time window. Example: 'from 01/01/2020 to 01/01/2023'
-Optimizing range - you can decrease the amount of bars/data for optimizing script. This way you can keep it up to date to more recent market by selecting optimizing range to optimize it just from the recent 3-6months of data for example. Strategy before this selected range will normally trade (backtest) based on the first MACD parameters in your menu (12,26,9 by default) if you turn this on.
*I recommend 'Optimizing Range' turned off actually, use max amount of available bars in your history for optimization
- Strategy is trading on the bar close without repaint. You can trade Long-Sell or Long- Short. Alerts available.
- Turn on Profit Calendar for better overview of how your strategy performs monthly/annualy
- Recommended Sources : close, hl2 , hlc3, hlcc4 (when scalping/day trading and market is uptrending good, you can use 'volume' as a source, comes in handy)
- Recommended TF : 30s, 3min, 5min, 10min, 1h, 2h, 4h, 8h, 1d (low timeframes works good if you have no fees like Binance currently do on BTC for example otherwise you probably want to use 1h+ chart)
- MACD parameters : pre-set MACD combinations are very good and common in trading world, you don't need to change them, but you can do it at free will
- Notes window : add your custom comments in or save your webhook message text inside here for later use.
- Trading Session: in a session, you have to specify the time range for every day. It will trade only within this window and close trades when it's out. Session from 9am to 5pm will look like that: 0900-1700 or 7am to 4:30pm 0700-1630. After the colon, you can specify days of the week for your trading session. 1234567 trading all days, 23456 – Monday to Friday ('1 is Sunday here'). 0000-0000:1234567 by default will trade every day nonstop. 00.00am to 00.00pm and 1234567 every day of the week for example - Cryptocurrencies.
This script is simple to use for any trader as it saves a lot of time for searching good parameters on your own. It's also self-optimizing and adjusting to the markets on the go.

Bollinger Pair TradeNYSE:MA-1.6*NYSE:V
Revision: 1
Author: @ozdemirtrading
Revision 2 Considerations :
- Simplify and clean up plotting
Disclaimer: This strategy is currently working on the 5M chart. Change the length input to accommodate your needs.
For the backtesting of more than 3 months, you may need to upgrade your membership.
Description:
The general idea of the strategy is very straightforward: it takes positions according to the lower and upper Bollinger bands.
But I am mainly using this strategy for pair trading stocks. Do not forget that you will get better results if you trade with cointegrated pairs.
Bollinger band: Moving average & standard deviation are calculated based on 20 bars on the 1H chart (approx 240 bars on a 5m chart). X-day moving averages (20 days as default) are also used in the background in some of the exit strategy choices.
You can define position entry levels as the multipliers of standard deviation (for exp: mult2 as 2 * standard deviation).
There are 4 choices for the exit strategy:
SMA: Exit when touches simple moving average (SMA)
SKP: Skip SMA and do not stop if moving towards 20D SMA, and exit if it touches the other side of the band
SKPXDSMA: Skip SMA if moving towards 20D SMA, and exit if it touches 20D SMA
NoExit: Exit if it touches the upper & lower band only.
Options:
- Strategy hard stop: if trade loss reaches a point defined as a percent of the initial capital. Stop taking new positions. (not recommended for pair trade)
- Loss per trade: close position if the loss is at a defined level but keeps watching for new positions.
- Enable expected profit for trade (expected profit is calculated as the distance to SMA) (recommended for pair trade)
- Enable VIX threshold for the following options: (recommended for volatile periods)
- Stop trading if VIX for the previous day closes above the threshold
- Reverse active trade direction if VIX for the previous day is above the threshold
- Take reverse positions (assuming the Bollinger band is going to expand) for all trades
Backtesting:
Close positions after a defined interval: mark this if you want the close the final trade for backtesting purposes. Unmark it to get live signals.
Use custom interval: Backtest specific time periods.
Other Options:
- Use EMA: use an exponential moving average for the calculations instead of simple moving average
- Not against XDSMA: do not take a position against 20D SMA (if X is selected as 20) (recommended for pairs with a clear trend)
- Not in XDSMA 1 DEV: do not take a position in 20D SMA 1*standart deviation band (recommended if you need to decrease # of trades and increase profit for trade)
- Not in XDSMA 2 DEV: do not take a position in 20D SMA 2*standart deviation band
Session management:
- Not in session: Session start and end times can be defined here. If you do not want to trade in certain time intervals, mark that session.(helps to reduce slippage and get more realistic backtest results)

PowerBot Binary Backtest FrameworkHello Traders,
This is the backtest framework for testing the Powerbot algorithm before activating alerts which can be used for precise Trading.
Powerbot can be used across any timeframe and across any expiration based on the performance
This backtest comes with some features to help traders make a decision on the following:
When using the indicator itself.
1. We use our proprietary algorithm - "Powerbot binary algorithm script", which is Public but can only be accessed based on request. If you would like to use the algorithm please ensure you have tested different assets and varying expiration for your trades through the backtest - if you don't know how to do that please contact us by sending a message.
EXPLORE YOUR OPTIONS FOR TRADING THROUGH VARIED ITERATION.
2. You can choose any expiration time by changing the expiration time period from the 'settings' button, this will display new results. example; on a 5 minutes chart timeframe, 6 bars would be 30 minutes, which means 5 minutes times 6, which is 30 and minutes because your timeframe is set to minutes. Another example is that on a 1-hour timeframe, 12 bars would be 12 hours, given 1 * 12 is 12hours, because your timeframe is set to hours.
3. You can choose the trading session you want, please note that we have included the three most active sessions - ASIAN, EU/UK, & US Session, by default, the scripts checks for performance on 24/7, which means it does not omit trades outside of the trading session. The Tradingview time is in UTC (or GMT -4). The best times to trade are during sessions most active times.
This backtesting indicator is free to add to the chart if you would like to use the algorithm during your trading session you need to contact us. After which you can use the algorithm for as long as you want.
Please note that no signal can work in all timeframe across all markets that is why backtesting to search for algorithms with at least 50% performance ratio is excellent for trading. All you need is to diversify alerts across to assets or more to rake in profits.
If you require assistance in understanding what session would work best, you can send us a message to work through the process together.
Thank you for you support. This script is free to use to see potential of the indicator itself.
We are NOT allowed to advertise any script on sale based on tradingview house rules.
Wishing you all the best.

AliceTears GridAliceTears Grid is a customizable Mean Reversion system designed to capitalize on market volatility during specific trading sessions. Unlike standard grid bots that place blind limit orders, this strategy establishes a daily or session-based "Baseline" and looks for price over-extensions to fade the move back to the mean.
This strategy is best suited for ranging markets (sideways accumulation) or specific forex sessions (e.g., Asian Session or NY/London overlap) where price tends to revert to the opening price.
🛠 How It Works
1. The Baseline & Grid Generation At the start of every session (or the daily open), the script records the Open price. It then projects visual grid lines above and below this price based on your Step % input.
Example: If the Open is $100 and Step is 1%, lines are drawn at $101, $102, $99, $98, etc.
2. Entry Logic: Reversal Mode This script features a "Reversal Mode" (enabled by default) to filter out "falling knives."
Standard Grid: Buys immediately when price touches the line.
AliceTears Logic: Waits for the price to breach a grid level and then close back inside towards the mean. This confirms a potential rejection of that level before entering.
3. Exit Logic
Target Profit: The primary target is the previous grid level (Mean Reversion).
Trailing Stop: If the price continues moving in your favor, a trailing stop activates to maximize the run.
Stop Loss: A manual percentage-based stop loss is available to prevent deep drawdowns in trending markets.
⚙️ Key Features
Visual Grid: Automatically draws entry levels on the chart for the current session, helping you visualize where the "math" is waiting for price.
Timezone & Session Control: Includes a custom Timezone Offset tool. You can trade specific hours (e.g., 09:30–16:00) regardless of your chart's UTC setting.
Grid Management: Independent logic for Long and Short grids with pyramiding capabilities.
Safety Filters: Options to force-close trades at the end of the session to avoid overnight gaps.
⚠️ Risk Warning
Please Read Before Using: This is a Counter-Trend / Grid Strategy.
Pros: High win rate in sideways/ranging markets.
Cons: In strong trending markets (parabolic pumps or crashes), this strategy will add to losing positions ("catch a falling knife").
Recommendation: Always use the Stop Loss and Date Filter inputs. Do not run this on highly volatile assets without strict risk management parameters.
Settings Guide
Entry Reversal Mode: Keep checked for safer entries. Uncheck for aggressive limit-order style execution.
Grid Step (%): The distance between lines. For Forex, use lower values (0.1% - 0.5%). For Crypto, use higher values (1.0% - 3.0%).
UTC Offset: Adjust this to align the Session Hours with your target market (e.g., -5 for New York).
This script is open source. Feel free to use it for educational purposes or modify it to fit your trading style.

DayFlow VWAP Relay Forex Majors StrategySummary in one paragraph
DayFlow VWAP Relay is a day-trading strategy for major FX pairs on intraday timeframes, demonstrated on EURUSD 15 minutes. It waits for alignment between a daily anchored VWAP regime check, residual percentiles, and lower-timeframe micro flow before suggesting trades. The originality is the fusion of daily VWAP residual percentiles with a live micro-flow score from 1 minute data to switch between fade and breakout behavior inside the same session. Add it to a clean chart and use the markers and alerts.
Scope and intent
• Markets: Major FX pairs such as EURUSD, GBPUSD, USDJPY, AUDUSD, USDCHF, USDCAD
• Timeframes: One minute to one hour
• Default demo in this publication: EURUSD on 15 minutes
• Purpose: Reduce false starts by acting only when context, location and micro flow agree
• Limits: This is a strategy. Orders are simulated on standard candles only
Originality and usefulness
• Core novelty: Residual percentiles to daily anchored VWAP decide “balanced versus expanding day”. A separate 1 minute micro-flow score confirms direction, so the same model fades extremes in balance and rides range breaks in expansion
• Failure modes addressed: Chop fakeouts and unconfirmed breakouts are filtered by the expansion gate and micro-flow threshold
• Testability: Every input is exposed. Bands, background regime color, and markers show why a suggestion appears
• Portable yardstick: Stops and targets are ATR multiples converted to ticks, which transfer across symbols
• Open source status: No reused third-party code that requires attribution
Method overview in plain language
The day is anchored with a VWAP that updates from the daily session start. Price minus VWAP is the residual. Percentiles of that residual measured over a rolling window define location extremes for the current day. A regime score compares residual volatility to price volatility. When expansion is low, the day is treated as balanced and the model fades residual extremes if 1 minute micro flow points back to VWAP. When expansion is high, the model trades breakouts outside the VWAP bands if slope and micro flow agree with the move.
Base measures
• Range basis: True Range smoothed by ATR for stops and targets, length 14
• Return basis: Not required for signals; residuals are absolute price distance to VWAP
Components
• Daily Anchor VWAP Bands. VWAP with standard-deviation bands. Slope sign is used for trend confirmation on breakouts
• Residual Percentiles. Rolling percentiles of close minus VWAP over Signal length. Identify location extremes inside the day
• Expansion Ratio. Standard deviation of residuals divided by standard deviation of price over Signal length. Classifies balanced versus expanding day
• Micro Flow. Net up minus down closes from 1 minute data across a short span, normalized to −1..+1. Confirms direction and avoids fades against pressure
• Session Window optional. Restricts trading to your configured hours to avoid thin periods
• Cooldown optional. Bars to wait after a position closes to prevent immediate re-entry
Fusion rule
Gating rather than weighting. First choose regime by Expansion Ratio versus the Expansion gate. Inside each regime all listed conditions must be true: location test plus micro-flow threshold plus session window plus cooldown. Breakouts also require VWAP slope alignment.
Signal rule
• Long suggestion on balanced day: residual at or below the lower percentile and micro flow positive above the gate while inside session and cooldown is satisfied
• Short suggestion on balanced day: residual at or above the upper percentile and micro flow negative below the gate while inside session and cooldown is satisfied
• Long suggestion on expanding day: close above the upper VWAP band, VWAP slope positive, micro flow positive, session and cooldown satisfied
• Short suggestion on expanding day: close below the lower VWAP band, VWAP slope negative, micro flow negative, session and cooldown satisfied
• Positions flip on opposite suggestions or exit by brackets
What you will see on the chart
• Markers on suggestion bars: L for long, S for short
• Exit occurs on reverse signal or when a bracket order is filled
• Reference lines: daily anchored VWAP with upper and lower bands
• Optional background: teal for balanced day, orange for expanding day
Inputs with guidance
Setup
• Signal length. Residual and regime window. Typical 40 to 100. Higher smooths, lower reacts faster
Micro Flow
• Micro TF. Lower timeframe used for micro flow, default 1 minute
• Micro span bars. Count of lower-TF bars. Typical 5 to 20
• Micro flow gate 0..1. Minimum absolute flow. Raising it demands stronger confirmation and reduces trade count
VWAP Bands
• VWAP stdev multiplier. Band width. Typical 0.8 to 1.6. Wider bands reduce breakout frequency and increase fade distance
• Expansion gate 0..3. Threshold to switch from fades to breakouts. Raising it favors fades, lowering it favors breakouts
Sessions
• Use session filter. Enable to trade only inside your window
• Trade window UTC. Default 07:00 to 17:00
Risk
• ATR length. Stop and target basis. Typical 10 to 21
• Stop ATR x. Initial stop distance in ATR multiples
• Target ATR x. Profit target distance in ATR multiples
• Cooldown bars after close. Wait bars before a new entry
• Side. Both, long only, or short only
View
• Show VWAP and bands
• Color bars by residual regime
Properties visible in this publication
• Initial capital 10000
• Base currency Default
• request.security uses lookahead off everywhere
• Strategy: Percent of equity with value 3. Pyramiding 0. Commission cash per order 0.0001 USD. Slippage 3 ticks. Process orders on close ON. Bar magnifier ON. Recalculate after order is filled OFF. Calc on every tick OFF. Using standard OHLC fills ON.
Realism and responsible publication
No performance claims. Past results never guarantee future outcomes. Fills and slippage vary by venue. Shapes can move while a bar forms and settle on close. Strategies must run on standard candles for signals and orders.
Honest limitations and failure modes
High impact news, session opens, and thin liquidity can invalidate assumptions. Very quiet days can reduce contrast between residuals and price volatility. Session windows use the chart exchange time. If both stop and target are touched within a single bar, TradingView’s standard OHLC price-movement model decides the outcome.
Expect different behavior on illiquid pairs or during holidays. The model is sensitive to session definitions and feed time. Past results never guarantee future outcomes.
Legal
Education and research only. Not investment advice. You are responsible for your decisions. Test on historical data and in simulation before any live use. Use realistic costs.

Dollar Cost Averaging (DCA) | FractalystWhat's the purpose of this strategy?
The purpose of dollar cost averaging (DCA) is to grow investments over time using a disciplined, methodical approach used by many top institutions like MicroStrategy and other institutions.
Here's how it functions:
Dollar Cost Averaging (DCA): This technique involves investing a set amount of money regularly, regardless of market conditions. It helps to mitigate the risk of investing a large sum at a peak price by spreading out your investment, thus potentially lowering your average cost per share over time.
Regular Contributions: By adding money to your investments on a pre-determined frequency and dollar amount defined by the user, you take advantage of compounding. The script will remind you to contribute based on your chosen schedule, which can be weekly, bi-weekly, monthly, quarterly, or yearly. This systematic approach ensures that your returns can earn their own returns, much like interest on savings but potentially at a higher rate.
Technical Analysis: The strategy employs a market trend ratio to gauge market sentiment. It calculates the ratio of bullish vs bearish breakouts across various timeframes, assigning this ratio a percentage-based score to determine the directional bias. Once this score exceeds a user-selected percentage, the strategy looks to take buy entries, signaling a favorable time for investment based on current market trends.
Fundamental Analysis: This aspect looks at the health of the economy and companies within it to determine bullish market conditions. Specifically, we consider:
Specifically, it considers:
Interest Rate: High interest rates can affect borrowing costs, potentially slowing down economic growth or making stocks less attractive compared to fixed income.
Inflation Rate: Inflation erodes purchasing power, but moderate inflation can be a sign of a healthy economy. We look for investments that might benefit from or withstand inflation.
GDP Rate: GDP growth indicates the overall health of the economy; we aim to invest in sectors poised to grow with the economy.
Unemployment Rate: Lower unemployment typically signals consumer confidence and spending power, which can boost certain sectors.
By integrating these elements, the strategy aims to:
Reduce Investment Volatility: By spreading out your investments, you're less impacted by short-term market swings.
Enhance Growth Potential: Using both technical and fundamental filters helps in choosing investments that are more likely to appreciate over time.
Manage Risk: The strategy aims to balance the risk of market timing by investing consistently and choosing assets wisely based on both economic data and market conditions.
----
What are Regular Contributions in this strategy?
Regular Contributions involve adding money to your investments on a pre-determined frequency and dollar amount defined by the user. The script will remind you to contribute based on your chosen schedule, which can be weekly, bi-weekly, monthly, quarterly, or yearly. This systematic approach ensures that your returns can earn their own returns, much like interest on savings but potentially at a higher rate.
----
How do regular contributions enhance compounding and reduce timing risk?
Enhances Compounding: Regular contributions leverage the power of compounding, where returns on investments can generate their own returns, potentially leading to exponential growth over time.
Reduces Timing Risk: By investing regularly, the strategy minimizes the risk associated with trying to time the market, spreading out the investment cost over time and potentially reducing the impact of volatility.
Automated Reminders: The script reminds users to make contributions based on their chosen schedule, ensuring consistency and discipline in investment practices, which is crucial for long-term success.
----
How does the strategy integrate technical and fundamental analysis for investors?
A: The strategy combines technical and fundamental analysis in the following manner:
Technical Analysis: It uses a market trend ratio to determine the directional bias by calculating the ratio of bullish vs bearish breakouts. Once this ratio exceeds a user-selected percentage threshold, the strategy signals to take buy entries, optimizing the timing within the given timeframe(s).
Fundamental Analysis: This aspect assesses the broader economic environment to identify sectors or assets that are likely to benefit from current economic conditions. By understanding these fundamentals, the strategy ensures investments are made in assets with strong growth potential.
This integration allows the strategy to select investments that are both technically favorable for entry and fundamentally sound, providing a comprehensive approach to investment decisions in the crypto, stock, and commodities markets.
----
How does the strategy identify market structure? What are the underlying calculations?
Q: How does the strategy identify market structure?
A: The strategy identifies market structure by utilizing an efficient logic with for loops to pinpoint the first swing candle that features a pivot of 2. This marks the beginning of the break of structure, where the market's previous trend or pattern is considered invalidated or changed.
What are the underlying calculations for identifying market structure?
A: The underlying calculations involve:
Identifying Swing Points: The strategy looks for swing highs (marked with blue Xs) and swing lows (marked with red Xs). A swing high is identified when a candle's high is higher than the highs of the candles before and after it. Conversely, a swing low is when a candle's low is lower than the lows of the candles before and after it.
Break of Structure (BOS):
Bullish BOS: This occurs when the price breaks above the swing high level of the previous structure, indicating a potential shift to a bullish trend.
Bearish BOS: This happens when the price breaks below the swing low level of the previous structure, signaling a potential shift to a bearish trend.
Structural Liquidity and Invalidation:
Structural Liquidity: After a break of structure, liquidity levels are updated to the first swing high in a bullish BOS or the first swing low in a bearish BOS.
Structural Invalidation: If the price moves back to the level of the first swing low before the bullish BOS or the first swing high before the bearish BOS, it invalidates the break of structure, suggesting a potential reversal or continuation of the previous trend.
This method provides users with a technical approach to filter market regimes, offering an advantage by minimizing the risk of overfitting to historical data, which is often a concern with traditional indicators like moving averages.
By focusing on identifying pivotal swing points and the subsequent breaks of structure, the strategy maintains a balance between sensitivity to market changes and robustness against historical data anomalies, ensuring a more adaptable and potentially more reliable market analysis tool.
What entry criteria are used in this script?
The script uses two entry models for trading decisions: BreakOut and Fractal.
Underlying Calculations:
Breakout: The script records the most recent swing high by storing it in a variable. When the price closes above this recorded level, and all other predefined conditions are satisfied, the script triggers a breakout entry. This approach is considered conservative because it waits for the price to confirm a breakout above the previous high before entering a trade. As shown in the image, as soon as the price closes above the new candle (first tick), the long entry gets taken. The stop-loss is initially set and then moved to break-even once the price moves in favor of the trade.
Fractal: This method involves identifying a swing low with a period of 2, which means it looks for a low point where the price is lower than the two candles before and after it. Once this pattern is detected, the script executes the trade. This is an aggressive approach since it doesn't wait for further price confirmation. In the image, this is represented by the 'Fractal 2' label where the script identifies and acts on the swing low pattern.
----
How does the script calculate trend score? What are the underlying calculations?
Market Trend Ratio: The script calculates the ratio of bullish to bearish breakouts. This involves:
Counting Bullish Breakouts: A bullish breakout is counted when the price breaks above a recent swing high (as identified in the strategy's market structure analysis).
Counting Bearish Breakouts: A bearish breakout is counted when the price breaks below a recent swing low.
Percentage-Based Score: This ratio is then converted into a percentage-based score:
For example, if there are 10 bullish breakouts and 5 bearish breakouts in a given timeframe, the ratio would be 10:5 or 2:1. This could be translated into a score where 66.67% (10/(10+5) * 100) represents the bullish trend strength.
The score might be calculated as (Number of Bullish Breakouts / Total Breakouts) * 100.
User-Defined Threshold: The strategy uses this score to determine when to take buy entries. If the trend score exceeds a user-defined percentage threshold, it indicates a strong enough bullish trend to justify a buy entry. For instance, if the user sets the threshold at 60%, the script would look for a buy entry when the trend score is above this level.
Timeframe Consideration: The calculations are performed across the timeframes specified by the user, ensuring the trend score reflects the market's behavior over different periods, which could be daily, weekly, or any other relevant timeframe.
This method provides a quantitative measure of market trend strength, helping to make informed decisions based on the balance between bullish and bearish market movements.
What type of stop-loss identification method are used in this strategy?
This strategy employs two types of stop-loss methods: Initial Stop-loss and Trailing Stop-Loss.
Underlying Calculations:
Initial Stop-loss:
ATR Based: The strategy uses the Average True Range (ATR) to set an initial stop-loss, which helps in accounting for market volatility without predicting price direction.
Calculation:
- First, the True Range (TR) is calculated for each period, which is the greatest of:
- Current Period High - Current Period Low
- Absolute Value of Current Period High - Previous Period Close
- Absolute Value of Current Period Low - Previous Period Close
- The ATR is then the moving average of these TR values over a specified period, typically 14 periods by default. This ATR value can be used to set the stop-loss at a distance from the entry price that reflects the current market volatility.
Swing Low Based:
For this method, the stop-loss is set based on the most recent swing low identified in the market structure analysis. This approach uses the lowest point of the recent price action as a reference for setting the stop-loss.
Trailing Stop-Loss:
The strategy uses structural liquidity and structural invalidation levels across multiple timeframes to adjust the stop-loss once the trade is profitable. This method involves:
Detecting Structural Liquidity: After a break of structure, the liquidity levels are updated to the first swing high in a bullish scenario or the first swing low in a bearish scenario. These levels serve as potential areas where the price might find support or resistance, allowing the stop-loss to trail the price movement.
Detecting Structural Invalidation: If the price returns to the level of the first swing low before a bullish break of structure or the first swing high before a bearish break of structure, it suggests the trend might be reversing or invalidating, prompting the adjustment of the stop-loss to lock in profits or minimize losses.
By using these methods, the strategy dynamically adjusts the initial stop-loss based on market volatility, helping to protect against adverse price movements while allowing for enough room for trades to develop. The ATR-based stop-loss adapts to the current market conditions by considering the volatility, ensuring that the stop-loss is not too tight during volatile periods, which could lead to premature exits, nor too loose during calm markets, which might result in larger losses. Similarly, the swing low based stop-loss provides a logical exit point if the market structure changes unfavorably.
Each market behaves differently across various timeframes, and it is essential to test different parameters and optimizations to find out which trailing stop-loss method gives you the desired results and performance. This involves backtesting the strategy with different settings for the ATR period, the distance from the swing low, and how the trailing stop-loss reacts to structural liquidity and invalidation levels.
Through this process, you can tailor the strategy to perform optimally in different market environments, ensuring that the stop-loss mechanism supports the trade's longevity while safeguarding against significant drawdowns.
What type of break-even and take profit identification methods are used in this strategy? What are the underlying calculations?
For Break-Even:
Percentage (%) Based:
Moves the initial stop-loss to the entry price when the price reaches a certain percentage above the entry.
Calculation:
Break-even level = Entry Price * (1 + Percentage / 100)
Example:
If the entry price is $100 and the break-even percentage is 5%, the break-even level is $100 * 1.05 = $105.
Risk-to-Reward (RR) Based:
Moves the initial stop-loss to the entry price when the price reaches a certain RR ratio.
Calculation:
Break-even level = Entry Price + (Initial Risk * RR Ratio)
For TP
- You can choose to set a take profit level at which your position gets fully closed.
- Similar to break-even, you can select either a percentage (%) or risk-to-reward (RR) based take profit level, allowing you to set your TP1 level as a percentage amount above the entry price or based on RR.
What's the day filter Filter, what does it do?
The day filter allows users to customize the session time and choose the specific days they want to include in the strategy session. This helps traders tailor their strategies to particular trading sessions or days of the week when they believe the market conditions are more favorable for their trading style.
Customize Session Time:
Users can define the start and end times for the trading session.
This allows the strategy to only consider trades within the specified time window, focusing on periods of higher market activity or preferred trading hours.
Select Days:
Users can select which days of the week to include in the strategy.
This feature is useful for excluding days with historically lower volatility or unfavorable trading conditions (e.g., Mondays or Fridays).
Benefits:
Focus on Optimal Trading Periods:
By customizing session times and days, traders can focus on periods when the market is more likely to present profitable opportunities.
Avoid Unfavorable Conditions:
Excluding specific days or times can help avoid trading during periods of low liquidity or high unpredictability, such as major news events or holidays.
What tables are available in this script?
- Summary: Provides a general overview, displaying key performance parameters such as Net Profit, Profit Factor, Max Drawdown, Average Trade, Closed Trades and more.
Total Commission: Displays the cumulative commissions incurred from all trades executed within the selected backtesting window. This value is derived by summing the commission fees for each trade on your chart.
Average Commission: Represents the average commission per trade, calculated by dividing the Total Commission by the total number of closed trades. This metric is crucial for assessing the impact of trading costs on overall profitability.
Avg Trade: The sum of money gained or lost by the average trade generated by a strategy. Calculated by dividing the Net Profit by the overall number of closed trades. An important value since it must be large enough to cover the commission and slippage costs of trading the strategy and still bring a profit.
MaxDD: Displays the largest drawdown of losses, i.e., the maximum possible loss that the strategy could have incurred among all of the trades it has made. This value is calculated separately for every bar that the strategy spends with an open position.
Profit Factor: The amount of money a trading strategy made for every unit of money it lost (in the selected currency). This value is calculated by dividing gross profits by gross losses.
Avg RR: This is calculated by dividing the average winning trade by the average losing trade. This field is not a very meaningful value by itself because it does not take into account the ratio of the number of winning vs losing trades, and strategies can have different approaches to profitability. A strategy may trade at every possibility in order to capture many small profits, yet have an average losing trade greater than the average winning trade. The higher this value is, the better, but it should be considered together with the percentage of winning trades and the net profit.
Winrate: The percentage of winning trades generated by a strategy. Calculated by dividing the number of winning trades by the total number of closed trades generated by a strategy. Percent profitable is not a very reliable measure by itself. A strategy could have many small winning trades, making the percent profitable high with a small average winning trade, or a few big winning trades accounting for a low percent profitable and a big average winning trade. Most mean-reversion successful strategies have a percent profitability of 40-80% but are profitable due to risk management control.
BE Trades: Number of break-even trades, excluding commission/slippage.
Losing Trades: The total number of losing trades generated by the strategy.
Winning Trades: The total number of winning trades generated by the strategy.
Total Trades: Total number of taken traders visible your charts.
Net Profit: The overall profit or loss (in the selected currency) achieved by the trading strategy in the test period. The value is the sum of all values from the Profit column (on the List of Trades tab), taking into account the sign.
- Monthly: Displays performance data on a month-by-month basis, allowing users to analyze performance trends over each month and year.
- Weekly: Displays performance data on a week-by-week basis, helping users to understand weekly performance variations.
- UI Table: A user-friendly table that allows users to view and save the selected strategy parameters from user inputs. This table enables easy access to key settings and configurations, providing a straightforward solution for saving strategy parameters by simply taking a screenshot with Alt + S or ⌥ + S.
User-input styles and customizations:
Please note that all background colors in the style are disabled by default to enhance visualization.
How to Use This Strategy to Create a Profitable Edge and Systems?
Choose Your Strategy mode:
- Decide whether you are creating an investing strategy or a trading strategy.
Select a Market:
- Choose a one-sided market such as stocks, indices, or cryptocurrencies.
Historical Data:
- Ensure the historical data covers at least 10 years of price action for robust backtesting.
Timeframe Selection:
- Choose the timeframe you are comfortable trading with. It is strongly recommended to use a timeframe above 15 minutes to minimize the impact of commissions/slippage on your profits.
Set Commission and Slippage:
- Properly set the commission and slippage in the strategy properties according to your broker/prop firm specifications.
Parameter Optimization:
- Use trial and error to test different parameters until you find the performance results you are looking for in the summary table or, preferably, through deep backtesting using the strategy tester.
Trade Count:
- Ensure the number of trades is 200 or more; the higher, the better for statistical significance.
Positive Average Trade:
- Make sure the average trade is above zero.
(An important value since it must be large enough to cover the commission and slippage costs of trading the strategy and still bring a profit.)
Performance Metrics:
- Look for a high profit factor, and net profit with minimum drawdown.
- Ideally, aim for a drawdown under 20-30%, depending on your risk tolerance.
Refinement and Optimization:
- Try out different markets and timeframes.
- Continue working on refining your edge using the available filters and components to further optimize your strategy.
What makes this strategy original?
Incorporation of Fundamental Analysis:
This strategy integrates fundamental analysis by considering key economic indicators such as interest rates, inflation, GDP growth, and unemployment rates. These fundamentals help in assessing the broader economic health, which in turn influences sector performance and market trends. By understanding these economic conditions, the strategy can identify sectors or assets that are likely to thrive, ensuring investments are made in environments conducive to growth. This approach allows for a more informed investment decision, aligning technical entries with fundamentally strong market conditions, thus potentially enhancing the strategy's effectiveness over time.
Technical Analysis Without Classical Methods:
The strategy's technical analysis diverges from traditional methods like moving averages by focusing on market structure through a trend score system.
Instead of using lagging indicators, it employs a real-time analysis of market trends by calculating the ratio of bullish to bearish breakouts. This provides several benefits:
Immediate Market Sentiment: The trend score system reacts more dynamically to current market conditions, offering insights into the market's immediate sentiment rather than historical trends, which can often lag behind real-time changes.
Reduced Overfitting: By not relying on moving averages or similar classical indicators, the strategy avoids the common pitfall of overfitting to historical data, which can lead to poor performance in new market conditions. The trend score provides a fresh perspective on market direction, potentially leading to more robust trading signals.
Clear Entry Signals: With the trend score, entry decisions are based on a clear percentage threshold, making the strategy's decision-making process straightforward and less subjective than interpreting moving average crossovers or similar signals.
Regular Contributions and Reminders:
The strategy encourages regular investments through a system of predefined frequency and amount, which could be weekly, bi-weekly, monthly, quarterly, or yearly. This systematic approach:
Enhances Compounding: Regular contributions leverage the power of compounding, where returns on investments can generate their own returns, potentially leading to exponential growth over time.
Reduces Timing Risk: By investing regularly, the strategy minimizes the risk associated with trying to time the market, spreading out the investment cost over time and potentially reducing the impact of volatility.
Automated Reminders: The script reminds users to make contributions based on their chosen schedule, ensuring consistency and discipline in investment practices, which is crucial for long-term success.
Long-Term Wealth Building:
Focused on long-term wealth accumulation, this strategy:
Promotes Patience and Discipline: By emphasizing regular contributions and a disciplined approach to both entry and risk management, it aligns with the principles of long-term investing, discouraging impulsive decisions based on short-term market fluctuations.
Diversification Across Asset Classes: Operating across crypto, stocks, and commodities, the strategy provides diversification, which is a key component of long-term wealth building, reducing risk through varied exposure.
Growth Over Time: The strategy's design to work with the market's natural growth cycles, supported by fundamental analysis, aims for sustainable growth rather than quick profits, aligning with the goals of investors looking to build wealth over decades.
This comprehensive approach, combining fundamental insights, innovative technical analysis, disciplined investment habits, and a focus on long-term growth, offers a unique and potentially effective pathway for investors seeking to build wealth steadily over time.
Terms and Conditions | Disclaimer
Our charting tools are provided for informational and educational purposes only and should not be construed as financial, investment, or trading advice. They are not intended to forecast market movements or offer specific recommendations. Users should understand that past performance does not guarantee future results and should not base financial decisions solely on historical data.
Built-in components, features, and functionalities of our charting tools are the intellectual property of @Fractalyst Unauthorized use, reproduction, or distribution of these proprietary elements is prohibited.
- By continuing to use our charting tools, the user acknowledges and accepts the Terms and Conditions outlined in this legal disclaimer and agrees to respect our intellectual property rights and comply with all applicable laws and regulations.

Flux Charts - S&D Automation💎 GENERAL OVERVIEW
The MTF Supply & Demand Zones (S&D) Automation is a powerful and versatile tool designed to help traders rigorously test their trading strategies against historical market data. With various advanced settings, traders can fine-tune their strategies, assess performance, and identify key improvements before deploying in live trading environments. This tool offers a wide range of configurable settings, explained within this write-up.
Features of the new S&D Automation:
Step By Step : Configure your strategy step by step, which will allow you to have OR & AND logic in your strategies.
Highly Configurable : Offers multiple parameters for fine-tuning trade entry and exit conditions.
Multi-Timeframe Analysis : Allows traders to analyze multiple timeframes simultaneously for enhanced accuracy.
Provides advanced stop-loss, take-profit, and break-even settings.
Incorporates Supply & Demand Zone conditions, with settings like Sensitivity, Zone Invalidation, Minimum Zone Width & Minimum Zone Length settings for refined strategy execution.
🚩 UNIQUENESS
The S&D Automation stands out from conventional backtesting tools due to its unparalleled flexibility, precision, and advanced trading logic integration. Key factors that make it unique include:
✅ Comprehensive Strategy Customization – Unlike traditional backtesters that offer basic entry and exit conditions, S&D Automation provides a highly detailed parameter set, allowing traders to fine-tune their strategies with precision.
✅ Multi-Timeframe Supply & Demand Zones – This is the first-ever tool that allows traders to backtest Supply & Demand zones on multiple timeframes.
✅ Customizable Take-Profit Conditions – Offers various methods to set take-profit exits, including using core features from Supply & Demand Zones, and fixed exits like ATR, % change or price change, enabling traders to tailor their exit strategies to specific market behaviors.
✅ Customizable Stop-Loss Conditions – Provides several ways to set up stop losses, including using concepts from Supply & Demand Zones and trailing stops or fixed exits like ATR, % change or price change, allowing for dynamic risk management tailored to individual strategies.
✅ Integration of External Indicators – Allows the inclusion of other indicators or data sources from TradingView for creating strategy conditions, enabling traders to enhance their strategies with additional insights and data points.
By integrating these advanced features, S&D Automation ensures that traders can rigorously test and optimize their strategies with great accuracy and efficiency.
📌 HOW DOES IT WORK ?
The first setting you will want to set it the pyramiding setting. This setting controls the number of simultaneous trades in the same direction allowed in the strategy. For example, if you set it to 1, only one trade can be active in any time, and the second trade will not be entered unless the first one is exited. If it is set to 2, the script will handle both of them at the same time. Note that you should enter the same value to this pyramiding setting, and the pyramiding setting in the "Properties" tab of the script for this to work.
You can enable and set a backtesting window that will limit the entries to between the start date & end date.
Then, you can enter your desired settings for Supply & Demand Zones. You can also enable and set up to 3 timeframes, which you can use later on when customizing your strategies enter / exit conditions.
Entry Conditions
From the "Long Conditions" or the "Short Conditions" groups, you can set your position entry conditions. For settings like "initial capital" or "order size", you can open the "Properties" tab, where these are handled.
The S&D Automation can use the following conditions for entry conditions :
1. Demand Zone
Detection: Triggered when a Demand Zone forms or is detected
Retest: Triggered when price retests a Demand Zone. A retest is confirmed when a candle enters a Demand Zone and closes outside of it.
2nd Retest: Triggered when price retests a Demand Zone for the second time. A retest is confirmed when a candle enters a Demand Zone and closes outside of it.
3rd Retest: Triggered when price retests a Demand Zone for the third time. A retest is confirmed when a candle enters a Demand Zone and closes outside of it.
Retracement: Triggered when price touches a Demand Zone
Break: Triggered when a Demand Zone is invalidated by candle close or wick, depending on the user's input.
2. Supply Zone
Detection: Triggered when a Supply Zone forms or is detected
Retest: Triggered when price retests a Supply Zone. A retest is confirmed when a candle enters a Supply Zone and closes outside of it.
2nd Retest: Triggered when price retests a Supply Zone for the second time. A retest is confirmed when a candle enters a Supply Zone and closes outside of it.
3rd Retest: Triggered when price retests a Supply Zone for the third time. A retest is confirmed when a candle enters a Supply Zone and closes outside of it.
Retracement: Triggered when price touches a Supply Zone
Break: Triggered when a Supply Zone is invalidated by candle close or wick, depending on the user's input.
3. Any Zone
Detection: Triggered when any Supply or Demand Zone forms or is detected
Retest: Triggered when price retests any Supply or Demand Zone. A retest is confirmed when a candle enters any Supply or Demand Zone and closes outside of it.
2nd Retest: Triggered when price retests any Supply or Demand Zone for the second time. A retest is confirmed when a candle enters any Supply or Demand Zone and closes outside of it.
3rd Retest: Triggered when price retests any Supply or Demand Zone for the third time. A retest is confirmed when a candle enters any Supply or Demand Zone and closes outside of it.
Retracement: Triggered when price touches any Supply or Demand Zone
Break: Triggered when any Supply or Demand Zone is invalidated by candle close or wick, depending on the user's input.
🕒 TIMEFRAME CONDITIONS
The S&D Automation supports Multi-Timeframe (MTF) features, just like the Supply & Demand indicator. When setting an entry condition, you can also choose the timeframe.
To set up MTF conditions, navigate to the 'Timeframes' section in the settings, select your desired timeframes, and enable them. You can choose up to three timeframes.
Once you've selected your timeframes, you can use them in your strategy. When setting long and short entry/exit conditions, you can choose from Timeframe 1, Timeframe 2, or Timeframe 3.
External Conditions
Users can use external indicators on the chart to set entry conditions.
The second dropdown in the external condition settings allows you to choose a conditional operator to compare external outputs. Available options include:
Less Than or Equal To: <=
Less Than: <
Equal To: =
Greater Than: >
Greater Than or Equal To: >=
The position entry conditions work like this ;
Each side has 5 S&D Zone conditions and 1 Source condition. Each condition can be enabled or disabled using the checkbox on the left side of them.
The next selection is the alert type, which you can select between "Detection", "Retest", "Retracement" or "Break".
You can select which timeframe this condition should work on from Timeframe 1, 2, or 3. If you select "Any Timeframe", the condition will work for all timeframes.
Lastly select the step of this condition from 1 to 6.
The Source Condition
The last condition on each side is a source condition that is different from the others. Using this condition, you can create your own logic using other indicators' outputs on your chart. For example, suppose that you have an EMA indicator in your chart. You can have the source condition to something like "EMA > high".
The Step System
Each condition has a step number, and conditions are in topological order based on them.
The conditions are executed step by step. This means the condition with step 2 cannot be executed before the condition with step 1 is executed.
Conditions with the same step numbers have "OR" logic. This means that if you have 2 conditions with step 3, the condition with step 4 can trigger after only one of the step 3 conditions is executed.
➕ OTHER ENTRY FEATURES
The S&D Automation allows traders to choose when to execute trades and when not to execute trades.
1. Only Take Trades
This setting lets users specify the time period when their strategy can open or execute trades.
2. Don't Take Trades
This setting lets users specify time periods when their strategy can't open or execute trades.
↩️ EXIT CONDITIONS
1. Exit on Opposite Signal
When enabled, a long position will close when short entry conditions are met, and a short position will close when long entry conditions are met.
2. Exit on Session End
When enabled, positions will be closed at the end of the trading session.
📈 TAKE PROFIT CONDITIONS
There are several methods available for setting take profit exits and conditions.
1. Entry Condition TP
Users can use entry conditions as triggers for take-profit exits. This setting can be found under the long and short exit conditions.
2. Fixed TP
Users can set a fixed TP for exits. This setting can be found under the long and short exit conditions. Users can choose between the following:
Price: This method triggers a TP exit when price reaches a specified level. For example, if you set the Price TP to 10 and buy NASDAQ:TSLA at $190, the trade will automatically exit when the price reaches $200 ($190 + $10).
Ticks: This method triggers a TP exit when price moves a specified number of ticks.
Percentage (%): This method triggers a TP exit when price moves a specified percentage.
ATR: This method triggers a TP exit based on a specified multiple of the Average True Range (ATR).
📉 STOP LOSS CONDITIONS
There are several methods available for setting stop-loss exits and conditions.
1. Entry Condition SL
Users can use entry conditions as triggers for stop-loss exits. This setting can be found under the long and short exit conditions.
2. Fixed SL
Users can set a fixed SL for exits. This setting can be found under the long and short exit conditions. Users can choose between the following:
Price: This method triggers a SL exit when price reaches a specified level. For example, if you set the Price SL to 10 and buy NASDAQ:TSLA at $200, the trade will automatically exit when the price reaches $190 ($200 - $10).
Ticks: This method triggers a SL exit when price moves a specified number of ticks.
Percentage (%): This method triggers a SL exit when price moves a specified percentage.
ATR: This method triggers a SL exit based on a specified multiple of the Average True Range (ATR).
3. Trailing Stop
An explanation & example for the trailing stop feature is present on the write-up within the next section.
Exit conditions have the same logic of constructing conditions like the entry ones. You can construct a Take-Profit Condition & a Stop-Loss Condition. Note that the Take-Profit condition will only work if the position is in profit, regardless of if it's triggered or not. The same applies for the Stop-Loss condition, meaning that it will only work if the position is in loss.
You can also set a Fixed TP & Fixed SL based on the price movement after the position is entered. You have options like "Price", "Ticks", "%", or "Average True Range". For example, you can set a Fixed TP like "5%", and the position will be entered once it moves 5% up in a long position.
Trailing Stop
For the Fixed SL, you also have a "Trailing" stop option, for which you can set its activation level as well. The Trailing stop activation level and its value are expressed in ticks. Check this scenario for an example :
We have a ticker with a tick value of $1. Our Trailing Stop is set to 10 ticks, and the activation level is set to 30 ticks.
We buy 1 contract when the price is $100.
When the price becomes $110, we are in $10 (10 ticks) profit and the trailing stop is now activated.
The current price our stop's on is $110 - $30 (30 ticks), which is the level of $80.
The trailing stop will only move if the price moves up the highest high the price has been after we entered the position.
Let's suppose that price moves up $40 right after our trailing stop is activated. The price will now be $150, and our trailing stop will sit on $150 - $30 (30 ticks) = $120.
If the price is down the $120 level, our stop loss will be triggered.
There is also a "Hard SL" option designed for a backup stop-loss when trailing stops are enabled. You can enable & set this option and if the price goes down before our trailing stop even activates, the position will be exited.
You can also move stop-loss to the break-even (entry price of the position) after a certain profit is achieved using the last setting of the exit conditions. Note that for this to work, you must have a Fixed SL set-up.
➕ OTHER EXIT FEATURES
1. Move Stop Loss to Breakeven
This setting allows the strategy to automatically move the SL to Breakeven (BE) when the position is in profit by a certain amount. Users can choose between the following:
Price: This method moves the SL to BE when price reaches a specified level.
Ticks: This method moves the SL to BE when price moves a specified number of ticks.
Percentage (%): This method moves the SL to BE when price moves a specified percentage.
ATR: This method moves the SL to BE when price moves a specified multiple of the Average True Range (ATR).
Example Entry Scenario
To give an example , check this scenario; out conditions are :
LONG CONDITIONS
Demand Zone Detection, Step 1
Supply Zone Retest, Step 2
Demand Zone Break, Step 2
open > close, Step 3
First, the strategy needs to detect a Demand Zone Detection in order to start working.
After it's detected, now it's looking for either a Supply Zone Retest, or a Demand Zone Break to proceed to the next step, the reason for this is that they both have the same step number.
After one of them is detected, the strategy will consistently check candlesticks for the condition open > close. If a bullish candlestick occurs, a long position will be entered.
⏰ ALERTS
This indicator uses TradingView's strategy alert system. All entries and exits will be sent as an alert if configured. It's possible to further customize these alerts to your liking. For more information check TradingView's strategy alert customization page : www.tradingview.com
⚙️ SETTINGS
1. Backtesting Settings
Pyramiding: Controls the number of simultaneous trades allowed in the strategy. This setting must have the same value that is entered on the script's properties tab on the settings pane.
Enable Custom Backtesting Period: Restricts backtesting to a specific date range.
Start & End Time Configuration: Define precise start and end dates for historical analysis.
2. General Configuration
Detection Method: There are two detection methods you can choose from for identifying Supply & Demand Zones. Both methods aim to identify key areas where price is likely to react, but they do so using different approaches. Traders can choose the method that aligns with their trading style and time horizon.
Sensitivity: The Sensitivity setting allows traders to adjust how aggressively the script identifies supply and demand zones when using the Momentum Detection Method. This setting directly impacts the threshold for detecting zones when using the momentum detection method.
Zone Invalidation: The Zone Invalidation setting determines how supply and demand zones are invalidated.
Wick -> A zone is invalidated if a candle’s wick goes below a demand zone or above a supply zone.
Close -> A zone is invalidated if a candle closes below a demand zone or above a supply zone.
Zone Visibility Range: The Zone Visibility Range setting controls how far from the current price supply and demand zones are displayed on the chart. It helps traders focus on relevant zones while avoiding clutter from distant or less impactful areas.
Minimum Zone Width: The Minimum Zone Width setting defines the smallest size a supply or demand zone must have to be displayed on the chart. It uses the Average True Range (ATR) as a reference to ensure zones are proportionate to current market volatility.
Minimum Zone Length: The Minimum Zone Length setting determines the minimum number of bars a supply or demand zone must span to be displayed on the chart. This setting helps filter out short-lived or insignificant zones, ensuring only meaningful areas of supply or demand are highlighted.
3. Multi-Timeframe Analysis
Enable Up to Three Timeframes: Select and analyze trades across multiple timeframes.
4. Entry Conditions for Long & Short Trades
Multiple Conditions (1-6): Configure up to six independent conditions per trade direction.
Condition Types: Options include Detection, Retest, 2nd Retest, 3rd Retest, Retracement, and Break.
Timeframe Specification: Choose between "Any Timeframe", "Timeframe 1", "Timeframe 2", or "Timeframe 3".
Trade Execution Filters: Restrict trades within specific trading sessions.
5. Exit Conditions for Long & Short Trades
Exit on Opposite Signal: Automatically exit trades upon opposite trade conditions.
Exit on Session End: Closes all positions at the end of the trading session.
Multiple Take-Profit (TP) and Stop-Loss (SL) Configurations:
TP/SL based on % move, ATR, Ticks, or Fixed Price.
Hard SL option for additional risk control.
Move SL to BE (Break Even) after a certain profit threshold.

Flux Charts - PAT Automation💎 GENERAL OVERVIEW
The PAT Automation is a powerful and versatile tool designed to help traders rigorously test their trading strategies against historical market data. With an array of advanced settings, traders can fine-tune their strategies, assess performance, and identify key improvements before deploying in live trading environments. This backtester offers a wide range of configurable settings, explained within this write-up.
Features of the PAT Automation:
Step By Step : Configure your strategy step by step, which will allow you to have OR & AND logic in your strategies.
Highly Configurable : Offers multiple parameters for fine-tuning trade entry and exit conditions.
Multi-Timeframe Analysis : Allows traders to analyze multiple timeframes simultaneously for enhanced accuracy.
Provides advanced stop-loss, take-profit, and break-even settings.
Incorporates volume-based conditions, liquidity grabs , order blocks , market structures and fair value gaps for refined strategy execution.
🚩 UNIQUENESS
The PAT Automation stands out from conventional backtesting tools due to its unparalleled flexibility, precision, and advanced trading logic integration. Key factors that make it unique include:
✅ Comprehensive Strategy Customization – Unlike traditional backtesters that offer basic entry and exit conditions, PAT Automation provides a highly detailed parameter set, allowing traders to fine-tune their strategies with precision.
✅ Multi-Timeframe Price Action Features – This is the first-ever tool that allows traders to backtest price action with multi-timeframe features such as Fair Value Gaps (FVGs), Inversion Fair Value Gaps (IFVGs), Order Blocks & Breaker Blocks.
✅ Customizable Take-Profit Conditions – Offers various methods to set take-profit exits, including using core features from price action, and fixed exits like ATR, % change or price change, enabling traders to tailor their exit strategies to specific market behaviors.
✅ Customizable Stop-Loss Conditions – Provides several ways to set up stop losses, including using concepts from price action and trailing stops or fixed exits like ATR, % change or price change, allowing for dynamic risk management tailored to individual strategies.
✅ Integration of External Indicators – Allows the inclusion of other indicators or data sources from TradingView for creating strategy conditions, enabling traders to enhance their strategies with additional insights and data points.
By integrating these advanced features, PAT Automation ensures that traders can rigorously test and optimize their strategies with great accuracy and efficiency.
📌 HOW DOES IT WORK?
The first setting you will want to set it the pyramiding setting. This setting controls the number of simultaneous trades in the same direction allowed in the strategy. For example, if you set it to 1, only one trade can be active in any time, and the second trade will not be entered unless the first one is exited. If it is set to 2, the script will handle both of them at the same time. Note that you should enter the same value to this pyramiding setting, and the pyramiding setting in the "Properties" tab of the script for this to work.
For deep backtesting, you can set "Max Distance To Last Bar" to "Unlimited". If you encounter any memory issues, try decreasing this setting to a lower value.
You can enable and set a backtesting window that will limit the entries to between the start date & end date.
Then, you can enter your desired settings to Price Action features like FVGs, IFVGs, Order Blocks, Breaker Blocks, Liquidity Grabs, Market Structures, EQH & EQL and Volume Imbalances. You can also enable and set up to 3 timeframes, which you can use later on when customizing your strategies enter / exit conditions.
Entry Conditions
From the "Long Conditions" or the "Short Conditions" groups, you can set your position entry conditions. For settings like "initial capital" or "order size", you can open the "Properties" tab, where these are handled.
The PAT Automation can use the following conditions for entry conditions :
1. Order Block (OB)
Detection: Triggered when an Order Block forms or is detected
Retest: Triggered when price retests an Order Block. A retest is confirmed when a candle enters an Order Block and closes outside of it.
Retracement: Triggered when price touches an Order Block
Break: Triggered when an Order Block is invalidated by candle close or wick, depending on the user's input.
2. Breaker Block (BB)
Detection: Triggered when a Breaker Block forms or is detected
Retest: Triggered when price retests a Breaker Block. A retest is confirmed when a candle enters a Breaker Block and closes outside of it.
Retracement: Triggered when price touches a Breaker Block
Break: Triggered when a Breaker Block is invalidated by candle close or wick, depending on the user's input.
3. Fair Value Gap (FVG)
Detection: Triggered when an FVG forms or is detected
Retest: Triggered when price retests an FVG. A retest is confirmed when a candle enters an FVG and closes outside of it.
Retracement: Triggered when price touches an FVG
Break: Triggered when an FVG is invalidated by candle close or wick, depending on the user's input.
4. Inversion Fair Value Gap (IFVG)
Detection: Triggered when an IFVG forms or is detected
Retest: Triggered when price retests an IFVG. A retest is confirmed when a candle enters an IFVG and closes outside of it.
Retracement: Triggered when price touches an IFVG
Break: Triggered when an IFVG is invalidated by candle close or wick, depending on the user's input.
5. Break of Structure (BOS)
Detection: Triggered when a BOS forms or is detected
6. Change of Character (CHoCH)
Detection: Triggered when a CHoCH forms or is detected
7. Change of Character Plus (CHoCH+)
Detection: Triggered when a CHoCH+ forms or is detected
8. Volume Imbalance (VI)
Detection: Triggered when a Volume Imbalance forms or is detected
9. Equal High (EQH)
Detection: Triggered when an EQH is detected
10. Equal Low (EQL)
Detection: Triggered when an EQL is detected
11. Buyside Liquidity Grab
Detection: Triggered when a liquidity grab occurs at Buyside Liquidity (BSL).
12. Sellside Liquidity Grab
Detection: Triggered when a liquidity grab occurs at Sellside Liquidity (SSL).
🕒 TIMEFRAME CONDITIONS
The PAT Automation supports Multi-Timeframe (MTF) features, just like the Price Action Toolkit. When setting an entry condition, you can also choose the timeframe.
To set up MTF conditions, navigate to the 'Timeframes' section in the settings, select your desired timeframes, and enable them. You can choose up to three timeframes.
Once you've selected your timeframes, you can use them in your strategy. When setting long and short entry / exit conditions, you can choose from Timeframe 1, Timeframe 2, or Timeframe 3.
External Conditions
Users can use external indicators on the chart to set entry conditions.
The second dropdown in the external condition settings allows you to choose a conditional operator to compare external outputs. Available options include:
Less Than or Equal To: <=
Less Than: <
Equal To: =
Greater Than: >
Greater Than or Equal To: >=
The position entry conditions work like this ;
Each side has 5 Price Action conditions and 1 Source condition. Each condition can be enabled or disabled using the checkbox on the left side.
For Price Action Conditions, you can set a direction: "Any", "Bullish" or "Bearish".
Then a Price Action Feature, like "FVG" or "Order Block".
The last part of our constructed condition is the alert type, which you can select between "Detection", "Retest", "Retracement" or "Break".
Now you should have a constructed condition, which should look like "Bullish Order Block Retest".
You can select which timeframe should this condition work on from Timeframe 1, 2 or 3. If you select "Any Timeframe", the condition will work for all timeframes.
Lastly select the step of this condition from 1 to 6.
The Source Condition
The last condition on each side is a source condition that is different from the others. Using this condition, you can create your own logic using other indicators' outputs on your chart. For example, suppose that you have an EMA indicator in your chart. You can have the source condition to something like "EMA > high".
The Step System
Each condition has a step number, and conditions are in topological order based on them.
The conditions are executed step by step. This means the condition with step 2 cannot be executed before the condition with step 1 is executed.
Conditions with the same step numbers have "OR" logic. This means that if you have 2 conditions with step 3, the condition with step 4 can trigger after only one of the step 3 conditions is executed.
➕ OTHER ENTRY FEATURES
The PAT Automation allows traders to choose when to execute trades and when not to execute trades.
1. Only Take Trades
This setting lets users specify the time period when their strategy can open or execute trades.
2. Don't Take Trades
This setting lets users specify time periods when their strategy can't open or execute trades.
↩️ EXIT CONDITIONS
1. Exit on Opposite Signal
When enabled, a long position will close when short entry conditions are met, and a short position will close when long entry conditions are met.
2. Exit on Session End
When enabled, positions will be closed at the end of the trading session.
📈 TAKE PROFIT CONDITIONS
There are several methods available for setting take profit exits and conditions.
1. Entry Condition TP
Users can use entry conditions as triggers for take-profit exits. This setting can be found under the long and short exit conditions.
2. Fixed TP
Users can set a fixed TP for exits. This setting can be found under the long and short exit conditions. Users can choose between the following:
Price: This method triggers a TP exit when price reaches a specified level. For example, if you set the Price TP to 10 and buy NASDAQ:TSLA at $190, the trade will automatically exit when the price reaches $200 ($190 + $10).
Ticks: This method triggers a TP exit when price moves a specified number of ticks.
Percentage (%): This method triggers a TP exit when price moves a specified percentage.
ATR: This method triggers a TP exit based on a specified multiple of the Average True Range (ATR).
📉 STOP LOSS CONDITIONS
There are several methods available for setting stop-loss exits and conditions.
1. Entry Condition SL
Users can use entry conditions as triggers for stop-loss exits. This setting can be found under the long and short exit conditions.
2. Fixed SL
Users can set a fixed SL for exits. This setting can be found under the long and short exit conditions. Users can choose between the following:
Price: This method triggers a SL exit when price reaches a specified level. For example, if you set the Price SL to 10 and buy NASDAQ:TSLA at $200, the trade will automatically exit when the price reaches $190 ($200 - $10).
Ticks: This method triggers a SL exit when price moves a specified number of ticks.
Percentage (%): This method triggers a SL exit when price moves a specified percentage.
ATR: This method triggers a SL exit based on a specified multiple of the Average True Range (ATR).
3. Trailing Stop
An explanation & example for the trailing stop feature is present on the write-up within the next section.
Exit conditions have the same logic of constructing conditions like the entry ones. You can construct a Take-Profit Condition & a Stop-Loss Condition. Note that the Take-Profit condition will only work if the position is in profit, regardless of if it's triggered or not. The same applies for the Stop-Loss condition, meaning that it will only work if the position is in loss.
You can also set a Fixed TP & Fixed SL based on the price movement after the position is entered. You have options like "Price", "Ticks", "%", or "Average True Range". For example, you can set a Fixed TP like "5%", and the position will be entered once it moves 5% up in a long position.
Trailing Stop
For the Fixed SL, you also have a "Trailing" stop option, which you can set it's activation level as well. The Trailing stop activation level and it's value are expressed in ticks. Check this scenerio for an example :
We have a ticker with a tick value of $1. Our Trailing Stop is set to 10 ticks and activation level is set to 30 ticks.
We buy 1 contract when the price is $100.
When the price becomes $110, we are in $10 (10 ticks) profit and the trailing stop is now activated.
The current price our stop's on is $110 - $30 (30 ticks), which is the level of $80.
The trailing stop will only move if the price moves up the highest high the price has been after we entered the position.
Let's suppose that price moves up $40 right after our trailing stop is activated. The price will now be $150, and our trailing stop will sit on $150 - $30 (30 ticks) = $120.
If the price is down the $120 level, our stop loss will be triggered.
There is also a "Hard SL" option designed for a backup stop-loss when trailing stops are enabled. You can enable & set this option and if the price goes down before our trailing stop even activates, the position will be exited.
You can also move stop-loss to the break-even (entry price of the position) after a certain profit is achieved using the last setting of the exit conditions. Note that for this to work, you will need to have a Fixed SL set-up.
➕ OTHER EXIT FEATURES
1. Move Stop Loss to Breakeven
This setting allows the strategy to automatically move the SL to Breakeven (BE) when the position is in profit by a certain amount. Users can choose between the following:
Price: This method moves the SL to BE when price reaches a specified level.
Ticks: This method moves the SL to BE when price moves a specified number of ticks.
Percentage (%): This method moves the SL to BE when price moves a specified percentage.
ATR: This method moves the SL to BE when price moves a specified multiple of the Average True Range (ATR).
Example Entry Scenario
To give an example , check this scenario; out conditions are :
LONG CONDITIONS
Bullish Order Block Detection, Step 1
Bullish CHoCH Detection, Step 2
Bullish Volume Imbalance Detection, Step 2
Bullish IFVG Retest, Step 3
First, the strategy needs to detect a Bullish Order Block in order to start working.
After it's detected, now it's looking for either a CHoCH, or a Volume Imbalance to proceed to the next step, the reason for this is that they both have the same step number.
After one of them is detected, the strategy will consistently check all IFVGs for a retest. If the retest occurs, a long position will be entered.
⏰ ALERTS
This indicator uses TradingView's strategy alert system. All entries and exits will be sent as an alert if configured. It's possible to further customize these alerts to your liking. For more information check TradingView's strategy alert customization page: www.tradingview.com
⚙️ SETTINGS
1. Backtesting Settings
Pyramiding: Controls the number of simultaneous trades allowed in the strategy. This setting must have the same value that is entered on the script's properties tab on the settings pane.
Max Distance to Last Bar: Determines the depth of historical data used to prevent memory overload.
Enable Custom Backtesting Period: Restricts backtesting to a specific date range.
Start & End Time Configuration: Define precise start and end dates for historical analysis.
2. Fair Value Gaps Settings
Zone Invalidation: Select between "Wick" and "Close" invalidation.
Filtering: Choose between "Average Range" and "Volume Threshold".
FVG Sensitivity: Ranges from Extreme to Low to detect FVGs with varying strictness.
Allow Gaps: Enables analysis on tickers that have different open-close price gaps.
3. Inversion Fair Value Gaps Settings
Zone Invalidation: Choose between "Wick" and "Close".
4. Order Block Settings
Swing Length: Adjusts the minimum number of bars required for OB formation.
Zone Invalidation Method: Select between "Wick" and "Close".
5. Breaker Block Settings
Zone Invalidation: Set invalidation method as "Wick" or "Close".
6. Liquidity Grabs Settings
Pivot Length: Adjusts the number of bars used to detect liquidity grabs.
Wick-Body Ratio: Defines the proportion of wick-to-body size for liquidity grab detection.
7. Multi-Timeframe Analysis
Enable Up to Three Timeframes: Select and analyze trades across multiple timeframes.
8. Market Structures
Swing Length: Defines the number of bars required for structure shifts.
Includes BOS, CHoCH, CHoCH+ Detection.
9. Equal Highs & Lows
ATR Multiplier: Defines the sensitivity of equal highs/lows detection.
10. Volume Imbalances
Gap Size Sensitivity: Ranges from "Ultra" to "Low".
Disable Overnight Gaps: Filters out volume imbalances occurring due to overnight gaps.
11. Entry Conditions for Long & Short Trades
Multiple Conditions (1-6): Configure up to six independent conditions per trade direction.
Condition Types: Options include Detection, Retest, Retracement, and Break.
Timeframe Specification: Choose between "Any Timeframe", "Timeframe 1", "Timeframe 2", or "Timeframe 3".
Trade Execution Filters: Restrict trades within specific trading sessions.
12. Exit Conditions for Long & Short Trades
Exit on Opposite Signal: Automatically exit trades upon opposite trade conditions.
Exit on Session End: Closes all positions at the end of the trading session.
Multiple Take-Profit (TP) and Stop-Loss (SL) Configurations:
TP/SL based on % move, ATR, Ticks, or Fixed Price.
Hard SL option for additional risk control.
Move SL to BE (Break Even) after a certain profit threshold.

Flux Charts - SFX Automation💎 GENERAL OVERVIEW
The SFX Automation is a powerful and versatile tool designed to help traders rigorously test their trading strategies against historical market data. With various advanced settings, traders can fine-tune their strategies, assess performance, and identify key improvements before deploying in live trading environments. This tool offers a wide range of configurable settings, explained within this write-up.
Features of the new SFX Automation :
Step By Step : Configure your strategy step by step, which will allow you to have OR & AND logic in your strategies.
Highly Configurable : Offers multiple parameters for fine-tuning trade entry and exit conditions.
Multi-Timeframe Analysis : Allows traders to analyze multiple timeframes simultaneously for enhanced accuracy.
Provides advanced stop-loss, take-profit, and break-even settings.
Incorporates Buy & Sell signals, with settings like Signal Sensitivity, Strength, Time Weighting, Dynamic TP & SL Methods and more for refined strategy execution.
🚩 UNIQUENESS
The SFX Automation stands out from conventional backtesting tools due to its unparalleled flexibility, precision, and advanced trading logic integration. Key factors that make it unique include:
✅ Comprehensive Strategy Customization – Unlike traditional backtesters that offer basic entry and exit conditions, SFX Automation provides a highly detailed parameter set, allowing traders to fine-tune their strategies with precision.
✅ Multi-Timeframe Signals – This is the first-ever tool that allows traders to backtest Buy & Sell Signals on multiple timeframes.
✅ Customizable Take-Profit Conditions – Offers various methods to set take-profit exits, including using core features from SFX Algo, and dynamic exits like signal rating upgrades/downgrades, enabling traders to tailor their exit strategies to specific market behaviors.
✅ Customizable Stop-Loss Conditions – Provides several ways to set up stop losses, including using concepts from SFX Algo and trailing stops or dynamic exits like signal rating upgrades/downgrades, allowing for dynamic risk management tailored to individual strategies.
✅ Integration of External Indicators – Allows the inclusion of other indicators or data sources from TradingView for creating strategy conditions, enabling traders to enhance their strategies with additional insights and data points.
By integrating these advanced features, SFX Automation ensures that traders can rigorously test and optimize their strategies with great accuracy and efficiency.
📌 HOW DOES IT WORK ?
The first setting you will want to set it the pyramiding setting. This setting controls the number of simultaneous trades in the same direction allowed in the strategy. For example, if you set it to 1, only one trade can be active in any time, and the second trade will not be entered unless the first one is exited. If it is set to 2, the script will handle both of them at the same time. Note that you should enter the same value to this pyramiding setting, and the pyramiding setting in the "Properties" tab of the script for this to work.
You can enable and set a backtesting window that will limit the entries to between the start date & end date.
Entry Conditions
From the "Long Conditions" or the "Short Conditions" groups, you can set your position entry conditions. For settings like "initial capital" or "order size", you can open the "Properties" tab, where these are handled.
The SFX Algo can use the following conditions for entry conditions :
1. Buy Signal (Any, or 1-5 ☆)
This condition is triggered when a Buy Signal occurs. Other timeframes are supported with this condition.
2. Buy | TP (1, 2 or 3)
This condition is triggered when a TP signal of any Buy signal occurs.
3. Buy | SL
This condition is triggered when a SL signal of any Buy signal occurs.
4. Buy | Rating Upgrade
This condition is triggered when the rating of a buy signal is increased.
5. Buy | Rating Downgrade
This condition is triggered when the rating of a buy signal is decreased.
6. Sell Signal (Any, or 1-5 ☆)
This condition is triggered when a Sell Signal occurs. Other timeframes are supported with this condition.
7. Sell | TP (1, 2 or 3)
This condition is triggered when a TP signal of any Sell signal occurs.
8. Sell | SL
This condition is triggered when a SL signal of any Sell signal occurs.
9. Sell | Rating Upgrade
This condition is triggered when the rating of a sell signal is increased.
10. Sell | Rating Downgrade
This condition is triggered when the rating of a sell signal is decreased.
11. Retracement Wave Retest (Bullish or Bearish)
A retest on the Retracement Wave occurs when the price temporarily moves against the prevailing trend, touching or entering the wave before continuing in the original trend direction. This retest serves as a confirmation that the wave is acting as dynamic support or resistance.
12. Retracement Wave Retracement (Bullish or Bearish)
A retracement on the Retracement Wave occurs when the price touches the wave, the condition is triggered immediately.
13. Volatility Bands Retest (Bullish or Bearish)
A retest of Volatility Bands occurs when the price initially moves beyond the bands, then pulls back to "retest" the band it just broke through before continuing its move. This can provide traders with confirmation of a breakout or signal a potential reversal.
14. Volatility Bands Retracement (Bullish or Bearish)
A retracement on the Volatility Bands occur when the price touches the band, the condition is triggered immediately.
🕒 TIMEFRAME CONDITIONS
The SFX Automation supports Multi-Timeframe (MTF) features for Buy & Sell signals. When setting an entry condition, you can also choose the timeframe.
External Conditions
Users can use external indicators on the chart to set entry conditions.
The second dropdown in the external condition settings allows you to choose a conditional operator to compare external outputs. Available options include:
Less Than or Equal To: <=
Less Than: <
Equal To: =
Greater Than: >
Greater Than or Equal To: >=
The position entry conditions work like this ;
Each side has 3 SFX Algo conditions and 2 Source conditions. Each condition can be enabled or disabled using the checkbox on the left side of them.
You can select which timeframe this condition should work on for Buy & Sell signals. If you select "Chart", the condition will work for the chart's current timeframe.
Lastly select the step of this condition from 1 to 6.
The Source Condition
The last condition on each side is a source condition that is different from the others. Using this condition, you can create your own logic using other indicators' outputs on your chart. For example, suppose that you have an EMA indicator in your chart. You can have the source condition to something like "EMA > high".
The Step System
Each condition has a step number, and conditions are in topological order based on them.
The conditions are executed step by step. This means the condition with step 2 cannot be executed before the condition with step 1 is executed.
Conditions with the same step numbers have "OR" logic. This means that if you have 2 conditions with step 3, the condition with step 4 can trigger after only one of the step 3 conditions is executed.
➕ OTHER ENTRY FEATURES
The SFX Automation allows traders to choose when to execute trades and when not to execute trades.
1. Only Take Trades
This setting lets users specify the time period when their strategy can open or execute trades.
2. Don't Take Trades
This setting lets users specify time periods when their strategy can't open or execute trades.
↩️ EXIT CONDITIONS
1. Exit on Opposite Signal
When enabled, a long position will close when short entry conditions are met, and a short position will close when long entry conditions are met.
2. Exit on Session End
When enabled, positions will be closed at the end of the trading session.
📈 TAKE PROFIT CONDITIONS
There are several methods available for setting take profit exits and conditions.
1. Entry Condition TP
Users can use entry conditions as triggers for take profit exits. This setting can be found under the long and short exit conditions.
2. Fixed TP
Users can set a fixed TP for exits. This setting can be found under the long and short exit conditions. Users can choose between the following:
Price: This method triggers a TP exit when price reaches a specified level. For example, if you set the Price TP to 10 and buy NASDAQ:TSLA at $190, the trade will automatically exit when the price reaches $200 ($190 + $10).
Ticks: This method triggers a TP exit when price moves a specified number of ticks.
Percentage (%): This method triggers a TP exit when price moves a specified percentage.
ATR: This method triggers a TP exit based on a specified multiple of the Average True Range (ATR).
🧩EXIT PERCENTAGES
For each 3 dynamic take-profit conditions, you can set the amount of the position to exit in terms of percentage. It's important to make sure that the total of the exit percentages are 100%.
📉 STOP LOSS CONDITIONS
There are several methods available for setting stop-loss exits and conditions.
1. Entry Condition SL
Users can use entry conditions as triggers for stop-loss exits. This setting can be found under the long and short exit conditions.
2. Fixed SL
Users can set a fixed SL for exits. This setting can be found under the long and short exit conditions. Users can choose between the following:
Price: This method triggers a SL exit when price reaches a specified level. For example, if you set the Price SL to 10 and buy NASDAQ:TSLA at $200, the trade will automatically exit when the price reaches $190 ($200 - $10).
Ticks: This method triggers a SL exit when price moves a specified number of ticks.
Percentage (%): This method triggers a SL exit when price moves a specified percentage.
ATR: This method triggers a SL exit based on a specified multiple of the Average True Range (ATR).
3. Trailing Stop
An explanation & example for the trailing stop feature is present on the write-up within the next section.
Exit conditions have the same logic of constructing conditions like the entry ones. You can construct a Take-Profit Condition & a Stop-Loss Condition. Note that the Take-Profit condition will only work if the position is in profit, regardless of if it's triggered or not. The same applies for the Stop-Loss condition, meaning that it will only work if the position is in loss.
You can also set a Fixed TP & Fixed SL based on the price movement after the position is entered. You have options like "Price", "Ticks", "%", or "Average True Range". For example, you can set a Fixed TP like "5%", and the position will be entered once it moves 5% up in a long position.
Trailing Stop
For the Fixed SL, you also have a "Trailing" stop option, which you can set it's activation level as well. The Trailing stop activation level and it's value are expressed in ticks. Check this scenerio for an example :
We have a ticker with a tick value of $1. Our Trailing Stop is set to 10 ticks, and the activation level is set to 30 ticks.
We buy 1 contract when the price is $100.
When the price becomes $110, we are in $10 (10 ticks) profit and the trailing stop is now activated.
The current price our stop's on is $110 - $30 (30 ticks), which is the level of $80.
The trailing stop will only move if the price moves up the highest high the price has been after we entered the position.
Let's suppose that price moves up $40 right after our trailing stop is activated. The price will now be $150, and our trailing stop will sit on $150 - $30 (30 ticks) = $120.
If the price is down the $120 level, our stop loss will be triggered.
There is also a "Hard SL" option designed for a backup stop-loss when trailing stops are enabled. You can enable & set this option and if the price goes down before our trailing stop even activates, the position will be exited.
You can also move stop-loss to the break-even (entry price of the position) after a certain profit is achieved using the last setting of the exit conditions. Note that for this to work, you will need to have a Fixed SL setup.
➕ OTHER EXIT FEATURES
1. Move Stop Loss to Breakeven
This setting allows the strategy to automatically move the SL to Breakeven (BE) when the position is in profit by a certain amount. Users can choose between the following:
Price: This method moves the SL to BE when price reaches a specified level.
Ticks: This method moves the SL to BE when price moves a specified number of ticks.
Percentage (%): This method moves the SL to BE when price moves a specified percentage.
ATR: This method moves the SL to BE when price moves a specified multiple of the Average True Range (ATR).
Example Entry Scenario
To give an example , check this scenario; out conditions are :
LONG CONDITIONS
Buy Signal Any☆, Step 1
Bullish R. Wave Retest, Step 2
Bullish V. Bands Retest, Step 2
open > close, Step 3
First, the strategy needs to detect a Buy Signal with any star rating in order to start working.
After it's detected, now it's looking for either a Bullish R. Wave Retest, or a Bullish V. Bands Retest to proceed to the next step, the reason for this is that they both have the same step number.
After one of them is detected, the strategy will consistently check candlesticks for the condition open > close. If a bullish candlestick occurs, a long position will be entered.
⏰ ALERTS
This indicator uses TradingView's strategy alert system. All entries and exits will be sent as an alert if configured. It's possible to further customize these alerts to your liking. For more information, check TradingView's strategy alert customization page: www.tradingview.com
⚙️ SETTINGS
1. Backtesting Settings
Pyramiding: Controls the number of simultaneous trades allowed in the strategy. This setting must have the same value that is entered on the script's properties tab on the settings pane.
Enable Custom Backtesting Period: Restricts backtesting to a specific date range.
Start & End Time Configuration: Define precise start and end dates for historical analysis.
2. Algorithm Settings
Sensitivity: The sensitivity setting is a key parameter that influences the number of signals the SFX Algo generates. By adjusting this parameter, you can control the frequency of signals produced by the algorithm.
Signal Strength: The Signal Strength setting filters signals based on their quality, allowing traders to focus on the most reliable opportunities. This feature helps traders balance the quantity and reliability of the algorithm’s signals to suit their trading strategy.
Time Weighting: The Time Weighting setting determines how the SFX Algo evaluates historical market data to generate signals.
a) Recent Trends
Focuses on the most recent movements for short-term analysis. This setting is good for scalpers and intraday traders who need to react quickly to market changes.
b) Mixed Trends
Balances recent and historical price movements for a comprehensive market view. This setting is well-suited for swing traders and those who want to capture medium-term opportunities by combining the benefits of short-term responsiveness with the reliability of long-term trends.
c) Long-term Trends
Relies on extended historical market data to identify broader market trends, making it an excellent choice for traders focused on long-term strategies.
Minimum Star Rating: The Minimum Star Rating setting allows you to filter signals based on their strength, showing only those that meet or exceed your chosen threshold. For instance, setting the minimum star rating to 3 ensures you only receive signals with a rating of 3 stars or higher.
3. Take Profit / Stop Loss Methods
Key Levels
The Key Levels method uses pivot points to set take profit and stop-loss levels. The TP and SL levels are shown when a new signal is generated.
Volatility Bands
This TP/SL method uses the Volatility Bands overlay to set dynamic TP and SL levels. These levels are not predetermined so they will not be shown in advance when a signal is generated.
Signal Rating
Sets take profit and stop-loss levels based on changes in a signal's rating strength. These levels are not predetermined so they will not be shown in advance when a signal is generated.
Auto Stop-Loss
The auto method can only be applied to the SL. The auto method allows the algorithm to detect SL automatically when a momentum shift is detected. You can adjust the risk tolerance of the Auto SL by adjusting the ‘Auto Risk Tolerance’ setting. You can choose between Low, Medium, and High. A high-risk tolerance will result in stop losses being triggered less often.
4. Entry Conditions for Long & Short Trades
Multiple Conditions (1-6): Configure up to six independent conditions per trade direction.
Timeframe Specification: Choose between timeframes for Buy & Sell signals.
Trade Execution Filters: Restrict trades within specific trading sessions.
5. Exit Conditions for Long & Short Trades
Exit on Opposite Signal: Automatically exit trades upon opposite trade conditions.
Exit on Session End: Closes all positions at the end of the trading session.
Multiple Take-Profit (TP) and Stop-Loss (SL) Configurations:
TP/SL based on % move, ATR, Ticks, or Fixed Price.
Hard SL option for additional risk control.
Move SL to BE (Break Even) after a certain profit threshold.

QuantBuilder | FractalystWhat's the strategy's purpose and functionality?
QuantBuilder is designed for both traders and investors who want to utilize mathematical techniques to develop profitable strategies through backtesting on historical data.
The primary goal is to develop profitable quantitive strategies that not only outperform the underlying asset in terms of returns but also minimize drawdown.
For instance, consider Bitcoin (BTC), which has experienced significant volatility, averaging an estimated 200% annual return over the past decade, with maximum drawdowns exceeding -80%. By employing this strategy with diverse entry and exit techniques, users can potentially seek to enhance their Compound Annual Growth Rate (CAGR) while managing risk to maintain a lower maximum drawdown.
While this strategy employs quantitative techniques, including mathematical methods such as probabilities and positive expected values, it demonstrates exceptional efficacy across all markets. It particularly excels in futures, indices, stocks, cryptocurrencies, and commodities, leveraging their inherent trending behaviors for optimized performance.
In both trending and consolidating market conditions, QuantBuilder employs a combination of multi-timeframe probabilities, expected values, directional biases, moving averages and diverse entry models to identify and capitalize on bullish market movements.
How does the strategy perform for both investors and traders?
The strategy has two main modes, tailored for different market participants: Traders and Investors.
1. Trading:
- Designed for traders looking to capitalize on bullish markets.
- Utilizes a percentage risk per trade to manage risk and optimize returns.
- Suitable for both swing and intraday trading with a focus on probabilities and risk per trade approach.
2. Investing:
- Geared towards investors who aim to capitalize on bullish trending markets without using leverage while mitigating the asset's maximum drawdown.
- Utilizes pre-define percentage of the equity to buy, hold, and manage the asset.
- Focuses on long-term growth and capital appreciation by fully/partially investing in the asset during bullish conditions.
How does the strategy identify market structure? What are the underlying calculations?
The strategy utilizes an efficient logic with for loops to pinpoint the first swing candle featuring a pivot of 2, establishing the point at which the break of structure begins.
What entry criteria are used in this script? What are the underlying calculations?
The script utilizes two entry models: BreakOut and fractal.
Underlying Calculations:
Breakout: The script assigns the most recent swing high to a variable. When the price closes above this level and all other conditions are met, the script executes a breakout entry (conservative approach).
Fractal: The script identifies a swing low with a period of 2. Once this condition is met, the script executes the trade (aggressive approach).
How does the script calculate probabilities? What are the underlying calculations?
The script calculates probabilities by monitoring price interactions with liquidity levels. Here’s how the underlying calculations work:
Tracking Price Hits: The script counts the number of times the price taps into each liquidity side after the EQM level is activated. This data is stored in an array for further analysis.
Sample Size Consideration: The total number of price interactions serves as the sample size for calculating probabilities.
Probability Calculation: For each liquidity side, the script calculates the probability by taking the average of the recorded hits. This allows for a dynamic assessment of the likelihood that a particular side will be hit next, based on historical performance.
Dynamic Adjustment: As new price data comes in, the probabilities are recalculated, providing real-time aduptive insights into market behavior.
Note: The calculations are performed independently for each directional range. A range is considered bearish if the previous breakout was through a sellside liquidity. Conversely, a range is considered bullish if the most recent breakout was through a buyside liquidity.
How does the script calculate expected values? What are the underlying calculations?
The script calculates expected values by leveraging the probabilities of winning and losing trades, along with their respective returns. The process involves the following steps:
This quantitative methodology provides a robust framework for assessing the expected performance of trading strategies based on historical data and backtesting results.
How is the contextual bias calculated? What are the underlying calculations?
The contextual bias in the QuantBuilder script is calculated through a structured approach that assesses market structure based on swing highs and lows. Here’s how it works:
Identification of Swing Points: The script identifies significant swing points using a defined pivot logic, focusing on the first swing high and swing low. This helps establish critical levels for determining market structure.
Break of Structure (BOS) Assessment:
Bullish BOS: The script recognizes a bullish break of structure when a candle closes above the first swing high, followed by at least one swing low.
Bearish BOS: Conversely, a bearish break of structure is identified when a candle closes below the first swing low, followed by at least one swing high.
Bias Assignment: Based on the identified break of structure, the script assigns directional biases:
A bullish bias is assigned if a bullish BOS is confirmed.
A bearish bias is assigned if a bearish BOS is confirmed.
Quantitative Evaluation: Each identified bias is quantitatively evaluated, allowing the script to assign numerical values representing the strength of each bias. This quantification aids in assessing the reliability of market sentiment across multiple timeframes.
What's the purpose of using moving averages in this strategy? What are the underlying calculations?
Using moving averages is a widely-used technique to trade with the trend.
The main purpose of using moving averages in this strategy is to filter out bearish price action and to only take trades when the price is trading ABOVE specified moving averages.
The script uses different types of moving averages with user-adjustable timeframes and periods/lengths, allowing traders to try out different variations to maximize strategy performance and minimize drawdowns.
By applying these calculations, the strategy effectively identifies bullish trends and avoids market conditions that are not conducive to profitable trades.
The MA filter allows traders to choose whether they want a specific moving average above or below another one as their entry condition.
What type of stop-loss identification method are used in this strategy? What are the underlying calculations?
- Initial Stop-loss:
1. ATR Based:
The Average True Range (ATR) is a method used in technical analysis to measure volatility. It is not used to indicate the direction of price but to measure volatility, especially volatility caused by price gaps or limit moves.
Calculation:
- To calculate the ATR, the True Range (TR) first needs to be identified. The TR takes into account the most current period high/low range as well as the previous period close.
The True Range is the largest of the following:
- Current Period High minus Current Period Low
- Absolute Value of Current Period High minus Previous Period Close
- Absolute Value of Current Period Low minus Previous Period Close
- The ATR is then calculated as the moving average of the TR over a specified period. (The default period is 14)
2. ADR Based:
The Average Day Range (ADR) is an indicator that measures the volatility of an asset by showing the average movement of the price between the high and the low over the last several days.
Calculation:
- To calculate the ADR for a particular day:
- Calculate the average of the high prices over a specified number of days.
- Calculate the average of the low prices over the same number of days.
- Find the difference between these average values.
- The default period for calculating the ADR is 14 days. A shorter period may introduce more noise, while a longer period may be slower to react to new market movements.
3. PL Based:
This method places the stop-loss at the low of the previous candle.
If the current entry is based on the hunt entry strategy, the stop-loss will be placed at the low of the candle that wicks through the lower FRMA band.
Example:
If the previous candle's low is 100, then the stop-loss will be set at 100.
This method ensures the stop-loss is placed just below the most recent significant low, providing a logical and immediate level for risk management.
- Trailing Stop-Loss:
One of the key elements of this strategy is its ability to detect structural liquidity and structural invalidation levels across multiple timeframes to trail the stop-loss once the trade is in running profits.
By utilizing this approach, the strategy allows enough room for price to run.
By using these methods, the strategy dynamically adjusts the initial stop-loss based on market volatility, helping to protect against adverse price movements while allowing for enough room for trades to develop.
Each market behaves differently across various timeframes, and it is essential to test different parameters and optimizations to find out which trailing stop-loss method gives you the desired results and performance.
What type of break-even and take profit identification methods are used in this strategy? What are the underlying calculations?
For Break-Even:
Percentage (%) Based:
Moves the initial stop-loss to the entry price when the price reaches a certain percentage above the entry.
Calculation:
Break-even level = Entry Price * (1 + Percentage / 100)
Example:
If the entry price is $100 and the break-even percentage is 5%, the break-even level is $100 * 1.05 = $105.
Risk-to-Reward (RR) Based:
Moves the initial stop-loss to the entry price when the price reaches a certain RR ratio.
Calculation:
Break-even level = Entry Price + (Initial Risk * RR Ratio)
For TP1 (Take Profit 1):
- You can choose to set a take profit level at which your position gets fully closed or 50% if the TP2 boolean is enabled.
- Similar to break-even, you can select either a percentage (%) or risk-to-reward (RR) based take profit level, allowing you to set your TP1 level as a percentage amount above the entry price or based on RR.
For TP2 (Take Profit 2):
- You can choose to set a take profit level at which your position gets fully closed.
- As with break-even and TP1, you can select either a percentage (%) or risk-to-reward (RR) based take profit level, allowing you to set your TP2 level as a percentage amount above the entry price or based on RR.
What's the day filter Filter, what does it do?
The day filter allows users to customize the session time and choose the specific days they want to include in the strategy session. This helps traders tailor their strategies to particular trading sessions or days of the week when they believe the market conditions are more favorable for their trading style.
Customize Session Time:
Users can define the start and end times for the trading session.
This allows the strategy to only consider trades within the specified time window, focusing on periods of higher market activity or preferred trading hours.
Select Days:
Users can select which days of the week to include in the strategy.
This feature is useful for excluding days with historically lower volatility or unfavorable trading conditions (e.g., Mondays or Fridays).
Benefits:
Focus on Optimal Trading Periods:
By customizing session times and days, traders can focus on periods when the market is more likely to present profitable opportunities.
Avoid Unfavorable Conditions:
Excluding specific days or times can help avoid trading during periods of low liquidity or high unpredictability, such as major news events or holidays.
What tables are available in this script?
- Summary: Provides a general overview, displaying key performance parameters such as Net Profit, Profit Factor, Max Drawdown, Average Trade, Closed Trades and more.
Total Commission: Displays the cumulative commissions incurred from all trades executed within the selected backtesting window. This value is derived by summing the commission fees for each trade on your chart.
Average Commission: Represents the average commission per trade, calculated by dividing the Total Commission by the total number of closed trades. This metric is crucial for assessing the impact of trading costs on overall profitability.
Avg Trade: The sum of money gained or lost by the average trade generated by a strategy. Calculated by dividing the Net Profit by the overall number of closed trades. An important value since it must be large enough to cover the commission and slippage costs of trading the strategy and still bring a profit.
MaxDD: Displays the largest drawdown of losses, i.e., the maximum possible loss that the strategy could have incurred among all of the trades it has made. This value is calculated separately for every bar that the strategy spends with an open position.
Profit Factor: The amount of money a trading strategy made for every unit of money it lost (in the selected currency). This value is calculated by dividing gross profits by gross losses.
Avg RR: This is calculated by dividing the average winning trade by the average losing trade. This field is not a very meaningful value by itself because it does not take into account the ratio of the number of winning vs losing trades, and strategies can have different approaches to profitability. A strategy may trade at every possibility in order to capture many small profits, yet have an average losing trade greater than the average winning trade. The higher this value is, the better, but it should be considered together with the percentage of winning trades and the net profit.
Winrate: The percentage of winning trades generated by a strategy. Calculated by dividing the number of winning trades by the total number of closed trades generated by a strategy. Percent profitable is not a very reliable measure by itself. A strategy could have many small winning trades, making the percent profitable high with a small average winning trade, or a few big winning trades accounting for a low percent profitable and a big average winning trade. Most mean-reversion successful strategies have a percent profitability of 40-80% but are profitable due to risk management control.
BE Trades: Number of break-even trades, excluding commission/slippage.
Losing Trades: The total number of losing trades generated by the strategy.
Winning Trades: The total number of winning trades generated by the strategy.
Total Trades: Total number of taken traders visible your charts.
Net Profit: The overall profit or loss (in the selected currency) achieved by the trading strategy in the test period. The value is the sum of all values from the Profit column (on the List of Trades tab), taking into account the sign.
- Monthly: Displays performance data on a month-by-month basis, allowing users to analyze performance trends over each month and year.
- Weekly: Displays performance data on a week-by-week basis, helping users to understand weekly performance variations.
- UI Table: A user-friendly table that allows users to view and save the selected strategy parameters from user inputs. This table enables easy access to key settings and configurations, providing a straightforward solution for saving strategy parameters by simply taking a screenshot with Alt + S or ⌥ + S.
User-input styles and customizations:
To facilitate studying historical data, all conditions and filters can be applied to your charts. By plotting background colors on your charts, you'll be able to identify what worked and what didn't in certain market conditions.
Please note that all background colors in the style are disabled by default to enhance visualization.
How to Use This Quantitive Strategy Builder to Create a Profitable Edge and System?
Choose Your Strategy mode:
- Decide whether you are creating an investing strategy or a trading strategy.
Select a Market:
- Choose a one-sided market such as stocks, indices, or cryptocurrencies.
Historical Data:
- Ensure the historical data covers at least 10 years of price action for robust backtesting.
Timeframe Selection:
- Choose the timeframe you are comfortable trading with. It is strongly recommended to use a timeframe above 15 minutes to minimize the impact of commissions/slippage on your profits.
Set Commission and Slippage:
- Properly set the commission and slippage in the strategy properties according to your broker/prop firm specifications.
Parameter Optimization:
- Use trial and error to test different parameters until you find the performance results you are looking for in the summary table or, preferably, through deep backtesting using the strategy tester.
Trade Count:
- Ensure the number of trades is 200 or more; the higher, the better for statistical significance.
Positive Average Trade:
- Make sure the average trade is above zero.
(An important value since it must be large enough to cover the commission and slippage costs of trading the strategy and still bring a profit.)
Performance Metrics:
- Look for a high profit factor, and net profit with minimum drawdown.
- Ideally, aim for a drawdown under 20-30%, depending on your risk tolerance.
Refinement and Optimization:
- Try out different markets and timeframes.
- Continue working on refining your edge using the available filters and components to further optimize your strategy.
What makes this strategy original?
QuantBuilder stands out due to its unique combination of quantitative techniques and innovative algorithms that leverage historical data for real-time trading decisions. Unlike most algorithmic strategies that work based on predefined rules, this strategy adapts to real-time market probabilities and expected values, enhancing its reliability. Key features include:
Mathematical Framework: The strategy integrates advanced mathematical concepts, such as probabilities and expected values, to assess trade viability and optimize decision-making.
Multi-Timeframe Analysis: By utilizing multi-timeframe probabilities, QuantBuilder provides a comprehensive view of market conditions, enhancing the accuracy of entry and exit points.
Dynamic Market Structure Identification: The script employs a systematic approach to identify market structure changes, utilizing a blend of swing highs and lows to detect contextual/direction bias of the market.
Built-in Trailing Stop Loss: The strategy features a dynamic trailing stop loss based on multi-timeframe analysis of market structure. This allows traders to lock in profits while adapting to changing market conditions, ensuring that exits are executed at optimal levels without prematurely closing positions.
Robust Performance Metrics: With detailed performance tables and visualizations, users can easily evaluate strategy effectiveness and adjust parameters based on historical performance.
Adaptability: The strategy is designed to work across various markets and timeframes, making it versatile for different trading styles and objectives.
Suitability for Investors and Traders: QuantBuilder is ideal for both investors and traders looking to rely on mathematically proven data to create profitable strategies, ensuring that decisions are grounded in quantitative analysis.
These original elements combine to create a powerful tool that can help both traders and investors to build and refine profitable strategies based on algorithmic quantitative analysis.
Terms and Conditions | Disclaimer
Our charting tools are provided for informational and educational purposes only and should not be construed as financial, investment, or trading advice. They are not intended to forecast market movements or offer specific recommendations. Users should understand that past performance does not guarantee future results and should not base financial decisions solely on historical data.
Built-in components, features, and functionalities of our charting tools are the intellectual property of @Fractalyst Unauthorized use, reproduction, or distribution of these proprietary elements is prohibited.
By continuing to use our charting tools, the user acknowledges and accepts the Terms and Conditions outlined in this legal disclaimer and agrees to respect our intellectual property rights and comply with all applicable laws and regulations.

v2.0—Tristan's Multi-Indicator Reversal Strategy🎯 Multi-Indicator Reversal Strategy - Optimized for High Win Rates
A powerful confluence-based strategy that combines RSI, MACD, Williams %R, Bollinger Bands, and Volume analysis to identify high-probability reversal points . Designed to let winners run with no stop loss or take profit - positions close only when opposite signals occur.
Also, the 3 hour timeframe works VERY well—just a lot less trades.
📈 Proven Performance
This strategy has been backtested and optimized on multiple blue-chip stocks with 80-90%+ win rates on 1-hour timeframes from Aug 2025 through Oct 2025:
✅ V (Visa) - Payment processor
✅ MSFT (Microsoft) - Large-cap tech
✅ WMT (Walmart) - Retail leader
✅ IWM (Russell 2000 ETF) - Small-cap index
✅ NOW (ServiceNow) - Enterprise software
✅ WM (Waste Management) - Industrial services
These stocks tend to mean-revert at extremes, making them ideal candidates for this reversal-based approach. I only list these as a way to show you the performance of the script. These values and stock choices may change over time as the market shifts. Keep testing!
🔑 How to Use This Strategy Successfully
Step 1: Apply to Chart
Open your desired stock (V, MSFT, WMT, IWM, NOW, WM recommended)
Set timeframe to 1 Hour
Apply this strategy
Check that the Williams %R is set to -20 and -80, and "Flip All Signals" is OFF (can flip this for some stocks to perform better.)
Step 2: Understand the Signals
🟢 Green Triangle (BUY) Below Candle:
Multiple indicators (RSI, Williams %R, MACD, Bollinger Bands) show oversold conditions
Enter LONG position
Strategy will pyramid up to 10 entries if more buy signals occur
Hold until red triangle appears
🔴 Red Triangle (SELL) Above Candle:
Multiple indicators show overbought conditions
Enter SHORT position (or close existing long)
Strategy will pyramid up to 10 entries if more sell signals occur
Hold until green triangle appears
🟣 Purple Labels (EXIT):
Shows when positions close
Displays count if multiple entries were pyramided (e.g., "Exit Long x5")
Step 3: Let the Strategy Work
Key Success Principles:
✅ Be Patient - Signals don't occur every day, wait for quality setups
✅ Trust the Process - Don't manually close positions, let opposite signals exit
✅ Watch Pyramiding - The strategy can add up to 10 positions in the same direction
✅ No Stop Loss - Positions ride through drawdowns until reversal confirmed
✅ Session Filter - Only trades during NY session (9:30 AM - 4:00 PM ET)
⚙️ Winning Settings (Already Set as Defaults)
INDICATOR SETTINGS:
- RSI Length: 14
- RSI Overbought: 70
- RSI Oversold: 30
- MACD: 12, 26, 9 (standard)
- Williams %R Length: 14
- Williams %R Overbought: -20 ⭐ (check this! And adjust to your liking)
- Williams %R Oversold: -80 ⭐ (check this! And adjust to your liking)
- Bollinger Bands: 20, 2.0
- Volume MA: 20 periods
- Volume Multiplier: 1.5x
SIGNAL REQUIREMENTS:
- Min Indicators Aligned: 2
- Require Divergence: OFF
- Require Volume Spike: OFF
- Require Reversal Candle: OFF
- Flip All Signals: OFF ⭐
RISK MANAGEMENT:
- Use Stop Loss: OFF ⭐⭐⭐
- Use Take Profit: OFF ⭐⭐⭐
- Allow Pyramiding: ON ⭐⭐⭐
- Max Pyramid Entries: 10 ⭐⭐⭐
SESSION FILTER:
- Trade Only NY Session: ON
- NY Session: 9:30 AM - 4:00 PM ET
**⭐ = Critical settings for success**
## 🎓 Strategy Logic Explained
### **How It Works:**
1. **Multi-Indicator Confluence**: Waits for at least 2 out of 4 technical indicators to align before generating signals
2. **Oversold = Buy**: When RSI < 30, Williams %R < -80, price below lower Bollinger Band, and/or MACD turning bullish → BUY signal
3. **Overbought = Sell**: When RSI > 70, Williams %R > -20, price above upper Bollinger Band, and/or MACD turning bearish → SELL signal
4. **Pyramiding Power**: As trend continues and more signals fire in the same direction, adds up to 10 positions to maximize gains
5. **Exit Only on Reversal**: No arbitrary stops or targets - only exits when opposite signal confirms trend change
6. **Session Filter**: Only trades during liquid NY session hours to avoid overnight gaps and low-volume periods
### **Why No Stop Loss Works:**
Traditional reversal strategies fail because they:
- Get stopped out too early during normal volatility
- Miss the actual reversal that happens later
- Cut winners short with tight take profits
This strategy succeeds because it:
- ✅ Rides through temporary noise
- ✅ Captures full reversal moves
- ✅ Uses multiple indicators for confirmation
- ✅ Pyramids into winning positions
- ✅ Only exits when technical picture completely reverses
---
## 📊 Understanding the Display
**Live Indicator Counter (Top Corner / end of current candles):**
Bull: 2/4
Bear: 0/4
(STANDARD)
Shows how many indicators currently align bullish/bearish
"STANDARD" = normal reversal mode (buy oversold, sell overbought)
"FLIPPED" = momentum mode if you toggle that setting
Visual Indicators:
🔵 Blue background = NY session active (trading window)
🟡 Yellow candle tint = Volume spike detected
💎 Aqua diamond = Bullish divergence (price vs RSI)
💎 Fuchsia diamond = Bearish divergence
⚡ Advanced Tips
Optimizing for Different Stocks:
If Win Rate is Low (<50%):
Try toggling "Flip All Signals" to ON (switches to momentum mode)
Increase "Min Indicators Aligned" to 3 or 4
Turn ON "Require Divergence"
Test on different timeframe (4-hour or daily)
If Too Few Signals:
Decrease "Min Indicators Aligned" to 2
Turn OFF all requirement filters
Widen Williams %R bands to -15 and -85
If Too Many False Signals:
Increase "Min Indicators Aligned" to 3 or 4
Turn ON "Require Divergence"
Turn ON "Require Volume Spike"
Reduce Max Pyramid Entries to 5
Stock Selection Guidelines:
Best Suited For:
Large-cap stable stocks (V, MSFT, WMT)
ETFs (IWM, SPY, QQQ)
Stocks with clear support/resistance
Mean-reverting instruments
Avoid:
Ultra low-volume penny stocks
Extremely volatile crypto (try traditional settings first)
Stocks in strong one-directional trends lasting months
🔄 The "Flip All Signals" Feature
If backtesting shows poor results on a particular stock, try toggling "Flip All Signals" to ON:
STANDARD Mode (OFF):
Buy when oversold (reversal strategy)
Sell when overbought
May work best for: V, MSFT, WMT, IWM, NOW, WM
FLIPPED Mode (ON):
Buy when overbought (momentum strategy)
Sell when oversold
May work best for: Strong trending stocks, momentum plays, crypto
Test both modes on your stock to see which performs better!
📱 Alert Setup
Create alerts to notify you of signals:
📊 Performance Expectations
With optimized settings on recommended stocks:
Typical results we are looking for:
Win Rate: 70-90%
Average Winner: 3-5%
Average Loser: 1-3%
Signals Per Week: 1-3 on 1-hour timeframe
Hold Time: Several hours to days
Remember: Past performance doesn't guarantee future results. Always use proper risk management.

Tristan's Multi-Indicator Reversal StrategyMulti-Indicator Reversal Strategy - Buy Low, Sell High
A comprehensive reversal detection system that combines multiple proven technical indicators to identify high-probability entry points for catching reversals at market extremes.
📊 Strategy Overview
This strategy is designed for traders who want to buy at lows and sell at highs by detecting when stocks are overextended and ready to reverse. It works by requiring multiple technical indicators to align before generating a signal, significantly reducing false entries.
Best Used On:
Timeframe: 1-hour charts (also works on 15min, 30min, 4hour)
Session: NY Trading Session (9:30 AM - 4:00 PM ET)
Assets: Stocks, ETFs, Crypto (particularly volatile tech stocks like ZM, TSLA, AAPL)
Trading Style: Swing trading, Intraday reversals
🔧 Technical Components
The strategy combines FIVE powerful technical indicators:
1. RSI (Relative Strength Index)
2. MACD (Moving Average Convergence Divergence)
3. Williams %R
4. Bollinger Bands
5. Volume Analysis
6. Divergence Detection (Optional)
🎨 Visual Signals
Entry Signals:
🟢 Green Triangle (below candle) = BUY LONG signal
🔴 Red Triangle (above candle) = SELL SHORT signal
Exit Signals:
🟣 Purple Label = Position closed (shows "x2", "x3" if multiple entries)
Additional Indicators:
💎 Aqua Diamond = Bullish divergence detected
💎 Fuchsia Diamond = Bearish divergence detected
🔵 Blue Background = NY Session active
🟡 Yellow Bar Tint = Volume spike detected
⚪ Small Circles = Near-signal conditions (2+ indicators aligned)
Live Counter:
Top corner shows: "Bull: X/4" and "Bear: X/4"
Indicates how many indicators currently align
⚙️ How to Use This Strategy
For Beginners (More Signals):
Set "Min Indicators Aligned" to 2
Turn OFF "Require Divergence"
Turn OFF "Require Volume Spike"
Turn OFF "Require Reversal Candle Pattern"
Keep "Allow Multiple Entries" OFF
This gives you more frequent signals to learn from.
For Advanced Traders (High Probability):
Set "Min Indicators Aligned" to 3 or 4
Turn ON "Require Divergence"
Turn ON "Require Volume Spike"
Turn ON "Require Reversal Candle Pattern"
Adjust stop loss to your risk tolerance
This filters for only the highest-quality setups.
Recommended Settings for 1-Hour Charts:
Min Indicators Aligned: 3
Stop Loss: 2.5%
Take Profit: 5.0%
RSI Length: 14
Williams %R Length: 14
Volume Multiplier: 1.5x
Session: NY only (for stocks)
BUY SIGNAL generated when:
2-4 indicators show oversold/bullish conditions:
RSI < 30 and turning up
MACD crossing bullish or histogram positive
Williams %R < -80 and turning up
Price at/below lower Bollinger Band
Optional confirmations (if enabled):
Bullish divergence detected
Volume spike present
Bullish reversal candle pattern
Session filter: Signals only during NY trading hours
SELL SIGNAL Generated When:
2-4 indicators show overbought/bearish conditions:
RSI > 70 and turning down
MACD crossing bearish or histogram negative
Williams %R > -20 and turning down
Price at/above upper Bollinger Band
Optional confirmations (if enabled):
Bearish divergence detected
Volume spike present
Bearish reversal candle pattern
🛡️ Risk Management Features
Automatic Stop Loss: Protects capital (default 2.5%)
Take Profit Target: Locks in gains (default 5.0%)
Pyramiding Control: Toggle to prevent position stacking
Session Filter: Avoids overnight risk and low-liquidity periods
Position Flipping: Automatically reverses when opposite signal appears
💡 Best Practices
✅ DO:
Wait for candle close before entering (built into strategy)
Use on volatile assets with clear trends
Combine with your own analysis and risk management
Backtest on your specific assets and timeframes
Start with paper trading to learn the signals
Adjust indicator requirements based on market conditions
❌ DON'T:
Use on very low timeframes (<5 min) without adjustment
Ignore the session filter on stocks
Use maximum leverage - these are reversal trades
Trade during major news events or earnings
Expect 100% win rate - focus on risk/reward ratio
📊 Performance Notes
This strategy prioritizes quality over quantity. With default settings, you may see:
2-5 signals per week on 1-hour charts
Higher win rate with stricter settings (3-4 indicators aligned)
Best performance during trending markets with clear reversals
Reduced performance in choppy, sideways markets
Tip: Adjust "Min Indicators Aligned" based on market conditions:
Trending markets: Use 3-4 (fewer but stronger signals)
Range-bound markets: Use 2 (more signals, but watch for false breakouts)

TREND +SIDEWAYS OPTIMIZED algo signalsThis indicator will try to capture maximum trend of a stock
it will keep trailing stoploss to capture maximum trend
Works best in trendy markets
FEATURES:
Done and backtested on indian stocks.
Trade session and exit session can be specified as inputs.
Optional Stoploss
Specially developed for intraday trading
It would be good to use on normal candlesticks and time frame between (3 to 15 min)
INPUTS:
TRADE FREQUENCY: it can be an integer from from 1 to 5 , Frequency denotes the trading frequency,
low frequency will take less number of trades and will have HIGHER risk rewads (to use lowest frequency 1 )
High freqency it will take more trades and with less profits good for scalpers , it will have low risk and low reward)
Frequency requirement can be given between 1 to 5 , 1 is the lowest and 5 is the Highest frequency
Sideways Bias:
This is an extra filter to reduce the loss in sideways movement,
Your sideways bias can be given between 0 to 3
0 if No bias on sideways
3 if biased on sideways
Reduce the risk filter:
This would try to bok profit quickly and begginers can use this
Optional stoploss:
you can define your risk in points
Trade Quantity:This is quantity you want to trade on particular day, it is used to plot buy or sell quantity on chart (quantity is not taken into consideration in backtest)
Trade session: Session for entries can be specified
Exit session: session for exit can be specified
Custom Bactesting:
This is to provide backtesting results of a stock in given range of dates

Intraday Market Structure Research Tool (Reversal + Breakout)This script is a fully rule-based intraday strategy designed for research and backtesting purposes, not financial advice. It is intended to help traders study market behavior, time-based price patterns, and statistical trade outcomes under realistic trading assumptions.
What the Strategy Does
This strategy operates in two selectable trade modes:
1. Reversal Mode
Identifies statistically large candles relative to recent volatility
Enters counter-direction trades when price shows exhaustion behavior
Designed to study fade-type behavior around session extremes
2. Breakout Mode
Tracks recent swing highs/lows over a user-defined lookback
Executes trades only after confirmed price expansion beyond these levels
Designed to test momentum continuation behavior
Time & Session Filtering
Trades are only taken during user-defined market sessions, including:
New York 1
New York 2
London
Asia
This allows users to analyze performance differences between global trading sessions.
9:30 AM Opening Range Logic
The script captures the 9:30 AM (Eastern) one-minute candle high/low and uses that as an Opening Range:
Breakout trades can be confirmed above or below this range
The range is visualized for clarity
Risk Management & Realism Controls
This script includes realistic execution mechanics:
Fixed stop-loss and take-profit defined by the user (points or ticks)
Built-in slippage modeling
Commission assumptions included
Position sizing designed to keep risk per trade under 5–10% of account equity when used with realistic account sizes
Users are responsible for choosing realistic account sizes and risk values when running backtests.
Statistical Performance Tracking
The strategy records and displays performance data including:
Win rate
Average win and loss
Maximum drawdown per trade series
Expectancy
Trade distribution by:
Time of day
Session
Market classification
This allows users to study market tendencies and structural behavior over large sample sizes.
Visual Tools
The script displays:
Entry and exit markers
Blocked trade labels (when conditions are not met)
Opening range box
Breakout levels
Use Case Disclaimer
This script is designed for:
Backtesting
Market structure research
Statistical study
It is not guaranteed to be profitable, and results depend heavily on user-selected settings, market conditions, and realistic brokerage assumptions.
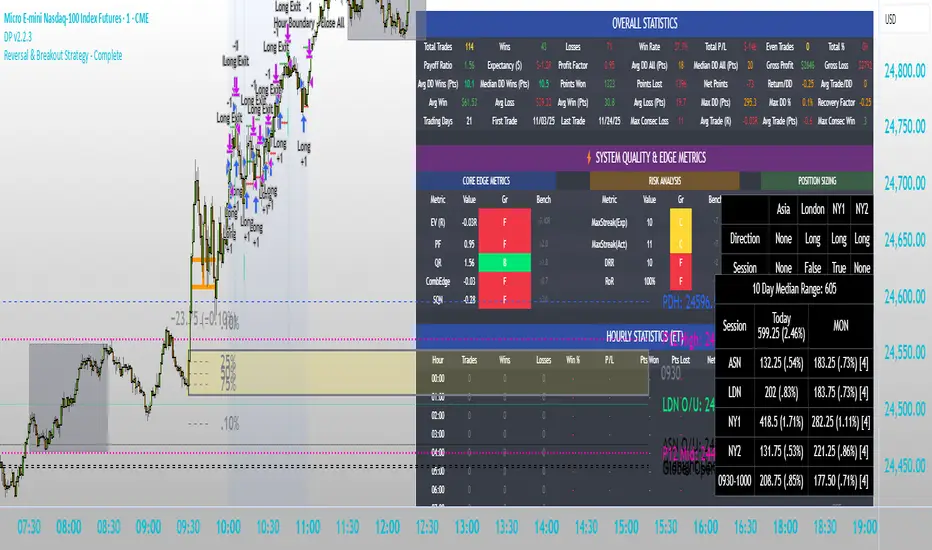
ALMASTO – Pro Trend & Momentum (v1.1)ALMASTO — Pro Trend & Momentum Strategy
Description:
This strategy is designed for precision trading in both Forex (FX) and Crypto markets.
It combines multi-timeframe trend confirmation (EMA200), momentum filters (RSI, MACD, ADX), and ATR-based dynamic risk management.
ALMASTO — Pro Trend & Momentum Strategy automatically manages take-profit levels, stop-loss, and breakeven adjustments once TP1 is reached — providing a structured and emotion-free trading approach.
Optimal Use
Works best on lower timeframes (5m–15m) with strong liquidity sessions.
Optimized for pairs like EURUSD, XAUUSD, and BTCUSDT.
Built for trend-following setups and momentum reversals with high volatility confirmation.
Recommended Settings
🔹 Forex – 5m
EMA Fast = 34, EMA Slow = 200, HTF = 1H
RSI (14): Long ≥ 55 / Short ≤ 45
MACD (8 / 21 / 5), ADX Len 10 / Min 27
ATR Len 7, Stop Loss = ATR × 2.1
TP1 = 1.1 RR, TP2 = 2.3 RR
Session = 07:00–11:00 & 12:30–16:00 (Exchange Time)
Risk = 0.8% per trade
🔹 Forex – 15m
EMA Fast = 50, EMA Slow = 200, HTF = 4H
RSI (14): Long ≥ 53 / Short ≤ 47
MACD (12 / 26 / 9), ADX Min 24
ATR Len 10, SL = ATR × 1.9
TP1 = 1.2 RR, TP2 = 2.6 RR
Risk = 1.0% per trade
🔹 Crypto – 5m (BTC/USDT)
EMA Fast = 34, EMA Slow = 200, HTF = 4H
RSI (14): Long ≥ 56 / Short ≤ 44
MACD (8 / 21 / 5), ADX Min 30
ATR Len 7, SL = ATR × 2.2
TP1 = 1.0 RR, TP2 = 2.5 RR
Session = 00:00–06:00 & 12:00–22:00 (UTC)
Risk = 0.5% per trade
Core Features
✅ Auto breakeven after TP1
✅ Dual take-profit system (1:1 & 1:2 RR)
✅ ATR-based stop & trailing logic
✅ Filters for session time, volume, and volatility
✅ Candle-body vs ATR size filter to avoid noise
✅ Optional cooldown between trades
Important Notes
Use bar close confirmation only (barstate.isconfirmed) to avoid repainting on lower timeframes.
Adjust commission (0.01–0.03%) and slippage (1–2 ticks) in Strategy Tester for realistic results.
Avoid low-liquidity hours (after 21:00 UTC for FX / after midnight for crypto).
Backtest using realistic broker data (e.g., BlackBull Markets / Bybit / Binance Futures).
Best results occur during London & New York sessions with moderate volatility.
⚠️ Disclaimer
This script is for educational and research purposes only.
It does not constitute financial advice.
Use proper risk management and test thoroughly before using on live accounts.
Developed by KING FX Labs
Built and optimized by Yousef Almasto — combining advanced price-action logic, multi-timeframe EMA structure, and volatility-adaptive ATR management.
Tested across Forex, Gold, and Crypto markets to ensure consistent performance and minimal drawdown.
📈 “Precision Trading. Zero Emotion. Pure Momentum.”

Antony.N4A - ORB Quartile Strategy vv4 06_30_25📌 Antony.N4A - ORB Quartile Strategy vv4
This script implements a fully automated Opening Range Breakout (ORB) trading strategy, engineered for precision execution within predefined market windows. It is compatible with both New York and London sessions, and integrates advanced internal logic including trend validation, breakout confirmation, position scaling, and risk-defined stop/target management.
🧠 Core Logic Overview:
ORB Range Calculation: Based on configurable session time (default: 09:30–09:45 EST)
Entry Window: Trade initiations are permitted only within a defined intraday range
Trend Validation Filters: Proprietary EMA-based mechanisms to confirm directional bias
Contract Sizing Engine: Dynamically adjusts trade size to respect a per-trade risk ceiling
Risk Parameters: Designed to cap maximum loss per trade at approximately $300–400
🎯 Trade Management Rules:
Entry:
Triggered at the close of a 5-minute candle that confirms a directional breakout of the ORB
Stop Loss:
Enforced via structural breakout invalidation levels (Quartile boundaries and mid-range buffer)
Profit Targeting:
- 75% of position is closed at the first standard deviation (SD1) level
- Remaining 25% is trailed to extended targets, with stop-loss adjusted to breakeven post-partial
No pyramiding, re-entries are limited by cooldown logic and session controls
📊 Backtest Performance (Oct 2024 – Apr 2025):
Total Trades: 36
Win Rate: 64%
Worst Losing Streak: 4 consecutive trades
Worst Month: January 2025 (-1.49R)
Net Performance: +21.5R
Strategy tested on NQ futures with NY session breakout configuration
This strategy is intended for disciplined intraday traders seeking a structured, semi-mechanical approach to volatility expansion. It is best used in high-liquidity markets and news-driven sessions.
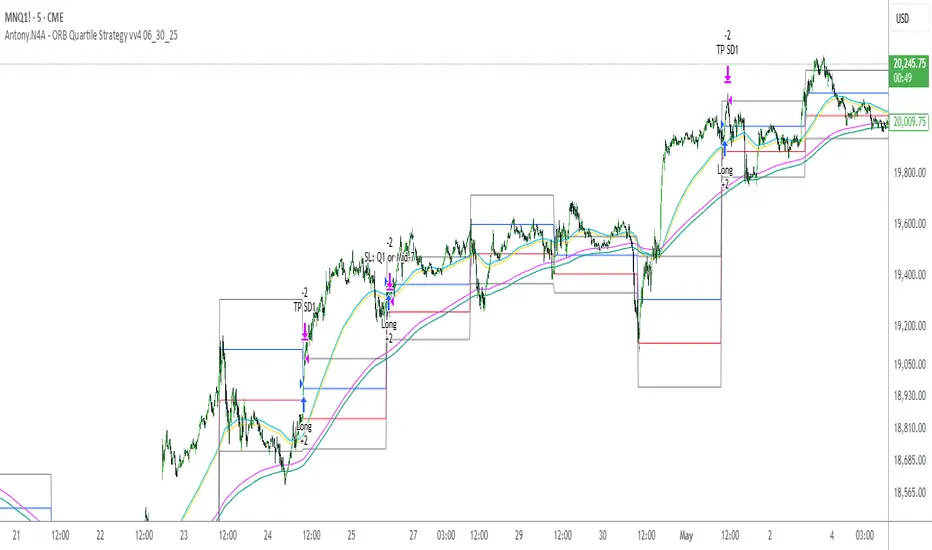
TradingView.To Strategy Template (with Dyanmic Alerts)Hello traders,
If you're tired of manual trading and looking for a solid strategy template to pair with your indicators, look no further.
This Pine Script v5 strategy template is engineered for maximum customization and risk management.
Best part?
This Pine Script v5 template facilitates the dynamic construction of TradingView.TO alerts, sparing users the time and effort of mastering the TradingView.TO syntax and manually create alert commands.
This powerful tool gives much power to those who don't know how to code in Pinescript and want to automate their indicators' signals via TradingView.TO bot.
IMPORTANT NOTES
TradingView.TO is a trading bot software that forwards TradingView alerts to your brokers (examples: Binance, Oanda, Coinbase, Bybit, Metatrader 4/5, ...) for automating trading.
Many traders don't know how to create TradingView.TO dynamically-compatible alerts using the data from their TradingView scripts.
Traders using trading bots want their alerts to reflect the stop-loss/take-profit/trailing-stop/stop-loss to break options from your script and then create the orders accordingly.
This script showcases how to create TradingView.TO alerts dynamically.
TRADINGVIEW ALERTS
1) You'll have to create one alert per asset X timeframe = 1 chart.
Example: 1 alert for BTC/USDT on the 5 minutes chart, 1 alert for BTC/USDT on the 15-minute chart (assuming you want your bot to trade the BTC/USDT on the 5 and 15-minute timeframes)
2) Select the Order fills and alert() function calls condition
3) For each alert, the alert message is pre-configured with the text below
{{strategy.order.alert_message}}
Please leave it as it is.
It's a TradingView native variable that will fetch the alert text messages built by the script.
4) TradingView.TO uses webhook technology - setting a webhook URL from the alerts notifications tab is required.
KEY FEATURES
I) Modular Indicator Connection
* plug your existing indicator into the template.
* Only two lines of code are needed for full compatibility.
Step 1: Create your connector
Adapt your indicator with only 2 lines of code and then connect it to this strategy template.
To do so:
1) Find in your indicator where the conditions print the long/buy and short/sell signals.
2) Create an additional plot as below
I'm giving an example with a Two moving averages cross.
Please replicate the same methodology for your indicator, whether a MACD , ZigZag, Pivots , higher-highs, lower-lows or whatever indicator with clear buy and sell conditions.
//@version=5
indicator("Supertrend", overlay = true, timeframe = "", timeframe_gaps = true)
atrPeriod = input.int(10, "ATR Length", minval = 1)
factor = input.float(3.0, "Factor", minval = 0.01, step = 0.01)
= ta.supertrend(factor, atrPeriod)
supertrend := barstate.isfirst ? na : supertrend
bodyMiddle = plot(barstate.isfirst ? na : (open + close) / 2, display = display.none)
upTrend = plot(direction < 0 ? supertrend : na, "Up Trend", color = color.green, style = plot.style_linebr)
downTrend = plot(direction < 0 ? na : supertrend, "Down Trend", color = color.red, style = plot.style_linebr)
fill(bodyMiddle, upTrend, color.new(color.green, 90), fillgaps = false)
fill(bodyMiddle, downTrend, color.new(color.red, 90), fillgaps = false)
buy = ta.crossunder(direction, 0)
sell = ta.crossunder(direction, 0)
//////// CONNECTOR SECTION ////////
Signal = buy ? 1 : sell ? -1 : 0
plot(Signal, title = "Signal", display = display.data_window)
//////// CONNECTOR SECTION ////////
Important Notes
🔥 The Strategy Template expects the value to be exactly 1 for the bullish signal and -1 for the bearish signal
Now, you can connect your indicator to the Strategy Template using the method below or that one.
Step 2: Connect the connector
1) Add your updated indicator to a TradingView chart
2) Add the Strategy Template as well to the SAME chart
3) Open the Strategy Template settings, and in the Data Source field, select your 🔌Connector🔌 (which comes from your indicator)
Note it doesn’t have to be named 🔌Connector🔌 - you can name it as you want - however, I recommend an explicit name you can easily remember.
From then, you should start seeing the signals and plenty of other stuff on your chart.
🔥 Note that whenever you update your indicator values, the strategy statistics and visuals on your chart will update in real-time
II) BOT Risk Management:
- Max Drawdown:
Mode: Select whether the max drawdown is calculated in percentage (%) or USD.
Value: If the max drawdown reaches this specified value, set a value to halt the bot.
- Max Consecutive Days:
Use Max Consecutive Days BOT Halt: Enable/Disable halting the bot if the max consecutive losing days value is reached.
- Max Consecutive Days: Set the maximum number of consecutive losing days allowed before halting the bot.
- Max Losing Streak:
Use Max Losing Streak: Enable/Disable a feature to prevent the bot from taking too many losses in a row.
- Max Losing Streak Length: Set the maximum length of a losing streak allowed.
Margin Call:
- Use Margin Call: Enable/Disable a feature to exit when a specified percentage away from a margin call to prevent it.
Margin Call (%): Set the percentage value to trigger this feature.
- Close BOT Total Loss:
Use Close BOT Total Loss: Enable/Disable a feature to close all trades and halt the bot if the total loss is reached.
- Total Loss ($): Set the total loss value in USD to trigger this feature.
Intraday BOT Risk Management:
- Intraday Losses:
Use Intraday Losses BOT Halt: Enable/Disable halting the bot on reaching specified intraday losses.
Mode: Select whether the intraday loss is calculated in percentage (%) or USD.
- Max Intraday Losses (%): Set the value for maximum intraday losses.
Limit Intraday Trades:
- Use Limit Intraday Trades: Enable/Disable a feature to limit the number of intraday trades.
- Max Intraday Trades: Set the maximum number of intraday trades allowed.
Restart Intraday EA:
III) Order Types and Position Sizing
- Choose between market or limit orders.
- Set your position size directly in the template.
Please use the position size from the “Inputs” and not the “Properties” tab.
I know it's redundant. - the template needs this value from the "Inputs" tab to build the alerts, and the Backtester needs it from the "Properties" tab.
IV) Advanced Take-Profit and Stop-Loss Options
- Choose to set your SL/TP in either USD or percentages.
- Option for multiple take-profit levels and trailing stop losses.
- Move your stop loss to break even +/- offset in USD for “risk-free” trades.
V) Miscellaneous:
Retry order openings if they fail.
Order Types:
Select and specify order type and price settings.
Position Size:
Define the type and size of positions.
Leverage:
Leverage settings, including margin type and hedge mode.
Session:
Limit trades to specific sessions.
Dates:
Limit trades to a specific date range.
Trades Direction:
Direction: Specify the market direction for opening positions.
VI) Logger
The TradingView.TO commands are logged in the TradingView logger.
You'll find more information about it in this TradingView blog post .
WHY YOU MIGHT NEED THIS TEMPLATE
1) Transform your indicator into a TradingView.TO trading bot more easily than before
Connect your indicator to the template
Create your alerts
Set your EA settings
2) Save Time
Auto-generated alert messages for TradingView.TO.
I tested them all and checked with the support team what could/couldn’t be done.
3) Be in Control
Manage your trading risks with advanced features.
4) Customizable
Fits various trading styles and asset classes.
REQUIREMENTS
* Make sure you have your TradingView.TO account
* If there is any issue with the template, ask me in the comments section - I’ll answer quickly.
BACKTEST RESULTS FROM THIS POST
1) I connected this strategy template to a dummy Supertrend script.
I could have selected any other indicator or concept for this script post.
I wanted to share an example of how you can quickly upgrade your strategy, making it compatible with TradingView.TO.
2) The backtest results aren't relevant for this educational script publication.
I used realistic backtesting data but didn't look too much into optimizing the results, as this isn't the point of why I'm publishing this script.
This strategy is a template to be connected to any indicator - the sky is the limit. :)
3) This template is made to take 1 trade per direction at any given time.
Pyramiding is set to 1 on TradingView.
The strategy default settings are:
* Initial Capital: 100000 USD
* Position Size: 1%
* Commission Percent: 0.075%
* Slippage: 1 tick
* No margin/leverage used

ProfitView Strategy TemplateHello traders,
This script took me a full week of coding/testing, sweat, and tears - and I’m too nice as I’m giving it for free to the community.
If you're tired of manual trading and looking for a solid strategy template to pair with your indicators, look no further.
This Pine Script v5 strategy template is engineered for maximum customization and risk management.
Best part?
This Pine Script v5 template facilitates the dynamic construction of ProfitView alerts, sparing users the time and effort of mastering the ProfitView syntax and manually creating alert commands.
This powerful tool gives much power to those who don't know how to code in Pinescript and want to automate their indicators' signals via the ProfitView Chrome extension.
IMPORTANT NOTES
ProfitView is a trading bot software that forwards TradingView alerts to your brokers (examples: Binance, Oanda, Coinbase, Bybit, etc.) for automating trading.
Many traders don't know how to dynamically create ProfitView-compatible alerts using the data from their TradingView scripts.
Traders using trading bots want their alerts to reflect the stop-loss/take-profit/trailing-stop/stop-loss to break options from your script and then create the orders accordingly.
This script showcases how to create ProfitView alerts dynamically.
TRADINGVIEW ALERTS
1) You'll have to create one alert per asset X timeframe = 1 chart.
Example: 1 alert for EUR/USD on the 5 minutes chart, 1 alert for EUR/USD on the 15-minute chart (assuming you want your bot to trade the EUR/USD on the 5 and 15-minute timeframes)
2) Select the Order fills and alert() function calls condition
3) For each alert, the alert message is pre-configured with the text below
{{strategy.order.alert_message}}
Please leave it as it is.
It's a TradingView native variable that will fetch the alert text messages built by the script.
4) ProfitView doesn't use webhook technology, so setting a webhook URL from the alerts notifications tab is unnecessary.
KEY FEATURES
I) Modular Indicator Connection
* plug your existing indicator into the template.
* Only two lines of code are needed for full compatibility.
Step 1: Create your connector
Adapt your indicator with only 2 lines of code and then connect it to this strategy template.
To do so:
1) Find in your indicator where the conditions print the long/buy and short/sell signals.
2) Create an additional plot as below
I'm giving an example with a Two moving averages cross.
Please replicate the same methodology for your indicator, whether a MACD , ZigZag, Pivots , higher-highs, lower-lows or whatever indicator with clear buy and sell conditions.
//@version=5
indicator("Supertrend", overlay = true, timeframe = "", timeframe_gaps = true)
atrPeriod = input.int(10, "ATR Length", minval = 1)
factor = input.float(3.0, "Factor", minval = 0.01, step = 0.01)
= ta.supertrend(factor, atrPeriod)
supertrend := barstate.isfirst ? na : supertrend
bodyMiddle = plot(barstate.isfirst ? na : (open + close) / 2, display = display.none)
upTrend = plot(direction < 0 ? supertrend : na, "Up Trend", color = color.green, style = plot.style_linebr)
downTrend = plot(direction < 0 ? na : supertrend, "Down Trend", color = color.red, style = plot.style_linebr)
fill(bodyMiddle, upTrend, color.new(color.green, 90), fillgaps = false)
fill(bodyMiddle, downTrend, color.new(color.red, 90), fillgaps = false)
buy = ta.crossunder(direction, 0)
sell = ta.crossunder(direction, 0)
//////// CONNECTOR SECTION ////////
Signal = buy ? 1 : sell ? -1 : 0
plot(Signal, title = "Signal", display = display.data_window)
//////// CONNECTOR SECTION ////////
Important Notes
🔥 The Strategy Template expects the value to be exactly 1 for the bullish signal and -1 for the bearish signal
Now, you can connect your indicator to the Strategy Template using the method below or that one.
Step 2: Connect the connector
1) Add your updated indicator to a TradingView chart
2) Add the Strategy Template as well to the SAME chart
3) Open the Strategy Template settings, and in the Data Source field, select your 🔌Connector🔌 (which comes from your indicator)
Note it doesn’t have to be named 🔌Connector🔌 - you can name it as you want - however, I recommend an explicit name you can easily remember.
From then, you should start seeing the signals and plenty of other stuff on your chart.
🔥 Note that whenever you update your indicator values, the strategy statistics and visuals on your chart will update in real-time
II) BOT Risk Management:
- Max Drawdown:
Mode: Select whether the max drawdown is calculated in percentage (%) or USD.
Value: If the max drawdown reaches this specified value, set a value to halt the bot.
- Max Consecutive Days:
Use Max Consecutive Days BOT Halt: Enable/Disable halting the bot if the max consecutive losing days value is reached.
- Max Consecutive Days: Set the maximum number of consecutive losing days allowed before halting the bot.
- Max Losing Streak:
Use Max Losing Streak: Enable/Disable a feature to prevent the bot from taking too many losses in a row.
- Max Losing Streak Length: Set the maximum length of a losing streak allowed.
Margin Call:
- Use Margin Call: Enable/Disable a feature to exit when a specified percentage away from a margin call to prevent it.
Margin Call (%): Set the percentage value to trigger this feature.
- Close BOT Total Loss:
Use Close BOT Total Loss: Enable/Disable a feature to close all trades and halt the bot if the total loss is reached.
- Total Loss ($): Set the total loss value in USD to trigger this feature.
Intraday BOT Risk Management:
- Intraday Losses:
Use Intraday Losses BOT Halt: Enable/Disable halting the bot on reaching specified intraday losses.
Mode: Select whether the intraday loss is calculated in percentage (%) or USD.
- Max Intraday Losses (%): Set the value for maximum intraday losses.
Limit Intraday Trades:
- Use Limit Intraday Trades: Enable/Disable a feature to limit the number of intraday trades.
- Max Intraday Trades: Set the maximum number of intraday trades allowed.
Restart Intraday EA:
- Use Restart Intraday EA: Enable/Disable a feature to restart the bot at the first bar of the next day if it has been stopped with an intraday risk management safeguard.
III) Order Types and Position Sizing
- Choose between market, limit, or stop orders.
- Set your position size directly in the template.
Please use the position size from the “Inputs” and not the “Properties” tab.
I know it's redundant. - the template needs this value from the "Inputs" tab to build the alerts, and the Backtester needs it from the "Properties" tab.
IV) Advanced Take-Profit and Stop-Loss Options
- Choose to set your SL/TP in either pips or percentages.
- Option for multiple take-profit levels and trailing stop losses.
- Move your stop loss to break even +/- offset in pips for “risk-free” trades.
V) Miscellaneous
Retry order openings if they fail.
Order Types:
Select and specify order type and price settings.
Position Size:
Define the type and size of positions.
Leverage:
Leverage settings, including margin type and hedge mode.
Session:
Limit trades to specific sessions.
Dates:
Limit trades to a specific date range.
Trades Direction:
Direction: Specify the market direction for opening positions.
VI) Notifications (Telegram/Discord/Email/IFTTT/Twilio/SMS)
Customize notifications sent to Telegram, Discord, Email, IFTTT, Twilio, and ProfitView Logger.
VII) Logger
The ProfitView commands are logged in the TradingView logger.
You'll find more information about it in this TradingView blog post .
WHY YOU MIGHT NEED THIS TEMPLATE
1) Transform your indicator into a ProfitView trading bot more easily than before
Connect your indicator to the template
Create your alerts
Set your EA settings
2) Save Time
Auto-generated alert messages for ProfitView.
I tested them all and checked with the support team what could/couldn’t be done.
3) Be in Control
Manage your trading risks with advanced features.
4) Customizable
Fits various trading styles and asset classes.
REQUIREMENTS
* Make sure you have your ProfitView account and do the settings correctly in your Chrome extension. If you don't know how to do it, read the documentation + ask for help in the ProfitView Discord support channel.
* If there is any issue with the template, ask me in the comments section - I’ll answer quickly.
BACKTEST RESULTS FROM THIS POST
1) I connected this strategy template to a dummy Supertrend script.
I could have selected any other indicator or concept for this script post.
I wanted to share an example of how you can quickly upgrade your strategy, making it compatible with ProfitView.
2) The backtest results aren't relevant for this educational script publication.
I used realistic backtesting data but didn't look too much into optimizing the results, as this isn't the point of why I'm publishing this script.
This strategy is a template to be connected to any indicator - the sky is the limit. :)
3) This template is made to take 1 trade per direction at any given time.
Pyramiding is set to 1 on TradingView.
The strategy default settings are:
* Initial Capital: 100000 USD
* Position Size: 1%
* Commission Percent: 0.075%
* Slippage: 1 tick
* No margin/leverage used
Best regards,
Dave
