CandelaCharts - Session Opening📝 Overview
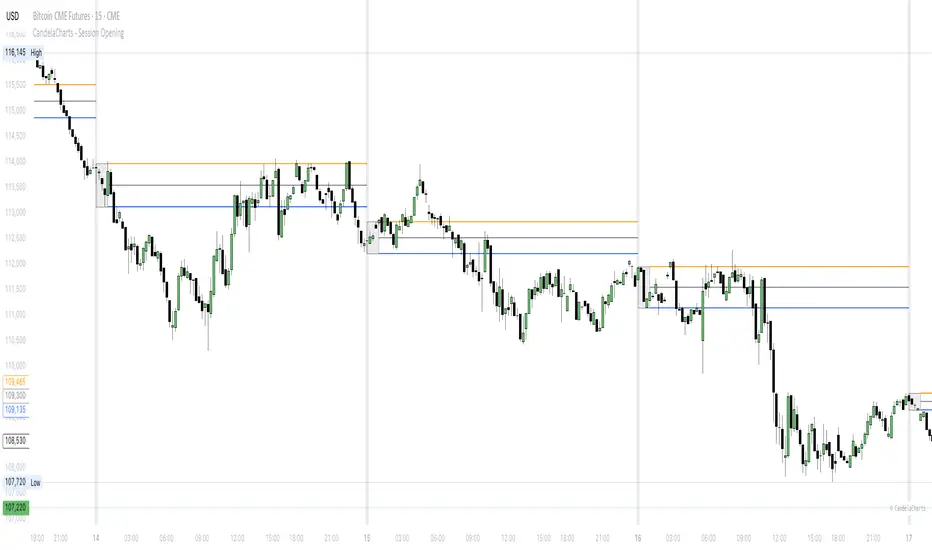
The CandelaCharts – Session Opening indicator highlights a custom session window, builds the live high/low as the session unfolds, and then publishes finalized Range High , Range Low , and Consequent Encroachment (Mid) levels once the window closes. A subtle one‑bar divider marks each new session start, and a shaded box visualizes the evolving range while the session is active.
📦 Features
Discover the core tools this indicator provides—from live range tracking to post‑session levels and alerts.
Custom Session Window – Track any intraday opening window you define (e.g., 09:00–10:00).
Timezone Control – Align sessions precisely with your market using selectable timezones (e.g., America/New_York, GMT±X).
Live Session Box – A translucent box expands in real time as highs/lows update during the session.
Post‑Session Levels – Finalized Range High , Range Low , and CE (Mid) lines print only after the session completes to avoid interim noise.
Session Divider – A one‑bar background tint clearly marks the first bar of each session.
Alerts – Receive notifications at session start and end.
⚙️ Settings
Configure timing, timezone alignment, visuals, and toggles to match your market and workflow.
Session – Defines the specific time range for the session window (e.g., 0900-1000). During this window the indicator tracks the running high/low.
Timezone – Specifies the timezone used to interpret the session window, ensuring alignment with exchange hours.
Colors – Selects the colors for Range High (Up), Range Low (Down), and the session Background box/divider.
Session Range – Shows the finalized Range High/Low/Mid lines outside of the session; lines appear starting one bar after the session closes.
Session Dividers – Enables the one‑bar background tint on the session’s first bar.
⚡️ Showcase
Preview a simple chart example with Session Opening applied.
🚨 Alerts
Set notifications for key moments: when a session begins and when it ends.
Session Start : Triggers on the first bar inside the configured session window.
Session End : Triggers on the first bar after the session window closes.
⚠️ Disclaimer
This section clarifies the risks and intended use.
Trading involves significant risk, and many participants may incur losses. The content on this site is not intended as financial advice and should not be interpreted as such. Decisions to buy, sell, hold, or trade securities, commodities, or other financial instruments carry inherent risks and are best made with guidance from qualified financial professionals. Past performance is not indicative of future results.
Cerca negli script per "session"
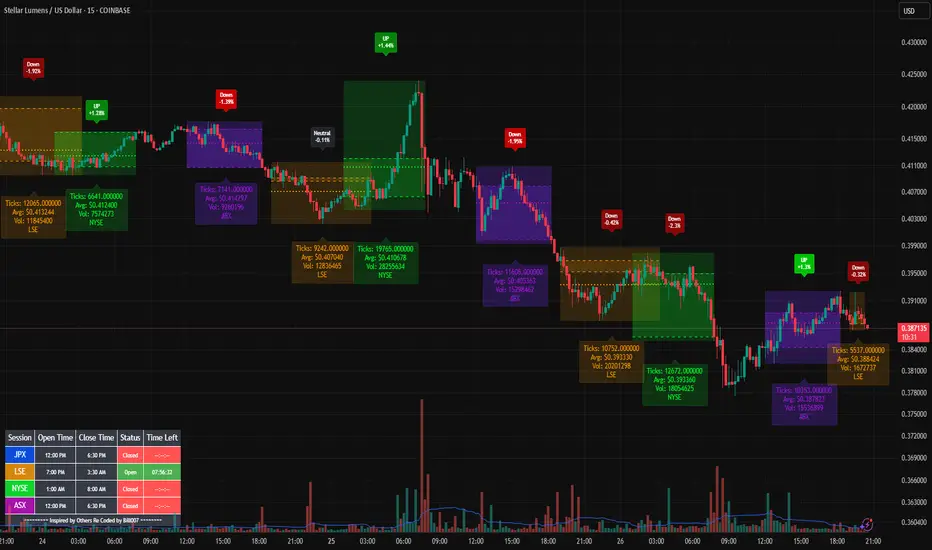
Bills Advanced Market Sessions V5Bill007 Advanced Enhanced Market Sessions & Table V5 is a TradingView Pine Script indicator that
visualizes major stock market sessions and data for (Tokyo, London, New York, Sydney, Frankfurt) on charts.
**Purpose and Logic:**
- Visual Displays include session boxes, open/close/average lines, labels for session
names/metrics (ticks, avg price, volume), and trend labels (UP/Down/Neutral with % change)
and a Debug table.
- Uses custom types (SessionDisplay, SessionInfo) and methods to create/update sessions
dynamically, handling multi-part sessions (e.g., Tokyo breaks).
- Batch updates sessions for efficiency, checks timezones, weekdays, and daily changes to avoid
duplicates.
- Includes tables for session times/status/countdowns and debug metrics (tick range, average
price, volume, trend %, open, close).
- Supports 25 timezones for accurate global session timing.
- All labels have dynamaic tooltips that provide extra outputs which saves chart clutter
- Realtime lastbar session updates for current session
**Settings:**
- Select Market Sessions to suit
- Toggles for lines, ranges, averages, volumes, labels, boxes, weekends.
- Customizable colors, timezones, session times, thresholds for neutral trends, label offsets to
move labels around for clearer visuals.
- Table position/timezone, debug options.
- Timezone select to update Session times open close according to what time zone you're in
**Benefits:**
- Enhanced session data at a glance
- Enhances multi-market awareness, highlights session overlaps, trends, and key metrics.
- Aids timing entries/exits, volume analysis, reduces clutter with toggles.
- Supports global trading strategies with accurate timezone handling and visuals.
ORB + Key Session Levels (QC)Overview
A comprehensive session-based levels indicator that plots Opening Range Breakout (ORB) levels alongside key session highs and lows from Asian, London, and New York trading sessions.
Features
• Opening Range Breakout (ORB) with configurable duration (5m/15m/30m/1hr/custom)
• Previous Day High/Low with two modes: RTH Only (9:30-4:00 ET) or Full Session (6pm-5pm ET for futures)
• Asian, London, NY AM, and NY PM session levels
• Kill Zones mode (non-overlapping) vs Full Sessions mode
• Fair Value Gap detection with optional mitigation removal
• HTF Bias dashboard showing market structure
• Lines extend from the exact candle where highs/lows occurred
• Alerts for all level breaks
Kill Zone Defaults (ET)
• Asian: 8:00 PM - 12:00 AM
• London: 2:00 AM - 5:00 AM
• NY AM: 8:30 AM - 11:00 AM
• NY PM: 1:30 PM - 4:00 PM
How To Use
1. Select Session Mode (Kill Zones or Full Sessions)
2. Choose PDH/PDL Source (RTH for equities, Full Session for futures)
3. Customize session times as needed
4. Set up alerts for level breaks
All times are in Eastern Time (ET) and fully customizable.
This indicator is for educational purposes only. Not financial advice.

Market SessionsMarket Sessions (Asian, London, NY, Pacific)
Summary
This indicator plots the main global market sessions (Asian, European, American, Pacific) as boxes on your chart, complete with dynamic high/low tracking.
It's an essential tool for intraday traders to track session-based volatility patterns and visualize key support/resistance levels (like the Asian Range) that often define price action for the rest of the day.
Who it’s for
Intraday traders, scalpers, and day traders who need to visualize market hours and session-based ranges. If your strategy depends on the London open, the New York close, or the Asian range, this script will map it out for you.
What it shows
Customizable Session Boxes: Four fully configurable boxes for the Asian, European (London), American (New York), and Pacific (Sydney) sessions.
Session High & Low: The script tracks and boxes the highest high and lowest low of each session, dynamically updating as the session progresses.
Session Labels: Clear labels (e.g., "AS", "EU") mark each session, anchored to the start time.
Key Features
Powerful Timezone Control: This is the core feature.
Use Exchange Timezone (Default): Simply enter session times (e.g., 8:00 for London) relative to the exchange's timezone (e.g., "NASDAQ" or "BINANCE").
Use UTC Offset: Uncheck the box and enter a UTC offset (e.g., +3 or -5). Now, all session times you enter are relative to that specific UTC offset. This gives you full control regardless of the chart you're on.
Fully Customizable: Toggle any session on/off.
Style Control: Change the fill color, border color, transparency, border width, and line style (Solid, Dashed, Dotted) for each session individually.
Smart Labels: Labels stay anchored to the start of the session (no "sliding") and float just above the session high.
Why this helps
Track Volatility & Market Behavior: Visually identify the "personality" of each session. Some sessions might consistently produce powerful pumps or dumps, while others are prone to sideways "chop" or accumulation. This indicator helps you see these repeating patterns.
Find Key Support/Resistance Levels: The High and Low of a session (e.g., the Asian Range) often become critical support and resistance levels for the next session (e.g., London). This script makes it easy to spot these "session-to-session" S/R flips and reactions.
Aid Statistical Analysis: The script provides the core visual data for your statistical research. You can easily track how often the London session breaks the Asian high, or which session is most likely to reverse the trend, helping you build a robust trading plan.
Context is King: Instantly see which market is active, which are overlapping (like the high-volume London-NY overlap), and which have closed.
Quick setup
Go to Timezone Settings.
Decide how you want to enter times:
Easy (Default): Leave Use Exchange Timezone checked. Enter session times based on the chart's native exchange (e.g., for BTC/USDT on Binance, use UTC+0 times).
Manual (Pro): Uncheck Use Exchange Timezone. Enter your UTC Offset (e.g., +2 for Berlin). Now, enter all session times as they appear on the clock in Berlin.
Go to each session tab (Asian, European...) to enable/disable it and set the correct start/end hours and minutes.
Style the colors to match your chart theme.
Disclaimer
For educational/informational purposes only; not financial advice. Trading involves risk—manage it responsibly.

Trading Session Highs and LowsTrading Session Highs and Lows
This script provides an intuitive way to visualize key market levels from major trading sessions: Asia, London, New York, and New York Close. By automatically plotting the high and low of each session, it helps traders quickly identify important price levels that could impact market behavior.
Features include:
Session Marking: The script marks the high and low for each major session (Asia, London, New York, and New York Close).
Customizable Lines and Labels: You can adjust the line style, width, and color for each session’s high/low markers. The session name (e.g., "London", "New York") and the PDH/PDL (Prior Day High and Low) are also shown to give clear context.
Real-Time Updates: The levels are updated in real-time to reflect the current price action, helping you gauge price movement throughout the trading day.
Customizable Indicators: Easily adjust the visibility of the different sessions and the labels to focus on the session that matters most to your trading strategy.
This tool is designed to help day traders spot important levels for potential breakouts or reversals, making it easier to base your trading decisions on well-established price points. Ideal for scalpers, swing traders, and anyone who trades across multiple sessions.

Session OHLC Statistical MappingSession OHLC Statistical Mapping — Mean/Median Price Zones (Percent-Normalized)
Session OHLC Statistical Mapping plots statistically derived price zones around a session’s Open using historical behavior of that same session on a higher “mapping” timeframe (15m / 1H / 4H / Daily / Weekly).
It is designed to answer a simple question:
“Based on historical sessions, how far does price typically displace away from the open — and how far does it typically manipulate against it?”
Instead of using fixed ATR or arbitrary ranges, this tool builds zones from real distribution data collected from previous sessions, using Mean / Median / Both and optional robust estimators (including Power Mean).
What the levels mean
The indicator draws five core levels (or zones when Mean+Median are shown together):
OPEN (O) — The anchor of the session.
+DIS — “Displacement” in the direction of the session’s move (typical expansion away from open).
-DIS — Displacement on the opposite side (symmetrical reference).
-MAN — “Manipulation” zone above open (often where price runs stops/liq before moving).
+MAN — Manipulation zone below open.
DIS vs MAN logic (per historical candle):
If the session candle is bullish:
DIS = High − Open
MAN = Open − Low
If the session candle is bearish:
DIS = Open − Low
MAN = High − Open
That means DIS captures directional expansion and MAN captures the typical counter-move or wick against the open.
Why Percent Mode matters (important for multi-asset trading)
This indicator supports Points and Percent modes.
Points mode is direct and works well when your instrument is stable in price scale.
Percent mode normalizes distances by the historical session open:
𝑟
𝑖
=
𝑑
𝑖
𝑠
𝑡
𝑎
𝑛
𝑐
𝑒
𝑖
𝑜
𝑝
𝑒
𝑛
𝑖
×
100
r
i
=
open
i
distance
i
×100
Then the statistic is computed on
𝑟
𝑖
r
i
, and converted back to points using the current session open.
✅ Percent mode is usually the best choice when you trade multiple instruments (Gold, indices, FX, crypto) or when price levels change over time, because it keeps the zones comparable across regimes.
Mean vs Median (and why “Both” is powerful)
Median represents the “typical” session behavior and is more resistant to outliers.
Mean reflects the average including rare but large expansions (fat tails).
If you select Both, the indicator draws a zone between mean and median, which effectively becomes a distribution band.
Practical interpretation:
Median area = common/expected range
Mean extension = “higher probability tail events” / stretched sessions
This is especially useful in volatile markets where occasional big days pull the mean away from the median.
Robust averaging (Power Mean, RMS, EMA)
Markets often have non-normal distributions (skew, fat tails). Standard arithmetic mean can be influenced heavily by rare extreme sessions. This script allows alternative estimators:
Power Mean (p > 1): increases sensitivity to larger values in a controlled way (useful when you want zones that respect occasional expansions without fully jumping to outlier extremes).
RMS: strongly weights larger moves.
EMA: prioritizes recent behavior (good when volatility regime changes quickly).
These options let you match the zones to how the market actually behaves instead of assuming a perfect bell curve.
How to use it in trading
1) Intraday bias around the Open
If price holds above OPEN, you can treat upside zones as the primary magnet (+MAN → +DIS).
If price holds below OPEN, downside zones matter more (+MAN → -DIS).
2) Targets and take-profit mapping
A simple structured approach:
First target: nearest MAN zone
Second target: DIS zone
Extended target: mean/median extremes (if “Both” is enabled)
3) Rejection / reversal zones
MAN zones often behave like “liquidity sweep” regions:
Price runs into a MAN zone, wicks, and returns through OPEN → reversal potential.
Price enters a DIS zone and stalls → partial take profit or tighten stops.
4) Session-to-session context
Because zones are drawn for historical sessions, they can act like:
daily/weekly range expectations
contextual “where price should struggle”
systematic reference levels for day structure
Best markets to use this on
This indicator is built for anything liquid and session-driven, including:
Futures (ES, NQ, YM, CL, GC, etc.)
Great for mapping daily/4H session expansions and where stop-runs occur.
Gold (XAUUSD / GC)
Percent mode helps because gold moves in changing volatility regimes.
Forex (EURUSD, GBPUSD, USDJPY, etc.)
Percent normalization is ideal for FX pairs and long historical comparisons.
Crypto (BTC, ETH)
Works well with EMA or Power Mean when volatility shifts frequently.
Tips for best results
Start with Mapping TF = Daily, Lookback = 60.
Use Percent mode if you compare different assets or time periods.
Use Both (Mean+Median) to see distribution width and avoid overconfidence in a single number.
Use Power Mean (p ≈ 1.4–1.8) if arithmetic mean feels too tight or too distorted by outliers.
Combine with structure: previous highs/lows, session highs/lows, and rejection candles.
What this indicator is not
It does not predict direction by itself.
It’s a statistical mapping tool: it tells you where price typically expands and where it often “manipulates” around the session open.
Your edge comes from combining these zones with confirmation (market structure, orderflow, volume, candlesticks, etc.).

Session Overlaps & KZ's @MaxMaseratiSession Overlap & KZ's @MaxMaserati - Indicator Explanation
This comprehensive trading session indicator specializes in identifying critical market overlap periods and key session levels with two main operating modes: Normal Sessions and ICT KZ's
Dual Session Modes:
- Normal Sessions: Extended timeframes (Asia 9PM-6AM, London 3AM-12PM, NY AM 8AM-5PM, NY PM 1-7PM)
- ICT Killzones: Focused timeframes (Asia 6-8PM, London 2-5AM, NY AM 9:30-11AM, NY PM 1:30-4PM)
Primary Focus - Market Overlap Sessions:
- Asian + London Overlap (3-6AM ET): The most volatile early morning period when Asian and London markets intersect, creating significant liquidity and price movement opportunities.
- London + NY Overlap (8AM-12PM ET): The highest volume trading window of the day when London and New York markets are simultaneously active, offering maximum institutional activity and trend continuation.
- London Solo (6-8AM ET): Pure London trading period after Asian close but before NY open, often used for trend establishment and key level testing.
- NY Solo (12-5PM ET): Isolated New York session after London close, typically showing strong directional moves and institutional positioning.
- NY AM + PM Overlap (1:30-4PM ET): Critical afternoon overlap period when morning and afternoon NY sessions intersect, often marking significant reversal or continuation points.
Session Level Analysis:
Tracks High, Low, and Midpoint levels for each active session and overlap period
Smart line extension that continues levels until price interaction
Visual session boxes with customizable transparency
Show Only Overlaps mode to focus purely on market intersection periods
Critical Time Markers:
9:30 AM: NY AM Open (green dot)
5:00 AM: MMM Foundational time for MMM trading strategies (blue dot)
1:30 PM: NY PM Open (orange dot)
Additional Features:
Previous Day High/Low (PDH/PDL) levels
Multi-timezone support
Session limit control (last 3 sets by default)
Optimized for 15-minute and lower timeframes
Full customization of colors, labels, and styles
This indicator is essential for overlap-based trading strategies, providing clear visual identification of high-probability windows when multiple markets create enhanced liquidity and institutional activity.

Multi-Session MarkerMulti-Session Marker is a flexible visual tool for traders who want to highlight up to 10 custom trading sessions directly on their chart’s background.
Custom Sessions: Enter up to 10 time ranges (in HHMM-HHMM format) to mark any market session, news window, or personal focus period.
Visual Clarity: For each session, toggle the highlight on or off and select a unique background color and opacity, making it easy to distinguish active trading windows at a glance.
Universal Time Handling: Session times automatically follow your chart’s time zone—no manual adjustment required.
Efficient and Fast: Utilizes TradingView’s bgcolor() for smooth performance, even on fast timeframes like 1-second charts.
Clean Interface: All session controls are grouped for easy editing in the indicator’s settings panel.
How to use:
In the indicator settings, enter your desired session times (e.g., 0930-1130) for each session you want to highlight.
Toggle “Show Session” and pick a color for each session.
The background will automatically highlight those periods on your chart.
This indicator is ideal for day traders, futures traders, or anyone who wants to visually segment their trading day for better focus and analysis.

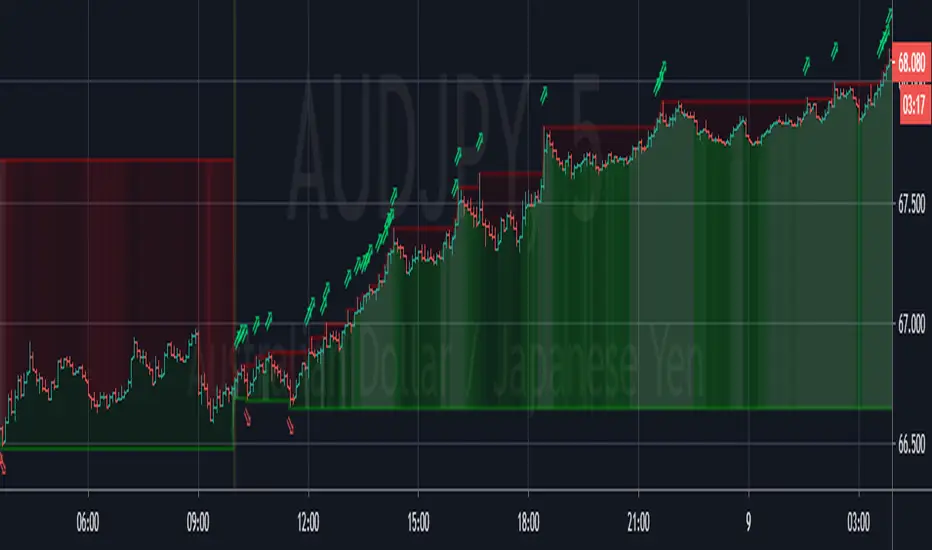
[Zekis]Opening Range Higher High Lower Low Forex SessionsOpening Range Higher High Lower Low Forex Sessions
Very useful for session trading, the opening range will reset when new session is start and will plot new higher highs and new lower lows until the end of the session.
Ability to change between 3 opening sessions:
* London - opens at 3:00 am EST
* New York - opens at 8:00 am EST
* Tokyo - opens at 7:00 pm EST
* New day - GMT +0
Green arrow - new higher high
Red arrow - new lower low
Green background - the strength of the bullish trend
Red background - the strength of the bearish trend
(the lighter the color, the stronger the trend)
Enjoy!
@zekis
Apex Wallet - Opening Range Breakout (ORB) & Session LevelsOverview The Apex Wallet Opening Range Breakout (ORB) is a professional intraday tool designed to capture the volatility of the first minutes of the trading session. By defining a clear range at the market open, this indicator provides traders with high-probability breakout levels and psychological targets based on mathematical extensions of the initial move.
Core Mechanics
Customizable Session: Easily define your preferred opening range duration (e.g., first 5, 15, or 30 minutes) and session start time.
Dynamic Timezone Adjustment: Includes a built-in UTC offset feature to ensure session times align perfectly with your local market, regardless of where you are trading from.
Automated Level Tracking: The script automatically identifies and locks the high and low of the specified opening period.
Key Features:
Psychological Mid-Lines: Calculates the 50% median of the range (ORB Mid) as a pivot point for trend strength.
Advanced Volatility Extensions: Plots internal and external targets (High+Mid, Low+Mid) to identify potential exhaustion zones or secondary breakout levels.
Intraday Optimization: Designed specifically for low-timeframe traders (1m to 15m) looking for clear execution zones at the bell.
How to use: Wait for the opening range to be established. A breakout above the ORB High often indicates bullish dominance, while a break below the ORB Low suggests bearish momentum. Use the internal extension lines as take-profit targets or areas to move your stop-loss to breakeven.

MRG Session High/LowMRG Session High/Low - Indicator Description
📊 Overview
This Pine Script indicator automatically displays key levels from Asian and London trading sessions on your TradingView chart. It plots the high and low points of each completed session, allowing you to quickly identify important support and resistance zones for your trades.
🎯 Key Features
Detected Sessions (New York Timezone)
Asian Session: 18:00 - 03:00 (6pm - 3am)
London Session: 03:00 - 09:00 (3am - 9.30am)
Plotted Levels
Session High: The highest point reached during the session
Session Low: The lowest point reached during the session
Start Lines: Vertical dashed lines marking the beginning of each session (optional)
⚙️ Customizable Settings
Display Options
✅ Show/hide Asian Session
✅ Show/hide London Session
✅ Show/hide session start lines
Style Options
🎨 Asian Color: Orange by default
🎨 London Color: Blue by default
🎨 Start lines color: Red by default
📏 Line thickness: Adjustable from 1 to 5
🔍 How It Works
Automatic Detection: The indicator automatically detects when a new session begins
Level Calculation: During each session, it continuously records highs and lows
Line Plotting: At the end of each session, it draws two horizontal lines:
One line at the session high level
One line at the session low level
Extension: Lines extend to the right for easy future identification
📈 Strategic Usage
For Breakout Trading
Trade breakouts of Asian and London session highs/lows
Breakouts from these levels often signal the beginning of significant moves
For Support and Resistance
Use these levels as key support and resistance zones
Prices often come back to test these levels during the New York session
For Multi-Timeframe Analysis
Identify consolidation during Asian/London sessions
Anticipate volatility at New York open
💡 Advantages
✨ Clear and automatic visualization of session levels
⏱️ Time-saving: no need to manually draw levels
🎯 Precise levels based on actual highs/lows of each session
🔄 Automatically updates daily
📱 Compatible with all timeframes (recommended: M5, M15, H1)
🎓 Ideal For
Forex traders (especially XAUUSD, EUR/USD, GBP/USD)
Scalpers and day traders
Session breakout strategies
Trading around New York open
Liquidity zone analysis
📌 Important Note
The indicator uses New York timezone (America/New_York) to ensure session time accuracy, regardless of your local timezone.

Mark SessionsDisplays trading sessions in a very flexible way.
The main intention of this indicator is to give a way to display market sessions with your own style preferences and expectations and achieve cleanness of your chart.
This indicator allows to show up to 6 sessions plus day session. Time range of the sessions are set in timezone you choose. Mostly all settings can be set in one place and be inherited by all sessions. And of course after settings inheritage you still have a way to make session setting exceptions without changing others.
You can adjust any borders of the session to show, background to show, adjust labels attachment target and their alignments, change the color of sessions, and line styles. All of those settings can turn session picture in any presentation you like.
Enjoy and I'm open to hear your advices

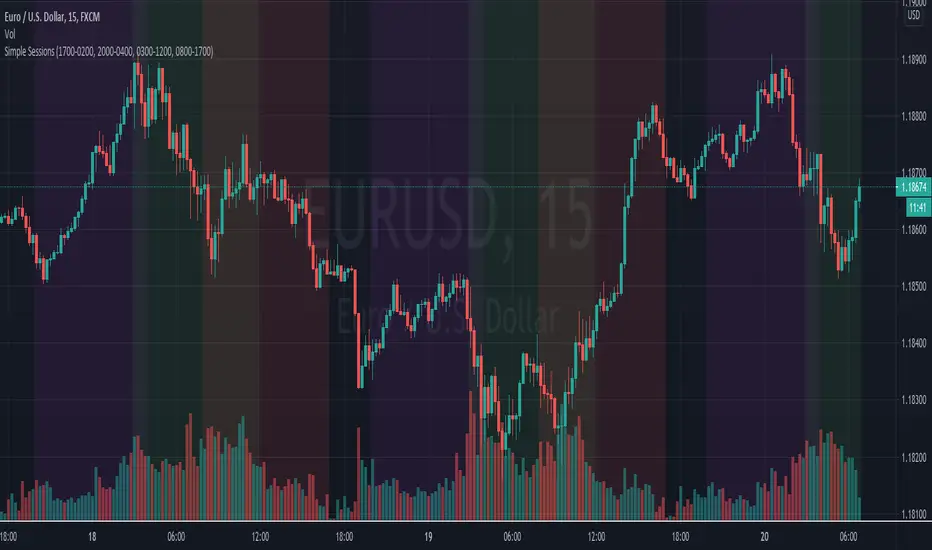
Simple Sessions## Background ##
Simple Sessions is based on the very awesome "Sessions on Chart" by Aurocks_AIF.
I really liked how the background colours worked but wanted to simplify it by removing some parts that I didn't use. I then simplified much of the code, put it into my standard template format and re-published. Hopefully the code is a bit cleaner and easier to read now.
## Usage ##
The default indicator shows the following sessions:
* Sydney in Navy
* Tokyo in Purple
* London in Green
* New York in Red
The good news is that using Green and Red for London and New York, gives a nice distinct yellow for the overlapping sessions. Sydney and Tokyo are by in similar colors by design.
By default, only London and New York show, but you may turn on Sydney and Tokyo in the settings.
## Use, Share, Like, etc #
Have fun!
-- chilts
Forex/Crypto/Custom Market SessionsCredit goes to TradeMasterSavis for providing the original code
I merge the 2 sessions together allowing you to toggle between the two. I also add a 3rd custom session type and the ability to change the duration of each trading session. This would solve any problems ran into the case of Daylight savings time switch or if you just want different session duration.

Forex Trade Sessions / Zones + Next Session VisibleAllows User To See Next Session.
Contains all 5 Forex Sessions: New York, London, Frankfurt, Asia (Tokyo), Sydney
Warning! A little buggy on smaller time frames like the 5 minute. 15 minute seems to work fine!

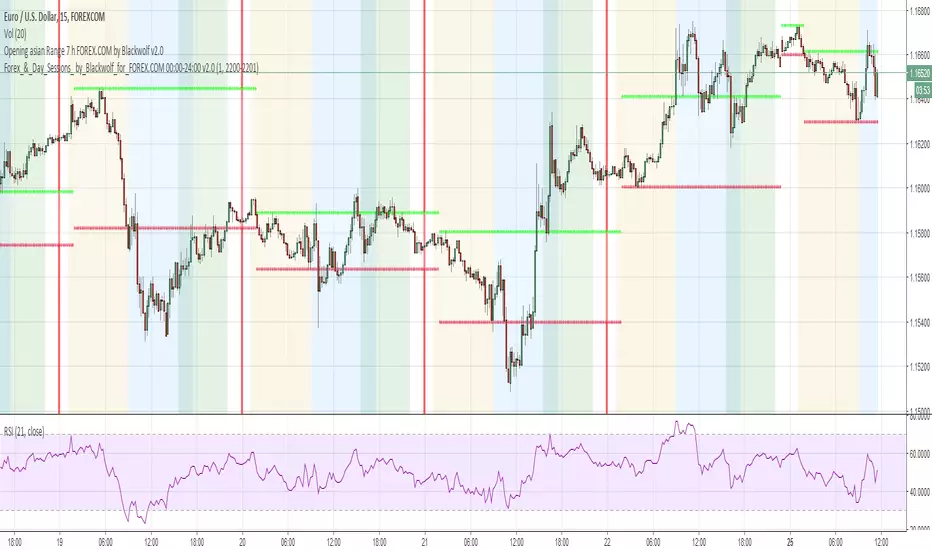
Forex-&-Day-Sessions-By Blackwolf for FOREX.COM 00:00-24:00 v2.0Script for Broker FOREX.COM for the correct midnight hour
It shows a vertical line at midnight of every day.
It also marks with different colors three daily sessions: Asia, Europe and America
The time zone is for Rome
Script da utilizzare con broker FOREX.COM per la correttezza e la corrispondenza automatica della mezzanotte
Lo script segna automaticamente delle linee verticali in corrispondenza della mezzanotte dal lunedì al venerdì in modo da definire chiaramente l'inizio e la fine della giornata.
Inoltre le sessioni di trading giornaliere Asia, Europa, America vengono evidenziate con delle fasce colorate per definire le diverse sessioni di mercato.
Lo script ha come orario di base il fuso West America ed è già stato preimpostato per avere la corrispondenza esatta con l'orario di Roma (US 18.00 = Roma 00.00)
Hodie Smart Trading SessionsHodie Smart Trading Sessions is a professional trading sessions indicator designed to accurately visualize active market periods on the chart, with full support for time zones and daylight saving time.
The indicator helps traders clearly see when the market is most liquid, where impulses, accumulation and key movements occur — especially useful for intraday trading and Smart Money concepts.
Key Features
1. Flexible Session Display Modes
You can choose between three display modes:
Boxes — highlight the full price range of the session
Vertical Lines — mark session open and close
Boxes + Lines — combined mode
Additional options:
show session name above the box
line styles: solid, dashed, dotted
2. Up to 5 Custom Trading Sessions
You can configure up to 5 independent sessions:
custom name (Tokyo, London, New York, etc.)
session local time
time zone (IANA / GMT / UTC)
individual colors for each session
Works perfectly for:
Forex sessions
Crypto markets
Stock exchanges
Personal trading windows
3. Advanced Time Zone Support
Supports:
IANA time zones (Europe/London, America/New_York, etc.)
GMT / UTC formats (GMT+3, UTC)
When using IANA:
daylight saving time is handled automatically
real exchange offsets are respected
4. Smart Active Sessions Table
Optional compact table on the chart:
shows all enabled sessions
highlights the currently active one
customizable position: top/bottom, left/right
customizable background and highlight colors
Perfect for quick context:
"Which session is active right now?"
5. Timeframe Filter
You can limit the indicator to work only up to:
1h
2h
4h
On higher timeframes:
sessions are hidden
the table is disabled
Keeps higher TF charts clean and focused.
6. Gap Protection
The indicator automatically disables drawing if:
large time gaps between bars are detected
(illiquid markets, broken data, etc.)
Who Is This For?
Hodie Smart Trading Sessions is ideal for:
intraday traders
scalpers
Smart Money / ICT traders
liquidity-based strategies
session-based trading models
Typical Use Cases
London open volatility
New York impulse trading
filtering low-liquidity periods
Asian session accumulation
time-based trade planning
Hodie Philosophy
This indicator is part of the Hodie Smart ecosystem — focused on conscious trading, where:
time = context, and context = edge.

Golden Session ORB - Execution & Visualization Tool🎯 Optimize Your Execution with Golden Session ORB
The Golden Session ORB is a technical execution tool designed for traders who specialize in Opening Range Breakouts. Its primary goal is to provide a clean, professional visualization of liquidity levels across the three most critical trading sessions: Asia (18:00), NYC Pre-Market (08:00), and the Wall Street Open (09:30).
This script is not an automated signal system. It is a decision-support tool that manages range levels and visual structure, allowing the trader to focus exclusively on price action analysis and high-quality execution.
⏱️ Recommended Timeframes For optimal performance and precise box formation, this indicator should be used on:
1 Minute (1m): Ideal for observing the fine details of range formation and breakout precision.
15 Minutes (15m): Ideal for a clearer structural perspective of the session’s development.
💎 Key Features:
Automatic Multi-Session Structure: Automatically identifies and plots support and resistance levels from the opening minutes of each session.
Dynamic Extended Boxes: Ranges project forward automatically to help you identify key supply and demand zones throughout the day.
"Intention Candle" Visual Aid (Optional): The script highlights candles that show a confluence of volume and trend alignment (EMAs).
Note: These highlighted candles are NOT buy/sell alerts. They are a visual guide to help you identify moments of potential interest based on your own criteria.
📊 Backtesting & Risk Management This tool is perfect for manual backtesting, allowing you to study how price historically reacts to each session's levels.
Trading Recommendation: While opening range breakouts can lead to massive expansions, markets remain volatile. It is highly recommended to secure partial profits during the move and actively manage your risk to protect your capital from sudden price reversals.

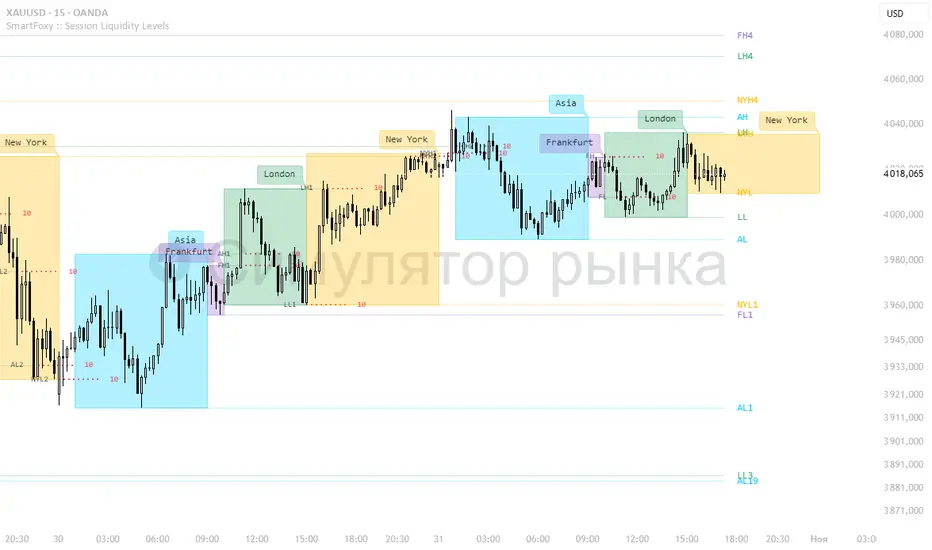
Killzone Session High/Low Levels [SmartFoxy]Killzone Session High/Low Levels
The Killzone Session High/Low Levels indicator by SmartFoxy provides a complete intraday framework for understanding session-based liquidity, market structure rotation, and breakout behavior across global trading sessions.
It automatically plots the High/Low ranges for each selected session, highlights session killzones, and tracks breakout events with optional alerts.
This tool is designed for traders who rely on session dynamics (Asia, Frankfurt, London, New York) to identify liquidity targets, sweep zones, key ranges, and continuation/reversal opportunities.
________________________________________
How It Works
The indicator detects the active trading sessions for each day and builds structural High/Low ranges for them:
• Asia Session Range (High/Low);
• Frankfurt Session Range;
• London Session Range;
• New York Session Range;
• Optional custom session (NY Open, or any killzone).
For each session, the script can display:
• Session box or column;
• High/Low levels;
• Labels for every range (H/L);
• True session boundaries using user-defined timezone;
• Auto-extended levels up to the latest candle;
• Break levels after a breakout;
• Conditional removal or recoloring after a level is breached.
This gives traders a clean visual map of session liquidity and how price interacts with it throughout the day.
________________________________________
Key Features
1. Multiple Global Sessions •➤ Asia, Frankfurt, London, New York, plus one custom session for advanced killzone mapping.
2. Session High/Low Liquidity Levels •➤ Automatic plotting of every session’s High and Low, with optional labels and price markers.
3. Session Boxes or Columns •➤ Two display modes allow traders to visualize the session either as a filled box or a clear vertical column.
4. Breakout Logic & Temporary Levels .
When price breaks a session High/Low:
• Levels can be extended for a selected number of bars
• Or removed instantly after a breakout
• Or recolored to highlight the sweep event
This enables clean identification of liquidity grabs, breakouts, and continuation setups.
5. Alerts for Session Breakouts .
Set alerts when price breaks:
• Any session level
• Only levels formed on the current day
Perfect for traders who want real-time notifications of sweeps or key structure breaks.
6. Full Customization
You can configure:
• Session times;
• Timezone;
• Colors;
• Labels;
• Line styles and widths;
• Breakout behavior;
• Killzone range handling.
Everything is adjustable to match any trading style.
________________________________________
How to Use
1. Enable the sessions you want to track •➤ Asia, Frankfurt, London, New York, or custom.
2. Choose display mode
Box mode for visual range blocks;
Column mode for clean vertical alignment.
3. Enable High/Low Levels .
These act as liquidity magnets and key rejection zones.
4. Turn on Breakout Levels (optional)
Useful for spotting sweeps and continuation setups.
5. Turn on Alerts if you want notifications when price breaks levels.
6. Use session levels as liquidity reference points .
They work exceptionally well with smart money concepts (SMC), ICT, and intraday structure analysis.
________________________________________
Why This Indicator Is Useful
Shows exactly where liquidity is placed each session;
Highlights market structure transitions as sessions hand over control;
Helps identify stop hunts, sweeps, reversals, and continuation patterns;
Provides real-time alerts for structural breaks;
Organizes the chart and reduces noise;
Works with any intraday timeframe and any market.
This makes it valuable for scalpers, day traders, and SMC/ICT-style analysts.
________________________________________
Summary
Killzone Session High/Low Levels delivers a complete, highly customizable intraday mapping system based on global trading sessions.
It clarifies the session structure, reveals liquidity targets, and empowers traders to make confident trading decisions using clean, objective market data.
Weekly Session BreakThis indicator plots a vertical line at the end of the trading week (Friday) to mark the weekly session break. It is designed to be used on intraday charts (sub-1 hour timeframes).
The line's appearance is fully customizable via the Inputs tab, allowing you to change its color, style (solid, dotted, or dashed), and thickness.
Key Features:
End-of-Week Marker: Accurately draws a vertical line on the last bar of the trading week.
Timeframe Specific: Lines are only visible on intraday charts (1-minute to 59-minute timeframes) to prevent clutter on higher timeframes.
Customizable: Adjust the line's color, style, and thickness from the Inputs menu.

ICT Sessions & Killzones +PRO (VinceFxBT)ICT Sessions & Killzones +PRO (VinceFxBT)
All in one Session and Killzone script for FX, Futures and Crypto markets. It includes London, New York, CBDR & Asia Sessions and Killzones.
Features
Includes London, New York, Asia, CBDR sessions
Includes all ICT Killzones
Extended session highs/lows up to 90s back, until mitigated.
Set recurring alerts for session highs and lows
Includes Indices price levels and opens
Uses UTC timezones with automatic Daylight Saving Time so NO timezone correction needed ; ) Works out of the box for all regions, including different dates of DST for US/EU.
Session highs/lows displayed on chart as lines, box or background color
Customize line styles, width and colors
Customize colors for Sessions and Killzones
Optionally include weekends for Session or Killzone separately
Optionally display day separators and labels
Fully control which options are displayed at higher or lower timeframes. (e.g. hide sessions when timeframe is 1h or higher)
Session display options
Session Background Color.
Session High & Low Lines, including Session Middle Line.
Extended session highs/lows until mitigated
Extended Session Highs & Lows until mitigated.
Session Background Color with extended Asia Session Highs & Lows until mitigated.
Set recurring alerts for session highs and lows
Set automatic alerts when previous and/or current session levels are broken.

Session Lines# Session Lines Indicator
A powerful trading session visualization tool designed to help traders track and identify key market sessions across different time zones. This indicator draws vertical lines at the opening times of major trading sessions, making it easier to spot potential trading opportunities at session transitions.
## Key Features
1. **Multi-Session Support**
- Asian Session (Default: 08:00)
- European Session (Default: 15:30)
- US Session (Default: 21:30)
- Each session line can be independently enabled/disabled
2. **Flexible Time Zone Settings**
- Comprehensive time zone support from UTC-10 to UTC+13
- Ensures accurate session timing for traders worldwide
3. **Smart Display Options**
- Option to show only the last 24 hours of session lines
- Future session line prediction (up to 2 hours ahead)
- Dotted lines for historical sessions
- Semi-transparent dashed lines for future sessions
4. **Visual Customization**
- Customizable colors for each session line
- Different line styles for past and future sessions
- Adjustable transparency levels
## Trading Applications
1. **Session Trading**
- Identify session transitions for potential volatility increases
- Plan trades around major market openings
- Track multiple session overlaps
2. **Market Analysis**
- Analyze price behavior at different session boundaries
- Study inter-session price movements
- Monitor market transitions across time zones
3. **Trade Planning**
- Prepare for upcoming session openings
- Schedule entries and exits around session times
- Manage positions across different market hours
## Setup Guide
1. **Time Zone Configuration**
- Select your local time zone from the settings
- Adjust session times if needed for specific markets
2. **Display Settings**
- Enable/disable relevant sessions based on your trading focus
- Customize colors for easy visual distinction
- Configure the display of historical and future lines
## Best Practices
1. Use smaller timeframes (1-15 minutes) for more precise session transition signals
2. Combine with volume indicators to confirm session activity
3. Pay attention to session overlaps for potential increased volatility
4. Use future session lines for trade preparation and planning
## Notes
1. The indicator works best on intraday charts
2. Future session lines are estimates based on current chart timeframe
3. Consider market-specific characteristics when setting up session times
4. Regularly verify time zone settings, especially during daylight savings changes
This indicator is particularly useful for forex traders, day traders, and anyone who needs to track multiple market sessions. It helps in identifying potential trading opportunities during market transitions and managing positions across different trading sessions.
