Point of possible Reversal (PPR): forex Strategypoint of possible Reversal, PPR :
in this strategy I have tried to find out the possible Reversal points in the forex pairs. It’s the most resisted levels from where the trend takes up a particular direction. These PPR can lead the price in any direction depending upon the time zone its happening in.
In this strategy once the code finds a PPR it then checks for suitable time zone then it checks for the RSI confirmation, it checks for the Parkinson Volatility, it checks for internal Bar Strength (refer below for more information)
The following setting details will help you in the understanding the strategy and indicator used:
This indicator contains the following setting:
1.Fixed trading sessions for Long and Short
i. Fixed trading session for long trades (long position can be taken in that period of time only)
ii. Fixed trading session for short trades (Short position can be taken in that period of time only)
The concept behind restricting the time to go long or short is because in forex the particular pair move in a particular direction depending upon the currency and time zones.
This strategy works on different forex pairs, you need to find the best settings. I will be providing the best settings which works for this strategy and different pairs.
2.Setting for back test selection date range you can check the beck test of a particular time range.
3.You can check Long and Short positions performance separately, by unchecking the “ Go_long ” option it will remove all long positions from back test. Vice versa for “ Go_short "option
4.Internal Bar Strength
IBS is simply an indicator where you buy on weakness and sell on strength, the cornerstone of any mean-reverting strategy.
It oscillates from zero to one and measures the relative position of the closing price relative to the High and Low.
IBS = (Close – Low) / (High – Low)
In the input setting the you can disable enable the IBS option from the strategy.
5. Parkinson volatility
Parkinson volatility is a volatility measure that uses the stock’s high and low price of the day (can be changed in the setting, instead of day it can be set to any bar length)
The main difference between regular volatility and Parkinson volatility is that the latter uses high and low prices for a day, rather than only the closing price.
In the setting you have three option
1. Enter Volatility Threshold
If the Parkinson volatility value is greater than the the threshold value then it lets the trade happen.
2.Set the high/low bar time frame for calculating Parkinson volatility. ( Set 60m by default)
Formula used as below:
high_=security(syminfo.ticker, input("60"), high)
low_=security(syminfo.ticker, input("60"), low)
hourlyRangeSquared = pow((log(high_) - log(low_)), 2)
dailyParkinsonVol = sqrt(sum(hourlyRangeSquared, 24) / (4 * log(2)))
6. "Enter no of contract size"
This setting helps you to set the contract size , by default it is set to 100000.
7.This setting is for the PPR, in this you can change the search of PPR in another time frame, you can add higher timeframe PPR in the chart, by default the PPR is set to search for current time frame PPR.
8.Futrther confirmation of trade is done through the RSI criteria . In this I have provided four kind of RSI confirmation you can test all by selecting any one of the four.
1. filter trade on the basis of BB of RSI (as shown in the image)
2. filter trade on the basis of RSI Levels (RSI>50 for long, vice versa for short)
3. filter trade by rsi>basis of BB of RSI(for long) & rsi<50(for short)
4. filter trade by rsi>50(long) & rsi< basis of BB of RSI(short)
SELECT ONLY ONE OF THE ABOVE IN SETTING.
9.For Exiting the trade I have used the trailing SL you can change it in setting.
You can exit the trade using two targets (two take profit) using different size for editing the trade.
If you want to take only on target then you have to make QANTITY of shares for 1st Exit as 100. Then you will exit all your position in the first target achieved.
A big thanks to kodify.net there articles are very helpful kodify.net
Thanks to stack overflow community for clearing the doubts.
Thanks to Mickey for providing assistance.
Trading view official documentation on V4 of pine script also helped me.
Cerca negli script per "session"

London breakout GBPUSD daytradeHello,
First I want to WARN THAT YOU NEED A MINIMUM OF 30X LEVERAGE FOR THIS STRATEGY IN ORDER TO WORK.
THE REASON IS THAT THE SIZE IS CALCULATED BASED ON A VERY SHORT STOP LOSS LEVEL IN PIPS
UTILIZE IT AT YOUR OWN RISK
This is a daytrading strategy, that's suited for GBPUSD 1H timechart.
It a very simple strategy that utilizes 2 moving averages : a very fast one and a very slow one.
It will always enter only at the beginning candle of London session, and it will always exit at the candle at the finish of London session.
So the rules are simple :
If its 8 am GMT and the candle close or high cross the slow moving average and we are above at the same over the slow moving average we make a long movement. The oposite condition is applied for short.
At the same time we always use a very small stop loss = 50-100 points ( 5-10 pips).
We dont have a take profit, in our case the trade ends always at the end of London session. In this case at 15h GMT
It might work on other currencies aswell, but it has to be tested first.
For any questions or suggestions, please let me know.

Money maker EURUSD 15min daytraderVERY IMPORTANT : THIS STRATEGY WAS MADE WITH LEVERAGE IN MIND
You need atleast 20X LEVERAGE ACCOUNT IN ORDER TO WORK PROPERLY.
With high rewards come high risk .
If you dont want to use leverage, use a risk % of less than 0.25 %.
The below example is without use of leverage on a capital 100.000 risking only 0.25% on each trade
This is a breakout strategy, initially made for EURUSD 15 min for London session.
Its made of 4 SMMA and 1 EMA
Rules for entry are simple :
For buy if our current closed candle is above all moving averages, and they are in ascending order ( 3 > 6 > 9 .... ) and we are in the London session we enter.
For sell the same, but in reverse. If closed candle is below all moving averages and they are in descending order ( 3< 6 < 9 .....) and we are in the London session.
We have a risk manangement with TP/SL.
For exit its either if we reach a tp/sl level, or we reach London finish time.
It also has a risk management, calculating the size based on the pips for SL and our current balance.
For any questions , let me know.

Volume Momentum Strategy [MA/VWAP Cross]Deconstructing the Volume Momentum Strategy: An Analysis of MA-VWAP Cross Mechanics
Introduction
The "Volume Momentum Strategy " is a technical trading algorithm programmed in Pine Script v6 for the TradingView platform. At its core, the strategy is a trend-following system that utilizes the interaction between a specific Moving Average (MA) and the Volume Weighted Average Price (VWAP) to generate trade signals. While the primary execution logic relies on price crossovers, the strategy incorporates a sophisticated secondary layer of analysis using the Commodity Channel Index (CCI) and Stochastic Oscillator. Uniquely, these secondary indicators are applied to volume data rather than price, serving as a gauge for market participation and momentum intensity.
The Core Engine: MA and VWAP Crossover
The primary engine driving the strategy's buy and sell decisions is the crossover relationship between a user-defined Moving Average and the VWAP.
1. The Anchor (VWAP): The strategy calculates the Volume Weighted Average Price based on the HLC3 (High, Low, Close divided by 3) source. VWAP serves as the dynamic benchmark for "fair value" throughout the trading session.
2. The Trigger (Moving Average): The script allows for flexibility in defining the "fast" line, offering options such as Simple (SMA), Exponential (EMA), or Hull Moving Averages.
3. The Signal:
o A Long (Buy) signal is generated when the chosen MA crosses over the VWAP. This suggests that short-term price momentum is exceeding the average volume-weighted price of the session, indicating bullish sentiment.
o A Short (Sell) signal is generated when the MA crosses under the VWAP, indicating bearish pressure where price is being pushed below the session's volume-weighted average.
The Role of CCI and Stochastic: Analyzing Volume Momentum
The prompt specifically inquires about how the CCI and Stochastic indicators fit into this process. In standard technical analysis, these oscillators are used to identify overbought or oversold price conditions. However, this strategy repurposes them to analyze Volume Momentum.
1. The Calculation
Instead of using close prices as the input source, the script passes volume data into both indicator functions:
• Volume CCI: Calculated as ta.cci(volume, cciLength). This measures the deviation of current volume from its statistical average.
• Volume Stochastic: Calculated as ta.stoch(volume, volume, volume, stochLength). This gauges the current volume relative to its recent range.
2. The "Volume Spike" Condition
The strategy combines these two indicators to define a specific market condition labeled isVolumeSpike. A volume spike is confirmed only when both conditions are met simultaneously:
• The Volume CCI must be greater than a defined threshold (default: 100).
• The Volume Stochastic must be greater than a defined threshold (default: 80).
3. Integration into the Process
It is critical to note how this script currently applies this "Volume Spike" logic:
• Visual Confirmation: In the current version of the code, the isVolumeSpike boolean is used strictly for visual feedback. When a spike is detected, the script paints the specific price bar yellow and plots a small triangle marker below the bar.
• Strategic Implication: While the code calculates these metrics, the variables long_condition and short_condition currently rely solely on the MA/VWAP crossover. The developer has left the volume logic as a visual overlay, noting in the comments that it serves as a "visual/alert" or a potential filter.
• Potential Alpha: Conceptually, this setup implies that a trader should look for the MA/VWAP crossover to occur coincidentally with—or shortly after—a "Volume Spike" (yellow bar). This would confirm that the price move is backed by significant institutional participation (volume) rather than just retail noise.
Risk Management and Time Constraints
The strategy wraps these technical signals in a robust risk management framework. It includes hard-coded time windows (start/stop trading times) and a "Close All" function to prevent holding positions overnight. Furthermore, it employs both percentage-based and dollar-based Stop Loss and Take Profit mechanisms, ensuring that every entry—whether generated by a high-momentum crossover or a standard trend move—has a predefined exit plan.
Conclusion
The "Volume Momentum Strategy" is a hybrid system. It executes trades based on the reliable trend signal of MA crossing VWAP but informs the trader with advanced volume analytics. By processing volume through the CCI and Stochastic calculations, it provides a "heads-up" display regarding the intensity of market participation, allowing the trader to distinguish between low-volume drifts and high-volume breakout moves.

Alpha VWAP Regime🔥 Alpha VWAP Regime — Institutional VWAP Strategy (Closed Source)
Alpha VWAP Regime is a multi-layered VWAP trading system that identifies the active market regime and adapts its signals based on institutional liquidity behavior.
This strategy is closed-source because it uses a proprietary combination of VWAP structures, anchored pivot logic, band deviations, and regime detection filters that are not publicly available.
🧠 How the Strategy Works (Conceptual Explanation)
This strategy does not rely on a single VWAP line.
Instead, it builds a VWAP matrix consisting of:
1) Session VWAP
Defines fair value for the current session.
Used to detect intraday directional bias.
2) Anchored VWAP (AVWAP)
Automatically anchored to swing highs and lows (pivot-based).
Tracks where large players accumulated or distributed positions.
3) VWAP Bands (±1σ and ±2σ)
Used as dynamic volatility envelopes:
±1σ = fair-value zone / no-trade area
±2σ = mean-reversion extremes
4) Market Regime Classification (ADX-based)
The strategy determines which environment the market is in:
Trending Regime: ADX above threshold
Ranging Regime: ADX below threshold
Breakout Regime: Volume-based breakout of AVWAP
Each regime activates a different entry model.
📌 Entry Logic (High-Level Overview)
Trend Mode
Triggered only when ADX confirms a trend.
Entries occur near VWAP or −1σ using price-action confirmation.
Mean Reversion Mode
Activated when the market is ranging.
Entries target the ±2σ deviation bands.
Breakout Mode
Triggered by price crossing AVWAP with above-average volume.
Used to catch institutional continuation moves.
ALL Mode
Combines the three models for a full adaptive system.
📉 Exits & Risk Management
All stops and targets use ATR-based volatility sizing
Trend trades aim for larger targets
Mean-reversion trades aim for smaller snapback moves
Breakouts use wider stops but high R:R
🔍 How to Use the Strategy
Load the script on a clean chart
Choose your preferred regime mode (Trend / MR / Breakout / ALL)
Optionally hide VWAP indicators and display signals only
Use realistic position sizing and commissions
Evaluate performance across multiple assets and timeframes
🔒 Why It Is Closed-Source
The code uses:
A custom anchoring engine
Multi-layered regime filters
Dynamic VWAP matrix
Prop logic for bias scoring
These components were built from scratch and form a unique decision model, so the source is protected.
🇸🇦 الشرح العربي لاستراتيجية Alpha VWAP Regime
Alpha VWAP Regime هي استراتيجية تداول مؤسسية متقدمة تعتمد على تحليل السيولة، وتحديد حالة السوق (Market Regime)، ودمج عدة طبقات من VWAP داخل نموذج واحد متكيف.
الهدف من الاستراتيجية هو التداول في المناطق التي يتواجد فيها المال الذكي، وتجنب التداول في المناطق العشوائية أو منخفضة الجودة.
________________________________________
🧠 كيف تعمل الاستراتيجية؟
الاستراتيجية لا تعتمد على VWAP واحد، بل تستخدم “مصفوفة VWAP” كاملة تتكوّن من:
1) VWAP اليومي (Session VWAP)
يُستخدم لتحديد القيمة العادلة خلال الجلسة، وتحديد الاتجاه اللحظي (Intraday Bias).
________________________________________
2) VWAP المثبّت (Anchored VWAP)
يتم تثبيته تلقائيًا على:
• القمم المهمة (Swing Highs)
• القيعان المهمة (Swing Lows)
ويساعد في تحديد مناطق تمركز المؤسسات، ومناطق الانعكاس أو الاختراقات الحقيقية.
________________________________________
3) نطاقات VWAP (±1σ و ±2σ)
تُستخدم كأغلفة ديناميكية للسيولة والتقلب:
• ±1σ = منطقة القيمة العادلة (Fair-Value Zone)
→ غالبًا منطقة غير مناسبة للتداول (No-Trade Zone)
• ±2σ = مناطق التشبّع الحركي (Extremes)
→ مناسبة لاستراتيجيات الانعكاس (Mean Reversion)
________________________________________
4) تصنيف حالة السوق Market Regimes
الاستراتيجية تستخدم مؤشر ADX لتحديد حالة السوق الحالية:
حالة السوق الوصف
Trending اتجاه واضح وقوي
Ranging تذبذب بدون اتجاه
Breakout اختراق مدعوم بحجم تداول
كل Regime يفعّل نموذج دخول مختلف داخل الاستراتيجية.
________________________________________
🎯 نماذج الدخول داخل الاستراتيجية
1) نموذج الاتجاه (Trend Mode)
يعمل فقط عندما يكون السوق في اتجاه حقيقي.
يعتمد على دخول Pullbacks قرب VWAP أو نطاق −1σ مع تأكيد شموعي.
________________________________________
2) نموذج الانعكاس (Mean Reversion Mode)
يعمل فقط عندما يكون السوق متذبذبًا (Range).
الدخول عند لمس ±2σ بهدف العودة نحو VWAP.
________________________________________
3) نموذج الاختراق (Breakout Mode)
يستخدم اختراقات Anchored VWAP
ولكن بشرط وجود حجم تداول أعلى من المتوسط (Volume Confirmation).
________________________________________
4) وضع الدمج (ALL Mode)
يجمع بين النماذج الثلاثة ويجعل الاستراتيجية متكيفة تلقائيًا مع كل حالات السوق.
________________________________________
📉 الخروج وإدارة المخاطر
تستخدم الاستراتيجية نظامًا ديناميكيًا لإدارة المخاطر:
• وقف الخسارة مبني على ATR
• الأهداف مبنية على طبيعة النموذج
• الصفقات الاتجاهية تستهدف R:R أعلى
• صفقات MR أقصر وأسرع
• صفقات Breakout أوسع ولكن مدعومة بزخم قوي
________________________________________
🧩 كيفية استخدام الاستراتيجية
1. ضع الاستراتيجية على رسم بياني نظيف بدون مؤشرات إضافية
2. اختر نموذج الدخول المناسب من الإعدادات
3. فعّل أو أخفِ خطوط VWAP حسب الحاجة
4. استخدم إعدادات مخاطرة واقعية
5. اختبر الاستراتيجية على عدة أسواق وفريمات
________________________________________
🔒 سبب إغلاق الكود
تم إغلاق الكود لأنها تعتمد على:
• محرك تثبيت AVWAP خاص
• نظام Regime Detection متقدم
• مصفوفة VWAP متعددة الطبقات
• منطق دخول/خروج خاص تم تطويره بالكامل
كل ذلك يتطلب حماية الملكية الفكرية، لذا تم نشرها Closed-Source.
Jimb0ws Strategy Trending Info PanelsJimb0ws Strategy — Golden Candles + Bubble Zones
A price-action/EMA strategy built for FX scalping and intraday swings. It colors Golden Candles when strong bodies touch/skim EMA20/50 in trend (“bubble”) and optionally highlights Robin Candles (break of the prior golden body). Signals are throttled per bubble and filtered by multiple higher-timeframe conditions.
How it trades
Trend bubbles: Uses EMA20/50/100/200 alignment on the chart timeframe; also reads 1H & 4H bubbles for context.
Entries: BUY/SELL labels appear only when a golden setup aligns with fractal/structure checks and all active filters pass.
Stops/Targets (strategy mode):
• Longs: SL = EMA100 if EMA200 > EMA100, else SL = EMA200.
• Shorts: SL = EMA100 if EMA200 < EMA100, else SL = EMA200.
• TP = RR × risk (default 2R).
An on-chart SL/TP info label prints the exact prices at each signal.
Risk filter options: disable beyond 1H EMA50, proximity band around 1H EMA50, wick overdrive veto, session filter (toggle on/off), max signals per bubble.
Visuals & tools
Colored EMAs (20/50/100/200), bubble zone background.
4H info panel (state, start time, duration); Prev-Day ATR panel sits above it.
Optional 1H info panel and consolidation warning.
Fractal markers (size selectable).
Alerts
1H bubble state change (Long/Short/Consolidation).
BUY/SELL signals.
Inputs worth checking
Session & timezone, min body size, pip tolerances, proximity/WOD filters, max signals per bubble, RR, SL/TP label offset.
Notes
Best on FX pairs; pip = mintick × 10. Backtest and adjust to your instrument and session. This is not financial advice.

HOD/LOD/PMH/PML/PDH/PDL Strategy by @tradingbauhaus This script is a trading strategy @tradingbauhaus designed to trade based on key price levels, such as the High of Day (HOD), Low of Day (LOD), Premarket High (PMH), Premarket Low (PML), Previous Day High (PDH), and Previous Day Low (PDL). Below, I’ll explain in detail what the script does:
Core Functionality of the Script:
Calculates Key Price Levels:
HOD (High of Day): The highest price of the current day.
LOD (Low of Day): The lowest price of the current day.
PMH (Premarket High): The highest price during the premarket session (before the market opens).
PML (Premarket Low): The lowest price during the premarket session.
PDH (Previous Day High): The highest price of the previous day.
PDL (Previous Day Low): The lowest price of the previous day.
Draws Horizontal Lines on the Chart:
Plots horizontal lines on the chart for each key level (HOD, LOD, PMH, PML, PDH, PDL) with specific colors for easy visual identification.
Defines Entry and Exit Rules:
Long Entry (Buy): If the price crosses above the PMH (Premarket High) or the PDH (Previous Day High).
Short Entry (Sell): If the price crosses below the PML (Premarket Low) or the PDL (Previous Day Low).
Long Exit: If the price reaches the HOD (High of Day) during a long position.
Short Exit: If the price reaches the LOD (Low of Day) during a short position.
How the Script Works Step by Step:
Calculates Key Levels:
Uses the request.security function to fetch the HOD and LOD of the current day, as well as the highs and lows of the previous day (PDH and PDL).
Calculates the PMH and PML during the premarket session (before 9:30 AM).
Plots Levels on the Chart:
Uses the plot function to draw horizontal lines on the chart representing the key levels (HOD, LOD, PMH, PML, PDH, PDL).
Each level has a specific color for easy identification:
HOD: White.
LOD: Purple.
PDH: Orange.
PDL: Blue.
PMH: Green.
PML: Red.
Defines Trading Rules:
Uses conditions with ta.crossover and ta.crossunder to detect when the price crosses key levels.
Long Entry: If the price crosses above the PMH or PDH, a long position (buy) is opened.
Short Entry: If the price crosses below the PML or PDL, a short position (sell) is opened.
Long Exit: If the price reaches the HOD during a long position, the position is closed.
Short Exit: If the price reaches the LOD during a short position, the position is closed.
Executes Orders Automatically:
Uses the strategy.entry and strategy.close functions to open and close positions automatically based on the defined rules.
Advantages of This Strategy:
Based on Key Levels: Uses important price levels that often act as support and resistance.
Easy to Visualize: Horizontal lines on the chart make it easy to identify levels.
Automated: Entries and exits are executed automatically based on the defined rules.
Limitations of This Strategy:
Dependent on Volatility: Works best in markets with significant price movements.
False Crosses: There may be false crosses that generate incorrect signals.
No Advanced Risk Management: Does not include dynamic stop-loss or take-profit mechanisms.
How to Improve the Strategy:
Add Stop-Loss and Take-Profit: To limit losses and lock in profits.
Filter Signals with Indicators: Use RSI, MACD, or other indicators to confirm signals.
Optimize Levels: Adjust key levels based on the asset’s behavior.
In summary, this script is a trading strategy that operates based on key price levels, such as HOD, LOD, PMH, PML, PDH, and PDL. It is useful for traders who want to trade based on significant support and resistance levels.

IU open equal to high/low strategyIU open equal to high/low strategy:
The "IU Open Equal to High/Low Strategy" is designed to identify and trade specific market conditions where the day's first price action shows a strong directional bias. This strategy automatically enters trades based on the relationship between the market's open price and its first high or low of the day.
Entry Conditions:
1. Long Entry: A long position is initiated when the first open price of the session equals the day's first low. This signals a potential upward move.
2. Short Entry: A short position is initiated when the first open price of the session equals the day's first high. This signals a potential downward move.
Exit Conditions:
1. Stop Loss (SL): For both long and short trades, the stop loss is calculated based on the low or high of the candle where the position was entered.
2. Take Profit (TP): The take profit is set using a Risk-to-Reward (RTR) ratio, which is customizable by the user. The TP is calculated relative to the entry price and the distance between the entry and the stop loss.
Additional Features:
- Plots are used to visualize the entry price, stop loss, and take profit levels directly on the chart, providing clear and actionable insights.
- Labels are displayed to indicate the occurrence of the "Open == Low" or "Open == High" conditions for easier identification of potential trade setups.
- A dynamic fill highlights the areas between the entry price and the stop loss or take profit, offering a clear visual representation of the trade's risk and reward zones.
This strategy is designed for traders looking to capitalize on directional momentum at the start of the trading session. It is customizable, allowing users to set their desired Risk-to-Reward ratio and tailor the strategy to fit their trading style.

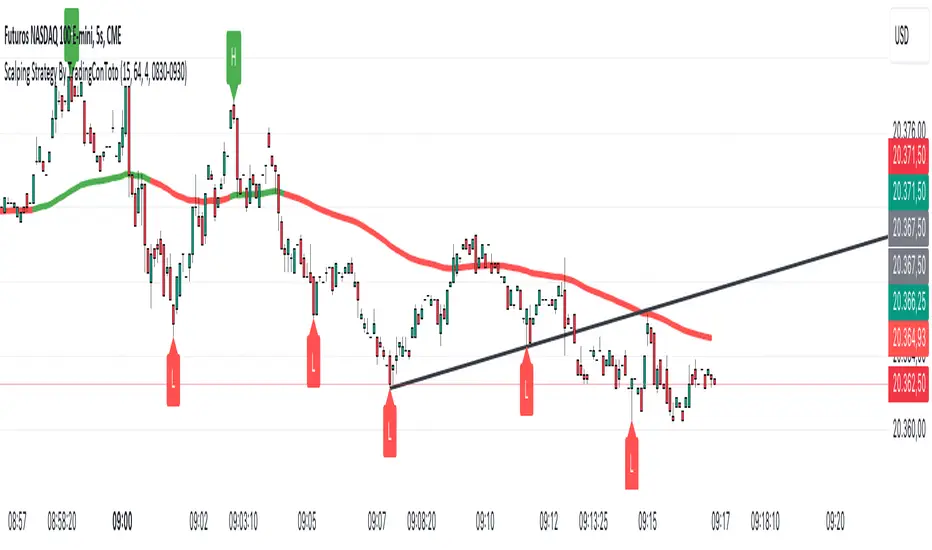
Scalping Strategy By TradingConTotoScript Description: "Scalping Strategy By TradingConToto"
This scalping strategy is designed to trade in volatile markets, taking advantage of rapid price movements. It uses pivots to identify key entry and exit points, along with exponential moving averages (EMAs) to determine the overall trend.
Key Features:
Dynamic Pivots: Calculates pivot highs and lows to identify support and resistance zones, improving entry accuracy.
Market Trend Analysis: Utilizes a 100-period EMA for long-term trend analysis and a 25-period EMA for short-term trends, facilitating informed decision-making.
Automated Entry and Exit: Generates buy and sell signals based on EMA crossovers and specific market conditions, ensuring you don't miss opportunities.
Risk Management: Allows you to set take profit and stop loss levels tailored to market volatility, using the ATR for effective risk management.
User-Friendly Interface: Easily customize strategy parameters such as pivot range, stop loss and take profit pips, and spread.
Requirements:
Ideal for use on short time frames during high activity sessions, like the configured scalping session.
Activate buy and sell options according to your preference and analyze performance using TradingView’s tools.
Note:
This script is a tool and does not guarantee results. It is recommended to test in a simulated environment before applying it to real accounts.
Optimize your scalping operations and enhance your market performance with this effective strategy!
DayTradingFutures Cross-StrategyOVERVIEW
This indicator was designed to help beginners use a cross over strategy that can be used for entries, exits and to for trend direction.
█ COMPONENTS
Here is a brief overview of the indicator:
Weighted Moving Averages
I find that by using a weighted moving average ( WMA ) to show a crossover, is very close to using a MACD signal line cross or using a RSI signal crossing over the 50/Mid Line. In my main strategy, I use the 5period (fast) and with the crossing of the 20period (slow) WMA for entries and the 50period WMA to show the short term trend. Please note, that I use the 50 period for day trading, if you are using a swing trade or plan on holding positions long term, a higher period may be preferred . All of the moving averages are customizable by color, length, and timeframe. **I feel comfortable trading this strategy at the 5min,10min, and 15min charts.
1 — 5 WMA- this is the white moving average closest to price and is the first part of our small cloud.
2 — 20 WMA - this is the yellow moving average and is the second part of or small cloud.
3 — 50 WMA - this is the directional trend.
Moving Average Clouds
The cloud (which is optional) appears when the trader should be looking to go Long or Sell Short. The dividing line is when both the 5 and 20 periods are over the 50 period.
Trade Management
This is a tool to help with setting your stop loss, break even, and target levels. Currently you can set these based on the current ATR ( Average True Range ).
The “Buy” and “Sell” signals are the ATR indicator based on your risk tolerance (fully customizable). Different ticker symbols will require different ATR values, please back test! When applying your stop loss, drag the stop line to small arrow of the signal callout.
Trading Session
The indicator was designed for beginners to trade during the New York Session (08:30 – 16:00 CST). However, the indicator will ONLY show signals AFTER opening and BEFORE close (09:00 – 14:30 CST). The reason for this is that there is greater volatility during the open and I do not recommend to be in a trade at the end of the session.
Buy and Sell Alerts
Alerts can also be set, when an entry can be made. This prevents a person from having to watch the charts for an extended period of time.
Faults of this strategy:
Time of RANGES/CONSOLIDATION periods and EXTREME VOLITITY KILLs this strategy!! Do not trade this strategy during these periods!!
Disclaimer:
NO strategy is 100% effective! I am not responsible for any loss trades or malfunctions of this code. I recommend to paper trade any new strategy before trading with real money! I am not a financial advisor, trading can be very risky!

Gap Filling Strategy Gaps are market prices structures that appear frequently in the stock market, and can be detected when the opening price is different from the previous closing price, this is why gaps are also called "opening price jumps". While gaps can occur frequently, some of them are more significant than others, and can be observed when looking at a long term chart.
The following strategy is based on the exploitation of significant gaps occurring during a new session, and posses various options that can return a wide variety of results.
Type Of Gaps And Occurence
I'am not a professional when it comes to gaps, but as you know the stock market close for the day, however it is still possible to place orders, your broker will hold them until the market open back. Once the market reopen the broker execute the pending orders, and when many orders where pending the market register really high volume and the price might differ from the precedent close.
Gaps are generally broken down into four types:
Common : Gaps occurring within a certain price range, mostly occurs during ranging markets.
Break Away : Gaps breaking a support and resistance, making a new higher high/lower low.
Runaway : Gaps occurring within a trend, followed by a continuation of the trend.
Exhaustion : Gaps occurring at the end of a trend, followed by a reversal.
As said before, some gaps are more significant than others, the significance of a gap can be determined by comparing the opening price with the previous high/low price and by looking at volume. Significant up gaps will have an opening price greater than the previous high, while significant down gap will have an opening price lower than the previous low with both high volume accompanying them.
After a gap, when the price go back to the point previous to the gap we say that it has been "filled", this characteristic is what will be exploited in this strategy.
Strategy Rules & Logic
In this strategy, the significance of a gap is determined by the position of the opening price relative to the previous high/low and make sure the bar following the gap don't fill it.
When the setting invert is set to false the strategy interpret the detected gaps as being exhaustion gaps, therefore when an up gap occur a short position is opened, when a down gap occur a long position is opened. When invert is set to true gaps are considered to be runaway or break away gaps, therefore the contrary positions are opened. Positions are exited when the gap has been filled, which in the chart is show'n when the price cross the red level who act as either a take profit (invert = false) or as a stop loss (invert = true).
There are various closing conditions available that the user can select from the "close when" setting.
New Session : This option close all previous positions when the market is in a new session.
New Gap : This option close all previous position when a new gap has been detected.
Reverse Position : This option close all previous position when a contrary position to the current one is opened. This option would reduce the number of trades.
Testing On Some Stocks
The analysis will be tested in different tech stocks with a main TF of 15 minutes with no spread and commissions applied. Default settings will be used. We'll be making our first analysis using AMD, who has recently formed a full reverse HS pattern, where the neckline has been crossed by the price. (by the way i have a bad feeling about it, hey ! feeling filling ! Lame jokes!)
Profit: $ -12.22
Trades: 272
Profitability: 65.07 %
We can see negative results, with an heavily decreasing balance. Using invert would return positive results.
We will now test the strategy on NVDA, the company is one of the biggest when it comes to the Gpu market.
Profit: $ -215.54
Trades: 297
Profitability: 60.27 %
Not better, using invert would of course create better results. Like AMD the balance is heavily decreasing.
Finally we will test the strategy on Seagate technology, a company mostly known for their mechanical hard drives.
Profit: $ -4.32
Trades: 261
Profitability: 65.9 %
Here the balance does not appear so heavily decreasing and even managed to reach back the initial balance before going down again.
Summary
A strategy based on gap filling has been briefly introduced and tested with 3 tech stocks. The results show that using invert option might be better. The advantage of this strategy against ones using technical indicators is that this one does not heavily depend on user settings, which make it way more efficient, this a big advantage of patterns based strategies.
Thx to LucF for helping with the "process_orders_on_close" element, since i had to use closing price i had to remove it tho, was afraid results would differ even more from a more realistic backtest. And thx for those who continuously support me, more cool stuff is coming up.
Thx for reading and i hope you'll have learned something new today !

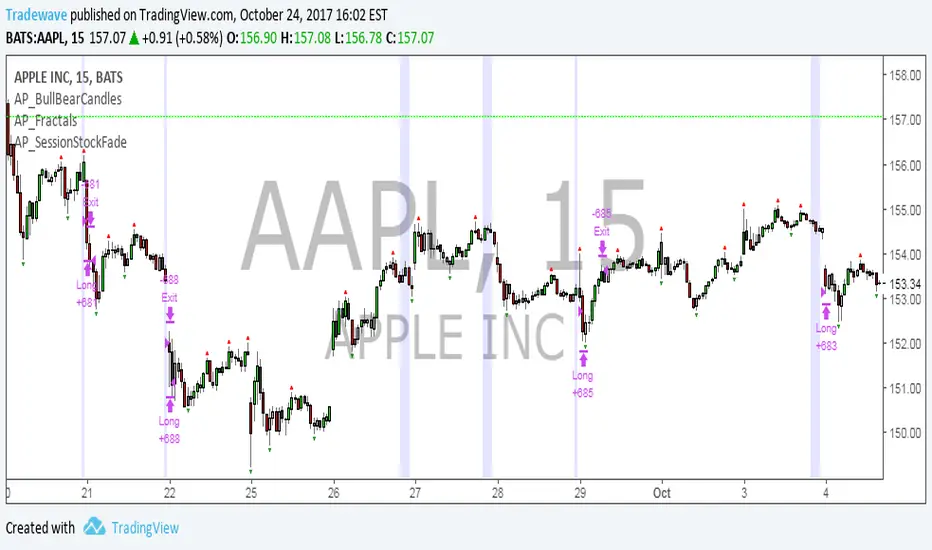
AP_SessionStockFadeDeveloper: Andrew Palladino
Date: 10/23/2017
Description:
The strategy will buy over extended price conditions using the following criteria:
Suppose we are interested in capturing the total drop in points between two times during a session.
The times are defaulted to 9:30 AM and 3:45 PM.
The drop has to exceed a threshold set by the user, which is currently set to 50 cents.
If the current drop between the two time sessions exceeds 50 cents, then a buy limit is set at a multiple of the current drop of the day. For example, if the drop is 1 dollar, a buy limit is set at K*(1 dollar) away from close of the day. K is a multiple set by the user.
Once the buy limit is triggered, the strategy will have a target and stop. Current defaults are 90 cents for both.
If the order doesn't get hit before 12 PM of the following day, it will cancel. Cancel time is also set by the user.
The strategy settings will work on AAPL m15 time frame. Parameters will need to change for any other ticker/time frame combination.
Crude Oil Time + Fix Catalyst StrategyHybrid Workflow: Event-Driven Macro + Market DNA Micro
1. Macro Catalyst Layer (Your Overlays)
Event Mapping: Fed decisions, LBMA fixes, EIA releases, OPEC+ meetings.
Regime Filters: Risk-on/off, volatility regimes, macro bias (hawkish/dovish).
Volatility Scaling: ATR-based position sizing, adaptive overlays for London/NY sessions.
Governance: Max trades/day, cool-down logic, session boundaries.
👉 This layer answers when and why to engage.
2. Micro Execution Layer (Market DNA)
Order Flow Confirmation: Tape reading (Level II, time & sales, bid/ask).
Liquidity Zones: Identify support/resistance pools where buyers/sellers cluster.
Imbalance Detection: Aggressive buyers/sellers overwhelming the other side.
Precision Entry: Only trigger trades when order flow confirms macro catalyst bias.
Risk Discipline: Tight stops beyond liquidity zones, conviction-based scaling.
👉 This layer answers how and where to engage.
3. Unified Playbook
Step Macro Overlay (Your Edge) Market DNA (Jay’s Edge) Result
Event Trigger Fed/LBMA/OPEC+ catalyst flagged — Volatility window opens
Bias Filter Hawkish/dovish regime filter — Directional bias set
Sizing ATR volatility scaling — Position size calibrated
Execution — Tape confirms liquidity imbalance Precision entry
Risk Control Governance rules (cool-down, max trades) Tight stops beyond liquidity zones Disciplined exits
4. Gold & Silver Use Case
Gold (Fed Day):
Overlay flags volatility window → bias hawkish.
Market DNA shows sellers hitting bids at resistance.
Enter short with volatility-scaled size, stop just above liquidity zone.
Silver (LBMA Fix):
Overlay highlights fix window → bias neutral.
Market DNA shows buyers stepping in at support.
Enter long with adaptive size, HUD displays risk metrics.
5. HUD Integration
Macro Dashboard: Catalyst timeline, regime filter status, volatility bands.
Micro Dashboard: Live tape imbalance meter, liquidity zone map, conviction score.
Unified View: Macro tells you when to look, micro tells you when to pull the trigger.
⚡ This hybrid workflow gives you macro awareness + micro precision. Your overlays act as the radar, Jay’s Market DNA acts as the laser scope. Together, they create a disciplined, event-aware, volatility-scaled playbook for gold and silver.
Antonio — do you want me to draft this into a compile-safe Pine Script v6 template that embeds the macro overlay logic, while leaving hooks for Market DNA-style execution (order flow confirmation)? That way you’d have a production-ready skeleton to extend across TradingView, TradeStation, and NinjaTrader.
Antonio — do you want me to draft this into a compile-safe Pine Script v6 template that embeds the macro overlay logic, while leaving hooks for Market DNA-style execution (order flow confirmation)? That way you’d have a production-ready skeleton to extend across TradingView, TradeStation, and NinjaTrader.

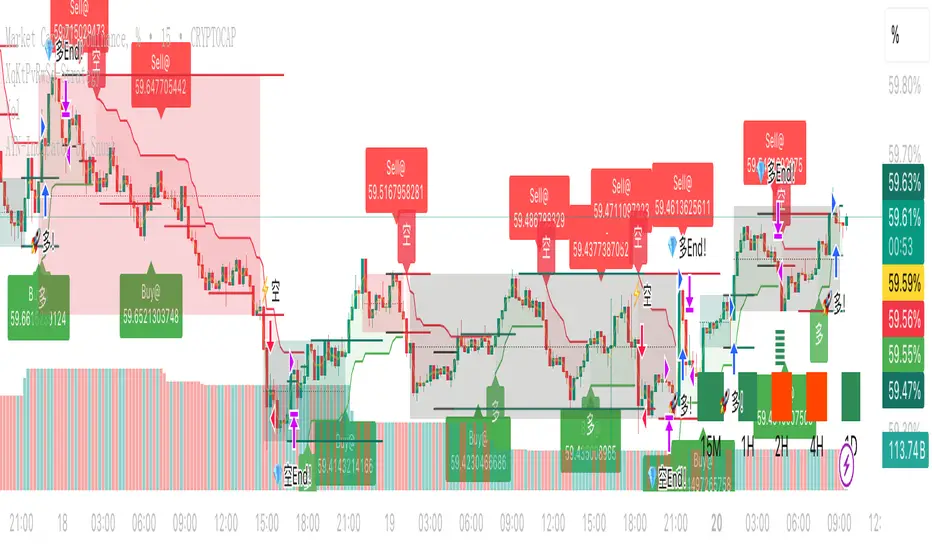
XqKtPvRwSd-StrategyTradingView Pine Script Suite (v4.0) — General Overview
Purpose
A modular indicator and strategy suite designed for crypto markets, focusing on trend detection, momentum, range visualization, and signal generation. The suite supports popular symbols (BTC, ETH, BNB, SOL, DOGE) and offers flexible visualization and alert options.
Main Components
- v4.0-indicator: Multi-signal display for monitoring market conditions and trend bias.
- v4.0-watch-15m: Watchlist-style indicator with symbol-aware auto-tuning and optional chart timeframe adaptation.
- v4.0-strategy: Backtestable strategy using a unified, SuperTrend-based trend determination for entries/exits.
- v4.0-range: Range and structure visualization with dynamic lines, zones, and basic breakout cues.
- Two Poles.pinescript and fengzi/Two Poles Trend: Low-lag trend and smoothing filters for stability.
- supertrend.pinescript: SuperTrend variations used across the suite for direction and stops.
- fengzi utilities:
- Hann Window FIR Filter: Denoising and smoothing to reduce noise without excessive lag.
- Heatmap + Hann Resonance: Visual heat/energy mapping for momentum and resonance cues.
- Heatmap Trailing Stop with Breakouts: Trailing stop framework with breakout detection.
- Additional modules: super Z, AI JX, v3.2, and 4.0.pinescript (combined or experimental entries).
Key Features
- Unified Trend Logic: Strategy and visual components rely on a consistent SuperTrend-based direction model, improving clarity and consistency.
- Adaptive Timeframe: Option to use the chart’s timeframe; parameters scale from a 15m baseline to maintain relative behavior.
- Symbol Auto-Tuning: Default parameter sets are tailored for common crypto symbols; manual overrides are available.
- RSI Top/Bottom Hints: Optional dynamic cues for potential peaks in uptrends and troughs in downtrends; can contribute to scoring and alerts.
- Visual Customization: Configurable markers (arrows, dots, crosses), colors, line widths, and subtle background highlighting.
- Scoring and Clustering: Combines checks into a simplified score and clusters signals to reduce noise.
- Alerts: Supports TradingView alerts for entries, exits, and RSI hints.
- Compatibility: Designed to compile across common Pine versions and avoid local-scope plotting issues.
Basic Usage
- Add the indicator or strategy to your chart depending on your goal (monitoring vs. backtesting).
- Choose to follow the chart’s timeframe or set a working timeframe manually.
- Keep symbol auto-tuning enabled for a balanced default, or adjust parameters to match your preferences.
- Toggle optional modules (RSI hints, scoring contribution, visualization) based on your needs.
- For strategies, run backtests across your target period and review performance metrics (win rate, drawdown, and trade frequency).
Configuration Guidelines
- For earlier entries: lower SuperTrend period or multiplier; relax RSI thresholds.
- For more conservative behavior: increase SuperTrend period or multiplier; tighten thresholds; use stricter RSI logic.
- For cleaner signals: rely on the unified trend and consider limiting trades during extreme volatility or illiquid sessions.
Outputs
- Trend markers and lines indicating bullish/bearish bias and reversals.
- Range drawings with dynamic line coordinates, zones, and visual cues for consolidations and breakouts.
- Optional multi-timeframe dashboard-style summaries where applicable.
Extensibility
- Parameters and defaults can be extended for additional symbols and styles.
- Optional weighting or neutrality rules can be added to trend logic if you prefer stricter confirmation.
- Additional filters (volatility, session, volume) can be integrated to refine entries and exits.
Notes
- Not financial advice; backtest thoroughly before using any strategy live.
- Performance and signal quality vary by symbol, timeframe, and market conditions; adjust parameters as needed.
- Pine version differences may require minor adjustments; keep your environment up to date.
NADY 45M ADX-RSI StrategyADX-RSI Scalping Strategy for Gold (XAUUSD) – Pine Script v5
This script is a powerful scalping & swing trading strategy that combines the strength of ADX (Average Directional Index) and RSI (Relative Strength Index), along with a Moving Average trend filter, designed specifically for XAUUSD (Gold/USD) but can be adapted to other assets.
Core Logic:
🔹 Trend Strength Filter (ADX):
Trades are allowed only when ADX > 20, ensuring signals occur during strong trends.
Custom-coded ADX calculation for precision (no lagging built-in functions).
🔹 RSI Overbought/Oversold Signals:
Buy when RSI is deeply oversold (<20).
Sell when RSI is overbought (>85).
Exit conditions are also governed by RSI reversals (RSI > 75 for closing longs, RSI < 25 for closing shorts).
🔹 Trend Confirmation with Moving Average (MA):
A 300-period SMA ensures only trades in the direction of the larger trend.
Avoids false signals during sideways markets.
🔹 Risk Filters:
No overtrading: Trades are allowed only when all three conditions (ADX, RSI, MA) align.
Session visual filter (background color highlights signal bars).
Features Included:
✅ Precise ADX Calculation
✅ Configurable RSI & MA lengths
✅ Clean Buy/Sell Entry & Exit logic
✅ Alerts Ready (Webhook-compatible for bots)
✅ Visuals: MA line, background highlights, ADX Threshold line.
Best Timeframes:
45M
Recommended Pairing:
XAUUSD (Gold/USD)
Works well with trending assets, can adapt to Forex Majors with slight tweaks.
Customization Parameters:
MA Length (default 300)
RSI Length (default 2)
ADX Length (default 14)
ADX Threshold (default 20)
Backtest Insights:
High accuracy during strong trends.
Works best during London & US sessions.
Filters out sideways, low-volatility zones effectively.

Strategy Chameleon [theUltimator5]Have you ever looked at an indicator and wondered to yourself "Is this indicator actually profitable?" Well now you can test it out for yourself with the Strategy Chameleon!
Strategy Chameleon is a versatile, signal-agnostic trading strategy designed to adapt to any external indicator or trading system. Like a chameleon changes colors to match its environment, this strategy adapts to match any buy/sell signals you provide, making it the ultimate backtesting and automation tool for traders who want to test multiple strategies without rewriting code.
🎯 Key Features
1) Connects ANY external indicator's buy/sell signals
Works with RSI, MACD, moving averages, custom indicators, or any Pine Script output
Simply connect your indicator's signal output to the strategy inputs
2) Multiple Stop Loss Types:
Percentage-based stops
ATR (Average True Range) dynamic stops
Fixed point stops
3) Advanced Trailing Stop System:
Percentage trailing
ATR-based trailing
Fixed point trailing
4) Flexible Take Profit Options:
Risk:Reward ratio targeting
Percentage-based profits
ATR-based profits
Fixed point profits
5) Trading Direction Control
Long Only - Bull market strategies
Short Only - Bear market strategies
Both - Full market strategies
6) Time-Based Filtering
Optional trading session restrictions
Customize active trading hours
Perfect for day trading strategies
📈 How It Works
Signal Detection: The strategy monitors your connected buy/sell signals
Entry Logic: Executes trades when signals trigger during valid time periods
Risk Management: Automatically applies your chosen stop loss and take profit levels
Trailing System: Dynamically adjusts stops to lock in profits
Performance Tracking: Real-time statistics table showing win rate and performance
⚙️ Setup Instructions
0) Add indicator you want to test, then add the Strategy to your chart
Connect Your Signals:
imgur.com
Go to strategy settings → Signal Sources
1) Set "Buy Signal Source" to your indicator's buy output
2) Set "Sell Signal Source" to your indicator's sell output
3) Choose table position - This simply changes the table location on the screen
4) Set trading direction preference - Buy only? Sell only? Both directions?
imgur.com
5) Set your preferred stop loss type and level
You can set the stop loss to be either percentage based or ATR and fully configurable.
6) Enable trailing stops if desired
imgur.com
7) Configure take profit settings
8) Toggle time filter to only consider specific time windows or trading sessions.
🚀 Use Cases
Test various indicators to determine feasibility and/or profitability.
Compare different signal sources quickly
Validate trading ideas with consistent risk management
Portfolio Management
Apply uniform risk management across different strategies
Standardize stop loss and take profit rules
Monitor performance consistently
Automation Ready
Built-in alert conditions for automated trading
Compatible with trading bots and webhooks
Easy integration with external systems
⚠️ Important Notes
This strategy requires external signals to function
Default settings use 10% of equity per trade
Pyramiding is disabled (one position at a time)
Strategy calculates on bar close, not every tick
🔗 Integration Examples
Works perfectly with:
RSI strategies (connect RSI > 70 for sells, RSI < 30 for buys)
Moving average crossovers
MACD signal line crosses
Bollinger Band strategies
Custom oscillators and indicators
Multi-timeframe strategies
📋 Default Settings
Position Size: 10% of equity
Stop Loss: 2% percentage-based
Trailing Stop: 1.5% percentage-based (enabled)
Take Profit: Disabled (optional)
Trade Direction: Both long and short
Time Filter: Disabled

Statistical Correlation Algorithm - The Quant ScienceStatistical Correlation Algorithm - The Quant Science™ is a quantitative trading algorithm.
ALGORITHM DESCRIPTION
This algorithm analyses the correlation ratios between two assets. The main asset (on the chart), and the secondary asset (set by the user). Then apply the long or short trading strategy.
The algorithm divides trading work into three parts:
1. Correlation analysis
2. Long or short entry
3. Closing trades
Inside the strategy: the algorithm analyses the percentage change yields from a previous session, of the secondary asset. If the variation meets the set condition then it will open a long or short position, on the primary asset. The open position is closed after 'x' number of sessions. Stop loss and take profit can be added to the trade exit parameters.
Logic: analyses the correlation between two assets and looks for a statistical advantage within the correlation.
INDICATOR DESCRIPTION
The algorithm includes a quantitative indicator. This indicator is used for correlation analysis and offers a quick reading of the quantitative data. The blue area shows the correlation ratio values. The yellow histograms show the percentage change in the yields of the main asset. Purple histograms show the percentage change in secondary asset yields.
GENERAL FEATURES
Multi time-frame: the user can set any time-frame for the secondary asset.
Multi asset: the user analyses the conditions on a second asset.
Multi-strategy: the algorithm can apply either the long strategy or the short strategy.
Built-in alerts: the algorithm contains alerts that can be customized from the user interface.
Integrated indicator: the quantity indicator is included.
Backtesting included: automatic backtesting of the strategy is generated based on the values set.
Auto-trading compliant: functions for auto trading are included.
USER INTERFACE SETTINGS
Through the intuitive user interface, you can manage all the parameters of this algorithm without any programming experience. The user interface is extremely descriptive and contains all the information needed to understand the logic of the algorithm and to configure it correctly.
1. Date range: through this function you can adjust the analysis and working period of the algorithm.
2. Asset: through this function you can adjust the secondary asset and its time-frame. You can enter any type of asset, even indices and economic indicators.
3. Asset details: this function is used to adjust the percentage change to be analyzed on the secondary asset. The analysis and input conditions are also chosen.
4. Active long or short strategy: this function is used to set the type of strategy to be used, long or short.
5. Setting algo trading alert: with this function, users can manage alerts for their web-hook.
6. Exit&Money management: with this function the user can adjust the exit periods of each trade and activate or deactivate any stop losses and take profits.
7. Data Value Analysis: this function is used to adjust the parameters for the quantity indicator.

Double&Triple Pattern[TS_Indie]📌 Description – Double & Triple Pattern Indicator
The Double & Triple Pattern Indicator is developed to help traders systematically and clearly identify Double Top, Double Bottom, Triple Top, and Triple Bottom chart patterns.
⚙️ Core Logic & Working Mechanism
The Double & Triple Pattern Indicator is built on the concept of price swing formation, based on the logic of Trend Entry_0 , which focuses on structured market analysis and price action behavior.
The indicator detects three main swing points (Swing 1, Swing 2, and Swing 3). A Fibonacci Box is then created using Swing A and Swing B as reference points to define the swing detection zone.
When all three swings remain inside the defined Fibonacci Box, the structure is considered a valid Price Action setup.
The indicator then plots key lines on the chart:
➩ Break Line – used to confirm the signal (confirmation)
➩ Cancel Line – used to invalidate the price action if price moves against the conditions
➛ When price breaks the Break Line , the structure is confirmed and a Pending Order is placed at Swing B , with the Stop Loss set at Swing 1.
➛ If price breaks the Cancel Line first, the price action structure is immediately invalidated.
⚙️ Fibonacci Entry Zone & Change SL Settings
➩ When Fibo Entry Zone is set to 0, the Pending Order is placed directly at Swing B.
➩ When the value is greater than 0, the Pending Order is calculated using Fibonacci levels drawn from Swing B to the Stop Loss level.
➩ Change SL allows switching the Stop Loss reference between Swing 1 and Swing A.
⚙️ Min & Max Control for Swing Size : xATR
When enabling Control Size Swing : xATR , the indicator filters Swing B based on the defined Min and Max range.
This allows traders to selectively test larger or smaller swing-based price actions , depending on their trading strategy.
⭐ Pending Order Cancellation Conditions
A Pending Order will be canceled under the following conditions:
1.A new Price Action signal appears on either the Buy or Sell side.
2.When Time Session is enabled, the Pending Order is canceled once price exits the selected session.
🕹 Order Management Rule
When there is an active open position, the indicator restricts the creation of new Pending Orders to prevent overlapping positions.
💡 Double Pattern Example
💡 Triple Pattern Example
⚠️ Disclaimer
This indicator is designed for technical analysis purposes only and does not constitute investment advice.
Users should apply proper risk management and make decisions at their own discretion.
🥂 Community Sharing
If you find parameter settings that work well or produce strong statistical results, feel free to share them with the community so we can improve and develop this indicator together.

Time Syndicate: Sweep & ShiftTime Syndicate: Sweep & Shift
The Hierarchy of Time.
Most traders look at price and wonder "where." Time Syndicate asks "when."
This system is a paradigm shift away from lagging indicators. It is built on a proprietary temporal engine that mathematically divides market activity into predictive windows of opportunity. It does not guess; it waits for the market to reveal its hand at specific, algorithmically determined intervals.
Core Capabilities
100% Non-Repainting Logic: Built for professional reliability. Unlike tools that rewrite history to look perfect in hindsight, this strategy features Absolute Signal Permanence. Once a signal is confirmed and the bar closes, it never vanishes or shifts. What you see live is exactly what remains, ensuring that your backtesting reality matches your live execution.
Temporal Segmentation: The indicator ignores noise by isolating price action into a rigid, non-linear time hierarchy. It automatically detects when the market is in a "Reference Phase" versus an "Expansion Phase," keeping you out of the chop and aligning you with institutional volatility.
Algorithmic Bias Detection: Forget drawing manual support and resistance. The system utilizes a dynamic, time-weighted volatility model to determine the immediate directional bias. It identifies exactly when liquidity has been harvested and when the smart money is committing to a direction.
Fractal Confirmation Engine: A bias is nothing without timing. The "Shift" mechanism is a secondary confirmation layer that monitors sub-structural price delivery. It validates that the momentum matches the time cycle, ensuring you only execute when Time, Price, and Structure are in perfect confluence.
Adaptive Cycle Modes: Whether you are positioning for macro moves or scalp executions, the system adapts its internal clock to your objective:
Daily Mode: For capturing significant intraday expansions.
Session (Indian Market): A bespoke calibration tuned specifically to the volatility signature of the Indian trading session.
90-Min (Scalp): High-frequency cycle detection for rapid precision plays.
Discipline Protocols: Built-in execution filters prevent over-trading by locking signals once a cycle objective is met. This enforces a "sniper" mentality—one trigger, one cycle, zero noise.
Stop chasing candles. Start trading Time.

Hash Supertrend [Hash Capital Research]Hash Supertrend Strategy by Hash Capital Research
Overview
Hash Supertrend is a professional-grade trend-following strategy that combines the proven Supertrend indicator with institutional visual design and flexible time filtering.
The strategy uses ATR-based volatility bands to identify trend direction and executes position reversals when the trend flips.This implementation features a distinctive fluorescent color system with customizable glow effects, making trend changes immediately visible while maintaining the clean, professional aesthetic expected in quantitative trading environments.
Entry Signals:
Long Entry: Price crosses above the Supertrend line (trend flips bullish)
Short Entry: Price crosses below the Supertrend line (trend flips bearish)
Controls the lookback period for volatility calculation
Lower values (7-10): More sensitive to price changes, generates more signals
Higher values (12-14): Smoother response, fewer signals but potentially delayed entries
Recommended range: 7-14 depending on market volatility
Factor (Default: 3.0)
Restricts trading to specific hours
Useful for avoiding low-liquidity sessions, overnight gaps, or known choppy periods
When disabled, strategy trades 24/7
Start Hour (Default: 9) & Start Minute (Default: 30)
Define when the trading session begins
Uses exchange timezone in 24-hour format
Example: 9:30 = 9:30 AM
End Hour (Default: 16) & End Minute (Default: 0)
Controls the vibrancy of the fluorescent color system
1-3: Subtle, muted colors
4-6: Balanced, moderate saturation
7-10: Bright, highly saturated fluorescent appearance
Affects both the Supertrend line and trend zones
Glow Effect (Default: On)
Adds luminous halo around the Supertrend line
Creates a multi-layered visual with depth
Particularly effective during strong trends
Glow Intensity (Default: 5.0)
Displays tiny fluorescent dots at entry points
Green dot below bar: Long entry
Red dot above bar: Short entry
Provides clear visual confirmation of executed trades
Show Trend Zone (Default: On)
Strong trending markets (2020-style bull runs, sustained bear markets)
Markets with clear directional bias
Instruments with consistent volatility patterns
Timeframes: 15m to Daily (optimal on 1H-4H)
Challenging Conditions:
Choppy, range-bound markets
Low volatility consolidation periods
Highly news-driven instruments with frequent gaps
Very low timeframes (1m-5m) prone to noise
Recommended AssetsCryptocurrency:

ParabolicSAR+EMA[TS_Indie]🚀 EMA + Parabolic SAR Reversal Trading Strategy
This trading system effectively combines the use of Exponential Moving Averages (EMA) with the Parabolic SAR to identify both price trends and key reversal points. The EMA Fast is used to signal the primary short-term trend, while the EMA Slow acts as a filter for the long-term trend direction. The Parabolic SAR then helps to confirm the reversal signals.
🛠️ Tools Used
1. EMA Fast – Primary Short-Term Trend
2. EMA Slow – Long-Term Trend Filter
3. Parabolic SAR – Reversal Confirmation
🎯 Entry Rules
📈 Buy Setup
1. Trend Filter: EMA Fast > EMA Slow → Uptrend
2. Pullback: Price pulls back and closes below the EMA Fast line.
3. Reversal: Price reverses/pulls back up and closes above the EMA Fast line.
4. SAR Confirmation: The previous Parabolic SAR dot is above the high, and the dot in the current candle is below the low → Reversal signal confirmed.
5. Entry: Enter Buy immediately.
📉 Sell Setup
1. Trend Filter: EMA Fast < EMA Slow → Downtrend
2. Pullback: Price pulls back and closes above the EMA Fast line.
3. Reversal: Price reverses/pulls back down and closes below the EMA Fast line.
4. SAR Confirmation: The previous Parabolic SAR dot is below the low, and the dot in the current candle is above the high → Reversal signal confirmed.
5. Entry: Enter Sell immediately.
💰 Exit Management (Entry, Stop Loss, Take Profit)
1. Entry: Enter the order at the closing price of the signal candle.
2. Stop Loss (SL): Set the Stop Loss at the Parabolic SAR dot.
3. Take Profit (TP): Calculated from the Entry and Stop Loss points, multiplied by the Risk Reward Ratio.
⚙️ Optional Parameters
➭ Custom Risk/Reward Ratio for Take Profit.
➭ Option to add an ATR buffer to the Stop Loss.
➭ Adjustable EMA Fast period.
➭ Adjustable EMA Slow period.
➭ Adjustable Parabolic SAR parameters.
➭ Option to enable Long-only / Short-only positions.
➭ Customizable Backtest start and end date.
➭ Customizable trading session time.
🔔 Alert Function
Alerts display:
➭ Entry Price
➭ Stop Loss Price
➭ Take Profit Price
💡 This strategy allows for many parameter adjustments, such as the MA type, adding/subtracting from the Stop Loss using ATR, and selecting specific sessions for backtesting. If you find interesting or profitable results after adjusting the parameters, please share your comments with other traders!
⚠️ Disclaimer
This indicator is designed for educational and research purposes only. It does not guarantee profits and should not be considered financial advice. Trading in financial markets involves significant risk , including the potential loss of capital.

15-min ORB — NY 9:30 (SPX) 10232025This strategy trades the New York session opening range breakout (ORB) using a 15-minute window that starts at 9:30 AM New York time (6:30 AM PDT). It identifies the high and low formed during the first ORB period (default 15 minutes), then looks for breakouts above or below that range within the next 100 minutes of the session.

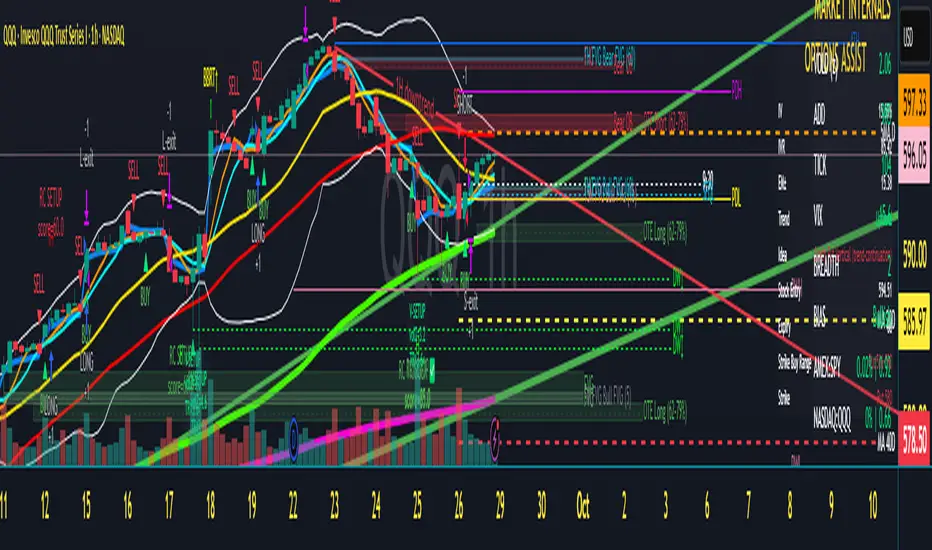
Scalper's Dream by Chino,CHINO’S ICT MES/MNQ Strategy — FVG/BOS/OTE/PD + VWAP + SMA + BB Squeeze/Failure
Summary
Intraday ICT-inspired toolkit tuned for MES/MNQ (also effective on equities/ETFs and crypto). It blends Fair Value Gaps (FVG) — including multi-timeframe FVG (MTF FVG) with first-touch and min-gap filters — Break of Structure (BOS), Optimal Trade Entry (OTE), and Prior-Day levels with VWAP, SMA gates, 9:30 Open, Session Equilibrium (EQ), custom ORB, and Key Rejection Levels (KRL). It also includes Accumulation/Distribution phase reads and Manipulation cues (e.g., liquidity sweeps/stop-runs) to contextualize trend transitions. On top, it adds Bollinger Band squeeze breakouts & failure reversals, V/A shape reversal detectors, Volume-boosted buy/sell signals with Reversal Candle Assist, Asia/London/New York sessions, an Options Assist HUD, and a Market Internals HUD.
Disclaimer: This tool is for education and research purposes only and is not financial advice. Test thoroughly in replay/paper before live trading.