Trade Session Marker of trade session If you do not want painting all session, you should set -1 in the SessionStart and SessionEndIndicatore Pine Script®di HPotter44 1 K
Alpaca-trade V3S-GodMode Synced Strategy คือเครื่องมือ All-in-One สำหรับเทรดเดอร์สาย ICT / SMC (Smart Money Concepts) ที่ออกแบบมาเพื่อการเทรด Gold (XAUUSD) และ Futures โดยเฉพาะ รวบรวมเครื่องมือวิเคราะห์โครงสร้างราคาและเวลา (Time & Price) ที่สำคัญที่สุดไว้ในหน้าจอเดียว พร้อมระบบ Clean Chart ที่ช่วยให้กราฟไม่รก 🚀 Key Features (ฟีเจอร์หลัก): 1. 🏛️ Market Structure & Trend Trend Filter: กรองเทรนด์หลักด้วย EMA 200 (ปรับแต่งได้) VWAP: เส้นค่าเฉลี่ยถ่วงน้ำหนักปริมาณการซื้อขาย Swing Detection: ระบุจุด Swing High/Low อัตโนมัติ (เลือกดูย้อนหลังหรือดูแค่ปัจจุบันได้) 2. ⏰ Time & Sessions Session Ranges: กล่องแสดงช่วงเวลา Asia, London, และ New York พร้อมเส้นกึ่งกลาง (Mean Threshold) Daily Levels: เส้นราคาสำคัญประจำวัน (Previous Day High/Low, True Day Open, New Day Open) Clean Chart Mode: โหมดพิเศษแสดงผลเฉพาะสัปดาห์ปัจจุบัน ช่วยให้โหลดกราฟไวและไม่รกตาย้อนหลัง 3. 🧠 ICT Concepts & Macros ICT Macro Tracker: ติดตามช่วงเวลา Macro สำคัญ (เช่น 02:50, 09:50) พร้อมเส้นราคาเปิดของช่วงเวลานั้นๆ Quarterly Theory: เส้นแบ่งช่วงเวลา 90 นาที (Q1-Q4) และ Micro Cycles (23 นาที) SMT Divergence: ตรวจจับความขัดแย้งของราคากับสินทรัพย์อ้างอิง (เช่น DXY) 4. 💎 Smart Money & Entry Models Inversion FVG (IFVG): แสดง Fair Value Gaps ที่ถูกทำลายและเปลี่ยนหน้าที่เป็นแนวรับ/ต้าน (Credit: LuxAlgo logic) CISD (Change in State of Delivery): ระบบแจ้งเตือนจุดกลับตัวเมื่อเกิดการกวาด Liquidity + FVG + Displacement ในช่วง Killzone 5. 🏆 Gold Special Features Round Numbers: เส้นแนวรับแนวต้านจิตวิทยา (Psychological Levels) สำหรับทองคำ ปรับระยะห่างได้ (เช่น ทุกๆ $5 หรือ $10) 6. 🛠️ Quality of Life Dashboard & Watermark: แสดงสถานะและชื่อระบบแบบมืออาชีพ Customizable: ปรับสี เปิด/ปิด ฟีเจอร์ต่างๆ ได้ตามใจชอบผ่านเมนูตั้งค่า ⚠️ Disclaimer: เครื่องมือนี้มีไว้เพื่อช่วยในการวิเคราะห์ทางเทคนิคเท่านั้น ไม่ใช่คำแนะนำทางการเงิน การลงทุนมีความเสี่ยง ผู้ใช้งานควรศึกษาและบริหารความเสี่ยงด้วยตนเอง ------------------------------------------------------------- Here is the English Version of the description, ready for you to copy and paste into TradingView! 😎 📝 V3S-GodMode Synced Strategy Title: V3S-GodMode Synced Strategy Description: V3S-GodMode Synced Strategy is an All-in-One trading toolkit designed specifically for ICT / SMC (Smart Money Concepts) traders focusing on Gold (XAUUSD) and Futures markets. It consolidates the most critical Price Action and Time analysis tools into a single, comprehensive indicator, featuring a "Clean Chart Mode" to keep your workspace uncluttered and professional. 🚀 Key Features: 1. 🏛️ Market Structure & Trend Trend Filter: Filters the primary market direction using a customizable EMA 200. VWAP: Displays the Volume Weighted Average Price for intraday analysis. Swing Detection: Automatically identifies Swing Highs and Swing Lows (Toggle available for historical or current data only). 2. ⏰ Time & Sessions Session Ranges: Visual boxes for Asia, London, and New York sessions, complete with a Mean Threshold (50%) line. Daily Levels: critical daily price levels, including Previous Day High/Low (PDH/PDL), True Day Open (TDO), and New Day Open (NDO). Clean Chart Mode: A unique feature that displays data only for the current week, significantly improving chart loading speed and reducing visual noise from historical data. 3. 🧠 ICT Concepts & Macros ICT Macro Tracker: Tracks essential Macro windows (e.g., 02:50, 09:50) and plots the opening price line for each specific macro period. Quarterly Theory: Vertical dividers for 90-minute cycles (Q1-Q4) and Micro Cycles (23-minute intervals). SMT Divergence: Detects divergences between the asset price and a reference asset (e.g., DXY) to spot potential reversals. 4. 💎 Smart Money & Entry Models Inversion FVG (IFVG): Highlights Fair Value Gaps that have been invalidated and flipped their role to support or resistance (Credit to LuxAlgo logic). CISD (Change in State of Delivery): An alert system identifying potential reversal points based on Liquidity Sweeps + FVG + Displacement occurring specifically within Killzones. 5. 🏆 Gold Special Features Round Numbers: Automatic psychological support and resistance lines for Gold, with adjustable increments (e.g., every $5, $10, or custom values). 6. 🛠️ Quality of Life Dashboard & Watermark: Displays the system status and indicator name with a professional look. Fully Customizable: Toggle any feature on or off and customize colors to match your personal trading style via the settings menu. ⚠️ Disclaimer: This tool is intended for technical analysis assistance only and does not constitute financial advice. Trading involves significant risk. Users should conduct their own research and manage their risk accordingly.Indicatore Pine Script®di CayenneGT59
IMB Mitigation Alert (15M+) by TradeWithForbesIMB Mitigation Alert (15M+) — by TradeWithForbes This indicator is designed to help traders track and receive alerts when ICT-style Imbalance (IMB) levels are created and later mitigated (revisited) by price. Using the classic 3-candle ICT imbalance definition, the script automatically scans selected higher timeframes (15M and above) and stores the most recent bullish and bearish imbalance levels per timeframe. Tap Alert: triggered when price wicks into the imbalance level Close Confirmation Alert: triggered when a candle closes beyond the imbalance level after mitigation Session-Based Filtering (GMT+1) Tokyo, London, New York sessions included Option to monitor all sessions or only selected sessionsIndicatore Pine Script®di Risk2Rewards56
Time Zones PROGeopbytech – Time Zones PRO (v6) Geopbytech – Time Zones PRO is a professional market session indicator designed for intraday, scalping, and Smart Money Concepts (SMC) traders who want precise market timing and clean chart context. This indicator allows you to visualize up to 5 configurable market sessions in a single script, fully adaptable to any timezone and trading style. 5 independent sessions (ON / OFF per session) Custom session time ranges Editable timezone (IANA format: America/New_York, Europe/London, UTC, etc.) Soft and clean background shading Session start flag (🚩) printed at the exact opening candle Works on Forex, Indices, Gold, and Crypto Built with Pine Script v6 (latest version) Common Use Cases London Session – Early liquidity grabs and manipulation New York Killzone – High-probability SMC entries Asia Range – Range building and target mapping Custom sessions based on your local timezone Easy Configuration All settings are accessible from the indicator panel: Enable or disable each session Edit session names and time ranges Adjust background colors Select your real local timezone Toggle session start flags on or off No need to load multiple indicators — everything is centralized into one professional tool. Indicator Philosophy This indicator does NOT provide buy or sell signals. Its purpose is to provide market context, timing, and structure , helping traders focus only on periods where institutional liquidity is active. Perfectly compatible with: Smart Money Concepts (SMC) Order Blocks Fair Value Gaps (FVG) Market Structure Liquidity Sweeps Author Geopbytech – Juan Delgado Disclaimer This indicator is for educational purposes only. It does not constitute financial advice. Always trade with proper risk management.Indicatore Pine Script®di GeopbytechAggiornato 4
ORB Session BreakoutORB Session Breakout Overview The ORB Session Breakout indicator automatically identifies Opening Range Breakouts across multiple trading sessions (Asia, London, and New York) and provides visual trade setups with entry, stop loss, and take profit levels. Opening Range Breakout (ORB) is a classic trading strategy that captures momentum when price breaks out of an initial trading range established at the start of a session. This indicator automates the entire process - from detecting the opening range to plotting trade setups when breakouts occur. 🎯 Key Features Multi-Session Support Asia Session - Captures the Asian market open (default: 19:00-19:15 NY time) London Session - Captures the London market open (default: 03:00-03:15 NY time) New York Session - Captures the NY market open (default: 09:30-09:45 NY time) Each session is fully customizable with independent time windows and colors Enable/disable individual sessions based on your trading preferences Automatic Trade Visualization Entry Level - Marked at the breakout candle close Stop Loss Zone - Configurable as ORB High/Low or Breakout Candle High/Low Take Profit Zone - Calculated automatically based on your Risk:Reward ratio Visual zones make it easy to see risk/reward at a glance Smart Breakout Detection Detects breakouts on the exact candle that closes beyond the ORB range Supports direction changes - if price breaks one way then reverses, a new trade is signaled Configurable max breakouts per session (1-4) to control trade frequency Tracking hours setting limits how long after the ORB to look for entries Futures Compatible Special detection logic for futures markets where session times may fall during market close Works reliably on instruments with non-standard trading hours 📊 How It Works Opening Range Formation At the start of each enabled session, the indicator tracks the high and low of the first candle(s) This range becomes your ORB box (displayed in the session color) Breakout Detection When a candle closes above the ORB High → LONG signal When a candle closes below the ORB Low → SHORT signal The breakout candle is highlighted in yellow (customizable) Trade Setup Visualization Entry line drawn at the breakout candle's close price Stop Loss placed at ORB Low (longs) or ORB High (shorts) - or breakout candle extreme Take Profit calculated as: Entry + (Risk × R:R Ratio) for longs Direction Changes If you're in a LONG and price closes below the ORB Low, the indicator signals a SHORT This counts as your 2nd breakout (configurable up to 4 per session) 💡 Trading Tips Best Practices Wait for candle close - The indicator only signals on confirmed closes beyond the ORB, reducing false breakouts Use with trend - ORB breakouts work best when aligned with the higher timeframe trend Respect the levels - The ORB High/Low often act as support/resistance throughout the session Monitor multiple sessions - Sometimes the best setups come from Asia or London, not just NY Recommended Settings by Style Conservative: Max Breakouts = 1, R:R = 2.0+, SL Mode = ORB Level Aggressive: Max Breakouts = 3-4, R:R = 1.5, SL Mode = Breakout Candle Scalping: Shorter tracking hours (1-2), tighter R:R (1.0-1.5) What to Avoid Trading ORB breakouts during major news events (high volatility can cause whipsaws) Taking every signal without considering market context Using on timeframes higher than 1 hour (the ORB concept works best intraday) 🔔 Alerts The indicator includes built-in alerts for: Entry Signal - When a breakout is detected (LONG or SHORT) Take Profit Hit - When price reaches the TP level Stop Loss Hit - When price reaches the SL level To set up alerts: Right-click on the chart → Add Alert → Select "ORB Session Breakout" 📝 Notes This indicator is designed for intraday trading on timeframes up to 1 hour Session times are based on the selected timezone (default: America/New_York) The indicator works on all markets including Forex, Futures, Stocks, and Crypto For futures with non-standard hours, the indicator includes special detection logicIndicatore Pine Script®di Ekuang81
[turpsy] Midnight Opening Range-Fractal Midnight Open Range-Fractal Combined Trading System Overview This indicator combines Midnight Opening Range (MOR) analysis with HTF candle structure and fractal patterns to provide a comprehensive intraday trading framework. Unlike simple mashups, this system integrates three complementary methodologies that work together to identify high-probability trading zones. Core Components & Synergy 1. MOR (Midnight Opening Range) Indicator - Tracks the first 30 minutes of each trading day (00:00-00:30) - Draws historical and current session boxes with quartile levels (25%, 50%, 75%) - Custom opening price lines for key market times (NY Open 9:30, London Close, etc.) - Concept: Price tends to respect the opening range boundaries; quartiles act as support/resistance 2. HTF (Higher Timeframe) Candles - Displays up to 6 higher timeframe candles alongside your chart - Shows Fair Value Gaps (FVG) and Volume Imbalances (VI) - Presents First Presented FVG (PFVG) - the initial gap after a fractal - Concept: HTF structure provides context for LTF entries; FVGs are magnetic price targets 3. Fractal Pattern Detection with CISD - Identifies swing highs/lows using HTF candle structure - CISD (Change in State of Delivery) lines mark confirmed fractal breaks - Chart sweeps show liquidity grabs - Concept: Fractals mark key market structure; CISD confirms directional bias 4. Killzones & Session Analysis - Asia, London, NewYork AM/PM, and Lunch sessions - Session highs/lows with pivot tracking - Day/Week/Month opens and separators - Concept: Specific sessions show characteristic volatility and directional behavior 5. ADR/CDR Analysis - Average Daily Range and Current Daily Range tracking - Shows percentage of ADR completed - Concept: Helps gauge if there's room for continuation or if exhaustion is likely How They Work Together 1. Context: It uses HTF candles and MOR boxes to identify the bigger picture structure 2. Timing: It uses Killzones to show when institutional activity is highest 3. Entry: It uses Fractals with CISD confirm structure breaks; FVGs provide entry zones 4. Risk Management: ADR/CDR helps set realistic profit targets and assess if move is extended Original Contributions This script significantly improves upon the base components by: - Integrating 1-minute data feed for accurate Midnight Open Range calculations on all timeframes - Adding PFVG detection synchronized with fractal patterns - Creating logarithmic midpoint calculations between HTF candles - Implementing chart sweep detection for liquidity analysis - Adding CISD projection lines at 0.5, 1.0, 1.5, 2.0 extensions How to Use 1. Enable desired HTF timeframes and MOR settings 2. Watch for PFVG formation after HTF candle closes 3. Look for CISD line breaks during killzone sessions 4. Enter at FVG mitigation zones aligned with MOR quartiles 5. Monitor ADR% to gauge move potential Credits - HTF Candles base structure: fadizeidan & tradeforopp - Midnight opening range: trades-dont-lie - I made the Significant modifications and integrationIndicatore Pine Script®di TurpsyAggiornato 48
Session Relative VolumeSession Relative Volume is an advanced intraday futures volume indicator that analyzes volume separately for Asia, London, and New York sessions - something standard relative volume tools can’t do. Instead of aggregating the entire day’s volume, the indicator compares current volume to historical averages for the same session and time of day, allowing you to spot true volume strength and meaningful spikes, especially around session opens. Background Relative volume helps traders spot unusual activity: high volume often signals institutional participation and trending days, while low volume suggests weak commitment and possible mean reversion. In futures markets, sessions ( Asia, London, New York ) must be analyzed separately, but TradingView’s Relative Volume in Time aggregates the entire day, masking session-specific behavior - especially during the New York open. Since volume can vary by more than 20× between sessions, standard averages struggle to identify meaningful volume spikes when trader conviction matters most. Indicator Description The “Session Relative Volume” indicator solves these problems by calculating historical average volume specific to each session and time of day, and comparing current volume against those benchmarks. It offers four display modes and fully customizable session times Altogether, it provides traders with a powerful tool for analyzing intraday futures volume, helping to better assess market participation, trader conviction, and overall market conditions - ultimately supporting improved trading decisions. Parameters Mode – display mode: R-VOL: Relative cumulative session-specific volume at time VOL CUM: Cumulative session volume at time compared to historical average cumulative session-specific volume VOL AVG: Average session intrabar volume at time compared to historical average session-specific intrabar volume VOL: Individual bars volume, highlighting (solid color) unusual spikes Lookback period – number of days used for calculating historical average session volume at time MA Len – length of the moving average, representing average bar volume within a session based on previous periods (different from historical cumulative volume!). Used only in VOL and VOL AVG modes MA Thresh – deviation from moving average, used to detect bar volume spikes (bar volume > K × moving average) Start Time – End Time and Time Zone parameters for each session. The time zone must be set using TradingView’s format (e.g., GMT+1). Indicatore Pine Script®di hermes_trismeAggiornato 25
ORB + Killzones - Universal AutoORB + Killzones • Universal Auto A clean overlay indicator that automatically plots 15-minute Opening Range Breakout (ORB) levels for major global sessions with full DST handling and optional Killzone shading. Key Features Universal auto-detection: adapts session times and timezones perfectly for crypto (24/7) and traditional markets (cash hours only) 15-minute ORB high/low lines for Tokyo, Hong Kong, China, London, and New York sessions Precise DST-aware London (Europe/London) and New York (America/New_York) sessions Optional translucent Killzone background shading: London Open (0800–1100), NY Open (0930–1100), London Close (1530–1630) — with custom colors and transparency Individual toggle switches for each session ORB and Killzone display Clean neon color scheme matching popular retrowave setups (Tokyo teal, HK magenta, China red, London blue, NY gold) Efficient drawing with persistent lines that extend until session end No repainting, low resource usage (max 250 lines, 60 labels) Ideal for ICT/SMC traders who want accurate multi-session ORBs and high-probability Killzone windows on any instrument or timeframe. Works on forex, indices, stocks, and crypto. Recommend to uncheck timeframes over 1 hour in the Visibility tab of the Settings.Indicatore Pine Script®di zenba_tvAggiornato 50
VWAP Flow ParmezanThe "Official Bank Flow VWAP" is a comprehensive trading suite designed for institutional Forex traders. This indicator solves the problem of chart clutter by combining two critical components of liquidity: Price (Value) and Time (Sessions). It is specifically optimized for EUR/USD and GBP/USD on intraday timeframes (M5, M15), helping you identify high-probability setups where "Fair Value" meets "Volatility." Key Features 1. Multi-Timeframe VWAP Hierarchy Unlike standard indicators, this tool visualizes the interaction between three distinct timeframes: Daily VWAP (Dynamic Color): Your primary trend filter. Green when Bullish (Price > VWAP), Red when Bearish (Price < VWAP). Weekly VWAP (Orange Dots): Represents the medium-term balance. Acts as a magnet for mean reversion mid-week. Monthly VWAP (Purple Line): The institutional "line in the sand." Major support/resistance level. 2. Standard Deviation Bands (Market Balance) The indicator plots SD1 and SD2 bands around the Daily VWAP: Inner Zone (SD1): Represents the "Fair Value" area. Outer Bands (SD2): Represents overbought/oversold conditions. Useful for identifying mean reversion plays back to the center. 3. Official Exchange Sessions (Time) Forget confusing "killzones." This tool highlights the Official Open times for major exchanges, adjusted for Daylight Savings via New York time: London Open (08:00 LDN): The start of European volume. New York Open (08:00 NY): The injection of US liquidity. London Close/Fix: The daily overlap close, often marking trend reversals. Note: Sessions are visualized with non-intrusive black "shadow" backgrounds to keep your chart clean. 4. "Ghost" Levels (Previous VWAP) A unique feature that plots the closing VWAP level of the previous day. Institutional algorithms often target these "untested" levels as Take Profit targets or liquidity pools. How to Use Trend Following: If Price is above the Daily VWAP (Green) during the London Open, look for Long entries targeting the SD1/SD2 upper bands. Mean Reversion: If Price hits the SD2 Band while far away from the Weekly VWAP, look for a reversal back to the mean. Confluence: The strongest signals occur when price touches a key VWAP level (e.g., Weekly VWAP) specifically during the highlighted Session Start times. Settings Timezone: Defaults to America/New_York to automatically handle DST shifts for London/NY opens. Visuals: Fully customizable colors and transparency. Default is set to a "Dark Mode" friendly professional palette.Indicatore Pine Script®di DecimusForexAggiornato 33277
52 Week High LowPurpose This indicator plots the rolling **52-week high and low price levels** to highlight long-term breakout zones, major support/resistance bands, and trend structure used by position and swing traders. ## How It Works The script dynamically calculates: - The highest high over the last ~260 trading sessions (52-week high) - The lowest low over the last ~260 trading sessions (52-week low) - Visual bands that update in real time as price evolves ## Best Timeframe Optimized for **daily charts** to reflect true yearly price ranges. Can be adapted to other timeframes using the bar-count inputs. ## Trading Applications ✅ Breakout confirmation tool ✅ Long-term trend validation ✅ Relative strength filter alignment ✅ RRG and momentum cross-checks ✅ Swing trade zone identification ## How To Use 1. Apply to daily charts. 2. Track price interaction with the 52-week bands. 3. Look for: - Breakouts above the high band for trend continuation - Pullbacks toward the high band for retest entries - Rejections at the low band as breakdown confirmation ⚠️ This indicator maps key price structure — it does **not predict directional outcomes**. Always combine with volume or momentum confirmation. --- ## Mathematical Basis Rolling extreme calculations based on: - **Highest high over N bars** - **Lowest low over N bars** N defaults to **52 weeks × 5 sessions = 260 bars** for daily charts. --- Developed for professional retail traders seeking institutional-grade structural tools. Indicatore Pine Script®di amitlall18
AP Capital – Volatility + High/Low Projection v1.1📌 AP Capital – Volatility + High/Low Projection v1.1 Predictive Daily Volatility • Session Logic • High/Low Projection Indicator This indicator is designed to help traders visually understand daily volatility conditions, identify session-based turning points, and anticipate potential highs and lows of the day using statistical behavior observed across thousands of bars of intraday data. It combines intraday session structure, volatility regime classification, and context from the previous day’s expansion to highlight high-probability areas where the market may set its daily high or daily low. 🔍 What This Indicator Does 1. Volatility Regime Detection Each day is classified into: 🔴 High Volatility (trend continuation & expansion likely) 🟡 Normal Volatility 🔵 Low Volatility (chop, false breaks, mean-reversion common) The background color automatically adapts so you always know what environment you're trading in. 2. Session-Based High/Low Identification Different global sessions tend to create different market behaviors: Asia session frequently sets the LOW of day New York & Late US sessions frequently set the HIGH of day This indicator uses those probabilities to highlight potential turning points. 3. Potential High / Low of Day Projections The script plots: 🟢 Potential LOW of Day 🔴 Potential HIGH of Day These appear only when: Price hits the session-statistical turning zone Volatility conditions match Yesterday’s expansion or compression context agrees This keeps signals clean and prevents over-marking. 4. Clean Visuals Instead of cluttering the chart, highs and lows are marked only when conditions align, making this tool ideal for: Session scalpers Day traders Gold / NAS100 / FX intraday traders High-probability reversal traders 🧠 How It Works The engine combines: Daily range vs 20-day average Real-time intraday high/low formation Session-specific probability weighting Previous day expansion and volatility filters This results in highly reliable signals for: Fade trades Reversal setups Timing entries more accurately ✔️ Best Uses Identifying where the day’s range is likely to complete Avoiding trades during low-volatility compression days Detecting where the market is likely to turn during major sessions Using potential HIGH/LOW levels as take-profit zones Enhancing breakout or reversal strategies ⚠️ Disclaimer This indicator does not repaint, but it is not a standalone entry tool. It is designed to provide context, session awareness, and volatility-driven turning points to assist your existing strategy. Always combine with sound risk management.Indicatore Pine Script®di APCapitalTrading23
Session Range Boxes GR v2.1This indicator draws intraday range boxes for the main Forex sessions based on Europe/Budapest time (CET/CEST). Tracked sessions (Budapest time): Asia: 01:00 – 08:00 Frankfurt (pre-London): 08:00 – 09:00 London: 09:00 – 18:00 New York: 14:30 – 23:00 For each session, the script: Detects the session start and session end using the current chart timeframe and the Europe/Budapest time zone. Tracks the high and low of price during the session. Draws a colored box from session open to session close, covering the full price range between the session high and low. Draws a white midline inside every box at the midpoint between the session high and low (and keeps it visible for all past sessions). Optionally plots a small label (“Asia”, “Fra”, “London”, “NY”) above the first bar of each session. Color scheme: Asia: soft orange box Frankfurt: light aqua box London: darker blue box New York: light lime box Use this tool to: Quickly see which session created the high or low of the day, Highlight important liquidity zones and prior session ranges that price may revisit, Visually separate Asia, Frankfurt, London and New York volatility profiles on intraday charts. Optimized for intraday trading (Forex / indices), but it works on any symbol where session behavior and time-of-day structure matter.Indicatore Pine Script®di GRIDFX1123
Liquidity Hunter Pro v11.9 — TQI EditionLiquidity Hunter Pro v12 is built for intraday traders who want structure, clarity, and precision without unnecessary clutter. The tool blends market structure, momentum, trend alignment, volatility regime analysis, and liquidity mapping into a single unified model. This version focuses on three core goals: 1. Identify only high-quality, directional market conditions. The engine filters through HTF bias, short-term structure shifts, RSI momentum, and volatility compression/expansion. The idea is simple: wait for the market to become clean, aligned, and directional before considering an entry. 2. Map liquidity and detect sweeps in real time. Major highs and lows are tracked using extended pivots, and the system highlights key areas where stop hunts or sweeps may occur. Sweeps and pressure zones are evaluated and factored directly into the quality score. 3. Grade every potential setup with a single, objective metric (TQI). The Trade Quality Index (0–5⭐) compresses all signals into one reading so the trader can quickly judge whether a setup has enough quality to act on. The script includes: • Trend + Momentum + Structure detection • HTF bias (optional) • Volatility regime analysis • Liquidity sweeps + pressure zones • Micro-confirmation engine • PQI (0–100%) • TQI (0–5⭐) • Clean HUD and Driver’s Guide • Auto-cleaning labels and signal management • Optional session filtering (London/NY) This tool is designed for traders who value confirmation over noise. It will not fire constantly. It will wait patiently for clean, directional, aligned markets — and only then issue a signal. How to Use Liquidity Hunter Pro v12 1. Check the HUD (top-right by default) The HUD is your dashboard. Before doing anything: A. HTF Bias This is your map. Only trade in the direction of the bias. B. Trend / Momentum / Structure These should ideally all match the direction of the bias. If they don’t line up → wait. No alignment = low probability. C. Liquidity + Volatility Regime “Sweep ↑→↓” or “Sweep ↓→↑” = potential reversal points “Expansion” = clean conditions “Compression” = choppy, avoid You don’t need to overthink any of this — just think: “Are the ingredients lined up?” 2. Wait for a valid signal The indicator will only trigger a BUY or SELL when: ✓ HTF bias aligns ✓ Trend & momentum align ✓ Structure supports the move ✓ Micro-confirmation kicks in ✓ PQI ≥ 75 ✓ Sessions are open (optional) Signals are rare on purpose. When one prints, you know the market conditions are stacked. 3. Read the label Each signal prints a small block next to the candle containing: • Entry price • SL (based on structure) • TP(2R) suggestion • Liquidity context (e.g., sweep or pressure) • Volatility regime • TQI ⭐ rating (0–5) This helps you judge the setup instantly. A simple rule for beginners: Trade only if TQI ≥ ⭐⭐⭐ Lower than that = more noise, less edge. 4. Use the liquidity zones The script plots subtle boxes at recent liquidity highs/lows. These mark: • Where the market may hunt stops • Where reversals often start • Where signals are more meaningful When a signal happens near liquidity → higher quality. 5. Follow the session filter (optional but recommended) By default the tool focuses on: • London session • New York session That removes 70% of low-volatility garbage. You can turn this off if you trade crypto or indices overnight, but beginners usually benefit from keeping it on. Recommended Settings These are the settings used by most testers and early users. Everything is configurable, but start with this: Core Settings • Fast EMA: 21 • Slow EMA: 55 • RSI Length: 14 • Pivot Lookback: 2 These settings create balanced structure detection and smooth trend signals. HTF Bias • Use HTF Bias: ON • HTF Timeframe: 240 (H4) H4 bias keeps you out of counter-trend traps. Sessions • Use London/NY Filter: ON • London: 08:00–17:00 • New York: 13:30–21:00 Perfect for FX, indices, and metals. Crypto traders: turn sessions OFF. HUD + Guide • HUD: ON • Guide: ON • Linger Bars: 12 This keeps things readable and prevents clutter. Trading Tips for Beginners These help keep you out of trouble: 1. Don’t fade the bias. If HTF says bearish → avoid buys. 2. Don’t trade in compression regimes. It saves you from chop. 3. Don’t chase signals that fire far from structure. If the signal candle is huge, let it go. 4. Don’t trade without at least ⭐⭐⭐. You’ll thank yourself later. Final Thoughts Liquidity Hunter Pro v12 isn’t meant to spam signals. It’s meant to filter hard, highlight clean conditions, and help new traders avoid the traps the market throws every day. Treat it as a trading assistant that tells you: “The environment is right. Now you decide.”Indicatore Pine Script®di david0612702222
Time Range HighlighterThis indicator highlights up to two custom time ranges on your chart with fully adjustable settings: 🔧 Features: Define two separate time sessions Set custom start and end times (in any time zone) Choose unique highlight colors and opacity for each session Toggle each range on or off independently Timezone input allows syncing sessions to any global market hours (e.g., UTC, Asia/Tehran, New York) 🕒 Example Use Cases: Highlight market opening hours (e.g. NYSE: 0930–1600) Track your personal trading hours or peak volatility sessions Visualize specific algorithm time filters 📌 Usage: Enter your desired timezone string (e.g., "Asia/Tehran" or "Etc/UTC") Customize session times like "0930-1200" and "1500-1700" Adjust colors and visibility to fit your strategy Ideal for traders who rely on time-based setups or session overlays.Indicatore Pine Script®di Shayan_Bakhtiari118
Session ParmezanForex Session Range Boxes (Asia, Europe, US) — visual intraday session tracker for Forex and metals. This indicator automatically marks the three major Forex trading sessions — Asian (Tokyo), European (London), and American (New York) — directly on your chart using dynamic colored boxes. Each box represents the full price range (High–Low) formed during that session, helping traders visualize how volatility and liquidity evolve across the global trading day. The script is built for intraday traders and session-based strategies, especially those who monitor breakouts from the Asian range or reactions during London–New York overlaps. ⚙️ Features • Accurate session timing (UTC+3 / Moscow Time) — Asia: 03:00–12:00, Europe: 11:00–20:00, US: 16:00–01:00. • Dynamic range boxes: each box expands in real time as new highs and lows are set during the session. • Clear visual separation: each session is shown in its own color (blue for Asia, orange for Europe, green for US). • Automatic daily reset — new boxes start every new session. • Intraday focus only — visible up to the 1-hour timeframe (M1–H1) for clarity. • Transparent design — semi-transparent fills keep candles readable even when sessions overlap. • Lightweight performance — optimized use of box.new() and var variables avoids lag on lower timeframes. 🧭 Typical Use-Cases • Identify Asian session ranges and watch for London breakouts or New York reversals. • Visually align your intraday strategy with session volatility cycles. • Combine with VWAP, liquidity zones, or market profile indicators for deeper confluence. • Spot overlapping sessions — often the most active periods of the day.Indicatore Pine Script®di DecimusForexAggiornato 55281
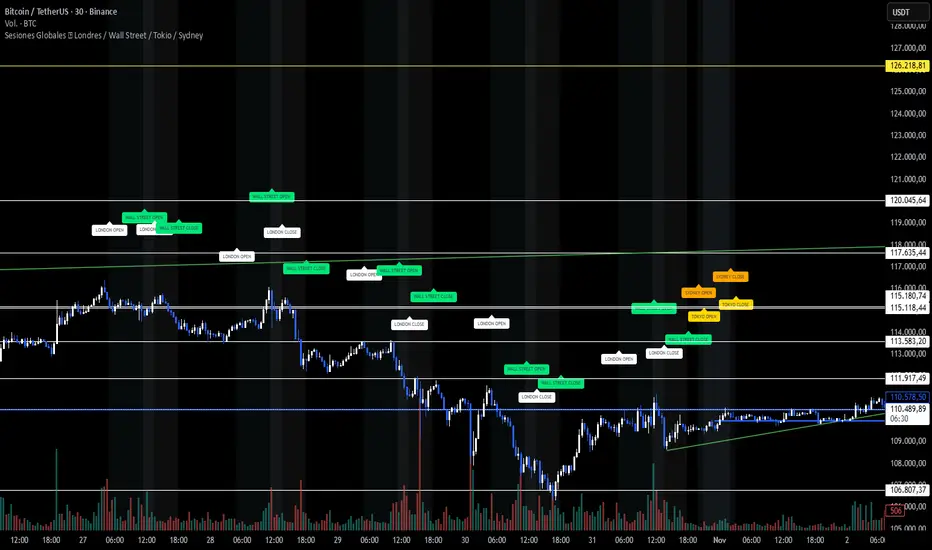
Sesiones Globales 🌍 Londres / Wall Street / Tokio / SydneyA clean visualization of the four main trading sessions — all shown in Argentina time (UTC−3) for easier global market tracking. 🕒 Sessions covered: London 🇬🇧 — 05:00 to 13:30 Wall Street 🇺🇸 — 11:30 to 18:00 Tokyo 🇯🇵 — 21:00 to 03:00 Sydney 🇦🇺 — 20:00 to 02:00 ✨ Features: Soft background colors for each market session (non-intrusive and chart-friendly) “OPEN” and “CLOSE” labels in matching session colors Correct weekend handling — Tokyo and Sydney extend into early Saturday mornings (no false sessions shown) Works on any asset — BTC, SP500, FX, or indices Designed for dark charts and visual clarity 🎯 Why use it: See where global liquidity overlaps, detect volatility zones, and plan your trades around real session activity — especially helpful for BTC and SP500 traders following institutional flow. 💡 Tip: All times are set to Argentina (UTC−3) by default. Adjust manually if you prefer another timezone.Indicatore Pine Script®di ktrimboli9419
LibTmFrLibrary "LibTmFr" This is a utility library for handling timeframes and multi-timeframe (MTF) analysis in Pine Script. It provides a collection of functions designed to handle common tasks related to period detection, session alignment, timeframe construction, and time calculations, forming a foundation for MTF indicators. Key Capabilities: 1. **MTF Period Engine:** The library includes functions for managing higher-timeframe (HTF) periods. - **Period Detection (`isNewPeriod`):** Detects the first bar of a given timeframe. It includes custom logic to handle multi-month and multi-year intervals where `timeframe.change()` may not be sufficient. - **Bar Counting (`sinceNewPeriod`):** Counts the number of bars that have passed in the current HTF period or returns the final count for a completed historical period. 2. **Automatic Timeframe Selection:** Offers functions for building a top-down analysis framework: - **Automatic HTF (`autoHTF`):** Suggests a higher timeframe (HTF) for broader context based on the current timeframe. - **Automatic LTF (`autoLTF`):** Suggests an appropriate lower timeframe (LTF) for granular intra-bar analysis. 3. **Timeframe Manipulation and Comparison:** Includes tools for working with timeframe strings: - **Build & Split (`buildTF`, `splitTF`):** Functions to programmatically construct valid Pine Script timeframe strings (e.g., "4H") and parse them back into their numeric and unit components. - **Comparison (`isHigherTF`, `isActiveTF`, `isLowerTF`):** A set of functions to check if a given timeframe is higher, lower, or the same as the script's active timeframe. - **Multiple Validation (`isMultipleTF`):** Checks if a higher timeframe is a practical multiple of the current timeframe. This is based on the assumption that checking if recent, completed HTF periods contained more than one bar is a valid proxy for preventing data gaps. 4. **Timestamp Interpolation:** Contains an `interpTimestamp()` function that calculates an absolute timestamp by interpolating at a given percentage across a specified range of bars (e.g., 50% of the way through the last 20 bars), enabling time calculations at a resolution finer than the chart's native bars. --- **DISCLAIMER** This library is provided "AS IS" and for informational and educational purposes only. It does not constitute financial, investment, or trading advice. The author assumes no liability for any errors, inaccuracies, or omissions in the code. Using this library to build trading indicators or strategies is entirely at your own risk. As a developer using this library, you are solely responsible for the rigorous testing, validation, and performance of any scripts you create based on these functions. The author shall not be held liable for any financial losses incurred directly or indirectly from the use of this library or any scripts derived from it. buildTF(quantity, unit) Builds a Pine Script timeframe string from a numeric quantity and a unit enum. The resulting string can be used with `request.security()` or `input.timeframe`. Parameters: quantity (int) : series int Number to specifie how many `unit` the timeframe spans. unit (series TFUnit) : series TFUnit The size category for the bars. Returns: series string A Pine-style timeframe identifier, e.g. "5S" → 5-seconds bars "30" → 30-minute bars "120" → 2-hour bars "1D" → daily bars "3M" → 3-month bars "24M" → 2-year bars splitTF(tf) Splits a Pine‑timeframe identifier into numeric quantity and unit (TFUnit). Parameters: tf (string) : series string Timeframe string, e.g. "5S", "30", "120", "1D", "3M", "24M". Returns: quantity series int The numeric value of the timeframe (e.g., 15 for "15", 3 for "3M"). unit series TFUnit The unit of the timeframe (e.g., TFUnit.minutes, TFUnit.months). Notes on strings without a suffix: • Pure digits are minutes; if divisible by 60, they are treated as hours. • An "M" suffix is months; if divisible by 12, it is converted to years. autoHTF(tf) Picks an appropriate **higher timeframe (HTF)** relative to the selected timeframe. It steps up along a coarse ladder to produce sensible jumps for top‑down analysis. Mapping → chosen HTF: ≤ 1 min → 60 (1h) ≈ ×60 ≤ 3 min → 180 (3h) ≈ ×60 ≤ 5 min → 240 (4h) ≈ ×48 ≤ 15 min → D (1 day) ≈ ×26–×32 (regular session 6.5–8 h) > 15 min → W (1 week) ≈ ×64–×80 for 30m; varies with input ≤ 1 h → W (1 week) ≈ ×32–×40 ≤ 4 h → M (1 month) ≈ ×36–×44 (~22 trading days / month) > 4 h → 3M (3 months) ≈ ×36–×66 (e.g., 12h→×36–×44; 8h→×53–×66) ≤ 1 day → 3M (3 months) ≈ ×60–×66 (~20–22 trading days / month) > 1 day → 12M (1 year) ≈ ×(252–264)/quantity ≤ 1 week → 12M (1 year) ≈ ×52 > 1 week → 48M (4 years) ≈ ×(208)/quantity = 1 M → 48M (4 years) ≈ ×48 > 1 M → error ("HTF too big") any → error ("HTF too big") Notes: • Inputs in months or years are restricted: only 1M is allowed; larger months/any years throw. • Returns a Pine timeframe string usable in `request.security()` and `input.timeframe`. Parameters: tf (string) : series string Selected timeframe (e.g., "D", "240", or `timeframe.period`). Returns: series string Suggested higher timeframe. autoLTF(tf) Selects an appropriate **lower timeframe LTF)** for intra‑bar evaluation based on the selected timeframe. The goal is to keep intra‑bar loops performant while providing enough granularity. Mapping → chosen LTF: ≤ 1 min → 1S ≈ ×60 ≤ 5 min → 5S ≈ ×60 ≤ 15 min → 15S ≈ ×60 ≤ 30 min → 30S ≈ ×60 > 30 min → 60S (1m) ≈ ×31–×59 (for 31–59 minute charts) ≤ 1 h → 1 (1m) ≈ ×60 ≤ 2 h → 2 (2m) ≈ ×60 ≤ 4 h → 5 (5m) ≈ ×48 > 4 h → 15 (15m) ≈ ×24–×48 (e.g., 6h→×24, 8h→×32, 12h→×48) ≤ 1 day → 15 (15m) ≈ ×26–×32 (regular sessions ~6.5–8h) > 1 day → 60 (60m) ≈ ×(26–32) per day × quantity ≤ 1 week → 60 (60m) ≈ ×32–×40 (≈5 sessions of ~6.5–8h) > 1 week → 240 (4h) ≈ ×(8–10) per week × quantity ≤ 1 M → 240 (4h) ≈ ×33–×44 (~20–22 sessions × 6.5–8h / 4h) ≤ 3 M → D (1d) ≈ ×(20–22) per month × quantity > 3 M → W (1w) ≈ ×(4–5) per month × quantity ≤ 1 Y → W (1w) ≈ ×52 > 1 Y → M (1M) ≈ ×12 per year × quantity Notes: • Ratios for D/W/M are given as ranges because they depend on **regular session length** (typically ~6.5–8h, not 24h). • Returned strings can be used with `request.security()` and `input.timeframe`. Parameters: tf (string) : series string Selected timeframe (e.g., "D", "240", or timeframe.period). Returns: series string Suggested lower TF to use for intra‑bar work. isNewPeriod(tf, offset) Returns `true` when a new session-aligned period begins, or on the Nth bar of that period. Parameters: tf (string) : series string Target higher timeframe (e.g., "D", "W", "M"). offset (simple int) : simple int 0 → checks for the first bar of the new period. 1+ → checks for the N-th bar of the period. Returns: series bool `true` if the condition is met. sinceNewPeriod(tf, offset) Counts how many bars have passed within a higher timeframe (HTF) period. For daily, weekly, and monthly resolutions, the period is aligned with the trading session. Parameters: tf (string) : series string Target parent timeframe (e.g., "60", "D"). offset (simple int) : simple int 0 → Running count for the current period. 1+ → Finalized count for the Nth most recent *completed* period. Returns: series int Number of bars. isHigherTF(tf, main) Returns `true` when the selected timeframe represents a higher resolution than the active timeframe. Parameters: tf (string) : series string Selected timeframe. main (bool) : series bool When `true`, the comparison is made against the chart's main timeframe instead of the script's active timeframe. Optional. Defaults to `false`. Returns: series bool `true` if `tf` > active TF; otherwise `false`. isActiveTF(tf, main) Returns `true` when the selected timeframe represents the exact resolution of the active timeframe. Parameters: tf (string) : series string Selected timeframe. main (bool) : series bool When `true`, the comparison is made against the chart's main timeframe instead of the script's active timeframe. Optional. Defaults to `false`. Returns: series bool `true` if `tf` == active TF; otherwise `false`. isLowerTF(tf, main) Returns `true` when the selected timeframe represents a lower resolution than the active timeframe. Parameters: tf (string) : series string Selected timeframe. main (bool) : series bool When `true`, the comparison is made against the chart's main timeframe instead of the script's active timeframe. Optional. Defaults to `false`. Returns: series bool `true` if `tf` < active TF; otherwise `false`. isMultipleTF(tf) Returns `true` if the selected timeframe (`tf`) is a practical multiple of the active skript's timeframe. It verifies this by checking if `tf` is a higher timeframe that has consistently contained more than one bar of the skript's timeframe in recent periods. The period detection is session-aware. Parameters: tf (string) : series string The higher timeframe to check. Returns: series bool `true` if `tf` is a practical multiple; otherwise `false`. interpTimestamp(offStart, offEnd, pct) Calculates a precise absolute timestamp by interpolating within a bar range based on a percentage. This version works with RELATIVE bar offsets from the current bar. Parameters: offStart (int) : series int The relative offset of the starting bar (e.g., 10 for 10 bars ago). offEnd (int) : series int The relative offset of the ending bar (e.g., 1 for 1 bar ago). Must be <= offStart. pct (float) : series float The percentage of the bar range to measure (e.g., 50.5 for 50.5%). Values are clamped to the range. Returns: series int The calculated, interpolated absolute Unix timestamp in milliseconds.Libreria Pine Script®di AustrianTradingMachineAggiornato 3
AG_STRATEGY📈 AG_STRATEGY — Smart Money System + Sessions + PDH/PDL AG_STRATEGY is an advanced Smart Money Concepts (SMC) toolkit built for traders who follow market structure, liquidity and institutional timing. It combines real-time market structure, session ranges, liquidity levels, and daily institutional levels — all in one clean, professional interface. ✅ Key Features 🧠 Smart Money Concepts Engine Automatic detection of: BOS (Break of Structure) CHoCH (Change of Character) Dual structure system: Swing & Internal Historical / Present display modes Optional structural candle coloring 🎯 Liquidity & Market Structure Equal Highs (EQH) and Equal Lows (EQL) Marks strong/weak highs & lows Real-time swing confirmation Clear visual labels + smart positioning ⚡ Fair Value Gaps (FVG) Automatic bullish & bearish FVGs Higher-timeframe compatible Extendable boxes Auto-filtering to remove noise 🕓 Institutional Sessions Asia London New York Includes: High/Low of each session Automatic range plotting Session background shading London & NY Open markers 📌 PDH/PDL + Higher-Timeframe Levels PDH / PDL (Previous Day High/Low) Dynamic confirmation ✓ when liquidity is swept Multi-timeframe level support: Daily Weekly Monthly Line style options: solid / dashed / dotted 🔔 Built-in Alerts Internal & swing BOS / CHoCH Equal Highs / Equal Lows Bullish / Bearish FVG detected 🎛 Fully Adjustable Interface Colored or Monochrome visual mode Custom label sizes Extend levels automatically Session timezone settings Clean, modular toggles for each component 🎯 Designed For Traders Who Follow institutional order flow Enter on BOS/CHoCH + FVG + Liquidity sweeps Trade London & New York sessions Want structure and liquidity clearly mapped Prefer clean charts with full control 💡 Why AG_STRATEGY Stands Out ✔ Professional SMC engine ✔ Real-time swing & internal structure ✔ Session-based liquidity tracking ✔ Non-cluttered chart — high clarity ✔ Supports institutional trading workflowsIndicatore Pine Script®di agoney70
GARCH Range PredictorThis was inspired by deltatrendtrading's video on GARCH models to predict daily trading ranges and identify favorable trading conditions. Based on advanced volatility forecasting techniques, it predicts whether a trading day's true range will exceed a threshold, helping traders decide when to trade or skip a session. Key Features GARCH(1,1) Volatility Modeling: Uses log-transformed true ranges with exponential moving average centering Forward-Looking Predictions: Makes predictions at session start before the day unfolds Dynamic or Static Thresholds: Choose between fixed dollar thresholds or adaptive 20-day averages Accuracy Tracking: Monitors prediction accuracy with overall and recent (20-day) hit rates Visual Session Boxes: Colors trading sessions green (trade) or red (skip) based on predictions Real-Time Statistics: Displays current predictions, thresholds, and performance metrics How It Works Data Transformation: Log-transforms daily true ranges and centers them using an EMA Variance Modeling: Updates GARCH variance using: σ²ₜ = ω + α(residual²) + β(σ²ₜ₋₁) Prediction Generation: Back-transforms log predictions to dollar values Signal Generation: Compares predictions to threshold to generate trade/skip signals Performance Tracking: Validates predictions against actual outcomes Parameters GARCH Parameters (ω, α, β): Control volatility persistence and mean reversion EMA Period: Smoothing period for log range centering Threshold Settings: Static dollar amount or dynamic multiplier of recent averages Session Time: Define regular trading hours for analysis Best Use Cases Breakout and momentum strategies that perform better on high-range days Risk management by avoiding low-volatility sessions Futures day trading (optimized for MNQ/NQ detection) Any strategy where daily range impacts profitability Important Notes Requires 5+ sessions for initialization and warm-up Accuracy depends heavily on proper parameter tuning for your specific instrument Default parameters may need adjustment for different markets Monitor the hit rate to validate effectiveness on your timeframeIndicatore Pine Script®di yundore59
Session Volume Spike DetectorSession Volume Spike Detector (Buy/Sell, Dual Windows, MTF + Edge/Cooldown) What it does Detects statistically significant buy/sell volume spikes inside two DST-aware Mountain Time sessions and projects 1m / 5m / 10m signals onto any chart timeframe (even 1s). Spikes are confirmed at the close of their native bar and are edge-triggered with optional cooldowns to prevent duplicate alerts. How spikes are detected Volume ≥ SMA × multiplier Optional jump vs recent highest volume Optional Z-Score gate for significance Separate Buy/Sell logic using your Direction Mode (Prev Close or Candle Body) Multi-Timeframe (MTF) display Shows 1m, 5m, 10m arrows on your current chart Each HTF fires once on its bar close (no repaint after close) Sessions (DST-aware, MT) Morning: 05:30–08:30 Midday: 11:00–13:30 Spikes only count inside these windows. Inputs & styling Thresholds: SMA length, multipliers, recent lookback, Z-Score toggle/level Toggles for which TFs to display (chart TF, 1m, 5m, 10m) Per-TF colors + cooldowns (seconds) for Any TF, 1m, 5m, 10m Alerts (edge + cooldown) MTF Volume Spike (Any TF) — fires on the first qualifying spike across enabled TFs 1m / 5m / 10m Volume Spike — per-TF alerts, Buy or Sell Recommended: set alert Trigger = Once per bar close. Cooldowns tame “triggered too often” warnings. Great with FVG zones, bank/insto levels, session range breaks, and trend filters. Use the MTF arrows as a participation/pressure tell to confirm or fade moves. Notes Works on any symbol/timeframe; best viewed on 1m or sub-minute charts. HTF spikes appear on the bar close of 1m/5m/10m respectively. No dynamic plot titles; Pine v6-safe. Short summary (≤250 chars): MTF volume-spike detector for intraday sessions (DST-aware, MT). Projects 1m/5m/10m buy/sell spikes onto any chart, with edge-triggered alerts and per-TF cooldowns to prevent duplicates. Ideal for spotting institutional participation.Indicatore Pine Script®di JasonHyde29
Institutional Levels (CNN) - [PhenLabs]📊Institutional Levels (Convolutional Neural Network-inspired) Version : PineScript™v6 📌Description The CNN-IL Institutional Levels indicator represents a breakthrough in automated zone detection technology, combining convolutional neural network principles with advanced statistical modeling. This sophisticated tool identifies high-probability institutional trading zones by analyzing pivot patterns, volume dynamics, and price behavior using machine learning algorithms. The indicator employs a proprietary 9-factor logistic regression model that calculates real-time reaction probabilities for each detected zone. By incorporating CNN-inspired filtering techniques and dynamic zone management, it provides traders with unprecedented accuracy in identifying where institutional money is likely to react to price action. 🚀Points of Innovation ● CNN-Inspired Pivot Analysis - Advanced binning system using convolutional neural network principles for superior pattern recognition ● Real-Time Probability Engine - Live reaction probability calculations using 9-factor logistic regression model ● Dynamic Zone Intelligence - Automatic zone merging using Intersection over Union (IoU) algorithms ● Volume-Weighted Scoring - Time-of-day volume Z-score analysis for enhanced zone strength assessment ● Adaptive Decay System - Intelligent zone lifecycle management based on touch frequency and recency ● Multi-Filter Architecture - Optional gradient, smoothing, and Difference of Gaussians (DoG) convolution filters 🔧Core Components ● Pivot Detection Engine - Advanced pivot identification with configurable left/right bars and ATR-normalized strength calculations ● Neural Network Binning - Price level clustering using CNN-inspired algorithms with ATR-based bin sizing ● Logistic Regression Model - 9-factor probability calculation including distance, width, volume, VWAP deviation, and trend analysis ● Zone Management System - Intelligent creation, merging, and decay algorithms for optimal zone lifecycle control ● Visualization Layer - Dynamic line drawing with opacity-based scoring and optional zone fills 🔥Key Features ● High-Probability Zone Detection - Automatically identifies institutional levels with reaction probabilities above configurable thresholds ● Real-Time Probability Scoring - Live calculation of zone reaction likelihood using advanced statistical modeling ● Session-Aware Analysis - Optional filtering to specific trading sessions for enhanced accuracy during active market hours ● Customizable Parameters - Full control over lookback periods, zone sensitivity, merge thresholds, and probability models ● Performance Optimized - Efficient processing with controlled update frequencies and pivot processing limits ● Non-Repainting Mode - Strict mode available for backtesting accuracy and live trading reliability 🎨Visualization ● Dynamic Zone Lines - Color-coded support and resistance levels with opacity reflecting zone strength and confidence scores ● Probability Labels - Real-time display of reaction probabilities, touch counts, and historical hit rates for active zones ● Zone Fills - Optional semi-transparent zone highlighting for enhanced visual clarity and immediate pattern recognition ● Adaptive Styling - Automatic color and opacity adjustments based on zone scoring and statistical significance 📖Usage Guidelines ● Lookback Bars - Default 500, Range 100-1000, Controls the historical data window for pivot analysis and zone calculation ● Pivot Left/Right - Default 3, Range 1-10, Defines the pivot detection sensitivity and confirmation requirements ● Bin Size ATR units - Default 0.25, Range 0.1-2.0, Controls price level clustering granularity for zone creation ● Base Zone Half-Width ATR units - Default 0.25, Range 0.1-1.0, Sets the minimum zone width in ATR units for institutional level boundaries ● Zone Merge IoU Threshold - Default 0.5, Range 0.1-0.9, Intersection over Union threshold for automatic zone merging algorithms ● Max Active Zones - Default 5, Range 3-20, Maximum number of zones displayed simultaneously to prevent chart clutter ● Probability Threshold for Labels - Default 0.6, Range 0.3-0.9, Minimum reaction probability required for zone label display and alerts ● Distance Weight w1 - Controls influence of price distance from zone center on reaction probability ● Width Weight w2 - Adjusts impact of zone width on probability calculations ● Volume Weight w3 - Modifies volume Z-score influence on zone strength assessment ● VWAP Weight w4 - Controls VWAP deviation impact on institutional level significance ● Touch Count Weight w5 - Adjusts influence of historical zone interactions on probability scoring ● Hit Rate Weight w6 - Controls prior success rate impact on future reaction likelihood predictions ● Wick Penetration Weight w7 - Modifies wick penetration analysis influence on probability calculations ● Trend Weight w8 - Adjusts trend context impact using ADX analysis for directional bias assessment ✅Best Use Cases ● Swing Trading Entries - Enter positions at high-probability institutional zones with 60%+ reaction scores ● Scalping Opportunities - Quick entries and exits around frequently tested institutional levels ● Risk Management - Use zones as dynamic stop-loss and take-profit levels based on institutional behavior ● Market Structure Analysis - Identify key institutional levels that define current market structure and sentiment ● Confluence Trading - Combine with other technical indicators for high-probability trade setups ● Session-Based Strategies - Focus analysis during high-volume sessions for maximum effectiveness ⚠️Limitations ● Historical Pattern Dependency - Algorithm effectiveness relies on historical patterns that may not repeat in changing market conditions ● Computational Intensity - Complex calculations may impact chart performance on lower-end devices or with multiple indicators ● Probability Estimates - Reaction probabilities are statistical estimates and do not guarantee actual market outcomes ● Session Sensitivity - Performance may vary significantly between different market sessions and volatility regimes ● Parameter Sensitivity - Results can be highly dependent on input parameters requiring optimization for different instruments 💡What Makes This Unique ● CNN Architecture - First indicator to apply convolutional neural network principles to institutional-level detection ● Real-Time ML Scoring - Live machine learning probability calculations for each zone interaction ● Advanced Zone Management - Sophisticated algorithms for zone lifecycle management and automatic optimization ● Statistical Rigor - Comprehensive 9-factor logistic regression model with extensive backtesting validation ● Performance Optimization - Efficient processing algorithms designed for real-time trading applications 🔬How It Works ● Multi-timeframe pivot identification - Uses configurable sensitivity parameters for advanced pivot detection ● ATR-normalized strength calculations - Standardizes pivot significance across different volatility regimes ● Volume Z-score integration - Enhanced pivot weighting based on time-of-day volume patterns ● Price level clustering - Neural network binning algorithms with ATR-based sizing for zone creation ● Recency decay applications - Weights recent pivots more heavily than historical data for relevance ● Statistical filtering - Eliminates low-significance price levels and reduces market noise ● Dynamic zone generation - Creates zones from statistically significant pivot clusters with minimum support thresholds ● IoU-based merging algorithms - Combines overlapping zones while maintaining accuracy using Intersection over Union ● Adaptive decay systems - Automatic removal of outdated or low-performing zones for optimal performance ● 9-factor logistic regression - Incorporates distance, width, volume, VWAP, touch history, and trend analysis ● Real-time scoring updates - Zone interaction calculations with configurable threshold filtering ● Optional CNN filters - Gradient detection, smoothing, and Difference of Gaussians processing for enhanced accuracy 💡Note This indicator represents advanced quantitative analysis and should be used by traders familiar with statistical modeling concepts. The probability scores are mathematical estimates based on historical patterns and should be combined with proper risk management and additional technical analysis for optimal trading decisions.Indicatore Pine Script®di PhenLabs44332
% of Average Volume% of Average Volume (RVOL) What it is This indicator measures cumulative volume during pre market and separately during the first 10 minutes of trading and compares it to the average 30 day volume. This matters as a high ratio of volume within the premarket and then during the first 10 minutes of trading can correlate to a stock that has a higher probability of trending in that direction throughout the day. What it’s meant to do Identify abnormally high or low participation early in the day. Normalize volume by time of session, so 9:40 volume is compared to past 9:40 volume—not to the full-day total. Provide consistent RVOL across 1–5–15–60 minute charts (the same market state yields similar readings). Handle pre-market cleanly (optional) without inflating RVOL. How it works (plain English) Cumulative Intraday Volume: Adds up all bars from the session (or pre-market, if enabled) up to “now.” Time-Matched Baseline: For each prior day in your lookback, it accumulates only up to the same intraday minute and averages those values. RVOL %: RVOL = (Today cumulative / Average cumulative at same time) × 100. This “like-for-like” approach prevents the classic mistakes that overstate RVOL in pre-market or make it drift with timeframe changes. Works best on Intraday charts: 1, 2, 3, 4, 5, 10, 15, 30, 45, 60 min Regular & extended hours: NYSE/Nasdaq equities, futures, ETFs Daily/weekly views are supported for reference, but the edge comes from intraday time-matched analysis. Tip: For thin names or very early pre-market, expect more variability—lower liquidity increases noise. Customization (Inputs → Settings) Lookback Sessions (e.g., 20): How many prior trading days to build the average. Include Pre-Market (on/off): If on, RVOL accumulates from pre-market start and compares to historical pre-market at the same time; if off, it begins at the regular session open only. Session Timezone / Exchange Hours: Choose the session definition that matches your market (e.g., NYSE) so “time-matched” means the same thing every day. Cutoff Minute (Optional): Fix a reference minute (e.g., 6:40 a.m. PT / 9:40 a.m. ET) to evaluate RVOL at a standard check-in time. Smoothing (Optional): Apply a short moving average to the RVOL line to reduce jitter. Thresholds & Colors: Set levels (e.g., 150%, 300%) to color the plot/labels and trigger alerts. Show Labels/Debug: Toggle on-chart labels (current RVOL%, baseline vols) for quick audits. On-chart visuals & alerts RVOL% Line/Histogram: Color-coded by thresholds (e.g., >300% “exceptional”, >150% “elevated”). Session Markers: Optional vertical lines for pre-market/regular open. Alerts: RVOL Crosses Above X% (e.g., 150%, 300%) RVOL Crosses Below X% RVOL Rising/Falling (slope-based, optional) Good defaults to start Lookback: 20 sessions Pre-market: Off for large caps, On for momentum screens Thresholds: 150% (notable), 300% (exceptional) Smoothing: 0–3 bars (or off for fastest response) Notes & best practices Timeframe consistency: Because calculations are time-matched, RVOL should remain directionally consistent across intraday timeframes. If you see divergences, confirm your session hours & timezone match your instrument’s exchange. Holiday/half days: These are included in history; you can shorten lookback or exclude such sessions if your workflow prefers. Low-float names: Consider a slightly longer lookback to reduce outlier effects. TL;DR A time-matched RVOL that treats pre-market correctly, stays stable across intraday timeframes, and is fully customizable for your exchange hours, thresholds, and alerts—so you can spot real participation when it matters.Indicatore Pine Script®di UnclePennybagssAggiornato 6
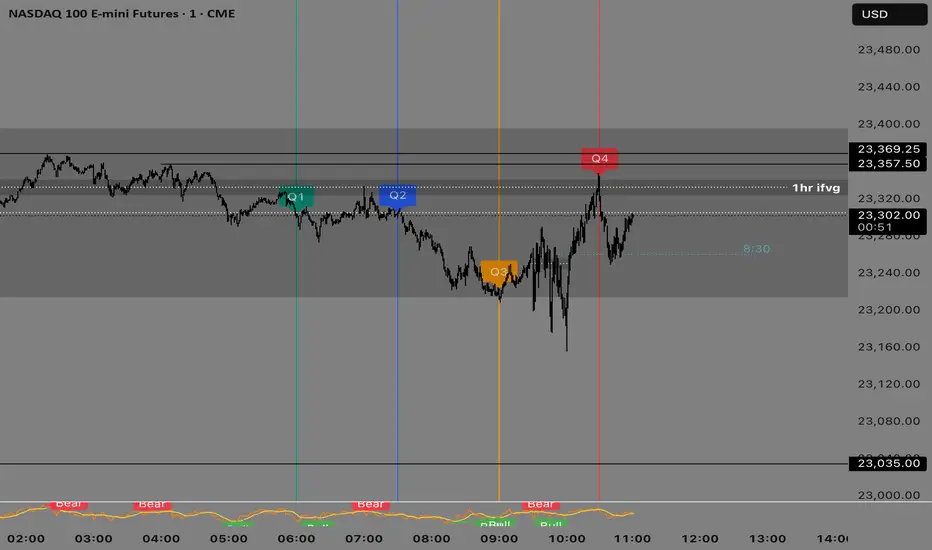
Quarterly Theory —Q1,Q2,Q3,Q4The Quarterly Theory Indicator is a trading tool designed to visualize the natural time-based cycles of the market, based on the principles of Quarterly Theory, popularized by the Inner Circle Trader (ICT). The indicator divides market sessions into four equal “quarters” to help traders identify potential accumulation, manipulation, and distribution phases (AMD model) and improve the timing of entries and exits. Key Features: Quarter Divisions (Q1–Q4): Each market session (e.g., NY AM, London, Asia) is divided into four quarters. Vertical lines mark the beginning of each quarter, making it easy to track session structure. Optional labels show Q1, Q2, Q3, and Q4 directly on the chart. True Open (Q2 Open): The True Open is the opening price of Q2, considered a key reference point in Quarterly Theory. A horizontal red line is drawn at the True Open price with a label showing the exact value. This line helps traders filter bullish and bearish setups: Buy below the True Open if the market is bullish. Sell above the True Open if the market is bearish. Session Awareness: The indicator can automatically detect market sessions and reset lines and labels for each new session. Ensures that only the current session’s True Open and quarter lines are displayed, reducing chart clutter. Timeframe Flexibility: Works on any chart timeframe (1-minute to daily). Maintains accurate alignment of quarters and True Open regardless of the timeframe used. Purpose of Quarterly Theory: Quarterly Theory is based on the idea that market behavior is fractal and time-driven. By dividing sessions into four quarters, traders can anticipate potential market phases: Q1: Initial price discovery and setup for the session. Q2: Accumulation or manipulation phase, where the True Open is established. Q3: Manipulation or Judas Swing phase designed to trap traders. Q4: Distribution or trend continuation/reversal. By visualizing these quarters and the True Open, traders can reduce ambiguity, identify high-probability setups, and improve their timing in line with the ICT AMD (Accumulation, Manipulation, Distribution) framework.Indicatore Pine Script®di samgarratt272114