Daily Asian RangeDaily Asian Range Indicator
This indicator is an enhanced version inspired by @toodegrees' "ICT Friday's Asian Range" indicator. While maintaining the core concepts, this version expands functionality for daily analysis and adds comprehensive customization options.
### Overview
The Asian Range indicator identifies and visualizes potential liquidity areas based on price action during the Asian session (8:00 PM - 12:00 AM ET). It plots both body and wick ranges along with multiple standard deviation levels that can serve as potential price targets or areas of interest.
### Features
- Flexible Display Options
- Choose between Body, Wick, or Both for range boxes and deviation lines
- Customizable colors, styles, and borders for all visual elements
- Historical sessions display (0-20 previous sessions)
- Advanced Standard Deviation Levels
- Multiple deviation multipliers (1.0, 1.5, 2.0, 2.3, 3.5)
- Separate visualization for body and wick-based deviations
- Clear labeling system for easy identification
- Precise Time Management
- Asian session: 8:00 PM - 12:00 AM ET
- Deviation lines extend through the following trading day
- Proper timezone handling for accuracy
### Usage
- Works on timeframes from 1 to 15 minutes
- Use the range boxes to identify key price levels from the Asian session
- Standard deviation levels can serve as potential targets or areas of interest
- Combine with other indicators for enhanced analysis
### Credits
Original concept and base implementation by @toodegrees
Enhanced and expanded by @Omarqqq
### Disclaimer
This indicator is for educational and informational purposes only. Always conduct your own analysis and use proper risk management.
Cerca negli script per "sessions"

Volume EquilibriumThe intent behind this indicator is to provide comprehensive information relating to volume compared to multiple timeframes. This indicator allows one to see what the market 'theoretically' sees as 'fair-value' whilst also allowing one to gauge where the price of a stock is headed.
Volume Equilibrium
The main indicator finds the difference between buying volume and selling volume, under the basic presumption that more buying volume indicates greater bullish sentiment and vice versa.
Buying Volume = volume when close price is higher than open price.
Selling Volume = volume when close price is lower than open price.
Volume Balance = Cumulative Buying Volume − Cumulative Selling Volume
Volume Balance is then expressed as a percentage by dividing by total volume
This indicator is composed of three different lengths of the same indicator. Short, Mid, and Long term representations of Volume Equilibrium. The difference between the mid and long term are highlighted so to make it easy to see where volume is going relative to a longer time frame.
HOW TO USE:
At 0 ---> Equilibrium ---> Equal Buying/Selling Volume
Above 0 ---> More buying Volume
Below 0 ---> More selling Volume
Using theory, it is assumed that the price is at a 'fair-value' when the buying/selling volume is at 0. This is of course relative to the respective timeframe of your choosing. More weight given to larger timeframes.
Volume Histogram
It is a basic volume chart that represents the total volume though has highlighted bars so to indicate buying(green) and selling(red) volume. This allows one to see what the indicator is based off of.
Open-Close Oscillator(not needed)
Calculates the average open-close for a selected timeframe and then provides the current closing price relative to that average open-close. Very simply put, values below 0 indicate bearish and values above 0 generally indicate bullishness. This indicator is for a quick reference of price action relative to volume.
Another way to use this indicator, though unique, is to analyze the separate open-close lines themselves. Using the open-close bands, bullishness is defined as increasing closing prices and bearish as decreasing closing prices. So, in regard to this indicator, bear sessions can be indicated by the opening line being below the closing line and bull sessions as the opening line being above. Use the 'flip' of these lines to your advantage, they are very helpful at capturing long continuous sentiment.
This indicator is composed of great information though I still think it best to use many different indicators to help you with your trades.
NOTE: Be aware of what we are trying to analyze, Volume. This means that one should also look out for divergences to capture early indications of reversals. This indicator can be leveraged greatly.

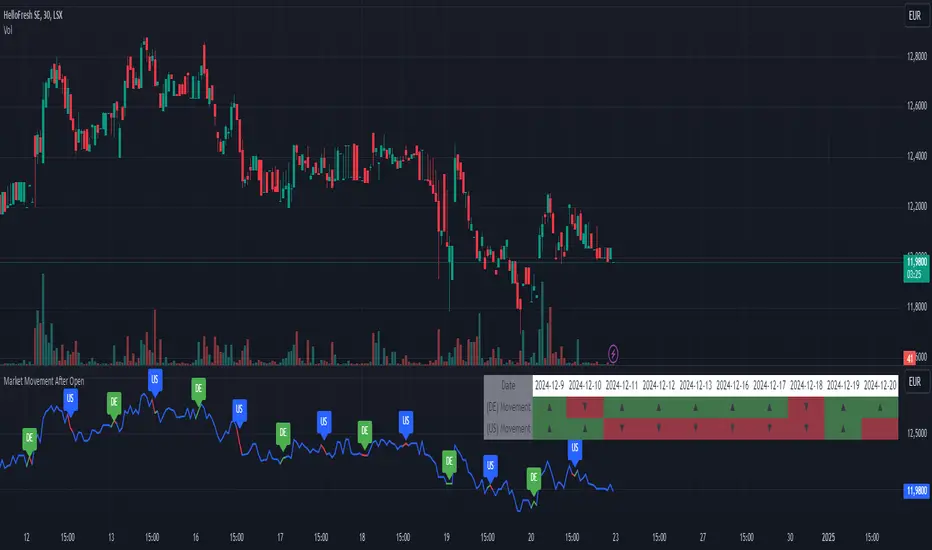
Market Movement After OpenDescription:
This script provides a detailed visualization of market movements during key trading hours: the German market opening (08:00–09:00 UTC+1) and the US market opening (15:30–16:30 UTC+1). It is designed to help traders analyze price behavior in these critical trading periods by capturing and presenting movement patterns and trends directly on the chart and in an interactive table.
Key Features:
Market Movement Analysis:
Tracks the price movement during the German market's first hour (08:00–09:00 UTC+1) and the US market's opening session (15:30–16:30 UTC+1).
Analyzes whether the price moved up or down during these intervals.
Visual Representation:
Dynamically colored price lines indicate upward (green) or downward (red) movement during the respective periods.
Labels ("DE" for Germany and "US" for the United States) mark key moments in the chart.
Historical Data Table:
Displays the past 10 trading days' movement trends in an interactive table, including:
Date: Trading date.
German Market Movement: Up (▲), Down (▼), or Neutral (-) for 08:00–09:00 UTC+1.
US Market Movement: Up (▲), Down (▼), or Neutral (-) for 15:30–16:30 UTC+1.
The table uses color coding for easy interpretation: green for upward movements, red for downward, and gray for neutral.
Real-Time Updates:
Automatically updates during live trading sessions to reflect the most recent movements.
Highlights incomplete periods (e.g., ongoing sessions) to indicate their status.
Customizable:
Suitable for intraday analysis or broader studies of market trends.
Designed to overlay directly on any price chart.
Use Case:
This script is particularly useful for traders who focus on market openings, which are often characterized by high volatility and significant price movements. By providing a clear visual representation of historical and live data, it aids in understanding and capitalizing on market trends during these critical periods.
Notes:
The script works best when the chart is set to the appropriate timezone (UTC+1 for the German market or your local equivalent).
For precise trading decisions, consider combining this script with other technical indicators or trading strategies.
Feel free to share feedback or suggest additional features to enhance the script!
Session High/Low Average & Range [1CG]The Session High/Low Average & Range indicator independently measures the average price movement from the opening price in each direction. It also displays the maximum high and low distance, called Range. Separating the averages and range into highs and lows helps analyze the volatility of the market as well as the direction.
USE EXAMPLES
Session Open
Session Close
Customization
Minimal - 1x and 2x Averages are replaced with custom lines, in order to show distance to3x.
Calculations
Average High: (high price of session - session opening price) / (session period)
Average Low: (session opening price - low price of session) / (session period)
Range High: The highest price of the last (session period)
Range Low: The lowest price of the last (session period)
INPUTS
Session
Here you can choose the hours for your session and time zone. The default is London session in New York time. Next, the session period determines how many sessions to sample from for the average and range lines, the default is 20. Lastly, you can choose the number of sessions to appear on the chart not including the current session if you are in one, 5 by default.
Lines
All of the lines allow you to change the color, width, and style. They also have a label option to choose to display the price. The bottom of the section allows you to change the location and size of the label text.
**Open Line** -Displays the opening price for the length of the session.
**Average Lines** - Displays the 1x, 2x, and 3x the average distance from open in each direction. Additionally, you can toggle a background color to highlight the area.
**Custom Lines** - Displays a customizable multiple of either the average or range. By default the first custom line displays the Range at a 1x multiplier and the second line displays an Average at a 1.5x multiplier
Display Distance
Here you can choose to display the distance from the lines to the open. This data is marked with a “Δ”. For the three Average lines this will display in the area between the line and the open in the position and size of your choice. The custom lines will have the distance information displayed on the line itself. This helps keep the data organized.

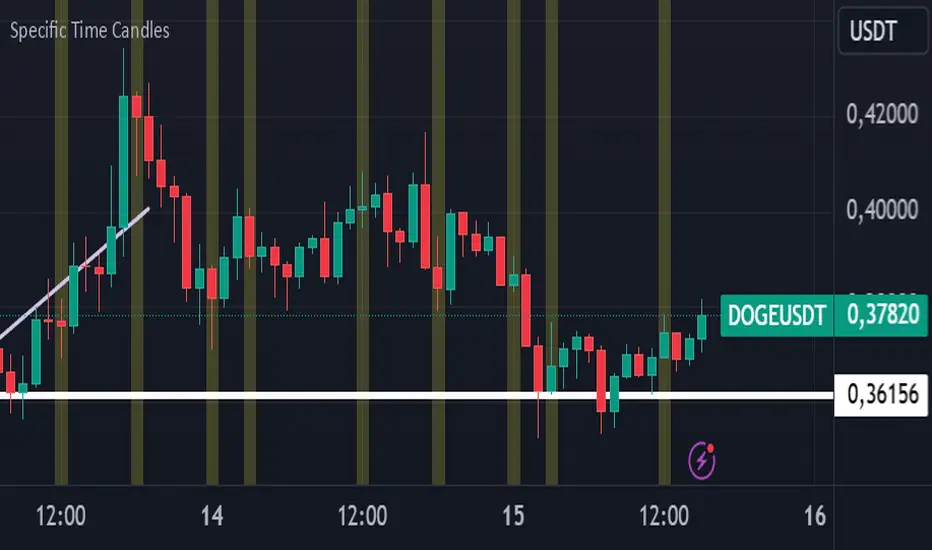
Specific Time CandlesSpecific Time Candles Indicator
The Specific Time Candles indicator is a powerful tool designed for traders who want to focus on specific time intervals within their charts. This custom indicator allows you to highlight and analyze price action during user-defined time periods, providing clarity and precision in your trading strategy.
Key Features:
Custom Time Intervals: Select any start and end time to create candles that focus on your preferred trading hours. This is particularly useful for traders who want to concentrate on market sessions, such as the London or New York session, or any other specific time frame relevant to their trading plan.
Enhanced Visualization: By isolating specific time periods, this indicator helps reduce noise and provides a clearer view of market movements during key trading hours. This can be beneficial for identifying trends, reversals, and potential breakout opportunities.
Flexible Configuration: Easily adjust the indicator settings to match your trading schedule. Whether you are a day trader, swing trader, or scalper, you can customize the time frames to suit your needs.
Compatibility: The indicator is compatible with multiple asset classes, including forex, stocks, commodities, and cryptocurrencies, making it a versatile tool for any trader.
User-Friendly Interface: Designed with simplicity in mind, the Specific Time Candles indicator is easy to set up and use, even for those who are new to TradingView.
How to Use:
Add the indicator to your chart from the TradingView library.
Set your desired start and end times in the indicator settings.
Observe the newly formed candles that represent the specified time intervals.
Use these candles to make informed trading decisions based on the focused analysis of market activity during your chosen periods.
Benefits:
Precision Trading: Focus on the most relevant market data, eliminating distractions from other time periods.
Improved Decision-Making: Gain insights into market behavior during critical times, enhancing your ability to make strategic trades.
Time Management: Efficiently manage your trading by concentrating on specific times, allowing for better planning and execution.
The Specific Time Candles indicator is a must-have for traders looking to refine their strategies by concentrating on precise market windows. Whether you are targeting high-volatility periods or specific trading sessions, this indicator provides the tools you need to succeed.
Key Prices & LevelsThis indicator is designed to visualize key price levels & areas for NY trading sessions based on the price action from previous day, pre-market activity and key areas from NY session itself. The purpose is to unify all key levels into a single indicator, while allowing a user to control which levels they want to visualize and how.
The indicator identifies the following:
Asia Range High/Lows, along with ability to visualize with a box
London Range High/Lows, along with ability to visualize with a box
Previous Day PM Session High/Lows
Current Day Lunch Session High/Lows, starts appearing after 12pm EST once the lunch session starts
New York Open (8:30am EST) price
9:53 Open (root candle) price
New York Midnight (12:00am EST) price
Previous Day High/Lows
First 1m FVG after NY Session Start (after 9:30am), with the ability to configure minimum FVG size.
Opening Range Gap, showing regular market hours close price (previous day 16:15pm EST close), new session open price (9:30am EST open) and optionally the mid-point between the two
Asia Range 50% along with 2, 2.5, 4 and 4.5 deviations of the Asia range in both directions
Configurability:
Each price level can be turned off
Styles in terms of line type, color
Ability to turn on/off labels for price levels and highlighting of prices on price scale
Ability to control label text for price levels
How is it different:
Identifies novel concepts such as 9:53 open, root candle that can be used as a bounce/resistance area during AM/PM sessions as well as confirmation of direction once closed over/under to indicate price's willingness to continue moving in the same direction.
It also shows 1st 1m FVG after New York Session open, that can be used to determine direction of the price action depending on PA's reaction to that area. While both 9:53 and 1m FVG are 1m based markers, these levels are visualized by the indicator on all timeframes from 15s to 1h.
Additionally the indicator is able to both highlight key prices in the price scale pane as well as combine labels to minimize clutter when multiple levels have the same price.
Lastly for in-session ranges such as Lunch High/Low the indicator updates the range in real-time as opposed to waiting for the lunch session to be over.
Globex Trap ZoneGlobex Trap Indicator
A powerful tool designed to identify potential trading opportunities by analyzing the relationship between Globex session ranges and Supply & Demand zones during regular trading hours.
Key Features
Tracks and visualizes Globex session price ranges
Identifies key Supply & Demand zones during regular trading hours
Highlights potential trap areas where price might experience significant reactions
Fully customizable time ranges and visual settings
Clear labeling of Globex highs and lows
How It Works
The indicator tracks two key periods:
Globex Session (Default: 6:00 PM - 9:30 AM)
Monitors overnight price action
Marks session high and low
Helps identify potential range breakouts
Supply & Demand Zone (Default: 8:00 AM - 11:00 AM)
Tracks price action during key market hours
Identifies potential reaction zones
Helps spot institutional trading areas
Best Practices for Using This Indicator
Use on 1-hour timeframe or lower for optimal visualization
Best suited for futures and other instruments traded during Globex sessions
Pay attention to areas where Globex range and Supply/Demand zones overlap
Use in conjunction with your existing trading strategy for confirmation
Recommended minimum of 10 days of historical data for context
Settings Explanation
Globex Session: Customizable time range for overnight trading session
Supply & Demand Zone: Adjustable time range for regular trading hours
Days to Look Back: Number of historical days to display (default: 10)
Visual Settings: Customizable colors and transparency for both zones
Important Notes
All times are based on exchange timezone
The indicator respects overnight sessions and properly handles timezone transitions
Historical data requirements: Minimum 10 days recommended
Performance impact: Optimized for smooth operation with minimal resource usage
Disclaimer
Past performance is not indicative of future results. This indicator is designed to be used as part of a comprehensive trading strategy and should not be relied upon as the sole basis for trading decisions.
Updates and Support
I actively maintain this indicator and welcome feedback from the trading community. Please feel free to leave comments or suggestions for improvements.

Gap Detector [MS]This indicator helps traders identify and visualize price gaps in market data. When price movements create gaps between trading sessions or periods, the script highlights these areas with colored clouds and markers.
Key Features:
Automatically detects price gaps based on a customizable gap percentage threshold
Visualizes gaps using color-coded clouds (green when price moves upward, red for downward price action)
Places small triangle markers at gap locations for easy identification of gaps, and if many happen close together
Shows gray clouds when price is within the last gap
Use it For:
Watching for gap-fills
Gap support/resistance levels
Trading gap breakouts
...and more
How it Works:
The script compares each bar's opening price with the previous bar's closing price. A gap is identified when the opening price is significantly different from the previous close (beyond the user-defined gap percentage). The gap area is then marked with a colored cloud:
Green clouds: Show gaps where price jumped higher
Red clouds: Show gaps where price dropped lower
Gray clouds: Indicate price action within the gap
Settings:
Gap %: Controls the minimum price difference required to identify a gap (default 0.01 or 1%)
This indicator can help traders:
Identify potential support/resistance levels at gap areas
Monitor gap-filling scenarios
Spot significant price movements between trading sessions
The script is designed to work across all timeframes and markets.

Session Range Breakouts With Targets [AlgoAlpha]⛓️💥Session Range Breakouts With Targets 🚀
Introducing the "Session Range Breakouts With Targets" indicator by AlgoAlpha, a powerful tool for traders to capitalize on session-based range breakouts and identify precise target zones using ATR-based calculations! Whether you trade the Asian, American, European, or Oceanic sessions, this script highlights key breakout levels and targets that adapt to market volatility, ensuring you're always prepared for those crucial price movements. 🕒📊
Session-based Trading : The indicator highlights session-specific ranges, offering clear breakouts for Asian, American, European, Oceanic, and even custom sessions 🌍.
Adaptive Volatility Zones : Uses ATR to determine dynamic zone widths, filtering out fakeouts and adjusting to market conditions ⚡.
Precise Take-Profit Targets : Set multiple levels of take-profits based on ATR multipliers, ensuring you can manage both aggressive and conservative trades 🎯.
Customizable Appearance : Tailor the look with customizable colors for session highlights and breakout zones to fit your chart style 🎨.
Alerts on Key Events : Built-in alert conditions for breakouts and take-profit hits, so you never miss a trading opportunity 🔔.
🚀 Quick Guide to Using the Indicator
🛠 Add the Indicator : Add the indicator to favorites by pressing the star icon. Choose your session (Asia, America, Europe, Oceana, or Custom) and adjust the ATR length, zone width multiplier, and target multipliers to suit your strategy.
📊 Analyze Breakouts : Watch for the indicator to plot upper and lower range boxes based on session highs and lows. Price breaking through these boxes will signal a potential entry.
📈 Monitor Targets : Track bullish and bearish targets as price moves, with up to three take-profit levels based on ATR multipliers.
🔔 Set Alerts : Enable alerts for session breakouts or when price hits your designated take-profit targets.
🔍 How It Works
This script operates by identifying session-specific ranges based on highs and lows from the beginning of the selected session (Asia, America, Europe, or others). After a user-defined wait period (default: 120 bars), it calculates the highest and lowest points and creates upper and lower zones using the Average True Range (ATR) to adapt to market volatility. If the price breaks above or below these zones, it is identified as a breakout, and the script dynamically calculates up to three take-profit targets for both bullish and bearish scenarios using an ATR multiplier. The indicator also includes alerts for breakouts and take-profit hits, providing real-time trading signals.

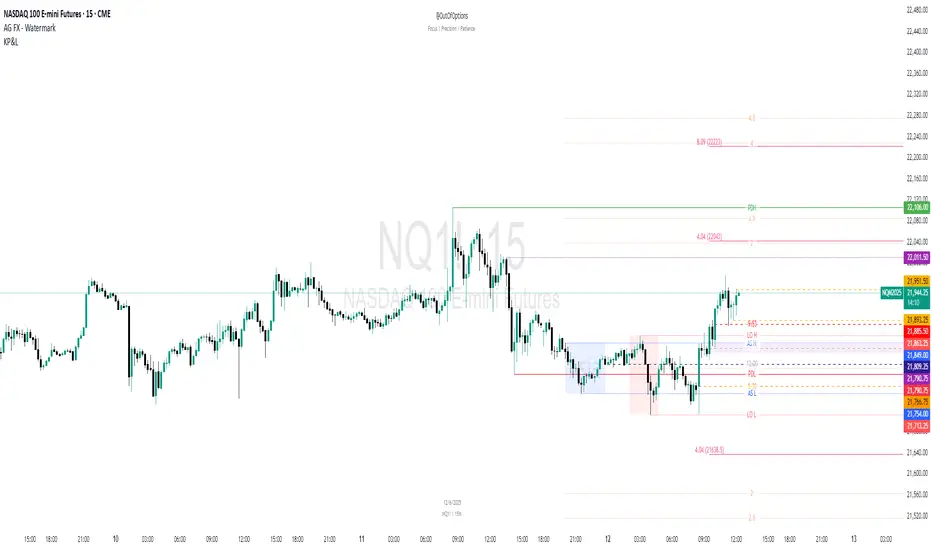
NY 5M ORB-COMEX OpenThe indicator is designed to display dynamic and static key market levels, including Opening Range Breakout (ORB) levels, Initial Daily Range (IDR), and other important session levels. It offers extensive customization to accommodate a variety of trading strategies and sessions, all while providing an adaptable user interface for traders to personalize their charts.
#### Key Features:
1. **Session Timings**:
- The script allows you to define regular and extended market hours. These timings can be adjusted using input fields for the market open range, session start, and session end times, with default settings for the U.S. stock market.
2. **Opening Range Breakout (ORB)**:
- You can enable or disable lines for the High/Low (H/L) and Open/Close (O/C) of the first 5-minute candle, which are key for ORB strategies.
- Optional middle lines are provided for both H/L and O/C, offering additional reference points for price action.
3. **Multiple Plot Styles and Line Types**:
- The script includes customization for line styles (Solid, Dashed, or Dotted) and colors for ORB, IDR, and session markers, giving traders flexibility in visualizing key market levels.
4. **Dynamic and Static Levels**:
- Users can choose to display either dynamic or static lines for additional price levels that extend throughout the session. Dynamic levels automatically adapt based on the session’s high and low, while static levels are manually configured.
- These lines can also display labels with the option to turn on or off their visibility.
5. **Custom Time Zone and Session Adjustments**:
- The script offers full flexibility in adjusting session timings based on different time zones, which is crucial for global traders working in different markets.
6. **Background Shading**:
- You can add shading between high and low levels for a more visual representation of ranges during specific sessions (e.g., ORB or IDR), and customize the color and transparency of this background.
7. **Comex Open Indicator**:
- An additional feature highlights the Comex Open, with optional labels, making it useful for traders who follow commodities markets.
#### Known Issues:
- The indicator requires a chart with intraday time frames (e.g., 1-minute, 5-minute) for accurate display.
- Extensive customization may lead to performance issues on lower-end machines or in high-frequency chart environments due to the number of drawn elements (lines, boxes, labels).
This indicator is suitable for advanced traders who need detailed control over their session timing and price level analysis, with multiple layers of customization for visualizing key market behaviors.

Custom 4-Hour Candle Colors with Opening Price LinesDescription:
This indicator enhances the visual clarity of 4-hour candles by allowing users to assign custom colors to each 4-hour time block on their chart. It also provides the option to plot horizontal lines at the opening price of each 4-hour candle, with the lines extending for a customizable duration (up to 36 hours), making it easy to track the opening price levels over time.
Features:
Custom 4-Hour Candle Colors: Define unique colors for each 4-hour candle block on the chart. You can configure the colors for six different 4-hour periods, making it easier to visually differentiate between different parts of the trading day.
Opening Price Lines: The indicator plots horizontal lines at the opening price of each 4-hour candle, with the option to extend the lines for up to 36 hours into the future. The lines can also have different colors, which you can configure separately for each time block.
Flexible Time Configuration: Set custom open times for each 4-hour candle block, allowing you to adjust the indicator to match specific market sessions or time zones.
Fully Customizable: Choose both the candle colors and the opening price line colors independently for each 4-hour period. This allows for a highly personalized chart setup.
Use Cases:
Session Tracking: Easily track different trading sessions by assigning specific colors to different time periods.
Key Price Levels: Keep an eye on important opening price levels throughout the day by extending opening price lines into the future.
Visual Organization: For traders who prefer color-coded charts for improved readability, this indicator helps to organize trading days visually by color-blocking each time segment.
Important Notes:
Due to TradingView’s limitations, the opening price lines can only extend up to 500 bars into the future. The indicator automatically limits the duration of the lines to this maximum.
The script is designed to be flexible and user-friendly, allowing for easy adjustments to suit different trading styles and market conditions.

Killzones And Macros LibraryKillzones & Macros Library for Trading Sessions
This Pine Script library is designed to help traders identify and act during high-volatility trading windows, commonly referred to as "Killzones." These are specific times during the day when institutional traders are most active, resulting in increased liquidity and price movement. The library provides boolean fields that return true when the current time falls within one of the killzones or macroeconomic event windows, allowing for enhanced trade timing and precision.
Killzones Include:
London Open, New York Open, Midnight Open, London Lunch, New York PM, and more.
Capture high-volume periods like Power Hour, Equities Open, and Asian Range.
Macros:
Identify key moments like London 02:33, New York 08:50, and other significant times aligned with market movements or events.
This library is perfect for integrating into your custom strategies, backtesting, or setting alerts for optimal trade execution during major trading sessions and events.

MM Day Trader LevelsAs an intraday trader, there are certain key levels that I care about for short-term price action on every single chart. When I first began day trading, each morning I would painstakingly mark those key levels off on the charts I planned to trade each day. Depending on the number of charts I was watching, this would take up quite a bit of my time that I felt would have been much better spent doing other things. It also meant that those levels would often be left behind, and on later days I might be trading a symbol and get confused when a line appeared and I'd be paying attention to it only to later discover that it wasn't from prior day, but from some other day in the past when I had marked it off.
I looked all over TradingView to find indicators that did this automatically for me, and I found a lot of them. One by one I tried them, and inevitably I would always find that something was wrong with them. Often they didn't have all of the levels I wanted (so I would have to combine multiple indicators), but more often I found that the levels would be incorrect, or they would be buggy and not appear consistently, or they would not appear at the right time, or they would not work on futures! The list of problems went on and on. And the biggest issue I found was that nobody knew how to get session volume profile in an indicator.
So, over the course of a few years I figured out how to solve all of those problems and now I'm thrilled to present this free indicator for everyone like me who trades intraday and wants a clean consistent way to see the prior day levels that they care about automatically on every single chart (even futures). The levels the indicator provides are:
Yesterday High & Low
Value Area High & Low & Point of Control
Today's Open
Yesterday's Close (aka "Settlement" on futures)
Premarket High & Low (non-futures only)
Overnight High & Low (futures only)
These levels are extremely important, and I expect price to be reactive to them, so each level has a shaded background behind it so that the levels stand out against other lines you may have on your chart. I try to keep configuration as simple as possible, but there are configuration options that allow you to:
Hide any of the levels
Change the color for the levels
Shade the value area (or not)
Change the label text, size, type (basic label or plain text) and location (how far to the right of last candle to place the label
Adjust session volume profile value area volume & number of rows
The biggest advantage to this indicator over others on TradingView is how it handles session volume profile. When it comes to futures, TradingView does differentiate between regular trading hours and "electronic" trading hours on the charts, but their timeframes for those sessions are unusual, and they do not provide any programmatic way to differentiate between them. So, I created a whole new library for dealing with futures sessions that is fully integrated into both my Session Volume Profile library and this indicator, allowing me to bring you the best and only custom indicator available on TradingView that provides you with true regular session volume profile information across every type of symbol, including futures.
I'm incredibly proud of everything I've been able to provide with this indicator, and even more thrilled to say that I'm proud of how the indicator has been implemented. Once again releasing this indicator and all associated code for free and open source. I encourage you to take a look at the source code to see how it all works, take advantage of the free underlying libraries I created to make all of this possible: Session Library and Session Volume Profile Library.

Weighted Volume Profile Pivot Points | Flux Charts💎 GENERAL OVERVIEW
Introducing our new Weighted Volume Profile Pivot Points (WVPPP) Indicator! This indicator renders a volume profile using the latest pivot points, automatically adjusting itself when new pivots occur. The pivoting mode can be switched between default pivot points and order blocks mode. It can be adjusted to give more weight to recent or past candlesticks, or can be used as a normal volume profile. For more information, please read the full write-up.
Features of the new Weighted Volume Profile Pivot Points (WVPPP) Indicator :
Renders Volume Profile Of The Range Between Latest Pivots
Two Pivoting Modes Including Order Blocks Mode
Adjustable Weighthing Towards Past or Recent
Customizable Row Count & Maximum Distance
Left or Right Alignment
More Styling Options
🚩UNIQUENESS
This indicator stands out with two key features. One is it's ability to weight volumes based on their distance to the current time. Giving weight to volumes may offer new trading opportunities to traders as they can now see the most recent Point Of Control (POC) or a more powerful but past POC based on their choice. Another key feature the indicator has is that it automatically finds latest valid pivot points, and uses that range for the volume profile. The range changes dynamically as new pivots points emerge. You can select between normal pivot points and order blocks mode. The indicator also has a variety of useful styling settings such as aligning the volume profile to the right or the left of the chart, POC Line styling and color settings for bullish & bearish volumes.
📌 HOW DOES IT WORK ?
A volume profile provides an in-depth look at trading activity over a period of time by plotting a histogram on the price axis. This indicator can also give weight to volumes based on their distance to the current time, essentially determining their importance for the profile. The range which the volume profile will cover is determined by the latest pivot points. Here is how it works step-by-step :
1. Determine how much candlesticks the volume profile will cover (Analyze Bars setting)
2. Find the latest pivot points. If the mode is set to "Pivots", the pivot points are the candlesticks which has the highest / lowest wick in X amount of bars (Swing Length setting). If the mode is set to "Order Blocks", the volume profile range is the area between the latest buyside order block and the sellside order block. Order blocks occur when there is a high amount of market orders exist on a price range. It is possible to find order blocks using specific candlestick formations on the chart. For more information about the order block detection, I suggest you checking the write-up of our "Volumized Order Blocks" script. Increasing the "Swing Length" setting is recommended when the mode is set to "Pivots", as this will help in finding stronger pivot points.
3. Make a range using the latest pivot points, then divide it into rows (Row Count setting)
4. Then for each candlestick, add it's volume to the corresponding row in the range. Note that the volume can be added into several rows if it overlaps with them all.
5. If the candlestick is a bullish candlestick, we add it's volume into the bullish volume of the row, if it's a bearish candlestick, we add it to the bearish volume of the row.
With the weighted volume mode, which is activated if "Volume Weighthing" setting is set to "Recent" or "Past", all volumes get a penalty based on their distance to the latest candletstick. For example, if the setting is set to "Recent", the latest candlestick contributes it's volume by 100% to the corresponding row, but the candlestick which is 50 candlesticks far from the current candlestick only contributes it's volume by ~17% to the row. The same applies to the "Past" setting, but in the reversed order, where past candlesticks have more priority than the current ones.
Volume contribution percent for "Recent" setting : ((100 * 0.85) / (i + 1)) + (100 * (1.0 - 0.85))
Volume contribution percent for "Past" setting : ((100 * 0.85) * ((i + 1) / N)) + (100 * (1.0 - 0.85))
Where i = candlestick index from right to left, N = total number of candlesticks analyzed by the volume profile.
The Point Of Control (POC) line is drawn from the row with the most total volume, and is generally considered as a strong level because a lot of trading volume happened on that particular row. Traders may use this line as a support & resistance level.
We believe that automatically ranging the volume profile to important pivot points will help traders see crucial volume information easier without unnecessary hassle. Traders can use this indicator to have an insight of areas which price moves quickly without much volume, or see areas that holds the price still for much longer and plan their trades accordingly.
⚙️SETTINGS
1. General Configuration
Mode -> The pivoting mode that is switchable between "Pivots" and "Order Blocks" as described in the write-up. Please read the upper section to understand how this setting works.
Analyze Bars -> Total amount of bars that will be analyzed by the indicator from right to left.
Row Count -> The amount of rows that will the vertical range between pivot points will be divided into.
Volume Weighting -> The volume weighting mode as explained in the write-up.
2. Style
Highlight Sessions -> The volume profile sessions will be highlighted with a blue tint. To prevent confusion, highlighting will not work if the alignment is set to "Right".
Align To -> The alignment of the volume profile.

chrono_utilsLibrary "chrono_utils"
Collection of objects and common functions that are related to datetime windows session days and time
ranges. The main purpose of this library is to handle time-related functionality and make it easy to reason about a
future bar checking if it will be part of a predefined session and/or inside a datetime window. All existing session
functionality I found in the documentation e.g. "not na(time(timeframe, session, timezone))" are not suitable for
strategy scripts, since the execution of the orders is delayed by one bar, due to the script execution happening at
the bar close. Moreover, a history operator with a negative value that looks forward is not allowed in any pinescript
expression. So, a prediction for the next bar using the bars_back argument of "time()"" and "time_close()" was
necessary. Thus, I created this library to overcome this small but very important limitation. In the meantime, I
added useful functionality to handle session-based behavior. An interesting utility that emerged from this
development is the data anomaly detection where a comparison between the prediction and the actual value is happening.
If those two values are different then a data inconsistency happened between the prediction bar and the actual bar
(probably due to a holiday, half session day, a timezone change etc..)
exTimezone(timezone)
exTimezone - Convert extended timezone to timezone string
Parameters:
timezone (simple string) : - The timezone or a special string
Returns: string representing the timezone
nameOfDay(day)
nameOfDay - Convert the day id into a short nameOfDay
Parameters:
day (int) : - The day id to convert
Returns: - The short name of the day
today()
today - Get the day id of this day
Returns: - The day id
nthDayAfter(day, n)
nthDayAfter - Get the day id of n days after the given day
Parameters:
day (int) : - The day id of the reference day
n (int) : - The number of days to go forward
Returns: - The day id of the day that is n days after the reference day
nextDayAfter(day)
nextDayAfter - Get the day id of next day after the given day
Parameters:
day (int) : - The day id of the reference day
Returns: - The day id of the next day after the reference day
nthDayBefore(day, n)
nthDayBefore - Get the day id of n days before the given day
Parameters:
day (int) : - The day id of the reference day
n (int) : - The number of days to go forward
Returns: - The day id of the day that is n days before the reference day
prevDayBefore(day)
prevDayBefore - Get the day id of previous day before the given day
Parameters:
day (int) : - The day id of the reference day
Returns: - The day id of the previous day before the reference day
tomorrow()
tomorrow - Get the day id of the next day
Returns: - The next day day id
normalize(num, min, max)
normalizeHour - Check if number is inthe range of
Parameters:
num (int)
min (int)
max (int)
Returns: - The normalized number
normalizeHour(hourInDay)
normalizeHour - Check if hour is valid and return a noralized hour range from
Parameters:
hourInDay (int)
Returns: - The normalized hour
normalizeMinute(minuteInHour)
normalizeMinute - Check if minute is valid and return a noralized minute from
Parameters:
minuteInHour (int)
Returns: - The normalized minute
monthInMilliseconds(mon)
monthInMilliseconds - Calculate the miliseconds in one bar of the timeframe
Parameters:
mon (int) : - The month of reference to get the miliseconds
Returns: - The number of milliseconds of the month
barInMilliseconds()
barInMilliseconds - Calculate the miliseconds in one bar of the timeframe
Returns: - The number of milliseconds in one bar
method to_string(this)
to_string - Formats the time window into a human-readable string
Namespace types: DateTimeWindow
Parameters:
this (DateTimeWindow) : - The time window object with the from and to datetimes
Returns: - The string of the time window
method to_string(this)
to_string - Formats the session days into a human-readable string with short day names
Namespace types: SessionDays
Parameters:
this (SessionDays) : - The session days object with the day selection
Returns: - The string of the session day short names
method to_string(this)
to_string - Formats the session time into a human-readable string
Namespace types: SessionTime
Parameters:
this (SessionTime) : - The session time object with the hour and minute of the time of the day
Returns: - The string of the session time
method to_string(this)
to_string - Formats the session time into a human-readable string
Namespace types: SessionTimeRange
Parameters:
this (SessionTimeRange) : - The session time range object with the start and end time of the daily session
Returns: - The string of the session time
method to_string(this)
to_string - Formats the session into a human-readable string
Namespace types: Session
Parameters:
this (Session) : - The session object with the day and the time range selection
Returns: - The string of the session
method init(this, fromDateTime, toDateTime)
init - Initialize the time window object from boolean values of each session day
Namespace types: DateTimeWindow
Parameters:
this (DateTimeWindow) : - The time window object that will hold the from and to datetimes
fromDateTime (int) : - The starting datetime of the time window
toDateTime (int) : - The ending datetime of the time window
Returns: - The time window object
method init(this, refTimezone, chTimezone, fromDateTime, toDateTime)
init - Initialize the time window object from boolean values of each session day
Namespace types: DateTimeWindow
Parameters:
this (DateTimeWindow) : - The time window object that will hold the from and to datetimes
refTimezone (simple string) : - The timezone of reference of the 'from' and 'to' dates
chTimezone (simple string) : - The target timezone to convert the 'from' and 'to' dates
fromDateTime (int) : - The starting datetime of the time window
toDateTime (int) : - The ending datetime of the time window
Returns: - The time window object
method init(this, sun, mon, tue, wed, thu, fri, sat)
init - Initialize the session days object from boolean values of each session day
Namespace types: SessionDays
Parameters:
this (SessionDays) : - The session days object that will hold the day selection
sun (bool) : - Is Sunday a trading day?
mon (bool) : - Is Monday a trading day?
tue (bool) : - Is Tuesday a trading day?
wed (bool) : - Is Wednesday a trading day?
thu (bool) : - Is Thursday a trading day?
fri (bool) : - Is Friday a trading day?
sat (bool) : - Is Saturday a trading day?
Returns: - The session days object
method init(this, unixTime)
init - Initialize the object from the hour and minute of the session time in exchange timezone (syminfo.timezone)
Namespace types: SessionTime
Parameters:
this (SessionTime) : - The session time object with the hour and minute of the time of the day
unixTime (int) : - The unix time
Returns: - The session time object
method init(this, hourInDay, minuteInHour)
init - Initialize the object from the hour and minute of the session time in exchange timezone (syminfo.timezone)
Namespace types: SessionTime
Parameters:
this (SessionTime) : - The session time object with the hour and minute of the time of the day
hourInDay (int) : - The hour of the time
minuteInHour (int) : - The minute of the time
Returns: - The session time object
method init(this, hourInDay, minuteInHour, refTimezone)
init - Initialize the object from the hour and minute of the session time
Namespace types: SessionTime
Parameters:
this (SessionTime) : - The session time object with the hour and minute of the time of the day
hourInDay (int) : - The hour of the time
minuteInHour (int) : - The minute of the time
refTimezone (string) : - The timezone of reference of the 'hour' and 'minute'
Returns: - The session time object
method init(this, startTime, endTime)
init - Initialize the object from the start and end session time in exchange timezone (syminfo.timezone)
Namespace types: SessionTimeRange
Parameters:
this (SessionTimeRange) : - The session time range object that will hold the start and end time of the daily session
startTime (SessionTime) : - The time the session begins
endTime (SessionTime) : - The time the session ends
Returns: - The session time range object
method init(this, startTimeHour, startTimeMinute, endTimeHour, endTimeMinute, refTimezone)
init - Initialize the object from the start and end session time
Namespace types: SessionTimeRange
Parameters:
this (SessionTimeRange) : - The session time range object that will hold the start and end time of the daily session
startTimeHour (int) : - The time hour the session begins
startTimeMinute (int) : - The time minute the session begins
endTimeHour (int) : - The time hour the session ends
endTimeMinute (int) : - The time minute the session ends
refTimezone (string)
Returns: - The session time range object
method init(this, days, timeRanges)
init - Initialize the session object from session days and time range
Namespace types: Session
Parameters:
this (Session) : - The session object that will hold the day and the time range selection
days (SessionDays) : - The session days object that defines the days the session is happening
timeRanges (array) : - The array of all the session time ranges during a session day
Returns: - The session object
method init(this, days, timeRanges, names, colors)
init - Initialize the session object from session days and time range
Namespace types: SessionView
Parameters:
this (SessionView) : - The session view object that will hold the session, the names and the color selections
days (SessionDays) : - The session days object that defines the days the session is happening
timeRanges (array) : - The array of all the session time ranges during a session day
names (array) : - The array of the names of the sessions
colors (array) : - The array of the colors of the sessions
Returns: - The session object
method get_size_in_secs(this)
get_size_in_secs - Count the seconds from start to end in the given timeframe
Namespace types: DateTimeWindow
Parameters:
this (DateTimeWindow) : - The time window object with the from and to datetimes
Returns: - The number of seconds inside the time widow for the given timeframe
method get_size_in_secs(this)
get_size_in_secs - Calculate the seconds inside the session
Namespace types: SessionTimeRange
Parameters:
this (SessionTimeRange) : - The session time range object with the start and end time of the daily session
Returns: - The number of seconds inside the session
method get_size_in_bars(this)
get_size_in_bars - Count the bars from start to end in the given timeframe
Namespace types: DateTimeWindow
Parameters:
this (DateTimeWindow) : - The time window object with the from and to datetimes
Returns: - The number of bars inside the time widow for the given timeframe
method get_size_in_bars(this)
get_size_in_bars - Calculate the bars inside the session
Namespace types: SessionTimeRange
Parameters:
this (SessionTimeRange) : - The session time range object with the start and end time of the daily session
Returns: - The number of bars inside the session for the given timeframe
method is_bar_included(this, offset_forward)
is_bar_included - Check if the given bar is between the start and end dates of the window
Namespace types: DateTimeWindow
Parameters:
this (DateTimeWindow) : - The time window object with the from and to datetimes
offset_forward (simple int) : - The number of bars forward. Default is 1
Returns: - Whether the current bar is inside the datetime window
method is_bar_included(this, offset_forward)
is_bar_included - Check if the given bar is inside the session as defined by the input params (what "not na(time(timeframe.period, this.to_sess_string()) )" should return if you could write it
Namespace types: Session
Parameters:
this (Session) : - The session with the day and the time range selection
offset_forward (simple int) : - The bar forward to check if it is between the from and to datetimes. Default is 1
Returns: - Whether the current time is inside the session
method to_sess_string(this)
to_sess_string - Formats the session days into a session string with day ids
Namespace types: SessionDays
Parameters:
this (SessionDays) : - The session days object
Returns: - The string of the session day ids
method to_sess_string(this)
to_sess_string - Formats the session time into a session string
Namespace types: SessionTime
Parameters:
this (SessionTime) : - The session time object with the hour and minute of the time of the day
Returns: - The string of the session time
method to_sess_string(this)
to_sess_string - Formats the session time into a session string
Namespace types: SessionTimeRange
Parameters:
this (SessionTimeRange) : - The session time range object with the start and end time of the daily session
Returns: - The string of the session time
method to_sess_string(this)
to_sess_string - Formats the session into a session string
Namespace types: Session
Parameters:
this (Session) : - The session object with the day and the time range selection
Returns: - The string of the session
method from_sess_string(this, sess)
from_sess_string - Initialize the session days object from the session string
Namespace types: SessionDays
Parameters:
this (SessionDays) : - The session days object that will hold the day selection
sess (string) : - The session string part that represents the days
Returns: - The session days object
method from_sess_string(this, sess)
from_sess_string - Initialize the session time object from the session string in exchange timezone (syminfo.timezone)
Namespace types: SessionTime
Parameters:
this (SessionTime) : - The session time object that will hold the hour and minute of the time
sess (string) : - The session string part that represents the time HHmm
Returns: - The session time object
method from_sess_string(this, sess, refTimezone)
from_sess_string - Initialize the session time object from the session string
Namespace types: SessionTime
Parameters:
this (SessionTime) : - The session time object that will hold the hour and minute of the time
sess (string) : - The session string part that represents the time HHmm
refTimezone (simple string) : - The timezone of reference of the 'hour' and 'minute'
Returns: - The session time object
method from_sess_string(this, sess)
from_sess_string - Initialize the session time range object from the session string in exchange timezone (syminfo.timezone)
Namespace types: SessionTimeRange
Parameters:
this (SessionTimeRange) : - The session time range object that will hold the start and end time of the daily session
sess (string) : - The session string part that represents the time range HHmm-HHmm
Returns: - The session time range object
method from_sess_string(this, sess, refTimezone)
from_sess_string - Initialize the session time range object from the session string
Namespace types: SessionTimeRange
Parameters:
this (SessionTimeRange) : - The session time range object that will hold the start and end time of the daily session
sess (string) : - The session string part that represents the time range HHmm-HHmm
refTimezone (simple string) : - The timezone of reference of the time ranges
Returns: - The session time range object
method from_sess_string(this, sess)
from_sess_string - Initialize the session object from the session string in exchange timezone (syminfo.timezone)
Namespace types: Session
Parameters:
this (Session) : - The session object that will hold the day and the time range selection
sess (string) : - The session string that represents the session HHmm-HHmm,HHmm-HHmm:ddddddd
Returns: - The session time range object
method from_sess_string(this, sess, refTimezone)
from_sess_string - Initialize the session object from the session string
Namespace types: Session
Parameters:
this (Session) : - The session object that will hold the day and the time range selection
sess (string) : - The session string that represents the session HHmm-HHmm,HHmm-HHmm:ddddddd
refTimezone (simple string) : - The timezone of reference of the time ranges
Returns: - The session time range object
method nth_day_after(this, day, n)
nth_day_after - The nth day after the given day that is a session day (true) in the object
Namespace types: SessionDays
Parameters:
this (SessionDays) : - The session days object with the day selection
day (int) : - The day id of the reference day
n (int) : - The number of days after
Returns: - The day id of the nth session day of the week after the given day
method nth_day_before(this, day, n)
nth_day_before - The nth day before the given day that is a session day (true) in the object
Namespace types: SessionDays
Parameters:
this (SessionDays) : - The session days object with the day selection
day (int) : - The day id of the reference day
n (int) : - The number of days after
Returns: - The day id of the nth session day of the week before the given day
method next_day(this)
next_day - The next day that is a session day (true) in the object
Namespace types: SessionDays
Parameters:
this (SessionDays) : - The session days object with the day selection
Returns: - The day id of the next session day of the week
method previous_day(this)
previous_day - The previous day that is session day (true) in the object
Namespace types: SessionDays
Parameters:
this (SessionDays) : - The session days object with the day selection
Returns: - The day id of the previous session day of the week
method get_sec_in_day(this)
get_sec_in_day - Count the seconds since the start of the day this session time represents
Namespace types: SessionTime
Parameters:
this (SessionTime) : - The session time object with the hour and minute of the time of the day
Returns: - The number of seconds passed from the start of the day until that session time
method get_ms_in_day(this)
get_ms_in_day - Count the milliseconds since the start of the day this session time represents
Namespace types: SessionTime
Parameters:
this (SessionTime) : - The session time object with the hour and minute of the time of the day
Returns: - The number of milliseconds passed from the start of the day until that session time
method is_day_included(this, day)
is_day_included - Check if the given day is inside the session days
Namespace types: SessionDays
Parameters:
this (SessionDays) : - The session days object with the day selection
day (int) : - The day to check if it is a trading day
Returns: - Whether the current day is included in the session days
DateTimeWindow
DateTimeWindow - Object that represents a datetime window with a beginning and an end
Fields:
fromDateTime (series int) : - The beginning of the datetime window
toDateTime (series int) : - The end of the datetime window
SessionDays
SessionDays - Object that represent the trading days of the week
Fields:
days (map) : - The map that contains all days of the week and their session flag
SessionTime
SessionTime - Object that represents the time (hour and minutes)
Fields:
hourInDay (series int) : - The hour of the day that ranges from 0 to 24
minuteInHour (series int) : - The minute of the hour that ranges from 0 to 59
minuteInDay (series int) : - The minute of the day that ranges from 0 to 1440. They will be calculated based on hourInDay and minuteInHour when method is called
SessionTimeRange
SessionTimeRange - Object that represents a range that extends from the start to the end time
Fields:
startTime (SessionTime) : - The beginning of the time range
endTime (SessionTime) : - The end of the time range
isOvernight (series bool) : - Whether or not this is an overnight time range
Session
Session - Object that represents a session
Fields:
days (SessionDays) : - The map of the trading days
timeRanges (array) : - The array with all time ranges of the session during the trading days
SessionView
SessionView - Object that visualize a session
Fields:
sess (Session) : - The Session object to be visualized
names (array) : - The names of the session time ranges
colors (array) : - The colors of the session time ranges

RH_Previous Session CloseRaghee Horner Previous Session Close (PSC)
The RH_PSC is an automated Previous Session Close (PSC) indicator to show, at a glance, general market sentiment -- whether the market is generally bullish, bearish or neutral --for the current trading session.
The PSC plots the previous session close from the Daily candle, with a customizable table of data to show the previous price, whether or not the current price is above or below that previous close and the percentage move above or below.
It includes the ability to enable only the last session or to plot for all previous sessions continuously.
The data table is configurable for bearish, bullish or sideways coloring and can be moved to different locations to suite users preferences and charts. It can also be fully disabled.
Defaults are to show all previous sessions in a continuous plot and the data table is disabled.
What is “sentiment”?
Market sentiment reflects investors’ overall attitude toward a symbol, influenced by news, economic reports, and perceptions. It can be bullish, bearish, or neutral and significantly affects trading behavior and price movements. Bullish sentiment typically drives prices up, while bearish sentiment can cause them to fall. Understanding market sentiment is key for trend follow-through.
Why does it matter?
Effectively using sentiment allows for quicker, smarter trading decisions. As an active trader, understanding market sentiment is vital for follow-through. It shows real-time investor feelings, affecting price movements. Gauging sentiment helps you:
Anticipate Breakouts.
Time Entries and Exits.
Increase Probability of Continuation.

Mxwll Price Action Suite [Mxwll]Introducing the Mxwll Price Action Suite!
The Mxwll Price Action Suite is an all-in-one analysis indicator incorporating elements of SMC and also ideas extending beyond the trading methodology!
Features
Internal structures
External structures
Customizable Sensitivities
BoS/CHoCH
Order Blocks
HH/LH/LL/LH Areas
Rolling TF highs/lows
Rolling Volume Comparisons
Auto Fibs
And more!
The image above shows the indicator's market structure identification capabilities. Internal BoS and CHoCH structures in addition to overarching market structures are available with customizable sensitivities.
The image above shows the indicator identifying order blocks! Additionally, HH/LH/LL/LH areas are also identified.
The image above shows a rolling area of interest. These areas can be compared to supply/demand zones, where traders might consider a bargain long/short/sell area.
The indicator displays a rolling 4hr high/low and 1D high/low, alongside auto fibonacci levels with a customizable sensitivity.
Finally, the Mxwll Price Action Suite shows relevant session information.
Table information
Current Session
Countdown to session close
Next Session
Countdown to next session open
Rolling 4-Hr volume intensity
Rolling 24-Hr volume intensity
Introducing the Mxwll SMC Suite!
The Mxwll SMC Suite is an all-in-one analysis indicator incorporating elements of SMC and also ideas extending beyond the trading methodology!
Features
Internal structures
External structures
Customizable Sensitivities
BoS/CHoCH
Order Blocks
HH/LH/LL/LH Areas
Rolling TF highs/lows
Rolling Volume Comparisons
Auto Fibs
And more!
The image above shows the indicator's market structure identification capabilities. Internal BoS and CHoCH structures in addition to overarching market structures are available with customizable sensitivities.
The image above shows the indicator identifying order blocks! Additionally, HH/LH/LL/LH areas are also identified.
The image above shows a rolling area of interest. These areas can be compared to supply/demand zones, where traders might consider a bargain long/short/sell area.
The indicator displays a rolling 4hr high/low and 1D high/low, alongside auto fibonacci levels with a customizable sensitivity.
Finally, the Mxwll Price Action Suite shows relevant session information.
Table information
Current Session
Countdown to session close
Next Session
Countdown to next session open
Rolling 4-Hr volume intensity
Rolling 24-Hr volume intensity
Expanded Features of Mxwll Price Action Suite
Internal and External Structures
Internal Structures: These elements refer to the price formations and patterns that occur within a smaller scope or a specific trading session. The suite can detect intricate details like minor support/resistance levels or short-term trend reversals.
External Structures: These involve larger, more significant market patterns and trends spanning multiple sessions or time frames. This capability helps traders understand overarching market directions.
Customizable Sensitivities
Adjusting sensitivity settings allows users to tailor the indicator's responsiveness to market changes. Higher sensitivity can catch smaller fluctuations, while lower sensitivity might focus on more significant, reliable market moves.
Break of Structure (BoS) and Change of Character (CHoCH)
BoS: This feature identifies points where the price breaks a significant structure, potentially indicating a new trend or a trend reversal.
CHoCH: Detects subtle shifts in the market's behavior, which could suggest the early stages of a trend change before they become apparent to the broader market.
Order Blocks and Market Phases
Order Blocks: These are essentially price levels or zones where significant trading activities previously occurred, likely pointing to the positions of smart money.
HH/LH/LL/LH Areas: Identifying Higher Highs (HH), Lower Highs (LH), Lower Lows (LL), and Lower Highs (LH) helps in understanding the trend and market structure, aiding in predictive analysis.
Rolling Timeframe Highs/Lows and Volume Comparisons
Tracks highs and lows over specified rolling periods, providing dynamic support and resistance levels.
Compares volume data across different timeframes to assess the strength or weakness of the current price movements.
Auto Fibonacci Levels
Automatically calculates and plots Fibonacci retracement levels, a popular tool among traders to identify potential reversal points based on past movements.
Session Data and Volume Intensity
Session Information: Displays current and upcoming trading sessions along with countdown timers, which is crucial for day traders and those trading on session overlaps.
Volume Intensity: Measures and compares the volume within the last 4 hours and 24 hours to gauge market activity and potential breakout/breakdown movements.
Visualizations and Practical Use
Dynamic Visuals: The suite provides dynamic visual aids, such as real-time updating of high/low markers and Fibonacci levels, which adjust as new data comes in. This feature is critical in fast-paced markets.
Strategic Entry/Exit Points: By identifying order blocks and using Fibonacci levels, traders can pinpoint strategic entry and exit points, maximizing potential returns.
Risk Management: Enhanced features like session countdowns and volume intensity help in better risk management by providing traders with more data on market sentiment and potential volatility.

ICT Silver Bullet | Flux Charts💎 GENERAL OVERVIEW
Introducing our new ICT Silver Bullet Indicator! This indicator is built around the ICT's "Silver Bullet" strategy. The strategy has 5 steps for execution and works best in 1-5 min timeframes. For more information about the process, check the "HOW DOES IT WORK" section.
Features of the new ICT Silver Bullet Indicator :
Implementation of ICT's Silver Bullet Strategy
Customizable Execution Settings
2 NY Sessions & London Session
Customizable Backtesting Dashboard
Alerts for Buy, Sell, TP & SL Signals
📌 HOW DOES IT WORK ?
ICT's Silver Bullet strategy has 5 steps :
1. Mark your market sessions open (This indicator has 3 -> NY 10-11, NY 14-15, LDN 03-04)
2. Mark the swing liquidity points
3. Wait for market to take down one liquidity side
4. Look for a market structure-shift for reversals
5. Wait for a FVG for execution
This indicator follows these steps and inform you step by step by plotting them in your chart. You can switch execution types between FVG and MSS.
🚩UNIQUENESS
This indicator is an all-in-one suit for the ICT's Silver Bullet concept. It's capable of plotting the strategy, giving signals, a backtesting dashboard and alerts feature. It's designed for simplyfing a rather complex strategy, helping you to execute it with clean signals. The backtesting dashboard allows you to see how your settings perform in the current ticker. You can also set up alerts to get informed when the strategy is executable for different tickers.
⚙️SETTINGS
1. General Configuration
Execution Type -> FVG execution type will require a FVG to take an entry, while the MSS setting will take an entry as soon as it detects a market structure-shift.
MSS Swing Length -> The swing length when finding liquidity zones for market structure-shift detection.
Breakout Method -> If "Wick" is selected, a bar wick will be enough to confirm a market structure-shift. If "Close" is selected, the bar must close above / below the liquidity zone to confirm a market structure-shift.
FVG Detection -> "Same Type" means that all 3 bars that formed the FVG should be the same type. (Bullish / Bearish). "All" means that bar types may vary between bullish / bearish.
FVG Detection Sensitivity -> You can turn this setting on and off. If it's off, any 3 consecutive bullish / bearish bars will be calculated as FVGs. If it's on, the size of FVGs will be filtered by the selected sensitivity. Lower settings mean less but larger FVGs.
2. TP / SL
TP / SL Method -> If "Fixed" is selected, you can adjust the TP / SL ratios from the settings below. If "Dynamic" is selected, the TP / SL zones will be auto-determined by the algorithm.
Risk -> The risk you're willing to take if "Dynamic" TP / SL Method is selected. Higher risk usually means a better winrate at the cost of losing more if the strategy fails.
Close Position @ Session End -> If this setting is enabled, the current position (if any) will be closed at the beginning of a new session, regardless if it hit the TP / SL zone. If it's off, the position will be open until it hits a TP / SL zone.

Tips,Notes,RulesEasy Annotation:
Quickly create custom annotations during your trading sessions to capture important ideas, strategies and observations as you go.
User-friendly Interface:
The indicator offers an intuitive interface, ensuring a smooth experience for adding notes to your chart.
Custom Appearance:
Personalize your annotations according to your preferences.
Adjust the text size to make your notes easily readable and tailored to your visual preferences.
Choose from a variety of colors to make your annotations visually distinct and recognizable.
Align your text according to your preferences to create a visually appealing graphic.
Flexible Positioning:
Place your annotations at the top, middle, or bottom of the chart, providing flexibility without obstructing your view of the price action.
Clear View of Price Action:
Make sure your personalized notes don't interfere with your analysis of market movements.
Tracking Trading Rules:
Use the indicator to record your trading rules, ensuring that you follow your established strategies consistently.
Implement and follow your risk management plans, helping you maintain control over your transactions.
Capture and examine the psychological cues that influence your decisions, promoting greater discipline in your approach to trading.
Improved Trading Experience:
The Trading Notes indicator integrates seamlessly into your trading workflow, allowing you to focus on market analysis and decision-making.
Develop a complete record of your trading sessions, facilitating post-analysis and continuous improvement.

The only Indicator you need
Maybe even a bit more than you need.
Gives you the option to color the bars based on Trading Sessions (Asia, London and US).
Session timings are based on UTC-4, but can be changed individually as needed.
Helps keeping a clear view of what happened during the Sessions without having to stack multiple Session Indicators, or having the background of your chart looking like a rainbow.
Keeping it plain and simple.
Also has the Option for plotting previous Weeks High and Low on Chart.
Found this to be helpful in determining Price behaviour in these Areas.
Also has an option to color the chart background for different time periods.
Helps marking News Releases on the Chart and avoid entering a Trade before major releases.
Has 2 presets for 30min / 2h into US Session and 2 Custom Timeperiods. All can of course be changed as you see fit.
Colors and plotting can obviously be changed as usual.
I am thankful for further Input and Ideas!
Range Projections [TFO]The purpose of this indicator is to see how often price reached certain standard deviations from a selected time range. The inspiration for this was to study ICT (Inner Circle Trader) concepts regarding the Central Bank Dealer’s Range (CBDR), which is 2:00 pm - 8:00 pm New York local time according to ICT Core Content. However, the idea and data collection could certainly be applied to any range of time.
The main settings of this indicator are session time, range type, and the standard deviation filter. The session time is the window of price that will be utilized for range projections. The range type can be either body or wick (on the current timeframe). The standard deviation filter is used to eliminate sessions whose ranges (from high to low) are greater than the desired/input number of standard deviations from all available session ranges.
In this example, the time range is set to 16:00 - 20:00, or the time between the New York session close and the Asia session open. Our standard deviations are set to 1, 2, 2.5, and 4. Now, by taking this session’s price range and extrapolating these extensions from the initial range, we can use these levels to see if and how price interacts with them before the next 16:00 - 20:00 session.
Furthermore, we can enable the Data Table to analyze how often price trades to these levels for the sessions that are deemed valid (determined by the standard deviation filter). This time our standard deviations are set to 1, 2, 3, and 4.
This concept can theoretically be applied to any window of time. ICT has mentioned that, in instances where the CBDR is too large, the Asia range may be used instead. We can observe that the indicator behaves the same way when we change the session to the Asia range, 20:00 - 00:00.

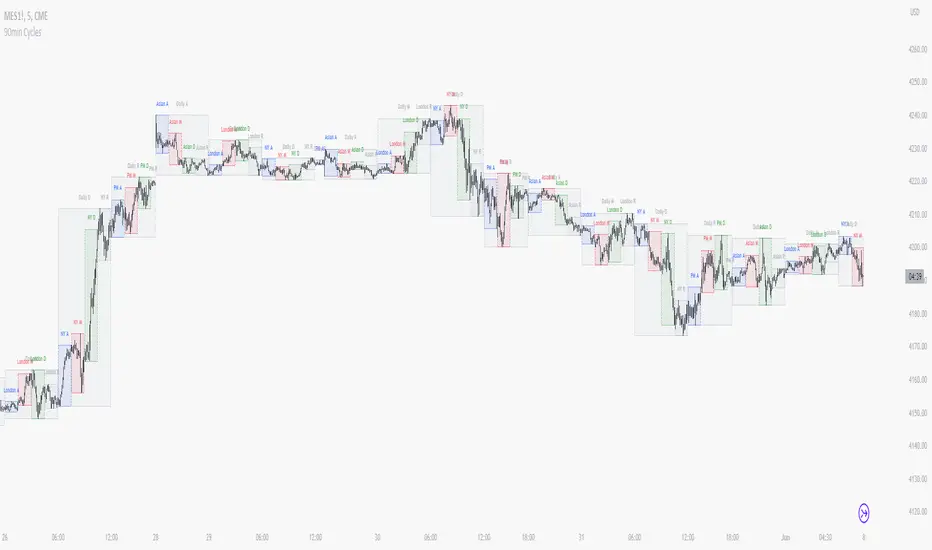
90 Minute Cycles + MTFCredit goes to LuxAlgo for the inspiration from 'Sessions' which allowed users to analyse specific price movements within a user defined period with tools such as trendline, mean and vwap.
Settings
Sessions
Enable Session: Allows to enable or disable all associated elements with a specific user set session.
Session Time: Opening and closing times of the user set session in the hh:mm format.
Range: Highlights the associated session range on the chart.
Ranges Settings
Range Area colour: Set each range to a specific colour.
Range Label: Shows the session label at the mid-point of the session interval.
Usage
By breaking 24hrs in quarters, starting with an Asian range of 18:00 NY time you can visualise the principles of Accumulation, Manipulation, Distribution and Rebalance. Know as AMD or PO3 (Power of Three), the principle is that the Manipulation phase will break above or below the Accumulation, before moving in an apposing direction and then rebalancing. This only works when there is a higher timeframe PD array or liquidity to support an apposing move.
Further to the daily quarters, each one can then be broken down again into 90min cycles. Again, each represents AMD, allowing the user an opportunity to watch for reversals during the 90min manipulation phase.
Note: Ensure the Asian Cycle always begins at 18:00 NY time.
The example shows that the 90min cycle occurs, followed by an apposing move away in price action
Here is the Daily cycle, highlighting the Manipulation phase.
Enjoy!
NSDT Custom High and Low LinesFirst, the credit for the original script to plot a High and Low between a certain time goes to developer paaax.
I took that idea, converted it to Pinescript V5, cleaned up the code, and added a few more lines so you can plot different levels based on time of day.
Published open source like the original.
The example shown has:
Blue - plotting from the start of the Futures Asian session to the start of the Futures USA Session. (6:00PM - 9:30AM Eastern)
Yellow - plotting from the start of the Futures Europe session to the start of the Futures USA Session. (3:00AM - 9:30AM Eastern)
Green - plotting from the start of the Futures US Premarket session to the start of the Futures USA Session. (8:00AM - 9:30AM Eastern)
These are great levels to use for breakouts and/or support and resistance.
Combine these levels with the 5 min Open Range levels, as you have some good trades.
Each of the three sessions have individual start and end times that can be modified by the trader, so you can easily mark off important areas for your style of trading.
