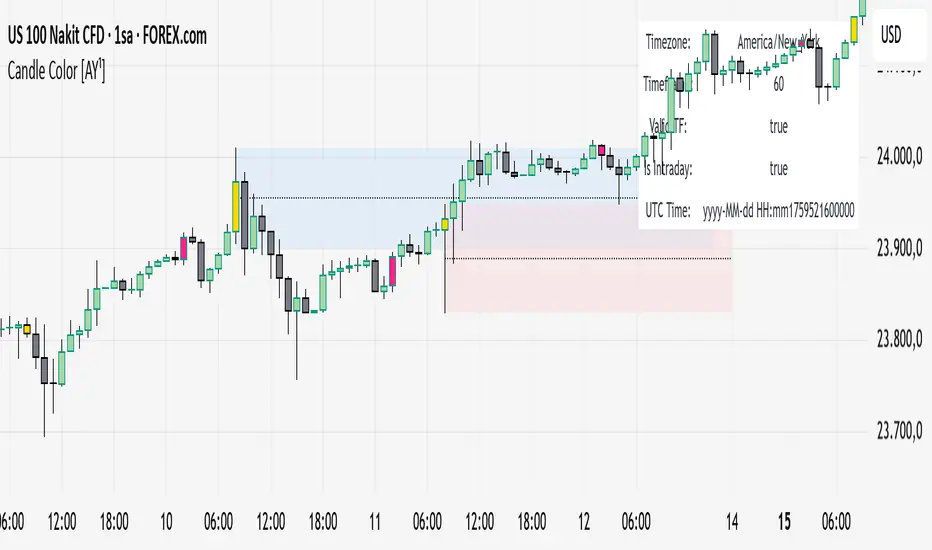
Candle Color [AY¹]Visually highlight specific time periods with custom colors on intraday charts.
Ideal for session-based traders who want to emphasize New York, London or any custom trading hours. Developed by AY¹
Candle Color Highlighter
A simple yet powerful intraday visualization tool that colors candles or chart background during your chosen trading sessions.
Perfect for traders who rely on time-based confluences — such as ICT, SMC, or session scalping frameworks.
🔧 Key Features
✅ Highlight up to four custom time periods (e.g. London Open, NY Open, Lunch Hour, etc.)
✅ Supports multiple highlight styles:
• Bar Color only
• Background only
• Both
✅ Full timezone control (Exchange, UTC, New York, London, Tokyo, or custom UTC+3)
✅ Works on all intraday timeframes or only those you select (1m–4h).
✅ Optional labels marking session starts.
✅ Integrated alerts when any period becomes active.
✅ Informative status table showing timezone, timeframe, and active period.
🕒 Use Cases
Highlight New York Killzone (07:30–09:30) or London Open (02:00–03:00)
Separate different liquidity windows
Emphasize your backtest periods
Combine with volume, displacement, or structure indicators for time-based confluence setups
🎨 Customization
Each of the four configurable periods allows you to choose:
Start/End time
Custom color and transparency
Session label visibility
Highlight style preference
💡 Example Setup
Period Session Time Color Notes
Period 1 02:00–03:00 Magenta London Killzone
Period 2 07:30–08:30 Yellow NY Pre-market
Period 3 08:30–09:30 Blue NY Open
Period 4 09:30–10:00 Green Initial Balance
Cerca negli script per "sessions"
VWAP Deviation Oscillator [BackQuant]VWAP Deviation Oscillator
Introduction
The VWAP Deviation Oscillator turns VWAP context into a clean, tradeable oscillator that works across assets and sessions. It adapts to your workflow with four VWAP regimes plus two rolling modes, and three deviation metrics: Percent, Absolute, and Z-Score. Colored zones, optional standard deviation rails, and flexible plot styles make it fast to read for both trend following and mean reversion.
What it does
This tool measures how far price is from a chosen VWAP and expresses that gap as an oscillator. You can view the deviation as raw price units, percent, or standardized Z-Score. The plot can be a histogram or a line with optional fills and sigma bands, so you can quickly spot polarity shifts, overbought and oversold conditions, and strength of extension.
VWAP modes track a session VWAP that resets (4H, Daily, Weekly) or a rolling VWAP that updates continuously over a fixed number of bars or days.
Deviation modes let you choose the lens: Percent, Absolute, or Z-Score. Each highlights different aspects of stretch and mean pressure.
Visual encoding uses a 10-zone color palette to grade the magnitude of deviation on both sides of zero.
Volatility guards compute mode-specific sigma so thresholds are stable even when volatility compresses.
Why this works
VWAP is a high signal anchor used by institutions to gauge fair participation. Deviations around VWAP cluster in regimes: mild oscillations within a band, decisive pushes that signal imbalance, and standardized extremes that often precede either continuation or snapback. Expressing that distance as a single time series adds clarity: bias is the oscillator’s sign, risk context is its magnitude, and regime is the way it behaves around sigma lines.
How to use it
Trend following
Favor the side of the zero line. Bullish when the oscillator is above zero and making higher swing highs. Bearish when below zero and making lower swing lows. Use +1 sigma and +2 sigma in your mode as strength tiers. Pullbacks that hold above zero in uptrends, or below zero in downtrends, are often continuation entries.
Mean reversion
Fade stretched readings when structure supports it. Look for tests of +2 sigma to +3 sigma that fail to progress and roll back toward zero, or the mirror on the downside. Z-Score mode is best when you want standardized gates across assets. Percent mode is intuitive for intraday scalps where a given percent stretch tends to mean revert.
Session playbook
Use Daily or Weekly VWAP for intraday or swing context. Rolling modes help when the asset lacks clean session boundaries or when you want a continuous anchor that adapts to liquidity shifts.
Key settings
VWAP computation
VWAP Mode = 4 Hours, Daily, Weekly, Rolling (Bars), Rolling (Days). Session modes reset the VWAP when a new session begins. Rolling modes compute VWAP over a fixed trailing window.
Rolling (Lookback: Bars) controls the trailing bar count when using Rolling (Bars).
Rolling (Lookback: Days) converts days to bars at runtime and uses that trailing span.
Use Close instead of HLC3 switches the price reference. HLC3 is smoother. Close makes the anchor track settlement more tightly.
Deviation measurement
Deviation Mode
Percent : 100 * (Price / VWAP - 1). Good for uniform scaling across instruments.
Absolute : Price - VWAP. Good when price units themselves matter.
Z-Score : Standardizes the absolute residual by its own mean and standard deviation over Z/Std Window . Ideal for cross-asset comparability and regime studies.
Z/Std Window sets the mean and standard deviation window for Z-Score mode.
Volatility controls
Percent Mode Volatility Lookback estimates sigma for percent deviations.
Absolute Mode Volatility Lookback estimates sigma for absolute deviations.
Minimum Sigma Guard (pct pts) prevents the percent sigma from collapsing to near zero in extremely quiet markets.
Visualization
Plot Type = Histogram or Line. Histogram emphasizes impulse and polarity changes. Line emphasizes trend waves and divergences.
Positive Color / Negative Color define the palette for line mode. Histogram uses a 10-bucket gradient automatically.
Show Standard Deviations plots symmetric rails at ±1, ±2, ±3 sigma in the current mode’s units.
Fill Line Oscillator and Fill Opacity add a soft bias band around zero for line mode.
Line Width affects both the oscillator and the sigma rails.
Reading the zones
The oscillator’s color and height map deviation to nine graded buckets on each side of zero, with deeper greens above and deeper reds below. In Percent and Absolute modes, those buckets are scaled by their mode-specific sigma. In Z-Score mode the bucket edges are fixed at 0.5, 1.0, 2.0, and 2.8.
0 to +1 sigma weak positive bias, usually rotational.
+1 to +2 sigma constructive impulse. Pullbacks that hold above zero often continue.
+2 to +3 sigma strong expansion. Watch for either trend continuation or exhaustion tells.
Beyond +3 sigma statistical extreme. Requires structure to avoid fading too soon.
Mirror logic applies on the negative side.
Suggested workflows
Trend continuation checklist
Pick a session VWAP that matches your timeframe, for example Daily for intraday or Weekly for position trades.
Wait for the oscillator to hold the correct side of zero and for a sequence of higher swing lows in the oscillator (uptrend) or lower swing highs (downtrend).
Buy pullbacks that stabilize between zero and +1 sigma in an uptrend. Sell rallies that stabilize between zero and -1 sigma in a downtrend.
Use the next sigma band or a prior price swing as your target reference.
Mean reversion checklist
Switch to Z-Score mode for standardized thresholds.
Identify tests of ±2 sigma to ±3 sigma that fail to extend while price meets support or resistance.
Enter on a polarity change through the prior histogram bar or a small hook in line mode.
Fade back to zero or to the opposite inner band, then reassess.
Notes on the three modes
Percent is easy to reason about when you care about proportional stretch. It is well suited to intraday and multi-asset dashboards.
Absolute tracks cash distance from VWAP. This is useful when instruments have tight ticks and you plan risk in price units.
Z-Score standardizes the residual and is best for quant studies, cross-asset comparisons, and threshold research that must be scale invariant.
What the alerts can tell you
Polarity changes at zero can mark the start or end of a leg.
Crosses of ±1 sigma identify overbought or oversold in the current mode’s units.
Zone changes signal an upgrade or downgrade in deviation strength.
Troubleshooting and edge cases
If your instrument has long flat periods, keep Minimum Sigma Guard above zero in Percent mode so the rails do not vanish.
In Rolling modes, very short windows will respond quickly but can whip around. Session modes smooth this by resetting at well known boundaries.
If Z-Score looks erratic, increase Z/Std Window to stabilize the estimate of mean and sigma for the residual.
Final thoughts
VWAP is the anchor. The deviation oscillator is the narrative. By separating bias, magnitude, and regime into a simple stream you can execute faster and review cleaner. Pick the VWAP mode that matches your horizon, choose the deviation lens that matches your risk framework, and let the color graded zones guide your decisions.

X Trade Planlets you define up to 10 fully manual price levels and ranges—each with its own toggle, two prices (for a band/box), an optional note, and a color. The tool draws lines that start at the first bar of a chosen anchor timeframe (e.g., Daily) and extend to the right, mirroring the “fresh start-of-session” look. If two prices are entered, the area between them is shaded using the same color at 60% transparency, so the line and box fill are visually consistent.
Key Features
10 explicit categories (Cat 1 … Cat 10)
Each category includes:
Enable/disable toggle
Price 1 (line) and Price 2 (optional, defines box top/bottom)
Note (optional): label shows note only; hidden automatically if blank
Color: used for the line, box border, and box fill (with 60% transparency)
Anchor-aware drawing
Lines and boxes begin at the new bar of your selected Anchor Timeframe (e.g., D/W/H4), producing clean, session-style extensions.
Clean visuals
Line width is standardized at 1 for a crisp, unobtrusive look
Labels are aligned to the right of current bars and inherit user label styling options (size, text color, background)
No historical dependence
The indicator does not compute or display historical pivots, opens, or derived levels. Everything is user-defined.
Inputs (Per Category)
Cat N (toggle): Show/hide the category
Price 1: Primary level; a horizontal line is drawn when set
Price 2 (optional): When set with Price 1, a box is drawn between the two values
Note (optional): Free-text label; shown only if non-empty
Color: Applies to line, box border, and box fill (fill uses 60% transparency)
Global Inputs
Anchor Timeframe: Timeframe whose new bar defines the start (anchor) of all lines/boxes
Extend Right (bars): Number of bars to extend into the future
Labels (on/off) and label style options (size, text color, background)
How It Works
On the first bar and on each new bar of the anchor timeframe, the indicator captures the current bar index as the anchor for each category.
For each enabled category:
If Price 1 is set, the script draws a horizontal line from the anchor to extend_len bars into the future.
If Price 2 is also set, a box spanning Price 1 ↔ Price 2 is drawn from the anchor to the same future point.
If a Note is provided, a right-side label is rendered at the level (or box midpoint). If the note is empty, no label is shown.
Visual objects are refreshed every bar to ensure alignment with current settings.
Common Use Cases
Scenario planning & playbooks: Define “watch zones” (e.g., Look Above & Fail) and keep them consistent across sessions.
Manual S/R & liquidity areas: Mark hand-picked levels/ranges you care about, without auto-calculated clutter.
Session-like anchoring: Start-of-day/week anchoring to mimic institutional levels that reset each period.
Trade management: Color-coded bands for entries, invalidation, and targets with clear notes

Universal Breakout Strategy [KedArc Quant]Description:
A flexible breakout framework where you can test different logics (Prev Day, Bollinger, Volume, ATR, EMA Trend, RSI Confirm, Candle Confirm, Time Filter) under one system.
Choose your breakout mode, and the strategy will handle entries, exits, and optional risk management (ATR stops, take-profits, daily loss guard, cooldowns).
An on-chart info table shows live mode values (like Prev High/Low, Bollinger levels, RSI, etc.) plus P&L stats for quick analysis.
Use it to compare which breakout style works best on your instrument and timeframe, whether intraday, swing, or positional trading
🔑 Why it’s useful
* Flexibility: Switch between breakout strategies without loading different indicators.
* Clarity: On-chart info table displays current mode, relevant indicator levels, and live strategy P&L stats.
* Testing efficiency: Quickly A/B test different breakout styles under the same backtest environment.
* Transparency: Every trade is rule-based and displayed with entry/exit markers.
🚀 How it helps traders
* Lets you experiment with breakout strategies quickly without loading multiple scripts.
* Helps identify which breakout method fits your instrument & timeframe.
* Gives clear on-chart visual + statistical feedback for confident decision-making.
⚙️ Input Configuration
* Breakout Mode → choose which strategy to test:
* *Prev Day* → breakouts of yesterday’s High/Low.
* *Bollinger* → Upper/Lower BB pierce.
* *Volume* → Breakout confirmed with volume above average.
* *ATR Stop* → Wide range breakout using ATR filter.
* *Time Filter* → Breakouts inside defined session hours.
* *EMA Trend* → Breakouts only in EMA fast > slow alignment.
* *RSI Confirm* → Breakouts with RSI confirmation (e.g. >55 for longs).
* *Candle Confirm* → Breakouts validated by bullish/bearish candle.
* Lookback / ATR / Bollinger inputs → adjust sensitivity.
* Intrabar mode → option to evaluate breakouts using bar highs/lows instead of closes.
* Table options → show/hide info table, show/hide P&L stats, choose corner placement.
📈 Entry & Exit Logic
* Entry → occurs when breakout condition of chosen mode is met.
* Exit → default exits via opposite signals or optional stop/target if enabled.
* Session filter → optional auto-flat at session end.
* P&L management → optional daily loss guard, cooldown between trades, and ATR-based stop/take profit.
❓ FAQ — Choosing the best setup
Q: Which strategy should I use for which chart?
* *Prev Day Breakouts*: Best on indices, FX, and liquid futures with strong daily levels.
* *Bollinger*: Works well in range-bound environments, or crypto pairs with volatility compression.
* *Volume*: Good on equities where breakout strength is tied to volume spikes.
* *ATR Stop*: Suits volatile instruments (commodities, crypto).
* *EMA Trend*: Useful in trending markets (stocks, indices).
* *RSI Confirm*: Adds momentum filter, better for swing trades.
* *Candle Confirm*: Ideal for scalpers needing visual confirmation.
* *Time Filter*: For intraday traders who want signals only in high-liquidity sessions.
Q: What timeframe should I use?
* Intraday traders → 5m to 15m (Time Filter, Candle Confirm).
* Swing traders → 1H to 4H (EMA Trend, RSI Confirm, ATR Stop).
* Position traders → Daily (Prev Day, Bollinger).
* Breakout
A trade entry condition triggered when price crosses above a resistance level (for longs) or below a support level (for shorts).
* Prev Day High/Low
Formula:
Prev High = High of (Day )
Prev Low = Low of (Day )
* Bollinger Bands
Formula:
Basis = SMA(Close, Length)
Upper Band = Basis + (Multiplier × StdDev(Close, Length))
Lower Band = Basis – (Multiplier × StdDev(Close, Length))
* Volume Confirmation
A breakout is only valid if:
Volume > SMA(Volume, Length)
* ATR (Average True Range)
Measures volatility.
Formula:
ATR = SMA(True Range, Length)
where True Range = max(High–Low, |High–Close |, |Low–Close |)
* EMA (Exponential Moving Average)
Weighted moving average giving more weight to recent prices.
Formula:
EMA = (Price × α) + (EMA × (1–α))
with α = 2 / (Length + 1)
* RSI (Relative Strength Index)
Momentum oscillator scaled 0–100.
Formula:
RSI = 100 – (100 / (1 + RS))
where RS = Avg(Gain, Length) ÷ Avg(Loss, Length)
* Candle Confirmation
Bullish candle: Close > Open AND Close > Close
Bearish candle: Close < Open AND Close < Close
Win Rate (%)
Formula:
Win Rate = (Winning Trades ÷ Total Trades) × 100
* Average Trade P&L
Formula:
Avg Trade = Net Profit ÷ Total Trades
📊 Performance Notes
The Universal Breakout Strategy is designed as a framework rather than a single-asset optimized system. Results will vary depending on the chart, timeframe, and asset chosen.
On the current defaults (15-minute, INR-denominated example), the backtest produced 132 trades over the selected period. This provides a statistically sufficient sample size.
Win rate (~35%) is relatively low, but this is balanced by a positive reward-to-risk ratio (~1.8). In practice, a lower win rate with larger wins versus smaller losses is sustainable.
The average P&L per trade is close to breakeven under default settings. This is expected, as the strategy is not tuned for a single symbol but offered as a universal breakout framework.
Commissions (0.1%) and slippage (1 tick) are included in the simulation, ensuring realistic conditions.
Risk management is conservative, with order sizing set at 1 unit per trade. This avoids over-leveraging and keeps exposure well under the 5-10% equity risk guideline.
👉 Traders are encouraged to:
Experiment with inputs such as ATR period, breakout length, or Bollinger parameters.
Test across different timeframes and instruments (equities, futures, forex, crypto) to find optimal setups.
Combine with filters (trend direction, volatility regimes, or volume conditions) for further refinement.
⚠️ Disclaimer This script is provided for educational purposes only.
Past performance does not guarantee future results.
Trading involves risk, and users should exercise caution and use proper risk management when applying this strategy.

VWAP Daily/Weekly/Monthly - Automatic AnchoredExplanation:
This script plots Volume-Weighted Average Price (VWAP) lines that are automatically anchored to the beginning of key timeframes — daily, weekly, and monthly. VWAP is a widely used trading indicator that shows the average price of an asset weighted by trading volume, making it useful for identifying fair value and institutional trading levels.
The “automatic anchored” feature means that you don’t have to manually select starting points. Instead, the script automatically resets the VWAP at the start of each day, week, or month, depending on the chosen setting. This ensures the VWAP always reflects the true average price for that period, providing traders with a consistent reference for support, resistance, and trend direction across multiple timeframes.
Notice:
On the chart, you may notice visible “jumps” in the VWAP lines. These are intentional. Each jump marks the reset point at the start of a new day, week, or month, depending on the selected setting. This design keeps the VWAP history from the previous period intact, allowing you to clearly see how price interacted with VWAP in past sessions.
By keeping these historical resets, you can easily compare short-term (daily) VWAP behavior against longer-term levels like weekly and monthly VWAP. This provides valuable context, helping you spot when price respects or diverges from fair value across different timeframes.
In short:
Daily VWAP resets at the start of each trading day.
Weekly VWAP resets at the beginning of each trading week.
Monthly VWAP resets at the start of each month.
This makes it easy to analyze how price interacts with VWAP levels across different time horizons without manual adjustments.

X VIBVolume Imbalance Zones
X VIB highlights price-levels where buying or selling pressure overwhelmed the opposing side within a single bar transition, leaving a void that the market often revisits. The script paints those voids as boxes so you can quickly see where liquidity may rest, where price may pause or react, and which imbalances persist across sessions.
What it plots
For each completed calculation bar (your chart’s timeframe or a higher timeframe you choose), the indicator draws a box that spans the prior bar’s close to the current bar’s open—only when that bar-to-bar transition exhibits a valid volume imbalance (VIB) by the selected rules. Boxes are time-anchored from the previous bar’s time to the current bar’s time close, and they are capped to a configurable count so the chart remains readable.
Two ways to define “Volume Imbalance”
X VIB calculates imbalances in two complementary ways. Both techniques isolate bar-to-bar displacement that reflects one-sided pressure, but they differ in strictness and how much confirmation they require.
Continuity VIB (Bar-to-Bar Displacement)
A strict definition that requires aligned progress and overlap between consecutive bars. In practical terms, a bullish continuity VIB demands that the new bar advances beyond the prior bar’s close, opens above it, and maintains upward progress without erasing the displacement; the bearish case mirrors this to the downside.
Use when: you want the cleanest, most structurally reliable voids that reflect decisive initiative flow.
Effect on boxes: typically fewer, higher-quality zones that mark locations of strong one-sided intent.
Gap-Qualified VIB (Displacement with Gap Confirmation)
A confirmatory definition that treats the bar-to-bar displacement as an imbalance only if the transition also observes a protective “gap-like” relationship with surrounding prices. This extra condition filters out many borderline transitions and emphasizes voids that were less likely to be traded through on their formation.
Use when: you want additional confirmation that the void had genuine follow-through pressure at birth.
Effect on boxes: often slightly fewer but “stickier” zones that can attract price on retests.
Both modes are drawn identically on the chart (as boxes spanning the displacement). Their difference is purely in the qualification of what counts as a VIB. You can display either set independently or together to compare how each mode surfaces structure.
Multi-Timeframe (MTF) logic
You can compute imbalances on a higher timeframe (e.g., 15-minute) while viewing a lower timeframe chart. When MTF is active, X VIB:
Samples open, high, low, close, time, and time_close from the selected HTF in a single, synchronized request (no gaps, no lookahead).
Only evaluates and draws boxes once per HTF bar close, ensuring clean, stable zones that don’t repaint intra-bar.
How traders use these zones
Reversion into voids: Price often returns to “fill” part of a void before deciding on continuation or reversal.
Context for entries/exits: VIB boxes provide precise, mechanically derived levels for limit entries, scale-outs, and invalidation points.
Confluence: Combine with session opens, HTF levels, or volatility bands to grade setups. Continuity VIBs can mark impulse anchors; Gap-Qualified VIBs often mark stickier pockets.
Inputs & controls
Calculate on higher timeframe? Toggle MTF computation; choose your Calc timeframe (e.g., 15).
Show VIBs: Master toggle for drawing imbalance boxes.
Color & Opacity: Pick the box fill and border intensity that suits your theme.
# Instances: Cap how many historical boxes remain on the chart to avoid clutter.
Notes & best practices
Signal density: Continuity VIBs tend to be more frequent on fast charts; Gap-Qualified VIBs are more selective. Try both and keep what aligns with your trade plan.
MTF discipline: When using a higher calc timeframe, analyze reactions primarily at that timeframe’s pace to avoid over-fitting to noise.
Lifecycle awareness: Not all voids fill. Track which boxes persist; durable voids often define the map of the session.

VWAP + Range Breakout (Pre-Signal for Manual Entry)WHAT IT DOES
This tool highlights potential breakout opportunities when price sweeps the previous day’s high or low and aligns with VWAP and short-term range levels. It provides both pre-signals (early warnings) and confirmed signals (breakout closed) so traders can prepare before momentum accelerates.
Works on all timeframes and across markets (indices, forex, crypto). Especially useful during active London and New York sessions.
---
KEY FEATURES
Daily sweep logic: previous day high/low as liquidity reference
VWAP with cumulative calculation
Adjustable range breakout levels
Optional SMA trend filter
Session filter (London / NY trading hours)
Pre-Signal markers (early alert before breakout)
Confirmed LONG/SHORT signals after breakout close
Alerts for Pre-Long, Pre-Short, and Confirmed entries
---
HOW TO USE
1. Wait for price to sweep the previous day high/low.
2. Look for alignment with VWAP and the defined range breakout levels.
3. Use trend/session filters for higher accuracy.
4. Combine with your own risk management rules.
---
SETTINGS TIPS
Adjust range lookback for different timeframes (shorter for fast intraday, longer for higher timeframes).
Enable/disable session filters depending on your market.
Use SMA trend filter to stay aligned with higher-timeframe bias.
---
WHO IT’S FOR
Scalpers, intraday, and swing traders who want early signals when liquidity is taken and price is preparing for a breakout.
---
NOTES
For educational purposes only. No financial advice.
This script is open-source; redistribution follows TradingView rules.

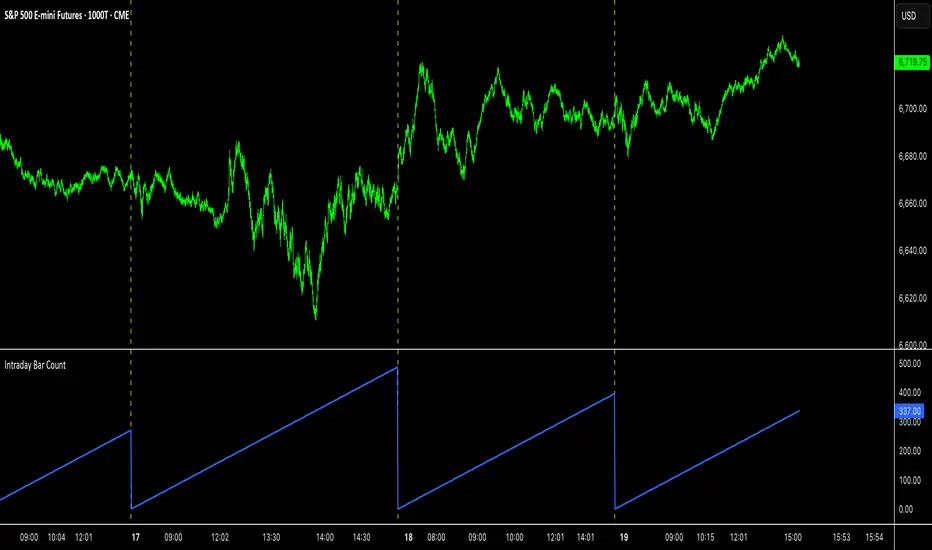
Intraday Bar CounterThis indicator plots a counter on the chart that tracks the number of bars since the beginning of the current day.
The counter resets to zero on the first bar of each new calendar day (midnight). This functionality is provided only on intraday and tick charts.
The indicator is designed to operate on a wide range of symbols without requiring manual adjustments for specific trading sessions.
Z-Score Volume with CVD TrendZ-Score Volume & CVD Trend with Exhaustion Signals
This powerful, all-in-one indicator combines statistical volume analysis, Cumulative Volume Delta (CVD), and a custom clustering algorithm to provide a clear and dynamic view of market sentiment. It is designed to help traders identify the prevailing trend and spot potential reversals or trend exhaustion before they happen.
Important Note: This indicator is specifically designed and optimized for use during the Regular Trading Hours (RTH) New York session, which is typically characterized by high volume and volatility. Its signals may be less reliable in low-volume or overnight sessions.
Core Concepts
1. Volume Z-Score
The script first calculates a Z-score for volume, which measures how many standard deviations a bar's volume is from a moving average. This helps to identify statistically significant volume spikes that may signal institutional activity or a major shift in sentiment.
2. Cumulative Volume Delta (CVD)
CVD plots the net difference between buying and selling volume over time. A rising CVD indicates a surplus of buying pressure, while a falling CVD shows a surplus of selling pressure. This provides a clear look at the direction of momentum.
3. Custom Clustering
By combining the Volume Z-score and CVD delta, the script classifies each bar into one of six distinct "clusters." The purpose is to simplify complex data into actionable signals.
High Conviction Bullish: High Z-score volume with strong CVD buying.
High Conviction Bearish: High Z-score volume with strong CVD selling.
Effort vs. Result: High Z-score volume with no clear CVD bias, indicating indecision or a struggle between buyers and sellers.
Quiet Accumulation: Low volume with subtle CVD buying, suggesting passive accumulation.
Quiet Distribution: Low volume with subtle CVD selling, suggesting passive distribution.
Low Conviction/Noise: Low volume and low CVD, representing general market noise.
Trend and Exhaustion Logic
Trend Establishment: The indicator determines the overall trend (Bullish, Bearish, or Neutral) by analyzing the majority of recent clusters over a configurable lookback period.
A Bullish Trend is confirmed when a majority of recent bars are either "High Conviction Bullish" or "Quiet Accumulation."
A Bearish Trend is confirmed when a majority of recent bars are either "High Conviction Bearish" or "Quiet Distribution."
Trend Exhaustion: This is a key feature for identifying potential reversals. The script looks for a divergence between price action and CVD within a confirmed trend.
Bullish Exhaustion Signal: Occurs during a confirmed "Bullish Trend" when you see a bearish divergence (price makes a higher high, but CVD shows negative delta and a close lower than the open). This is a strong sign the uptrend may be running out of steam.
Bearish Exhaustion Signal: Occurs during a confirmed "Bearish Trend" when you see a bullish divergence (price makes a lower low, but CVD shows positive delta and a close higher than the open). This indicates the downtrend may be exhausted.
How to Interpret the Visuals
Volume Bars: Colored to match the cluster they belong to.
Background Color: Shows the overall trend (light green for bullish, light red for bearish).
Circle Markers (bottom): Green circles indicate a bullish trend, and red circles indicate a bearish trend.
Triangles and Circles (top): Represent the specific cluster of each bar.
Trend Exhaustion Markers: Triangles above/below the bar signal potential trend exhaustion.
Info Table: An optional table provides a real-time summary of all key metrics for the current bar.
Settings
Volume EMA Length: Adjusts the moving average used for the Volume Z-score calculation.
Z-Score Look Back: Defines the number of bars to use for the volume and CVD percentile calculation.
Lower/Upper Cluster Percentile: Use these to adjust the sensitivity of the clustering. Tighter ranges (e.g., 25/75) capture more data, while wider ranges (e.g., 10/90) will only signal truly extreme events.
Trend Lookback Bars: Controls how many recent bars are considered when determining the trend.
This script offers a comprehensive and easy-to-read way to integrate volume, momentum, and trend analysis into your trading.
Happy Trading!

Confluence Engine Confluence Engine is a practical, non-repainting decision aid that scores market conditions from −100…+100 by combining six proven modules: Trend, Momentum, Volatility, Volume, Structure, and an HTF confirmation. It’s designed for crypto, forex, indices, and stocks, and it fires entries only on confirmed bar closes.
What’s inside
Trend: EMA 20/50/200 alignment plus a Supertrend/KAMA toggle (you choose the baseline).
Momentum: RSI + MACD with confirmed-pivot divergence detection.
Volatility: ATR% and Bollinger Band width vs its average to favor expansion over chop.
Volume: OBV-style cumulative flow slope + volume surge vs SMA×multiplier.
Market Structure: Confirmed pivots, BOS (break of structure) and CHOCH (change of character).
HTF Filter: Closed higher-timeframe context via request.security(..., barmerge.gaps_on, barmerge.lookahead_off).
Why it does not repaint
Signals are computed and plotted on closed bars only.
Pivots/divergences use confirmed pivot points (no forward look).
HTF series are fetched with lookahead_off and use the last closed HTF bar in realtime.
No future bar references are used for entries or alerts.
How to use (3 steps)
Pick a timeframe pair: use a 4–6× HTF multiplier (5m→30m, 15m→1h, 1h→4h, 4h→1D, 1D→1W).
Trade with the HTF: take longs only when the HTF filter is bullish; shorts only when bearish.
Prefer expansion: act when BB width > its average and ATR% is elevated; skip most signals in compression.
Suggested presets (start here)
Crypto (BTC/ETH): 15m→1h, 1h→4h. stLen=10, stMult=3.0, bbLen=20, surgeMul=1.8–2.2, thresholds +40 / −40 (intraday can try +35 / −35).
Forex majors: 15m→1h, 1h→4h. stLen=10–14, stMult=2.5–3.0, surgeMul=1.5–1.8, thresholds +35 / −35 (swing: +45 / −45).
US equities (liquid): 5m→30m/1h, 15m→1h/2h. stMult=3.0–3.5, surgeMul=1.6–2.0, thresholds +45 / −45 to reduce chop.
Indices (ES/NQ): 5m→30m, 15m→1h. Defaults are fine; start at +40 / −40.
Gold/Oil: 15m→1h, 1h→4h. Thresholds +35 / −35, surgeMul=1.6–1.9.
Inputs (plain English)
Use Supertrend (off = KAMA): choose the trend baseline.
EMA Fast/Mid/Slow: 20/50/200 by default for classic stack.
RSI/MACD + divergence pivots: momentum and exhaustion context.
ATR Length & BB Length: volatility regime detection.
Volume SMA & Surge Multiplier: defines “meaningful” volume spikes.
Pivot left/right & “Confirm BOS/CHOCH on Close”: structure strictness.
Enable HTF & Higher Timeframe: confirms the lower timeframe direction.
Thresholds (+long / −short): when the score crosses these, you get signals.
Signals & alerts (IDs preserved)
Entry shapes plot at bar close when the score crosses thresholds.
Alerts you can enable:
CONFLUENCE LONG — long entry signal
CONFLUENCE SHORT — short entry signal
BULLISH BIAS — score turned positive
BEARISH BIAS — score turned negative
Best practices
Focus on signals with HTF agreement and volatility expansion; require volume participation (surge or rising OBV slope) for higher quality.
Raise thresholds (+45/−45 or +50/−50) to reduce whipsaws in choppy sessions.
Lower thresholds (+35/−35) only if you also require volatility/volume filters.
Performance & scope
Works across crypto/FX/equities/indices; no broker data or special feeds required.
No repainting by design; signals/alerts are computed on closed bars.
As with any tool, results vary by regime; always combine with risk management.
Disclosure
This script is for educational purposes only and is not financial advice. Trading involves risk. Test on historical data and paper trade before using live.

Technical Summary VWAP | RSI | VolatilityTechnical Summary VWAP | RSI | Volatility
The Quantum Trading Matrix is a multi-dimensional market-analysis dashboard designed as an educational and idea-generation tool to help traders read price structure, participation, momentum and volatility in one compact view. It is not an automated execution system; rather, it aggregates lightweight “quantum” signals — VWAP position, momentum oscillator behaviour, multi-EMA trend scoring, volume flow and institutional activity heuristics, market microstructure pivots and volatility measures — and synthesizes them into a single, transparent score and signal recommendation. The primary goal is to make explicit why a given market looks favourable or unfavourable by showing the individual ingredients and how they combine, enabling traders to learn, test and form rules based on observable market mechanics.
Each module of the matrix answers a distinct market question. VWAP and its percentage distance indicate whether the current price is trading above or below the intraday volume-weighted average — a proxy for intraday institutional control and value. The quantum momentum oscillator (fast and slow EMA difference scaled to percent) captures short-to-intermediate momentum shifts, providing a quickly responsive view of directional pressure. Multi-EMA trend scoring (8/21/50) produces a simple, transparent trend score by counting conditions such as price above EMAs and cross-EMAs ordering; this score is used to categorize market trend into descriptive buckets (e.g., STRONG UP, WEAK UP, NEUTRAL, DOWN). Volume analysis compares current volume to a recent moving average and computes a Z-score to detect spikes and unusual participation; additional buy/sell pressure heuristics (buyingPressure, sellingPressure, flowRatio) estimate whether upside or downside participation dominates the bar. Institutional activity is approximated by flagging large orders relative to volume baseline (e.g., volume > 2.5× MA) and estimating a dark pool proxy; this is a heuristic to highlight bars that likely had large players involved.
The dashboard also performs market-structure detection with small pivot windows to identify recent local support/resistance areas and computes price position relative to the daily high/low (dailyMid, pricePosition). Volatility is measured via ATR divided by price and bucketed into LOW/NORMAL/HIGH/EXTREME categories to help you adapt stop sizing and expectational horizons. Finally, all these pieces feed an interpretable scoring function that rewards alignment: VWAP above, strong flow ratio, bullish trend score, bullish momentum, and favorable RSI zone add to the overall score which is presented as a 0–100 metric and a colored emoji indicator for at-a-glance assessment.
The mashup is purposeful: each indicator covers a failure mode of the other. For example, momentum readings can be misleading during volatility spikes; VWAP informs whether institutions are on the bid or offer; volume Z-score detects abnormal participation that can validate a breakout; multi-EMA score mitigates single-EMA whipsaws by requiring a combination of price/EMA conditions. Combining these signals increases information content while keeping each component explainable — a key compliance requirement. The script intentionally emphasizes transparency: when it shows a BUY/SELL/HOLD recommendation, the dashboard shows the underlying sub-components so a trader can see whether VWAP, momentum, volume, trend or structure primarily drove the score.
For practical use, adopt a clear workflow: (1) check the matrix score and read the component tiles (VWAP position, momentum, trend and volume) to understand the drivers; (2) confirm market-structure support/resistance and pricePosition relative to the daily range; (3) require at least two corroborating components (for example, VWAP ABOVE + Momentum BULLISH or Volume spike + Trend STRONG UP) before considering entries; (4) use ATR-based stops or daily pivot distance for stop placement and size positions such that the trade risks a small, pre-defined percent of capital; (5) for intraday scalps shorten holding time and tighten stops, for swing trades increase lookback lengths and require multi-timeframe (higher TF) agreement. Treat the matrix as an idea filter and replay lab: when an alert triggers, replay the bars and observe which components anticipated the move and which lagged.
Parameter tuning matters. Shortening the momentum length makes the oscillator more sensitive (useful for scalping), while lengthening it reduces noise for swing contexts. Volume profile bars and MA length should match the instrument’s liquidity — increase the MA for low-liquidity stocks to reduce false institutional flags. The trend multiplier and signal sensitivity parameters let you calibrate how aggressively the matrix counts micro evidence into the score. Always backtest parameter sets across multiple periods and instruments; run walk-forward tests and keep a simple out-of-sample validation window to reduce overfitting risk.
Limitations and failure modes are explicit: institutional flags and dark-pool estimates are heuristics and cannot substitute for true tape or broker-level order flow; volume split by price range is an approximation and will not perfectly reflect signed volume; pivot detection with small windows may miss larger structural swings; VWAP is typically intraday-centric and less meaningful across multi-day swing contexts; the score is additive and may not capture non-linear relationships between features in extreme market regimes (e.g., flash crashes, circuit breaker events, or overnight gaps). The matrix is also susceptible to false signals during major news releases when price and volume behavior dislocate from typical patterns. Users should explicitly test behavior around earnings, macro data and low-liquidity periods.
To learn with the matrix, perform these experiments: (A) collect all BUY/SELL alerts over a 6-month period and measure median outcome at 5, 20 and 60 bars; (B) require additional gating conditions (e.g., only accept BUY when flowRatio>60 and trendScore≥4) and compare expectancy; (C) vary the institutional threshold (2×, 2.5×, 3× volumeMA) to see how many true positive spikes remain; (D) perform multi-instrument tests to ensure parameters are not tuned to a single ticker. Document every test and prefer robust, slightly lower returns with clearer logic rather than tuned “optimal” results that fail out of sample.
Originality statement: This script’s originality lies in the curated combination of intraday value (VWAP), multi-EMA trend scoring, momentum percent oscillator, volume Z-score plus buy/sell flow heuristics and a compact, interpretable scoring system. The script is not a simple indicator mashup; it is a didactic ensemble specifically designed to make internal rationale visible so traders can learn how each market characteristic contributes to actionable probability. The tool’s novelty is its emphasis on interpretability — showing the exact contributing signals behind a composite score — enabling reproducible testing and educational value.
Finally, for TradingView publication, include a clear description listing the modules, a short non-technical summary of how they interact, the tunable inputs, limitations and a risk disclaimer. Remove any promotional content or external contact links. If you used trademark symbols, either provide registration details or remove them. This transparent documentation satisfies TradingView’s requirement that mashups justify their composition and teach users how to use them.
Quantum Trading Matrix — multi-factor intraday dashboard (educational use only).
Purpose: Combines intraday VWAP position, a fast/slow EMA momentum percent oscillator, multi-EMA trend scoring (8/21/50), volume Z-score and buy/sell flow heuristics, pivot-based microstructure detection, and ATR-based volatility buckets to produce a transparent, componentized market score and trade-idea indicator. The mashup is intentional: VWAP identifies intraday value, momentum detects short bursts, EMAs provide structural trend bias, and volume/flow confirm participation. Signals require alignment of at least two components (for example, VWAP ABOVE + Momentum BULLISH + positive flow) for higher confidence.
Inputs: momentum period, volume MA/profile length, EMA configuration (8/21/50), trend multiplier, signal sensitivity, color and display options. Use shorter momentum lengths for scalps and longer for swing analysis. Increase volume MA for thinly traded instruments.
Limitations: Institutional/dark-pool estimates and flow heuristics are approximations, not actual exchange tape. VWAP is intraday-focused. Expect false signals during major news or low-liquidity sessions. Backtest and paper-trade before applying real capital.
Risk Disclaimer: For education and analysis only. Not financial advice. Use proper risk management. The author is not responsible for trading losses.
________________________________________
Risk & Misuse Disclaimer
This indicator is provided for education, analysis and idea generation only. It is not investment or financial advice and does not guarantee profits. Institutional activity flags, dark-pool estimates and flow heuristics are approximations and should not be treated as exchange tape. Backtest thoroughly and use demo/paper accounts before trading real capital. Always apply appropriate position sizing and stop-loss rules. The author is not responsible for any trading losses resulting from the use or misuse of this tool.
________________________________________
Risk Disclaimer: This tool is provided for education and analysis only. It is not financial advice and does not guarantee returns. Users assume all risk for trades made based on this script. Back test thoroughly and use proper risk management.

RSI ADX Bollinger Analysis High-level purpose and design philosophy
This indicator — RSI-ADX-Bollinger Analysis — is a compact, educational market-analysis toolkit that blends momentum (RSI), trend strength (ADX), volatility structure (Bollinger Bands) and simple volumetrics to provide traders a snapshot of market condition and trade idea quality. The design philosophy is explicit and layered: use each component to answer a different question about price action (momentum, conviction, volatility, participation), then combine answers to form a more robust, explainable signal. The mashup is intended for analysis and learning, not automatic execution: it surfaces the why behind signals so traders can test, learn and apply rules with risk management.
________________________________________
What each indicator contributes (component-by-component)
RSI (Relative Strength Index) — role and behavior: RSI measures short-term momentum by comparing recent gains to recent losses. A high RSI (near or above the overbought threshold) indicates strong recent buying pressure and potential exhaustion if price is extended. A low RSI (near or below the oversold threshold) indicates strong recent selling pressure and potential exhaustion or a value area for mean-reversion. In this dashboard RSI is used as the primary momentum trigger: it helps identify whether price is locally over-extended on the buy or sell side.
ADX (Average Directional Index) — role and behavior: ADX measures trend strength independently of direction. When ADX rises above a chosen threshold (e.g., 25), it signals that the market is trending with conviction; ADX below the threshold suggests range or weak trend. Because patterns and momentum signals perform differently in trending vs. ranging markets, ADX is used here as a filter: only when ADX indicates sufficient directional strength does the system treat RSI+BB breakouts as meaningful trade candidates.
Bollinger Bands — role and behavior: Bollinger Bands (20-period basis ± N standard deviations) show volatility envelope and relative price position vs. a volatility-adjusted mean. Price outside the upper band suggests pronounced extension relative to recent volatility; price outside the lower band suggests extended weakness. A band expansion (increasing width) signals volatility breakout potential; contraction signals range-bound conditions and potential squeeze. In this dashboard, Bollinger Bands provide the volatility/structural context: RSI extremes plus price beyond the band imply a stronger, volatility-backed move.
Volume split & basic MA trend — role and behavior: Buy-like and sell-like volume (simple heuristic using close>open or closeopen) or sell-like (close1.2 for validation and compare win rate and expectancy.
4. TF alignment: Accept signals only when higher timeframe (e.g., 4h) trend agrees — compare results.
5. Parameter sensitivity: Vary RSI threshold (70/30 vs 80/20), Bollinger stddev (2 vs 2.5), and ADX threshold (25 vs 30) and measure stability of results.
These exercises teach both statistical thinking and the specific failure modes of the mashup.
________________________________________
Limitations, failure modes and caveats (explicit & teachable)
• ADX and Bollinger measures lag during fast-moving news events — signals can be late or wrong during earnings, macro shocks, or illiquid sessions.
• Volume classification by open/close is a heuristic; it does not equal TAPEDATA, footprint or signed volume. Use it as supportive evidence, not definitive proof.
• RSI can remain overbought or oversold for extended stretches in persistent trends — relying solely on RSI extremes without ADX or BB context invites large drawdowns.
• Small-cap or low-liquidity instruments yield noisy band behavior and unreliable volume ratios.
Being explicit about these limitations is a strong point in a TradingView description — it demonstrates transparency and educational intent.
________________________________________
Originality & mashup justification (text you can paste)
This script intentionally combines classical momentum (RSI), volatility envelope (Bollinger Bands) and trend-strength (ADX) because each indicator answers a different and complementary question: RSI answers is price locally extreme?, Bollinger answers is price outside normal volatility?, and ADX answers is the market moving with conviction?. Volume participation then acts as a practical check for real market involvement. This combination is not a simple “indicator mashup”; it is a designed ensemble where each element reduces the others’ failure modes and together produce a teachable, testable signal framework. The script’s purpose is educational and analytical — to show traders how to interpret the interplay of momentum, volatility, and trend strength.
________________________________________
TradingView publication guidance & compliance checklist
To satisfy TradingView rules about mashups and descriptions, include the following items in your script description (without exposing source code):
1. Purpose statement: One or two lines describing the script’s objective (educational multi-indicator market overview and idea filter).
2. Component list: Name the major modules (RSI, Bollinger Bands, ADX, volume heuristic, SMA trend checks, signal tracking) and one-sentence reason for each.
3. How they interact: A succinct non-code explanation: “RSI finds momentum extremes; Bollinger confirms volatility expansion; ADX confirms trend strength; all three must align for a BUY/SELL.”
4. Inputs: List adjustable inputs (RSI length and thresholds, BB length & stddev, ADX threshold & smoothing, volume MA, table position/size).
5. Usage instructions: Short workflow (check TF alignment → confirm participation → define stop & R:R → backtest).
6. Limitations & assumptions: Explicitly state volume is approximated, ADX has lag, and avoid promising guaranteed profits.
7. Non-promotional language: No external contact info, ads, claims of exclusivity or guaranteed outcomes.
8. Trademark clause: If you used trademark symbols, remove or provide registration proof.
9. Risk disclaimer: Add the copy-ready disclaimer below.
This matches TradingView’s request for meaningful descriptions that explain originality and inter-component reasoning.
________________________________________
Copy-ready short publication description (paste into TradingView)
Advanced RSI-ADX-Bollinger Market Overview — educational multi-indicator dashboard. This script combines RSI (momentum extremes), Bollinger Bands (volatility envelope and band expansion), ADX (trend strength), simple SMA trend bias and a basic buy/sell volume heuristic to surface high-quality idea candidates. Signals require alignment of momentum, volatility expansion and rising ADX; volume participation is displayed to support signal confidence. Inputs are configurable (RSI length/levels, BB length/stddev, ADX length/threshold, volume MA, display options). This tool is intended for analysis and learning — not for automated execution. Users should back test and apply robust risk management. Limitations: volume classification here is a heuristic (close>open), ADX and BB measures lag in fast news events, and results vary by instrument liquidity.
________________________________________
Copy-ready risk & misuse disclaimer (paste into description or help file)
This script is provided for educational and analytical purposes only and does not constitute financial or investment advice. It does not guarantee profits. Indicators are heuristics and may give false or late signals; always back test and paper-trade before using real capital. The author is not responsible for trading losses resulting from the use or misuse of this indicator. Use proper position sizing and risk controls.
________________________________________
Risk Disclaimer: This tool is provided for education and analysis only. It is not financial advice and does not guarantee returns. Users assume all risk for trades made based on this script. Back test thoroughly and use proper risk management.

FNGAdataHighHigh prices for FNGA ETF (Dec 2018–May 2025)
The High prices for FNGA ETF (December 2018 – May 2025) represent the maximum trading price reached during each regular U.S. market session over the entire trading lifespan of this leveraged exchange-traded note. Originally issued under the ticker FNGU, and later rebranded as FNGA in March 2025 before its redemption, the fund was designed to deliver 3x daily leveraged exposure to the MicroSectors FANG+™ Index. This index focused on a concentrated group of large-cap technology and technology-enabled companies such as Facebook (Meta), Amazon, Apple, Netflix, and Google (Alphabet), along with a few other growth leaders.
The High price data from December 2018 through May 2025 is crucial for understanding how FNGA behaved during intraday trading sessions. Because FNGA was a daily resetting 3x leveraged product, its intraday highs often displayed extreme sensitivity to movements in the underlying FANG+™ stocks, resulting in sharp upward spikes during bullish days and pronounced volatility during broader market rallies.

Support and Resistance levels from Options DataINTRODUCTION
This script is designed to visualize key support and resistance levels derived from options data on TradingView charts. It overlays lines, labels, and boxes to highlight levels such as Put Walls (gamma support), Call Walls (gamma resistance), Gamma Flip points, Vanna levels, and more.
These levels are intended to help traders identify potential areas of price magnetism, reversal, or breakout based on options market dynamics. All calculations and visualizations are based on user-provided data pasted into the input field, as Pine Script cannot directly fetch external options data due to platform limitations (explained below).
For convenience, my website allows users to interact with a bot that will generate the string for up to 30 tickers at once getting nearly real-time data on demand (data is cached for 15min). With the output string pasted into this indicator, it's a bliss to shuffle through your portfolio and see those levels for each ticker.
The script is open-source under TradingView's terms, allowing users to study, modify, and improve it. It draws inspiration from common options-derived metrics like gamma exposure and vanna, which are widely discussed in financial literature. No external code is copied without rights; all logic is original or based on standard mathematical formulas.
How the Options Levels Are Calculated
The levels displayed by this script are not computed within Pine Script itself—instead, they rely on pre-calculated values provided by the user (via a pasted data string). These values are derived from options chain data fetched from financial APIs (e.g., using libraries like yfinance in Python). Here's a step-by-step overview of how these levels are generally calculated externally before being input into the script:
Fetching Options Data:
Historical and current options chain data for a ticker (e.g., strikes, open interest, volume, implied volatility, expirations) is retrieved for near-term expirations (e.g., up to 90 days).
Current stock price is obtained from recent history.
Gamma Support (Put Wall) and Resistance (Call Wall):
Gamma Calculation: For each option, gamma (the rate of change of delta) is computed using the Black-Scholes formula:
gamma = N'(d1) / (S * sigma * sqrt(T))
where S is the stock price, K is the strike, T is time to expiration (in years), sigma is implied volatility, r is the risk-free rate (e.g., 0.0445), and N'(d1) is the normal probability density function.
Weighted gamma is multiplied by open interest and aggregated by strike.
The Put Wall is the strike below the current price with the highest weighted gamma from puts (acting as support).
The Call Wall is the strike above the current price with the highest weighted gamma from calls (acting as resistance).
Short-term versions focus on strikes closer to the money (e.g., within 10-15% of the price).
Gamma Flip Level:
Net dealer gamma exposure (GEX) is calculated across all strikes:
GEX = sum (gamma * OI * 100 * S^2 * sign * decay)
where sign is +1 for calls/-1 for puts, and decay is 1 / sqrt(T).
The flip point is the price where net GEX changes sign (from positive to negative or vice versa), interpolated between strikes.
Vanna Levels:
Vanna (sensitivity of delta to volatility) is calculated:
vanna = -N'(d1) * d2 / sigma
where d2 = d1 - sigma * sqrt(T).
Weighted by open interest, the highest positive and negative vanna strikes are identified.
Other Levels:
S1/R1: Significant strikes with high combined open interest and volume (80% OI + 20% volume), below/above price for support/resistance.
Implied Move: ATM implied volatility scaled by S * sigma * sqrt(d/365) (e.g., for 7 days).
Call/Put Ratio: Total call contracts divided by put contracts (OI + volume).
IV Percentage: Average ATM implied volatility.
Options Activity Level: Average contracts per unique strike, binned into levels (0-4).
Stop Loss: Dynamically set below the lowest support (e.g., Put Wall, Gamma Flip), adjusted by IV (tighter in low IV).
Fib Target: 1.618 extension from Put Wall to Call Wall range.
Previous day levels are stored for comparison (e.g., to detect Call Wall movement >2.5% for alerts).
Effect as Support and Resistance in Technical Trading
Options levels like gamma walls influence price action due to market maker hedging:
Put Wall (Gamma Support): High put gamma below price creates a "magnet" effect—market makers buy stock as price falls, providing support. Traders might look for bounces here as entry points for longs.
Call Wall (Gamma Resistance): High call gamma above price leads to selling pressure from hedging, acting as resistance. Rejections here could signal trims, sells or even shorts.
Gamma Flip: Where gamma exposure flips sign, often a volatility pivot—crossing it can accelerate moves (bullish above, bearish below).
Vanna Levels: Positive/negative vanna indicate volatility sensitivity; crosses may signal regime shifts.
Implied Move: Shows expected range; prices outside suggest overextension.
S1/R1 and Fib Target: Volume/OI clusters act as classic S/R; Fib extensions project upside targets post-breakout.
In trading, these are not guarantees—combine with TA (e.g., volume, trends). High activity levels imply stronger effects; low CP ratio suggests bearish sentiment. Alerts trigger on proximities/crosses for awareness, not advice.
Limitations of the TradingView Platform for Data Pulling
TradingView's Pine Script is sandboxed for security and performance:
No direct internet access or API calls (e.g., can't fetch yfinance data in-script).
Limited to chart data/symbol info; no real-time options chains.
Inputs are static per load; updates require manual pasting.
Caching isn't persistent across sessions.
This prevents dynamic data pulling, ensuring scripts remain lightweight but requiring external tools for fresh data.
Creative Solution for On-Demand Data Pulling
To overcome these limitations, users can use external tools or scripts (e.g., Python-based) to fetch and compute levels on demand. The tool processes tickers, generates a formatted string (e.g., "TICKER:level1,level2,...;TIMESTAMP:unix;"), and users paste it into the script's input. This keeps data fresh without violating platform rules, as computation happens off-platform. For example, run a local script to query APIs and output the string—adaptable for any ticker.
Script Functionality Breakdown
Inputs: Custom data string (parsed for levels/timestamp); toggles for short-term/previous/Vanna/stop loss; style options (colors, transparency).
Parsing: Extracts levels for the chart symbol; gets timestamp for "updated ago" display.
Drawing: Lines/labels for levels; boxes for gamma zones/implied move; clears old elements on updates.
Info Panel: Top-right summary with metrics (CP ratio, IV, distances, activity); emojis for quick status.
Alerts: Conditions for proximities, crosses, bounces (e.g., 0.5% bounce from Put Wall).
Performance: Uses vars for persistence; efficient for real-time.
This script is educational—test thoroughly. Not financial advice; past performance isn't indicative of future results. Feedback welcome via TradingView comments.

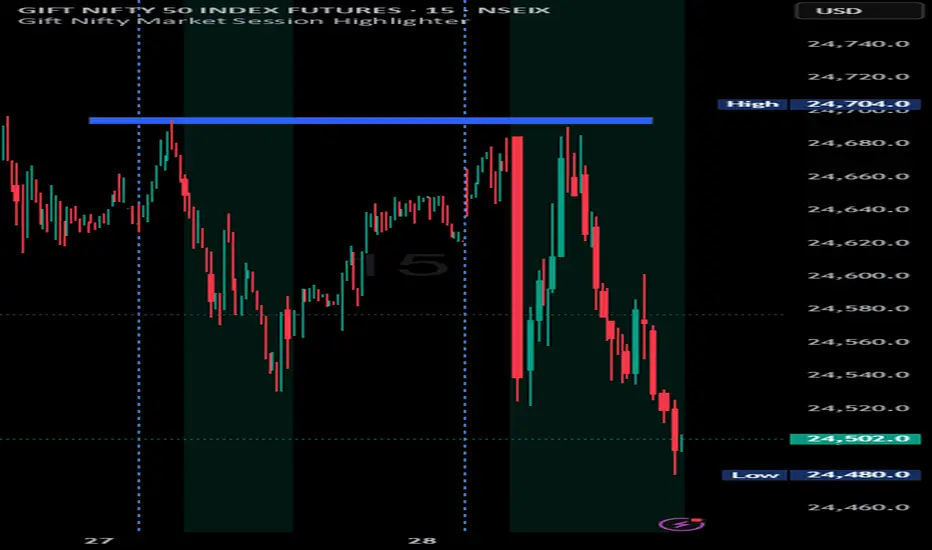
Indian market session on Gift Nifty chartsGift Nifty Market Session Highlighter
This indicator highlights the official Indian market session on Gift Nifty charts — from 9:15 AM to 3:30 PM IST. It shades the background during this time window so traders can instantly identify when the local market is open.
Features:
Marks 9:15 AM to 3:30 PM (IST) session on intraday charts.
Adjustable highlight color and transparency.
Works seamlessly across lower timeframes (1m, 5m, 15m, etc.).
Helps traders align Gift Nifty activity with NSE market hours.
Use Cases:
Quickly distinguish active market hours from overnight or global sessions.
Backtest trading strategies specific to Indian session volatility.
Improv
e focus on expiry-day setups and intraday opportunities.
Disclaimer:
This tool is provided for educational and informational purposes only. It is not financial advice, nor does it guarantee trading success. Always do your own research and consult a licensed financial professional before making investment decisions.
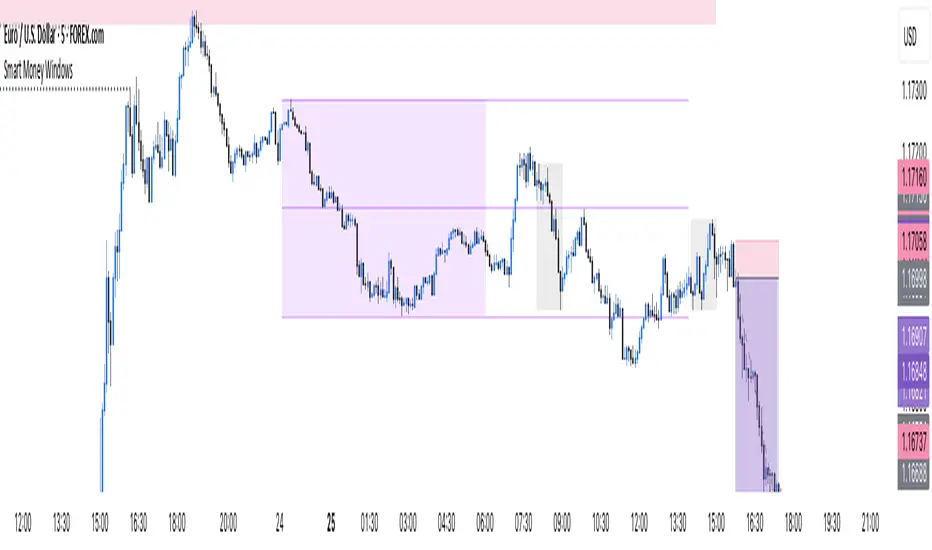
Smart Money Windows- X7Smart Money Windows 📊💰
Unlock the secret moves of the big players! This indicator highlights key liquidity traps, smart money zones, and market kill zones for the Asian, London, and New York sessions. See where the pros hide their orders and spot potential price flips before they happen! 🚀🔥
Features:
Visual session boxes with high/low/mid levels 🟪🟫
NY session shifted 60 mins for precise timing 🕒
Perfect for spotting traps, inducements & smart money maneuvers 🎯
Works on Forex, crypto, and stocks 💹
Get in the “Smart Money Window” and trade like the pros! 💸🔑
By HH