All in one Dynamic Trade SessionsAll in one Dynamic Trade Sessions:
Trend Filter: Uses the 50 EMA to determine the main direction (Buy only above, Sell only below).
Momentum Entry (from MACD-RSI): Uses the MACD (12, 26, 9) for the entry crossover signal.
Confirmation (from ---Momentum): Uses RSI (Length 7) to ensure the move has strength.
Exits (from Breakout Detector): Uses ATR (14) to automatically calculate your Stop Loss and Take Profit levels.
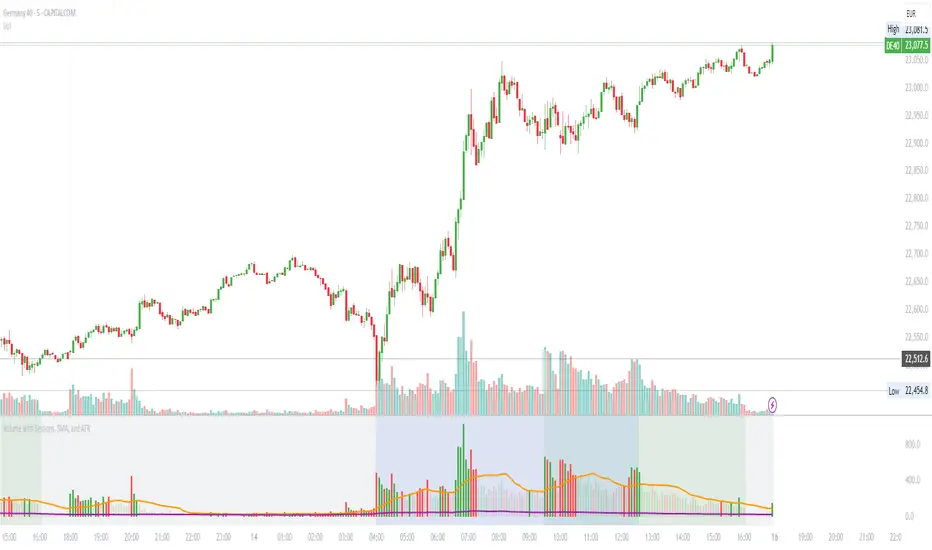
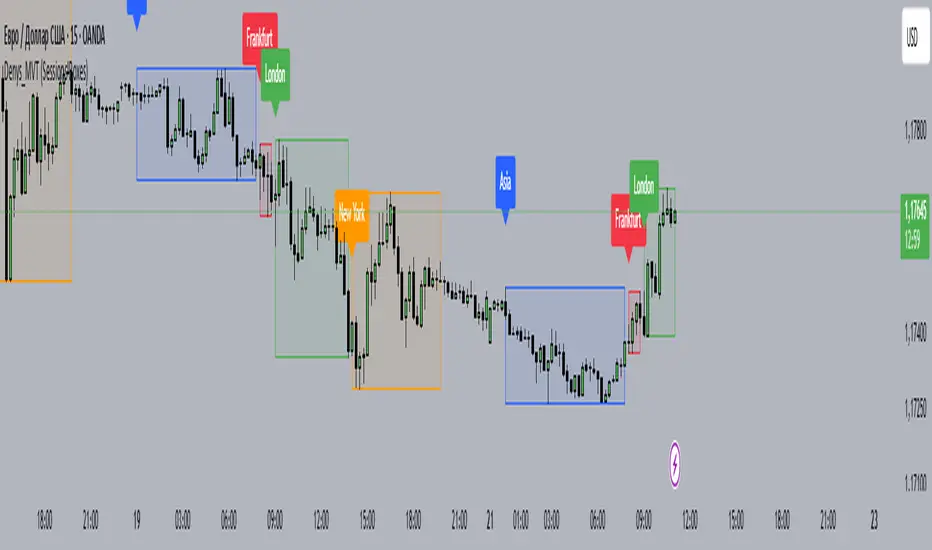
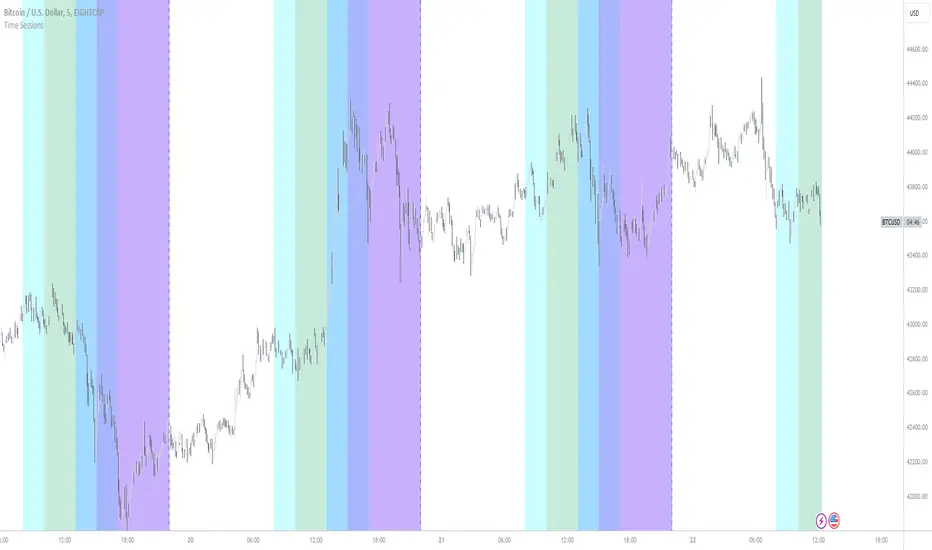
All in one Dynamic Trade Sessions identifies "Trade Sessions" dynamically. A "Session" starts when volume and momentum kick in (Green/Red background) and ends when the market goes into a chop (Grey background).
How V5 Works (The "Breakdown" Logic)
Session Start: When the Grey Zone ends (RSI breaks out of 45-55) AND Volume spikes. The background turns Blue.
Session End: When the Grey Zone returns (RSI falls back between 45-55). The background turns Grey.
Indicatore Pine Script®