Signal Generator: HTF EMA Momentum + MACDSignal Generator: HTF EMA Momentum + MACD
What this script does
This indicator combines a higher-timeframe EMA trend filter with a MACD crossover on the chart’s timeframe. The goal is to make MACD signals more selective by checking whether they occur in the same direction as the broader trend.
How it works
- On the higher timeframe, two EMAs are calculated (short and long). Their difference is used as a simple momentum measure.
- On the chart timeframe, the MACD is calculated. Crossovers are then filtered with two conditions:
1.They must align with the higher-timeframe EMA trend.
2.They must occur beyond a small “zero band” threshold, with a minimum distance between MACD and signal lines.
- When both conditions are met, the script can plot BUY or SELL labels. ATR is used only to shift labels up or down for visibility.
Visuals and alerts
- Histogram bars show whether higher-timeframe EMA momentum is rising or falling.
- MACD main and signal lines are plotted with optional scaling.
- Dotted lines show the zero band region.
- Optional large BUY/SELL labels appear when conditions are confirmed on the previous bar.
- Alerts can be enabled for these signals; they trigger once per bar close.
Notes and limitations
- Higher-timeframe values are only confirmed once the higher-timeframe candle has closed.
- Scaling factors affect appearance only, not the logic.
- This is an open-source study intended as a learning and charting tool. It does not provide financial advice or guarantee performance.
Cerca negli script per "signal"

SignalProcessingClusteringKMeansLibrary "SignalProcessingClusteringKMeans"
K-Means Clustering Method.
nearest(point_x, point_y, centers_x, centers_y) finds the nearest center to a point and returns its distance and center index.
Parameters:
point_x : float, x coordinate of point.
point_y : float, y coordinate of point.
centers_x : float array, x coordinates of cluster centers.
centers_y : float array, y coordinates of cluster centers.
@ returns tuple of int, float.
bisection_search(samples, value) Bissection Search
Parameters:
samples : float array, weights to compare.
value : float array, weights to compare.
Returns: int.
label_points(points_x, points_y, centers_x, centers_y) labels each point index with cluster index and distance.
Parameters:
points_x : float array, x coordinates of points.
points_y : float array, y coordinates of points.
centers_x : float array, x coordinates of points.
centers_y : float array, y coordinates of points.
Returns: tuple with int array, float array.
kpp(points_x, points_y, n_clusters) K-Means++ Clustering adapted from Andy Allinger.
Parameters:
points_x : float array, x coordinates of the points.
points_y : float array, y coordinates of the points.
n_clusters : int, number of clusters.
Returns: tuple with 2 arrays, float array, int array.

Signal ComposerThis Signal Composer script can compose existing signals from other "Signal Indicators" into one and can forward it to the "Template Trailing Strategy".
It allows the user to combine the logic of two signals and define the conditions that will trigger the start, end, cancel start, and cancel end deals of the produced signal. A signal will be composed from those user-defined conditions.
For example, one signal indicator may have the main logic and the other the filter logic. If you want to combine more signals you may add two Signal Composer scripts and pipe the output of the first composer to the second one.
This is the "main building block" of creating a bit more complex strategies without writing any code.
The "indicator on indicator" feature is needed so you can forward the resulting signal to the "Template Trailing Strategy" so that you can set take profits, stop losses, custom alerts, and all other nifty features this framework provides.
Thus, you should be a Plus or Premium user to get its full potential. It is very convenient for those who want to create a strategy without coding their own signal indicator and for those who want to fast-prototype various ideas based on simple but composable conditions.
It can nicely be combined with the "Signal Adapter" which combines simple (non-signal) indicators and produces a signal. This is a recipe to build fast and backtest more complex strategy logic.
This approach has a fail-fast mentality! Keep, in mind that you can code a single signal indicator with your composed logic later on only if the idea turns out to be "good enough".

Signal AnalyzerThis library contains functions that try to analyze trading signals performance.
Like the % of average returns after a long or short signal is provided or the number of times that signal was correct, in the inmediate 2 candles after the signal.

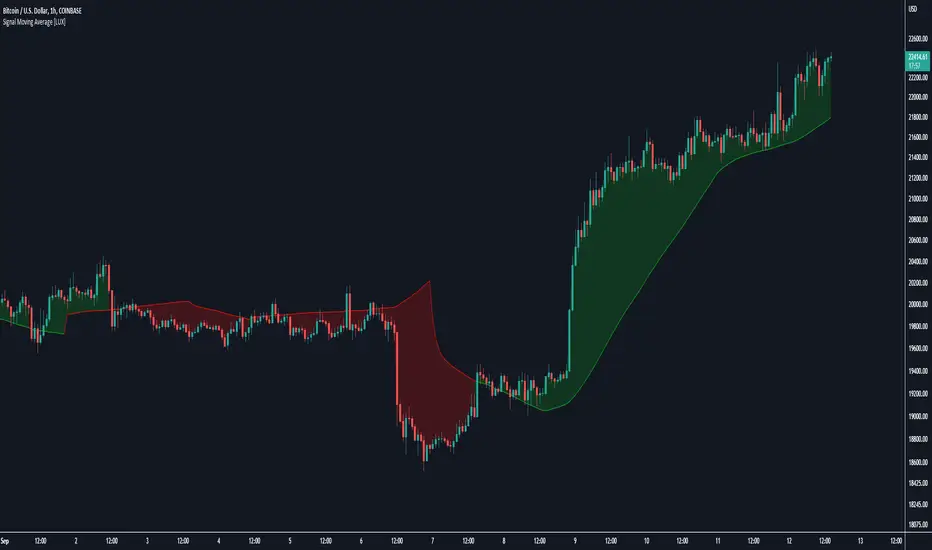
Signal Moving Average [LuxAlgo]The following script returns a moving average designed to be used as a signal line in a moving average crossover system. The moving average will diverge from the price during ranging markets and reach the value of a regular moving average during trending markets.
Settings
Length: Moving average period
Src: Source input of the indicator
Usage
Moving average crossover strategies often rely on a "signal" line, a slower moving average used to determine a general trend. This signal line is paired with a faster moving average to filter out potential whipsaw trades that would have been given from crosses between the regular price and the signal line.
The proposed indicator will avoid crossing the price by diverging from it during more ranging periods, thus effectively reducing the number of crosses produced between the price and the signal line.
The color of the area between the price and the signal line is determined by the position of the price relative to the signal line, with a green color indicator a price superior to the signal line.
The color of the signal line, however, is taking into account whether market is trending or ranging, only changing once the market is trending.
The chart above shows the cumulated number of crosses between the price and the signal line (green) and a regular simple moving average of the same period (red) on AMD 15m, a lowered number of crosses can effectively reduce the impact of frictional costs introduced by whipsaw trades.
Signal ViewerThe "Signal Viewer" script is a debugging tool that can be used for the signal of a Signal Indicator script like the "Two MA Signal Indicator" or the "Template Signal Indicator". This script will visualize the signal based on the convention that was defined in the settings. Also, alerts will be produced based on this convention. It's useful to be used before you connect the signal indicator script to a template strategy like the "Template Trailing Strategy" script. You can cross-validate the correctness of the signal that the indicators emit and make sure it is aligned with the expected behavior after the decomposition of the signal using the convention described in the settings. Please make sure that the connection in the "Signal Viewer" script matches the convention used by the template strategy script.

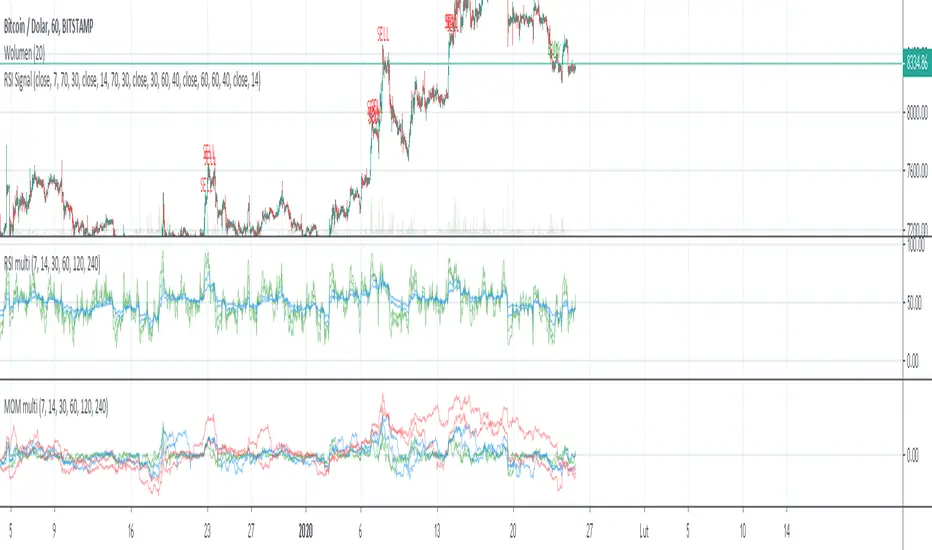
Multi RSI + Signal OB/OSSignal of Overbought and Oversold based on 4x interval of RSI and Momentum. You can change interval and source
Signal To Noise Ratio IndicatorThis is a trend indicator at its core so combine with rsi or a moving average of your choice to see which direction the stock is trending in.
Only enter a position (long or short) when signal to noise ratio is above the signal line
This is one of my first indicators posted on here so be sure to leave me feedback

Signal AdapterThis Signal Adapter script can compose a signal based on inputs from other simple (non-signal) indicators and can forwards it to the "Template Trailing Strategy".
It allows the user to combine up to eight external inputs and define the conditions that will trigger the start, end, cancel start and cancel end deals.
A signal will be composed from those user-defined conditions. The "indicator on indicator" feature is needed so you can forward the resulted signal to the "Template Trailing Strategy".
Thus you should be Plus or Premium user to get it's full potential. It is very convenient for those who want to create a strategy without coding their own signal indicator and for those
who want to fast prototype various ideas based on simple conditions.

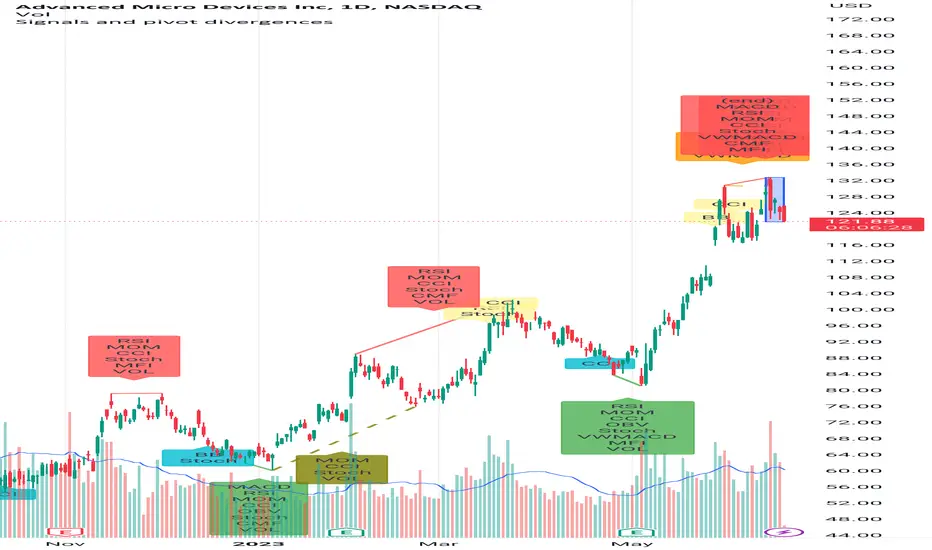
Signals and pivot divergencesScript that shows buy and sell signals for multiple indicators and divergences when there's a pivot in the price chart. The defaults are from my own laboration and don't hesitate to share your settings!
Best of trading luck!
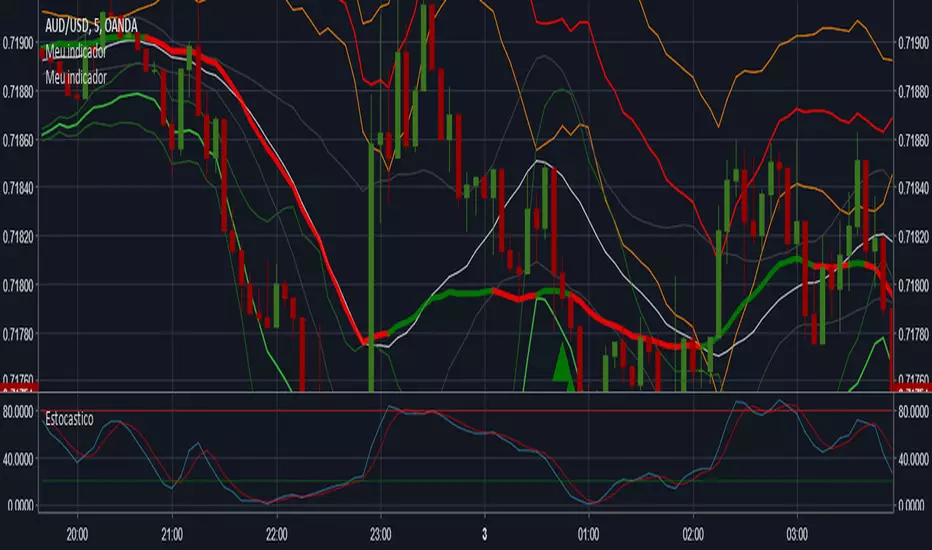
Signals for call and putSorry for the Google Translate English
Indicator for signals of call and put, using Bollinger bands (period 20, standard deviation 2.5), market trend of (sma, períod 100) and stochastic (period 20, %D 3).
I was overthrown but in pine scrip, the function "stoch()" no way to smooth (3). If anyone knows how to smooth inside the script, help me! Please.
With smoothed stochastic the hit rate grows a lot.
Português (Pt-Br)
Indicador de sinais de compra e venda, usando bandas de Bollinger (período de 20, desvio de 2,5), tendencia de mercado com (sma período 100) e estocástico (período 20, %D de 3).
Eu travei porque no pine script, a função "stoch()" não tem como aplicar a suavização (3). Se alguem souber como suavizar dentro do script, me ajude! Por favor.
Uptrick: Bullish/Bearish Signal DetectorDetailed Explanation of the "Uptrick: Bullish/Bearish Signal Detector" Script
The "Uptrick: Bullish/Bearish Signal Detector" script is a sophisticated tool designed for the TradingView platform, leveraging Pine Script version 5. This script is crafted to enhance traders' ability to identify bullish (buy) and bearish (sell) signals directly on their trading charts. By combining the power of the MACD (Moving Average Convergence Divergence) and RSI (Relative Strength Index) indicators, this script provides a unique and efficient method for detecting potential trading opportunities. Below is an in-depth exploration of its purpose, features, and functionality.
Purpose
The primary purpose of this script is to assist traders in identifying potential entry and exit points in the market by signaling bullish and bearish conditions. This automated detection helps traders make more informed decisions without the need to manually analyze complex indicators. By overlaying signals directly on the price chart, the script allows for quick visual identification of market trends and reversals.
Uniqueness
What sets this script apart is its dual use of MACD and RSI indicators. While many trading strategies might rely on a single indicator, combining MACD and RSI enhances the reliability of the signals by filtering out false positives. The script not only identifies trends but also adds a layer of confirmation through the RSI, which measures the speed and change of price movements.
Inputs and Features
Customizable Label Appearance:
The script allows users to customize the appearance of the labels that indicate bullish and bearish signals. Users can set their preferred colors for the labels and the text, ensuring that the signals are easily distinguishable and aesthetically pleasing on their charts.
MACD Calculation:
The script calculates the MACD line and signal line using user-defined input values for the fast length, slow length, and signal length. The MACD histogram, which is the difference between the MACD line and the signal line, is used to determine the momentum of the market.
RSI Calculation:
The RSI is calculated using a user-defined input length. The RSI helps in identifying overbought or oversold conditions, which are crucial for confirming the strength of the trend detected by the MACD.
Bullish and Bearish Conditions:
The script defines bullish conditions as those where the MACD histogram is positive and the RSI is above 50. Bearish conditions are defined where the MACD histogram is negative and the RSI is below 50. This combination of conditions ensures that signals are generated based on both momentum and relative strength, reducing the likelihood of false signals.
Label Plotting:
The script plots labels on the chart to indicate bullish and bearish signals. When a bullish condition is met, and the previous signal was not bullish, a "LONG" label is plotted. Similarly, when a bearish condition is met, and the previous signal was not bearish, a "SHORT" label is plotted. This feature helps in clearly marking the points of interest for traders, making it easier to spot potential trades.
Tracking Previous Signals:
To avoid repetitive signals, the script keeps track of the last signal. If the last signal was bullish, it avoids plotting another bullish signal immediately. The same logic applies to bearish signals. This tracking ensures that signals are spaced out and only significant changes in market conditions are highlighted.
How It Works
The script operates in a loop, processing each bar (or candlestick) on the chart as new data comes in. It calculates the MACD and RSI values for each bar and checks if the current conditions meet the criteria for a bullish or bearish signal. If a signal is detected and it is different from the last signal, a label is plotted on the chart at the current bar's price level. This real-time processing allows traders to see the signals as they form, providing timely insights into market movements.
Practical Application
For practical use, a trader would add this script to their TradingView chart. They can customize the input parameters for the MACD and RSI calculations to fit their trading strategy or preferred settings. Once added, the script will automatically analyze the price data and start plotting "LONG" and "SHORT" labels based on the detected signals. Traders can then use these labels to make decisions on entering or exiting trades, adjusting their strategy as necessary based on the signals provided.
Conclusion
The "Uptrick: Bullish/Bearish Signal Detector" script is a powerful tool for any trader looking to leverage technical indicators for better trading decisions. By combining MACD and RSI, it offers a robust method for detecting market trends and potential reversals. The customizable features and real-time signal plotting make it a versatile and user-friendly addition to any trading toolkit. This script not only simplifies the process of technical analysis but also enhances the accuracy of trading signals, thereby potentially increasing the trader's success rate in the market.

Sigma 2.0 - Advanced Buy and Sell Signal IndicatorOverview:
Sigma 2.0 is a sophisticated trading indicator designed to help traders identify potential buy and sell opportunities across various financial markets. By leveraging advanced mathematical calculations and incorporating multiple analytical tools, Sigma 2.0 aims to enhance trading strategies by providing precise entry and exit signals.
Key Features:
Advanced Sigma Calculations:
Utilizes a combination of Exponential Moving Averages (EMAs) and price deviations to calculate the Sigma lines (sigma1 and sigma2).
Detects potential trend reversals through the crossover of these Sigma lines.
Customizable Signal Filtering:
Offers the ability to filter buy and sell signals based on user-defined thresholds.
Helps reduce false signals in volatile markets by setting overbought and oversold levels.
Overbought and Oversold Detection:
Identifies extreme market conditions where price reversals are more likely.
Changes the background color of the chart to visually indicate overbought or oversold states.
Integration of Exponential Moving Averages (EMAs):
Includes EMAs of different lengths (10, 21, 55, 200) to assist in identifying market trends.
EMAs act as dynamic support and resistance levels.
Higher Timeframe Signal Incorporation:
Allows users to include signals from a higher timeframe to align trades with the broader market trend.
Enhances the reliability of signals by considering multiple timeframes.
Custom Alerts:
Provides alert conditions for both buy and sell signals.
Enables traders to receive notifications, ensuring timely decision-making.
How It Works:
Sigma Calculation Methodology:
The indicator calculates an average price (ap) and applies EMAs to derive the Sigma lines.
sigma1 represents the smoothed price deviation, while sigma2 is a moving average of sigma1.
A crossover of sigma1 above sigma2 generates a buy signal, indicating potential upward momentum.
Conversely, a crossover of sigma1 below sigma2 generates a sell signal.
Signal Filtering and Thresholds:
Users can enable filtering to only consider signals when sigma1 is below or above certain thresholds.
This helps in focusing on more significant market movements and reducing noise.
Overbought/Oversold Levels:
The indicator monitors sigma1 to detect when the market is in extreme conditions.
Background color changes provide a quick visual cue for these conditions.
EMA Analysis:
The plotted EMAs help in confirming the trend direction.
They can be used alongside Sigma signals to validate trade entries and exits.
Higher Timeframe Signals:
Incorporates signals from a user-selected higher timeframe.
Helps in aligning trades with the overall market trend, increasing the potential success rate.
How to Use:
Adding the Indicator to Your Chart:
Search for "Sigma 2.0" in the TradingView Indicators menu and add it to your chart.
Configuring the Settings:
Adjust the Sigma configurations (Channel Length, Average Length, Signal Line Length) to suit your trading style.
Set the overbought and oversold levels according to your risk tolerance.
Choose whether to filter signals by thresholds.
Select the higher timeframe for additional signal confirmation.
Interpreting the Signals:
Buy Signals:
Indicated by a green triangle below the price bar.
Occur when sigma1 crosses above sigma2 and other conditions are met.
Sell Signals:
Indicated by a red triangle above the price bar.
Occur when sigma1 crosses below sigma2 and other conditions are met.
Higher Timeframe Signals:
Plotted with lime (buy) and maroon (sell) triangles.
Help confirm signals in the current timeframe.
Utilizing EMAs:
Observe the EMAs to gauge the overall trend.
Consider aligning buy signals when the price is above key EMAs and sell signals when below.
Setting Up Alerts:
Use the built-in alert conditions to receive notifications for buy and sell signals.
Customize alert messages as needed.
Credits:
Original Concept Inspiration:
This indicator is inspired by the WaveTrend oscillator and other momentum-based indicators.
Special thanks to the original authors whose work laid the foundation for this enhanced version.
Disclaimer:
Trading involves significant risk, and past performance is not indicative of future results.
This indicator is a tool to assist in analysis and should not be the sole basis for any trading decision.
Always perform thorough analysis and consider multiple factors before entering a trade.
Note:
Ensure your chart is clean and only includes this indicator when publishing.
The script is open-source and can be modified to fit individual trading strategies.
For any questions or support, feel free to reach out or comment.

On-Chain Signals [LuxAlgo]The On-Chain Signals indicator uses fundamental blockchain metrics to provide traders with an objective technical view of their favorite cryptocurrencies.
It uses IntoTheBlock datasets integrated within TradingView to generate four key signals: Net Network Growth, In the Money, Concentration, and Large Transactions.
Together, these four signals provide traders with an overall directional bias of the market. All of the data can be visualized as a gauge, table, historical plot, or average.
🔶 USAGE
The main goal of this tool is to provide an overall directional bias based on four blockchain signals, each with three possible biases: bearish, neutral, or bullish. The thresholds for each signal bias can be adjusted on the settings panel.
These signals are based on IntoTheBlock's On-Chain Signals.
Net network growth: Change in the total number of addresses over the last seven periods; i.e., how many new addresses are being created.
In the Money: Change in the seven-period moving average of the total supply in the money. This shows how many addresses are profitable.
Concentration: Change in the aggregate addresses of whales and investors from the previous period. These are addresses holding at least 0.1% of the supply. This shows how many addresses are in the hands of a few.
Large Transactions: Changes in the number of transactions over $100,000. This metric tracks convergence or divergence from the 21- and 30-day EMAs and indicates the momentum of large transactions.
All of these signals together form the blockchain's overall directional bias.
Bearish: The number of bearish individual signals is greater than the number of bullish individual signals.
Neutral: The number of bearish individual signals is equal to the number of bullish individual signals.
Bullish: The number of bullish individual signals is greater than the number of bearish individual signals.
If the overall directional bias is bullish, we can expect the price of the observed cryptocurrency to increase. If the bias is bearish, we can expect the price to decrease. If the signal is neutral, the price may be more likely to stay the same.
Traders should be aware of two things. First, the signals provide optimal results when the chart is set to the daily timeframe. Second, the tool uses IntoTheBlock data, which is available on TradingView. Therefore, some cryptocurrencies may not be available.
🔹 Display Mode
Traders have three different display modes at their disposal. These modes can be easily selected from the settings panel. The gauge is set by default.
🔹 Gauge
The gauge will appear in the center of the visible space. Traders can adjust its size using the Scale parameter in the Settings panel. They can also give it a curved effect.
The number of bars displayed directly affects the gauge's resolution: More bars result in better resolution.
The chart above shows the effect that different scale configurations have on the gauge.
🔹 Historical Data
The chart above shows the historical data for each of the four signals.
Traders can use this mode to adjust the thresholds for each signal on the settings panel to fit the behavior of each cryptocurrency. They can also analyze how each metric impacts price behavior over time.
🔹 Average
This display mode provides an easy way to see the overall bias of past prices in order to analyze price behavior in relation to the underlying blockchain's directional bias.
The average is calculated by taking the values of the overall bias as -1 for bearish, 0 for neutral, and +1 for bullish, and then applying a triangular moving average over 20 periods by default. Simple and exponential moving averages are available, and traders can select the period length from the settings panel.
🔶 DETAILS
The four signals are based on IntoTheBlock's On-Chain Signals. We gather the data, manipulate it, and build the signals depending on each threshold.
Net network growth
float netNetworkGrowthData = customData('_TOTALADDRESSES')
float netNetworkGrowth = 100*(netNetworkGrowthData /netNetworkGrowthData - 1)
In the Money
float inTheMoneyData = customData('_INOUTMONEYIN')
float averageBalance = customData('_AVGBALANCE')
float inTheMoneyBalance = inTheMoneyData*averageBalance
float sma = ta.sma(inTheMoneyBalance,7)
float inTheMoney = ta.roc(sma,1)
Concentration
float whalesData = customData('_WHALESPERCENTAGE')
float inverstorsData = customData('_INVESTORSPERCENTAGE')
float bigHands = whalesData+inverstorsData
float concentration = ta.change(bigHands )*100
Large Transactions
float largeTransacionsData = customData('_LARGETXCOUNT')
float largeTX21 = ta.ema(largeTransacionsData,21)
float largeTX30 = ta.ema(largeTransacionsData,30)
float largeTransacions = ((largeTX21 - largeTX30)/largeTX30)*100
🔶 SETTINGS
Display mode: Select between gauge, historical data and average.
Average: Select a smoothing method and length period.
🔹 Thresholds
Net Network Growth : Bullish and bearish thresholds for this signal.
In The Money : Bullish and bearish thresholds for this signal.
Concentration : Bullish and bearish thresholds for this signal.
Transactions : Bullish and bearish thresholds for this signal.
🔹 Dashboard
Dashboard : Enable/disable dashboard display
Position : Select dashboard location
Size : Select dashboard size
🔹 Gauge
Scale : Select the size of the gauge
Curved : Enable/disable curved mode
Select Gauge colors for bearish, neutral and bullish bias
🔹 Style
Net Network Growth : Enable/disable historical plot and choose color
In The Money : Enable/disable historical plot and choose color
Concentration : Enable/disable historical plot and choose color
Large Transacions : Enable/disable historical plot and choose color

Reversal Signals [AlgoAlpha]📈🔄 Reversal Signals – Master Market Reversals with Precision! 🚀✨
Elevate your trading strategy with the Reversal Signals indicator by AlgoAlpha. This advanced tool is designed to pinpoint potential bullish and bearish reversals by analyzing price action and, optionally, volume confirmations. It seamlessly combines reversal detection with trend analysis, giving you a comprehensive view of market dynamics to make informed trading decisions.
Key Features
🔎 Price Action Reversal Detection : Identifies potential reversal points by comparing current price movements against historical candle patterns within a customizable lookback period.
📊 Volume Confirmation : Optionally integrates volume analysis to confirm the strength of reversal signals, enhancing their reliability.
📈 Stepped Moving Average Trend Indicator : Employs a stepped moving average that adjusts at set intervals to reflect underlying market trends.
⚙️ Customizable Settings : Tailor the indicator to your trading style with adjustable parameters for lookback periods, confirmation windows, moving average types, and more.
🎨 Visual Signals and Trend Coloring : Clear on-chart labels for reversal signals and color-coded trend areas to quickly identify bullish and bearish conditions.
🔔 Alerts for Key Market Events : Set up custom alerts for reversal signals and trend shifts to stay ahead of market movements.
Quick Guide to Using the Reversal Signals Indicator :
🛠 Add the Indicator : Add the indicator to your favorites by pressing the star icon. Customize settings like Candle Lookback, Confirm Within, and Use Volume Confirmation to fit your trading style.
📊 Market Analysis : Observe the "𝓡" labels on the chart indicating bullish and bearish reversal signals. Look for labels below the bars for bullish signals and above the bars for bearish signals. Use the color-filled areas between the stepped moving average and the center line to assess market trends.
🔔 Alerts : Enable notifications for reversal signals and trend shifts to stay informed about market movements without constantly monitoring the chart.
How It Works
The Reversal Signals indicator operates by conducting a thorough analysis of price action over a user-defined lookback period. For a bullish reversal, the indicator checks if the current closing price is lower than the lows of the preceding candles within the lookback window, suggesting a potential oversold condition. If this criterion is met, it marks the candle as a potential reversal point and waits for confirmation within a specified number of subsequent candles. Confirmation occurs when the price rises above the high of the identified candle, signaling a bullish reversal. An optional volume confirmation can be enabled to ensure that the reversal is supported by higher-than-average trading volume, adding an extra layer of validation to the signal. The process is mirrored for bearish reversals, where the indicator looks for the closing price exceeding previous highs and awaits confirmation of a downward move.
Complementing the reversal signals, the indicator features a stepped moving average that serves as a dynamic trend indicator. This moving average updates at intervals defined by the MA Step Period and shifts direction based on price crossings. If the price remains above the stepped MA, it indicates a bullish trend, coloring the area between the MA and the center line in green. Conversely, if the price falls below the stepped MA, a bearish trend is signaled, and the area is shaded red. This visual representation helps traders quickly assess the prevailing market trend and align their trading decisions accordingly.
Experience a new level of market insight with the Reversal Signals indicator. Add it to your TradingView chart today and enhance your ability to detect and act on key ma

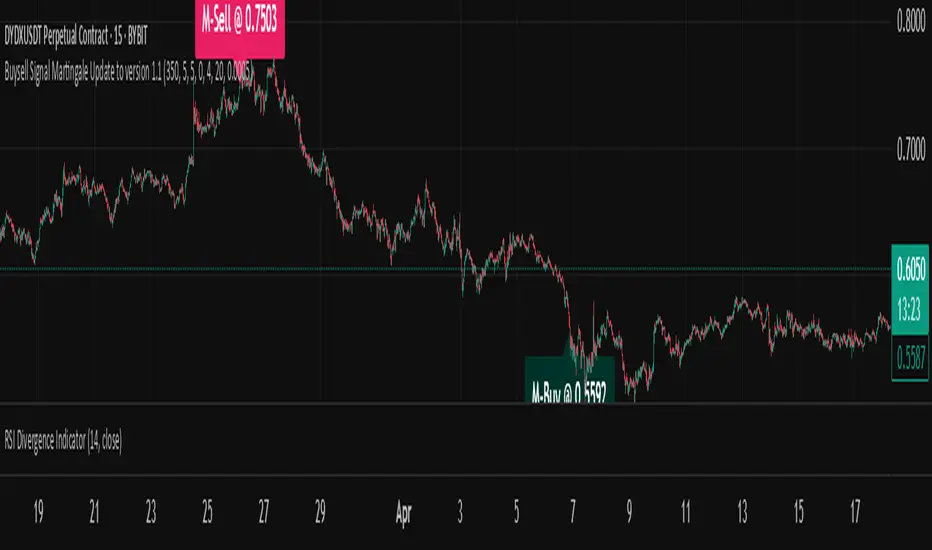
Buysell Martingale Signal - CustomBuysell Martingale Signal - Custom Indicator
Introduction:
This indicator provides a dynamic buy and sell signal system incorporating an adaptive Martingale logic. Built upon the signalLib_yashgode9/2 library, it is designed for use across various markets and timeframes.
Key Features:
Primary Buy & Sell Signals: Identifies initial buy and sell opportunities based on directional changes derived from the signalLib.
Martingale Signals:
For Short (Sell) Positions: A Martingale Sell signal is triggered when the price moves against the existing short position by a specified stepPercent from the last entry price, indicating a potential opportunity to average down or increase position size.
For Long (Buy) Positions: Similarly, a Martingale Buy signal is triggered when the price moves against the existing long position by a stepPercent from the last entry price.
On-Chart Labels: Displays clear, customizable labels on the chart for primary Buy, Sell, Martingale Buy, and Martingale Sell signals.
Customizable Colors: Allows users to set distinct colors for primary signals and Martingale signals for better visual distinction.
Adjustable Sensitivity: Features configurable parameters (DEPTH_ENGINE, DEVIATION_ENGINE, BACKSTEP_ENGINE) to fine-tune the sensitivity of the underlying signal generation.
Webhook Support (Static Message Alerts): This indicator provides alerts with static messages for both primary and Martingale buy/sell signals. These alerts can be leveraged for automation by external systems (such as trading bots or exchange-provided Webhook Signal Trading services).
Important Note: When using these alerts for automation, an external system is required to handle the complex Martingale logic and position management (e.g., tracking steps, PnL calculation, hedging, dynamic quantity sizing), as this indicator solely focuses on signal generation and sending predefined messages.
How to Use:
Add the indicator to your desired chart.
Adjust the input parameters in the indicator's settings to match your specific trading symbol and timeframe.
For automation, you can set up TradingView alerts for the Buy Signal (Main/Martingale) and Sell Signal (Main/Martingale) conditions, pointing them to your preferred Webhook URL.
Configurable Parameters:
DEPTH_ENGINE: (e.g., 30) Controls the depth of analysis for the signal algorithm.
DEVIATION_ENGINE: (e.g., 5) Defines the allowable deviation for signal generation.
BACKSTEP_ENGINE: (e.g., 5) Specifies the number of historical bars to look back.
Martingale Step Percent: (e.g., 0.5) The percentage price movement against the current position that triggers a Martingale signal.
Labels Transparency: Adjusts the transparency of the on-chart signal labels.
Buy-Color / Sell-Color: Sets the color for primary Buy and Sell signal labels.
Martingale Buy-Color / Martingale Sell-Color: Sets the color for Martingale Buy and Sell signal labels.
Label size: Controls the visual size of the labels.
Label Offset: Adjusts the vertical offset of the labels from the candlesticks.
Risk Warning:
Financial trading inherently carries significant risk. Martingale strategies are particularly high-risk and can lead to substantial losses or even complete liquidation of capital if the market moves strongly and persistently against your position. Always backtest thoroughly and practice with a demo account, fully understanding the associated risks, before engaging with real capital.
Signal Hunter Pro - GKDXLSignal Hunter Pro - GKDXL combines four powerful technical indicators with trend strength filtering and volume confirmation to generate reliable BUY/SELL signals. This indicator is perfect for traders who want a systematic approach to market analysis without the noise of conflicting signals.
🔧 Core Features
📈 Multi-Indicator Signal System
Moving Averages: EMA 20, EMA 50, and SMA 200 for trend analysis
Bollinger Bands: Dynamic support/resistance with price momentum detection
RSI: Enhanced RSI logic with smoothing and multi-zone analysis
MACD: Traditional MACD with signal line crossovers and zero-line analysis
🎛️ Advanced Filtering System
ADX Trend Strength Filter: Only signals when trend strength exceeds threshold
Volume Confirmation: Ensures signals occur with adequate volume participation
Multi-Timeframe Logic: Works on any timeframe from 1m to 1D and beyond
🚨 Intelligent Signal Generation
Requires 3 out of 4 indicators to align for signal confirmation
Separate bullish and bearish signal conditions
Real-time signal strength scoring (1/4 to 4/4)
Built-in alert system for automated notifications
⚙️ Customizable Parameters
📊 Technical Settings
Moving Averages: Adjustable EMA and SMA periods
Bollinger Bands: Configurable length and multiplier
RSI: Customizable length, smoothing, and overbought/oversold levels
MACD: Flexible fast, slow, and signal line settings
🎯 Risk Management
Risk Percentage: Set your risk per trade (0.1% to 10%)
Reward Ratio: Configure risk-to-reward ratios (1:1 to 1:5)
ADX Threshold: Control minimum trend strength requirements
🖥️ Display Options
Indicator Visibility: Toggle individual indicators on/off
Information Table: Optional detailed status table (off by default)
Volume Analysis: Real-time volume vs. average comparison
🎨 Visual Elements
📈 Chart Indicators
EMA Lines: Blue (20) and Orange (50) exponential moving averages
SMA 200: Gray long-term trend line
Bollinger Bands: Upper/lower bands with semi-transparent fill
Clean Interface: Minimal visual clutter for clear analysis
📋 Information Table (Optional)
Real-time indicator status with ✓/✗/— symbols
Current signal strength and direction
ADX trend strength measurement
Volume confirmation status
No-signal reasons when conditions aren't met
🔔 Alert System
📢 Three Alert Types
BUY Signal: Triggered when 3+ indicators align bullishly
SELL Signal: Triggered when 3+ indicators align bearishly
General Alert: Any signal detection for broader monitoring
📱 Alert Messages
Clear, actionable alert text
Includes indicator name for easy identification
Compatible with webhook integrations
🎯 How It Works
📊 Signal Logic
Indicator Assessment: Each of the 4 indicators is evaluated as Bullish/Bearish/Neutral
Consensus Building: Counts aligned indicators (minimum 3 required)
Filter Application: Applies trend strength and volume filters
Signal Generation: Generates BUY/SELL when all conditions are met
🔍 Indicator States
Moving Averages: Price position, EMA alignment, and crossovers
Bollinger Bands: Price relative to bands and momentum shifts
RSI: Multi-zone analysis with momentum and crossover detection
MACD: Signal line crossovers and zero-line positioning
🎉 Why Choose Signal Hunter Pro?
✅ Multi-Indicator Confirmation reduces false signals
✅ Trend Strength Filtering improves win rate
✅ Volume Confirmation ensures market participation
✅ Customizable Parameters adapt to any trading style
✅ Clean Visual Design doesn't clutter your charts
✅ Professional Alert System for automated trading
✅ No Repainting - reliable historical signals
✅ Works on All Timeframes from scalping to investing

SD Bands Filtered Signals### SD Bands Filtered Signals: Reversion & Volatility Scanner
**Core Description:**
The SD Bands Filtered Signals is a tool developed to help traders identify more accurate buy and sell signals in sideways markets, or during periods of low price movement. It utilizes the principles of Standard Deviation (SD) and a Moving Average (MA), with a unique 'signal filtering' system added to reduce unnecessary noise.
**Key Features:**
* **SD Bands:** Creates upper and lower bands to define price volatility zones, providing a clear overview of market conditions.
* **Intelligent Reversal Signals:** Generates specially filtered Buy/Sell signals for a 'Reversion to the Mean' strategy. These signals appear only when the market has low volatility and the price touches the SD Bands.
* **Advanced Signal Filtering System:** Uses a **`Cooldown Bars`** variable to set a rest period between signals. This prevents repetitive arrows in the same zone, helping you find the best signal at the most suitable point.
* **Fully Customizable:** You can adjust the **`Length`**, **`Multiplier`**, **`Sideways Threshold`**, and **`Cooldown Bars`** to fit your trading style and asset of choice.
**How to Use:**
* **Buy Signal (Green Arrow Up):** Look for this signal when the market is sideways and the price moves down to touch the lower band (SD Low).
* **Sell Signal (Red Arrow Down):** Look for this signal when the market is sideways and the price moves up to touch the upper band (SD High).
* **Customization:** You can adjust the **`Cooldown Bars`** value to control the number of arrows. If you want more accurate but fewer signals, increase this value.
**Disclaimer:**
* This indicator is an **analytical tool only** and is not a 100% guarantee of profit.
* It should be used in conjunction with other forms of analysis, such as candlestick patterns, trading volume, and proper risk management.
ไทย
ชื่ออินดิเคเตอร์ "SD Bands Filtered Signals: Reversion & Volatility Scanner"
คำอธิบายหลัก:
อินดิเคเตอร์ SD Bands Filtered Signals เป็นเครื่องมือที่ถูกพัฒนาขึ้นเพื่อช่วยให้นักเทรดสามารถระบุสัญญาณซื้อ (Buy) และขาย (Sell) ที่แม่นยำขึ้นในตลาดแบบ Sideways หรือช่วงที่ราคาเคลื่อนที่ในกรอบแคบๆ โดยใช้หลักการของ Standard Deviation (SD) และ Moving Average (MA) และเพิ่มระบบ 'กรองสัญญาณ' ที่เป็นเอกลักษณ์เพื่อลดสัญญาณรบกวน (Noise) ที่ไม่จำเป็นออกไป
คุณสมบัติเด่น:
* SD Bands: สร้างเส้นขอบบนและล่างเพื่อระบุโซนความผันผวนของราคา ทำให้เห็นภาพรวมของตลาดได้ง่าย
* สัญญาณ Reversal อัจฉริยะ: สร้างสัญญาณ Buy/Sell ที่ถูกคัดกรองมาเป็นพิเศษสำหรับกลยุทธ์การกลับตัว (Reversion to the Mean) โดยจะปรากฏเฉพาะเมื่อตลาดมีความผันผวนต่ำและราคาแตะขอบของ SD Bands
* ระบบกรองสัญญาณขั้นสูง: ใช้ตัวแปร Cooldown Bars เพื่อกำหนดระยะเวลาพักสัญญาณ ทำให้ไม่เกิดลูกศรซ้ำๆ ในโซนเดียวกัน และช่วยให้คุณได้สัญญาณที่ดีที่สุดในจุดที่เหมาะสมที่สุด
* ปรับแต่งได้เต็มที่: คุณสามารถปรับค่า Length, Multiplier, Sideways Threshold และ Cooldown Bars เพื่อให้เข้ากับสไตล์การเทรดและคู่สินทรัพย์ที่คุณสนใจ
วิธีการใช้งาน:
* สัญญาณ Buy (ลูกศรสีเขียวขึ้น): มองหาสัญญาณนี้เมื่อตลาดอยู่ในช่วง Sideways และราคาวิ่งลงมาแตะเส้นขอบล่าง (SD Low)
* สัญญาณ Sell (ลูกศรสีแดงลง): มองหาสัญญาณนี้เมื่อตลาดอยู่ในช่วง Sideways และราคาวิ่งขึ้นไปแตะเส้นขอบบน (SD High)
* การปรับแต่ง: คุณสามารถปรับค่า Cooldown Bars เพื่อให้ได้จำนวนลูกศรที่ต้องการ หากต้องการสัญญาณที่แม่นยำขึ้นแต่จำนวนน้อยลง ให้เพิ่มค่านี้ให้สูงขึ้น
ข้อควรระวัง:
* อินดิเคเตอร์นี้เป็นเพียงเครื่องมือวิเคราะห์ ไม่ใช่สัญญาณที่การันตีผลกำไร 100%
* ควรใช้ประกอบกับการวิเคราะห์อื่นๆ เช่น รูปแบบแท่งเทียน, ปริมาณการซื้อขาย (Volume) และการจัดการความเสี่ยงที่เหมาะสม

Multi-Indicator Signals with Selectable Options by DiGetMulti-Indicator Signals with Selectable Options
Script Overview
This Pine Script is a multi-indicator trading strategy designed to generate buy/sell signals based on combinations of popular technical indicators: RSI (Relative Strength Index) , CCI (Commodity Channel Index) , and Stochastic Oscillator . The script allows you to select which combination of signals to display, making it highly customizable and adaptable to different trading styles.
The primary goal of this script is to provide clear and actionable entry/exit points by visualizing buy/sell signals with arrows , labels , and vertical lines directly on the chart. It also includes input validation, dynamic signal plotting, and clutter-free line management to ensure a clean and professional user experience.
Key Features
1. Customizable Signal Types
You can choose from five signal types:
RSI & CCI : Combines RSI and CCI signals for confirmation.
RSI & Stochastic : Combines RSI and Stochastic signals.
CCI & Stochastic : Combines CCI and Stochastic signals.
RSI & CCI & Stochastic : Requires all three indicators to align for a signal.
All Signals : Displays individual signals from each indicator separately.
This flexibility allows you to test and use the combination that works best for your trading strategy.
2. Clear Buy/Sell Indicators
Arrows : Buy signals are marked with upward arrows (green/lime/yellow) below the candles, while sell signals are marked with downward arrows (red/fuchsia/gray) above the candles.
Labels : Each signal is accompanied by a label ("BUY" or "SELL") near the arrow for clarity.
Vertical Lines : A vertical line is drawn at the exact bar where the signal occurs, extending from the low to the high of the candle. This ensures you can pinpoint the exact entry point without ambiguity.
3. Dynamic Overbought/Oversold Levels
You can customize the overbought and oversold levels for each indicator:
RSI: Default values are 70 (overbought) and 30 (oversold).
CCI: Default values are +100 (overbought) and -100 (oversold).
Stochastic: Default values are 80 (overbought) and 20 (oversold).
These levels can be adjusted to suit your trading preferences or market conditions.
4. Input Validation
The script includes built-in validation to ensure that oversold levels are always lower than overbought levels for each indicator. If the inputs are invalid, an error message will appear, preventing incorrect configurations.
5. Clean Chart Design
To avoid clutter, the script dynamically manages vertical lines:
Only the most recent 50 buy/sell lines are displayed. Older lines are automatically deleted to keep the chart clean.
Labels and arrows are placed strategically to avoid overlapping with candles.
6. ATR-Based Offset
The vertical lines and labels are offset using the Average True Range (ATR) to ensure they don’t overlap with the price action. This makes the signals easier to see, especially during volatile market conditions.
7. Scalable and Professional
The script uses arrays to manage multiple vertical lines, ensuring scalability and performance even when many signals are generated.
It adheres to Pine Script v6 standards, ensuring compatibility and reliability.
How It Works
Indicator Calculations :
The script calculates the values of RSI, CCI, and Stochastic Oscillator based on user-defined lengths and smoothing parameters.
It then checks for crossover/crossunder conditions relative to the overbought/oversold levels to generate individual signals.
Combined Signals :
Depending on the selected signal type, the script combines the individual signals logically:
For example, a "RSI & CCI" buy signal requires both RSI and CCI to cross into their respective oversold zones simultaneously.
Signal Plotting :
When a signal is generated, the script:
Plots an arrow (upward for buy, downward for sell) at the corresponding bar.
Adds a label ("BUY" or "SELL") near the arrow for clarity.
Draws a vertical line extending from the low to the high of the candle to mark the exact entry point.
Line Management :
To prevent clutter, the script stores up to 50 vertical lines in arrays (buy_lines and sell_lines). Older lines are automatically deleted when the limit is exceeded.
Why Use This Script?
Versatility : Whether you're a scalper, swing trader, or long-term investor, this script can be tailored to your needs by selecting the appropriate signal type and adjusting the indicator parameters.
Clarity : The combination of arrows, labels, and vertical lines ensures that signals are easy to spot and interpret, even in fast-moving markets.
Customization : With adjustable overbought/oversold levels and multiple signal options, you can fine-tune the script to match your trading strategy.
Professional Design : The script avoids clutter by limiting the number of lines displayed and using ATR-based offsets for better visibility.
How to Use This Script
Add the Script to Your Chart :
Copy and paste the script into the Pine Editor in TradingView.
Save and add it to your chart.
Select Signal Type :
Use the "Signal Type" dropdown menu to choose the combination of indicators you want to use.
Adjust Parameters :
Customize the lengths of RSI, CCI, and Stochastic, as well as their overbought/oversold levels, to match your trading preferences.
Interpret Signals :
Look for green arrows and "BUY" labels for buy signals, and red arrows and "SELL" labels for sell signals.
Vertical lines will help you identify the exact bar where the signal occurred.
Tips for Traders
Backtest Thoroughly : Before using this script in live trading, backtest it on historical data to ensure it aligns with your strategy.
Combine with Other Tools : While this script provides reliable signals, consider combining it with other tools like support/resistance levels or volume analysis for additional confirmation.
Avoid Overloading the Chart : If you notice too many signals, try tightening the overbought/oversold levels or switching to a combined signal type (e.g., "RSI & CCI & Stochastic") for fewer but higher-confidence signals.

FVG Instantaneous Mitigation Signals [LuxAlgo]The FVG Instantaneous Mitigation Signals indicator detects and highlights "instantaneously" mitigated fair value gaps (FVG), that is FVGs that get mitigated one bar after their creation, returning signals upon mitigation.
Take profit/stop loss areas, as well as a trailing stop loss are also included to complement the signals.
🔶 USAGE
Instantaneous Fair Value Gap mitigation is a new concept introduced in this script and refers to the event of price mitigating a fair value gap one bar after its creation.
The resulting signal sentiment is opposite to the bias of the mitigated fair value gap. As such an instantaneously mitigated bearish FGV results in a bullish signal, while an instantaneously mitigated bullish FGV results in a bearish signal.
Fair value gap areas subject to instantaneous mitigation are highlighted alongside their average level, this level is extended until reached in a direction opposite to the FVG bias and can be used as a potential support/resistance level.
Users can filter out less volatile fair value gaps using the "FVG Width Filter" setting, with higher values highlighting more volatile fair value gaps subject to instantaneous mitigation.
🔹 TP/SL Areas
Users can enable take-profit/stop-loss areas. These are displayed upon a new signal formation, with an area starting from the mitigated FVG area average to this average plus/minus N ATRs, where N is determined by their respective multiplier settings.
Using a higher multiplier will return more distant areas from the price, requiring longer-term variations to be reached.
🔹 Trailing Stop Loss
A trailing-stop loss is included, increasing when the price makes a new higher high or lower low since the trailing has been set. Using a higher trailing stop multiplier will allow its initial position to be further away from the price, reducing its chances of being hit.
The trailing stop can be reset on "Every Signal", whether they are bullish or bearish, or only on an "Inverse Signal", which will reset the trailing when a signal of opposite bias is detected, this will preserve an existing trailing stop when a new signal of the same bias to the present one is detected.
🔶 DETAILS
Fair Value Gaps are ubiquitous to price action traders. These patterns arise when there exists a disparity between supply and demand. The action of price coming back and filling these imbalance areas is referred to as "mitigation" or "rebalancing".
"Instantaneous mitigation" refers to the event of price quickly mitigating a prior fair value gap, which in the case of this script is one bar after their creation. These events are indicative of a market more attentive to imbalances, and more willing to correct disparities in supply and demand.
If the market is particularly sensitive to imbalances correction then these can be excessively corrected, leading to further imbalances, highlighting a potential feedback process.
🔶 SETTINGS
FVG Width Filter: Filter out FVGs with thinner areas from returning a potential signal.
🔹 TP/SL
TP Area: Enable take-profit areas for new signals.
Multiplier: Control the distance from the take profit and the price, with higher values returning more distant TP's.
SL Area: Enable stop-loss areas for new signals.
Multiplier: Control the distance from the stop loss and the price, with higher values returning more distant SL's.
🔹 Trailing Stop
Reset Trailing Stop: Determines when the trailing stop is reset.
Multiplier: Controls the initial position of the trailing stop, with higher values returning more distant trailing stops.

Bollinger Band Wick and SRSI Signals [MW]Introduction
This indicator uses a novel combination of Bollinger Bands, candle wicks crossing the upper and lower Bollinger Bands and baseline, and combines them with the Stochastic SRSI oscillator to provide early BUY and SELL signals in uptrends, downtrends, and in ranging price conditions.
How it’s unique
People generally understand Bollinger Bands and Keltner Channels. Buy at the bottom band, sell at the top band. However, because the bands themselves are not static, impulsive moves can render them useless. People also generally understand wicks. Candles with large wicks can represent a change in pattern, or volatile price movement. Combining those two to determine if price is reaching a pivot point is relatively novel. When Stochastic RSI (SRSI) filtering is also added, it becomes a genuinely unique combination that can be used to determine trade entries and exits.
What’s the benefit
The benefit of the indicator is that it can help potentially identify pivots WHEN THEY HAPPEN, and with potentially minimal retracement, depending on the trader’s time window. Many indicators wait for a trend to be established, or wait for a breakout to occur, or have to wait for some form of confirmation. In the interpretation used by this indicator, bands, wicks, and SRSI cycles provide both the signal and confirmation.
It takes into account 3 elements:
Price approaching the upper or lower band or the baseline - MEANING: Price is becoming extended based on calculations that use the candle trading range.
A candle wick of a defined proportion (e.g. wick is 1/2 the size of a full candle OR candle body) crosses a band or baseline, but the body does not cross the band or baseline - MEANING: Buyers and sellers are both very active.
The Stochastic RSI reading is above 80 for SELL signals and below 20 for BUY signals - MEANING: Additional confirmation that price is becoming extended based on the current cyclic price pattern.
How to Use
SIGNALS
Buy Signals - Green(ish):
B Signal - Potential pivot up from the lower band when using the preferred multiplier
B1 Signal - Potential pivot up from baseline
Sell Signals - Red(ish):
S Signal - Potential pivot down from the upper band when using the preferred multiplier
S1 Signal - Potential pivot down from the baseline
DISCUSSION
During an uptrend or downtrend, signals from the baseline can help traders identify areas where they may enter the trending move with the least amount of drawdown. In both cases, entry points can occur with baseline signals in the direction of the trend.
For example, in an uptrend (when the price is forming higher highs and higher lows, or when the baseline is rising), price tends to oscillate between the upper band and baseline. In this case, the baseline BUY signal (B3) can show an entry point.
In a downtrend (when the price is forming lower highs and lower lows, or when the baseline is falling), price tends to oscillate between the baseline and the lower band. In this case, the baseline SELL signal (S3) can show an entry point.
During consolidation, when price is ranging, price tends to oscillate between the upper and lower bands, while crossing through the baseline unperturbed. Here, entry points can occur at the upper and lower bands.
When all conditions are met at the lower band during consolidation, a BUY signal (B), can occur. This signal may also occur prior to a break out of consolidation to the upside.
When all conditions are met at the upper band during consolidation, a SELL signal (S), can occur. This signal may also occur prior to a break out of consolidation to the downside.
Additional, B1 and S1 signals can be displayed that use the baseline as the pivot level.
Settings
SIGNALS
Show Bollinger Band Signals (Default: True): Allows signal labels to be shown.
Hide Baseline Signals (Default: False): Baseline signals are on by default. This will turn them off.
Show Wick Signals (Defau
lt: True): Displays signals when wicking occurs.
BOLLINGER BAND SETTINGS
Period length for Bollinger Band Basis (Default: 21): Length of the Bollinger Band (BB) moving average basis line.
Basis MA Type (Default: SMA): The moving average type for the BB Basis line.
Source (Default: “close”): The source of time series data.
Standard Deviation Multiplier (Default: 2.5: The deviation multiplier used to calculate the band distance from the basis line.
WICK SETTINGS FOR BOLLINGER BANDS
Wick Ratio for Bands (Default: 0.3): The ratio of wick size to total candle size for use at upper and lower bands.
Wick Ratio for Baseline (Default: 0.3): The ratio of wick size to total candle size for use at baseline.
WICK SETTINGS FOR CANDLE SIGNALS
Upper Wick Threshold (Default: 50): The percent of upper wick compared to the full candle size or candle body size.
Lower Wick Threshold (Default: 50): The percent of lower wick compared to the full candle size or candle body size.
Use Candle Body (Default: false): Toggles the use of the full candle size versus the candle body size when calculating the wick signal.
VISUAL PREFERENCES
Fill Bands (Default: true): Use a background color inside the Bollinger Bands.
Show Signals (Default: true): Toggle the Bollinger Band upper band, lower band, and baseline signals.
Show Bollinger Bands (Default: true): Show the Bollinger Bands.
STOCHASTIC SETTINGS
Use Stochastic RSI Filtering (Default: False): This will only trigger some SELL signals when the stochastic RSI is above 80, and BUY signals when below 20.
K (Default: 3): The smoothing level for the Stochastic RSI.
RSI Length (Default: 14): The period length for the RSI calculation.
Stochastic Length (Default: 8): The period length over which the stochastic calculation is performed.
Calculations
Bollinger Bands are a technical analysis tool that are used to measure market volatility and identify overbought or oversold conditions in the trading of financial instruments, such as stocks, bonds, commodities, and currencies. Bollinger Bands consist of three lines plotted on a price chart:
Middle Band, Basis, or Baseline: This is typically a simple moving average (SMA) of the closing prices over a certain period. It represents the intermediate-term trend of the asset's price.
Upper Band: This is calculated by adding a certain number of standard deviations to the middle band (SMA). The upper band adjusts itself with the increase in volatility.
Lower Band: This is calculated by subtracting the same number of standard deviations from the middle band (SMA). Like the upper band, the lower band adjusts to changes in volatility.
The candle wick signals occur if the wick is at the specified ratio compared to either the entire candle or the candle body. The upper band, lower band, and baseline signals happen if the wick is the specified ratio of the total candle size. For the major signals for upper and lower bands, these occur when the wick extends outside of the bands while closing a candle inside of the bands. For the baseline signals, they occur if a wick crosses a baseline but closes on the other side.
Other Usage Notes and Limitations
To understand future price movement, this indicator assumes that 3 things must be known:
Evidence of a change of market structure. This can be demonstrated by increased volatility, consolidation, volume spikes (which can be tracked with the MW Volume Impulse Indicator) or, in the case of this indicator, candle wicks.
The potential cause of the change. It could be a VWAP line (which can be tracked with the Multi VWAP , and Multi VWAP from Gaps indicators), an event, an important support or resistance level, a key moving average, or many other things. This indicator assumes the ATR bands can be a cause.
The current position in the price cycle. Oscillators like the RSI, and MACD, are typical measures of price oscillation (other oscillators like the Price and Volume Stochastic Divergence indicator can also be useful). This indicator uses the Stochastic RSI oscillator to determine overbought and oversold conditions.
When evidence of the change appears, and the potential cause of the change is identified, and the price oscillation is at a favorable position for the desired trading direction, this indicator will generate a signal.
ATR Bands (or Keltner Channels) are used to determine when price might “revert to the mean”. Crossing, or being near the upper or lower band, can indicate an overbought or oversold condition, which could lead to a price reversal. By tracking the behavior of candle wicks during these events, we can see how active the battle is between buyers and sellers.
If the top of a wick is large, it may indicate that sellers are aggressively attempting to bring the price down. Conversely, if the bottom wick is large, it can indicate that buyers are actively trying to counter the price action caused by selling pressure.
When this wicking action occurs at times when price is not near the upper band, lower band, or baseline, it could indicate the presence of an important level. That could mean a nearby VWAP line, a supply or demand zone, a round price number, or a number of other factors. In any case, this wick may be the first indication of a price reversal.
Shorter baseline periods may be better for short period trading like scalping or day trading, while longer period baselines can show signals that are better suited to swing trading, or longer term investing.
It's important for traders to be aware of the limitations of any indicator and to use them as part of a broader, well-rounded trading strategy that includes risk management, fundamental analysis, and other tools that can help with reducing false signals, determining trend direction, and providing additional confirmation for a trade decision. Diversifying strategies and not relying solely on one type of indicator or analysis can help mitigate some of these risks.
The TradingView platform allows a maximum of 500 labels per chart. This means that if your settings allow for a lot of signals, labels for earlier ones may not appear if the total number of labels exceeds 500 for the chart.

Signal Architect Stop-Hunt !GC HOUR.1.12.2026 AM Signal Architect™ — Developer Note
These daily posts are intentional.
They are designed to help potential users visually observe consistency—not just in outcomes, but in process—across multiple futures products, market conditions, and timeframes, using the Stop Hunt Indicator alongside my proprietary Signal Architect™ framework.
The goal is simple:
To show how structure, behavior, and probability repeat—every day—despite a constantly changing market.
If you follow these posts over time, you will begin to recognize that:
• The same behaviors appear across different futures contracts
• The same reactions occur on multiple timeframes
• The same structural traps and stop events repeat regardless of volatility regime
That consistency is not coincidence.
Consistency is the signal.
Over time, that consistency should become familiar—
and familiarity should become your edge.
________________________________________
🧠 What You’re Seeing (And Why It Matters)
This indicator includes a limited visual preview of a proprietary power signal I have personally developed and refined across:
• Futures
• Algorithmic trading systems
• Options structure
• Equity market behavior
Every tool I release is built around one core principle:
Clarity of direction without over-promising or over-fitting.
That is why all Signal Architect™ tools emphasize:
• Market structure first
• High-probability directional context
• Clear, visual risk framing
• No predictive claims
• No curve-fit illusions
What you see publicly is not the full system—only controlled, educational previews meant to demonstrate how structure and probability align in real markets.
________________________________________
📊 Background & Scope
Over the years, I have personally developed 800+ programs, including:
• Equity systems
• Futures strategies
• Options structure tools
• Dividend & income frameworks
• Portfolio construction and allocation logic
This includes 40+ Nasdaq-100 trading bots, several operating under extremely strict rule-sets and controlled deployment conditions.
Nothing shared publicly represents my complete internal framework.
Public posts exist for education, observation, and pattern recognition—not signals, not advice, and not promises.
________________________________________
🤝 For Those Who Find Value
If these daily posts help you see the market more clearly:
• Follow, boost, and share my scripts, Ideas, and MINDS posts
• Feel free to message me directly with questions or build requests
• Constructive feedback and collaboration are always welcome
For traders who want to go deeper, optional memberships may include:
• Additional signal access
• Early previews
• Occasional free tools and upgrades
🔗 Membership & Signals:
trianchor.gumroad.com
________________________________________
⚠️ Final Note
Everything published publicly is educational and analytical only.
Markets carry risk.
Discipline, patience, and risk management always come first.
Watch the consistency.
Study the structure.
Let the market repeat itself.
— Signal Architect™
________________________________________
🔗 Personally Developed GPT Tools
• AuctionFlow GPT
chatgpt.com
• Signal Architect™ Gamma Desk – Market Intelligence
chatgpt.com
• Gamma Squeeze Watchtower™
chatgpt.com

Signal Architect Stop-Hunt !GC. 15 MIN. 1.12.2026 . AM SESSIONSignal Architect™ — Developer Note
These daily posts are intentional.
They are designed to help potential users visually observe consistency—not just in outcomes, but in process—across multiple futures products, market conditions, and timeframes, using the Stop Hunt Indicator alongside my proprietary Signal Architect™ framework.
The goal is simple:
To show how structure, behavior, and probability repeat—every day—despite a constantly changing market.
If you follow these posts over time, you will begin to recognize that:
• The same behaviors appear across different futures contracts
• The same reactions occur on multiple timeframes
• The same structural traps and stop events repeat regardless of volatility regime
That consistency is not coincidence.
Consistency is the signal.
Over time, that consistency should become familiar—
and familiarity should become your edge.
________________________________________
🧠 What You’re Seeing (And Why It Matters)
This indicator includes a limited visual preview of a proprietary power signal I have personally developed and refined across:
• Futures
• Algorithmic trading systems
• Options structure
• Equity market behavior
Every tool I release is built around one core principle:
Clarity of direction without over-promising or over-fitting.
That is why all Signal Architect™ tools emphasize:
• Market structure first
• High-probability directional context
• Clear, visual risk framing
• No predictive claims
• No curve-fit illusions
What you see publicly is not the full system—only controlled, educational previews meant to demonstrate how structure and probability align in real markets.
________________________________________
📊 Background & Scope
Over the years, I have personally developed 800+ programs, including:
• Equity systems
• Futures strategies
• Options structure tools
• Dividend & income frameworks
• Portfolio construction and allocation logic
This includes 40+ Nasdaq-100 trading bots, several operating under extremely strict rule-sets and controlled deployment conditions.
Nothing shared publicly represents my complete internal framework.
Public posts exist for education, observation, and pattern recognition—not signals, not advice, and not promises.
________________________________________
🤝 For Those Who Find Value
If these daily posts help you see the market more clearly:
• Follow, boost, and share my scripts, Ideas, and MINDS posts
• Feel free to message me directly with questions or build requests
• Constructive feedback and collaboration are always welcome
For traders who want to go deeper, optional memberships may include:
• Additional signal access
• Early previews
• Occasional free tools and upgrades
🔗 Membership & Signals:
trianchor.gumroad.com
________________________________________
⚠️ Final Note
Everything published publicly is educational and analytical only.
Markets carry risk.
Discipline, patience, and risk management always come first.
Watch the consistency.
Study the structure.
Let the market repeat itself.
— Signal Architect™
________________________________________
🔗 Personally Developed GPT Tools
• AuctionFlow GPT
chatgpt.com
• Signal Architect™ Gamma Desk – Market Intelligence
chatgpt.com
• Gamma Squeeze Watchtower™
chatgpt.com
