REVE Cohorts - Range Extension Volume Expansion CohortsREVE Cohorts stands for Range Extensions Volume Expansions Cohorts.
Volume is divided in four cohorts, these are depicted in the middle band with colors and histogram spikes.
0-80 percent i.e. low volumes; these get a green color and a narrow histogram bar
80-120 percent, normal volumes, these get a blue color and a narrow histogram bar
120-200 percent, high volume, these get an orange color and a wide histogram bar
200 and more percent is extreme volume, maroon color and wide bar.
All histogram bars have the same length. They point to the exact candle where the volume occurs.
Range is divided in two cohorts, these are depicted as candles above and below the middle band.
0-120 percent: small and normal range, depicted as single size, square candles
120 percent and more, wide range depicted as double size, rectangular candles.
The range candles are placed and colored according to the Advanced Price Algorithm (published script). If the trend is up, the candles are in the uptrend area, which is above the volume band, , downtrend candles below in the downtrend area. Dark blue candles depict a price movement which confirms the uptrend, these are of course in the uptrend area. In this area are also light red candles with a blue border, these depict a faltering price movement countering the uptrend. In the downtrend area, which is below the volume band, are red candles which depict a price movement confirming the downtrend and light blue candles with a red border depicting price movement countering the downtrend. A trend in the Advanced Price Algorithm is in equal to the direction of a simple moving average with the same lookback. The indicator has the same lagging.as this SMA.
Signals are placed in the vacated spaces, e.g. during an uptrend the downtrend area is vacated.
There are six signals, which arise as follows:
1 Two blue triangles up on top of each other: high or extreme volume in combination with wide range confirming uptrend. This indicates strong and effective up pressure in uptrend
2 Two pink tringles down on top of each other: high or extreme volume in combination with wide range down confirming downtrend. This indicates strong and effective down pressure in downtrend
3 Blue square above pink down triangle down: extreme volume in combination with wide range countering uptrend. This indicates a change of heart, down trend is imminent, e.g. during a reversal pattern. Down Pressure in uptrend
4 Pink square below blue triangle up: extreme volume in combination with wide range countering downtrend. This indicates a change of heart, reversal to uptrend is imminent. Up Pressure in downtrend
5 single blue square: a. extreme volume in combination with small range confirming uptrend, b. extreme volume in combination with small range countering downtrend, c. high volume in combination with wide range countering uptrend. This indicates halting upward price movement, occurs often at tops or during distribution periods. Unresolved pressure in uptrend
6 Single pink square: a extreme volume in combination with small range confirming downtrend, b extreme volume in combination with small range countering uptrend, c high volume in combination with wide range countering downtrend. This indicated halting downward price movement. Occurs often at bottoms or during accumulation periods. Unresolved pressure in downtrend.
The signals 5 and 6 are introduced to prevent flipping of signals into their opposite when the lookback is changed. Now signals may only change from unresolved in directional or vice versa. Signals 3 and 4 were introduced to make sure that all occurrences of extreme volume will result in a signal. Occurrences of wide volume only partly lead to a signal.
Use of REVE Cohorts.
This is the indicator for volume-range analyses that I always wanted to have. Now that I managed to create it, I put it in all my charts, it is often the first part I look at, In my momentum investment system I use it primarily in the layout for following open positions. It helps me a lot to decide whether to close or hold a position. The advantage over my previous attempts to create a REVE indicator (published scripts), is that this version is concise because it reports and classifies all possible volumes and ranges, you see periods of drying out of volume, sequences of falter candles, occurrences of high morning volume, warning and confirming signals.. The assessment by script whether some volume should be considered low, normal, high or extreme gives an edge over using the standard volume bars.
Settings of REVE Cohorts
The default setting for lookback is ‘script sets lookback’ I put this in my indicators because I want them harmonized, the script sets lookback according to timeframe. The tooltip informs which lookback will be set at which timeframe, you can enable a feedback label to show the current lookback. If you switch ‘script sets lookback’ off, you can set your own preferred user lookback. The script self-adapts its settings in such a way that it will show up from the very first bar of historical chart data, it adds volume starting at the fourth bar.
You can switch off volume cohorts, only range candles will show while the middle band disappears. Signals will remain if volume is present in the data. Some Instruments have no volume data, e.g. SPX-S&P 500 Index,, then only range candles will be shown.
Colors can be adapted in the inputs. Because the script calculates matching colors with more transparency it is advised to use 100 percent opacity in these settings.
Take care, Eykpunter
Cerca negli script per "signal"

Breaker Blocks with Signals [LuxAlgo]The Breaker Blocks with Signals indicator aims to highlight a complete methodology based on breaker blocks. Breakout signals between the price and breaker blocks are highlighted and premium/discount swing levels are included to provide potential take profit/stop loss levels.
This script also includes alerts for each signal highlighted.
🔶 SETTINGS
🔹 Breaker Blocks
Length: Sensitivity of the detected swings used to construct breaker blocks. Higher values will return longer term breaker blocks.
Use only candle body: Only use the candle body when determining the maximum/minimum extremities of the order blocks.
Use 2 candles instead of 1: Use two candles to confirm the occurrence of a breaker block.
Stop at first break of center line: Do not highlight breakout signals after invalidation until reset.
🔹 PD Array
Only when E is in premium/discount zone: Only set breaker block if point E of wave ABCDE is within the corresponding zone.
Show premium discount zone: Show premium/discount zone.
Highlight Swing Break: Highlight occurrences of price breaking a previous swing level.
Show Swings/PD Arrays: Show swing levels/labels and pd areas.
🔶 USAGE
The Breaker Blocks with Signals indicator aims to provide users with a minimalistic display alongside optimal signals to be aware of for finding trade setups as shown below.
Here we can see a MSS occurred allowing the indicator to detect a Breaker Block (-BB) & display a red arrow to confirm this signal.
The signal(s) that can be used for potential entries are only during retests of the breaker blocks.
A potential strategy traders could use with this indicator is to target the corresponding Discount PD Arrays detected (for a short position) and Premium PD Arrays (for a long position).
In the image above we can see price generated the potential entry signals in orange & fell to the Discount PD Arrays as a logical setup to look for with this indicator.
As we can see in the image above, signals can be considered invalid when price closes above the 50% level in which it would be suggested to wait for another setup.
Users still looking for more potential setups based on the same breaker block can disable the "Stop at first break of center line" setting within the settings menu.
In the image above we can see a bullish example whereas price confirmed a bullish breaker block (+BB), had a quick pullback into it that was confirmed by the green arrow, and then reached the Premium PD Arrays.
While retests of breaker blocks can still function well if they occur later in the price action, it's most preferable for users to look for entry signals that are near confirmed breaker blocks (5-10 bars) opposed to waiting 20+ bars.
Additional take profits based on the occurence of the breaker blocks are given in order to provide targets after the occurence of a breaker block breakout.
🔶 DETAILS
Breaker blocks are formed after a mitigated order block, these can provide change of polarity opportunities, thus playing a role as a potential support/resistance. It is the re-test/retrace of price to a breaker block that will set the conditions to provide signals.
The above chart describes the creation of a breaker block.
The signal generation logic makes use of various rules described below:
Bullish Breaker Blocks:
opening price is within the breaker block, while the closing price is above the upper extremity of the breaker block.
Price did not cross the breaker block average in the interval since the previous breakout.
Bearish Breaker Blocks:
opening price is within the breaker block, while the closing price is below the lower extremity of the breaker block.
Price did not cross the breaker block average in the interval since the previous breakout.
When a new pattern is formed, all previous drawings are removed.
🔶 RELATED SCRIPTS

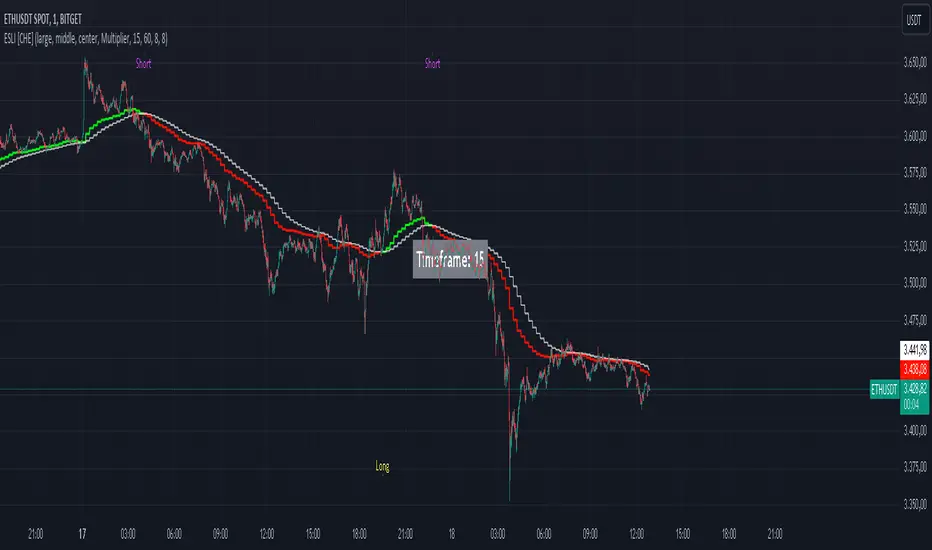
Ema Short Long Indicator[CHE]█ CONCEPTS
This Pine Script is an EMA Short Long indicator that displays the crossing EMA lines on the chart. The indicator uses three exponential moving averages (EMAs) to generate the buy and sell signals. The EMA lines are plotted as green (uptrend) and red (downtrend) lines. When the green line is above the white signal line, the indicator generates a buy signal, when the green line is below the white signal line, the indicator generates a sell signal. Arrows are also displayed marking the buy and sell signals. There is also an option to allow indicator repainting or not. Finally, users can also set alerts to be alerted to potential trading opportunities.
Note: please do not disable "time frame gaps". Allows to calculate the indicator on a Timeframe (TF) different from that of the chart Time window. The TF should ideally be higher than the charts to provide a broader perspective than
the TF of the chart. Using TFs lower than the chart's will deliver fragmentary results, since only the last value of intrabar is displayed (multiple values cannot be displayed for a single chart bar). The Gaps setting determines the behavior when the TF is higher than the TF of the chart. If 'gaps' is checked, higher TF values only come in and are interconnected on the diagram when the higher TF completed. This has the advantage of avoidance Real-time epainting. If Gaps is not enabled, Gaps are filled with the last higher TF value calculated, which will not produce a repaint Values on historical bars but repaint values realtime.
█ HOW TO USE IT
Load the indicator on an active chart (see the Help Center if you don't know how).
Time period
By default, the script uses an auto-stepping mechanism to adjust the time period of its moving window to the chart's timeframe. The following table shows chart timeframes and the corresponding time period used by the script. When the chart's timeframe is less than or equal to the timeframe in the first column, the second column's time period is used to calculate the Ema Short Long Indicator :
Chart Time
timeframe period
1min 🠆 1H
5min 🠆 4H
1H 🠆 1D
4H 🠆 3D
12H 🠆 1W
1D 🠆 1M
1W 🠆 3M
█ DESCRIPTION
The script begins by setting up the chart indicator with a short title, "ESLI", and enabling it as an overlay. It then initializes several variables for time conversions, to be used later in the script.
The timeStep_translate() function converts the timeframe of the chart into a string representing a larger time interval, based on the number of seconds in the timeframe. The resulting string is used to label the horizontal axis of the chart.
Next, the script defines several input variables that can be modified by the user. These include the colors of the EMA lines and the signals, whether or not the indicator is allowed to repaint (i.e. update past values based on future data), and the number of periods used to calculate the EMA and signal lines.
The f_security() function calls the request.security() function to fetch data from the specified security and timeframe, and is used to calculate the EMA and signal lines using the ta.ema() function. The clo variable is assigned the closing price data, adjusted for repainting and timeframe.
The EMA line is calculated using a weighted average of the EMA over the specified period and two times that period, as well as three times that period, divided by six. The signal line is calculated as the EMA of the EMA line over the specified period.
The col_css variable sets the color of the EMA line based on whether it is currently above or below the signal line. The script then plots the EMA and signal lines, and uses the plotshape() function to indicate long and short signals based on the crossovers and crossunders of the EMA and signal lines.
Finally, the script sets up alert conditions using the alertcondition() function to notify the user when a long or short signal is generated, including information about the symbol and closing price.
█ SPECIAL THANKS
Special thanks to LOXX, I wanted to take a moment to express my gratitude for his valuable input in the EMA calculation. His insights and expertise have greatly helped me in improving my Pine Script coding skills. Thanks to his suggestion, I was able to better understand the EMA formula and implement it effectively in my script.
Your generosity in sharing your knowledge and experience is truly appreciated. It is through collaboration and exchanging ideas that we can all grow and become better in our craft.
This script provides exact signals that, with suitable additional indicators, provide very good results.
Best regards
Chervolino
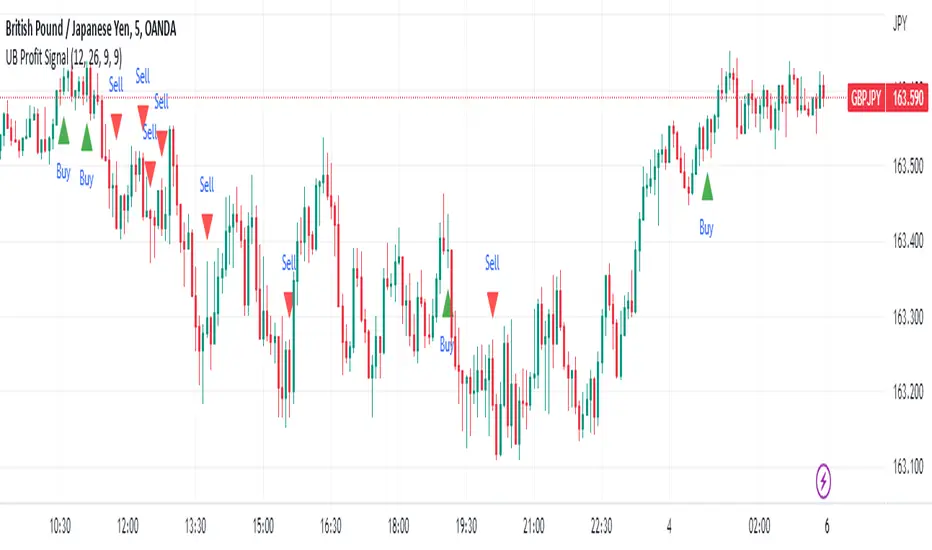
UB Profit Signal IndicatorThe UB Profit Signal indicator is a technical analysis tool designed to identify potential buy and sell signals in the market. The indicator is based on four technical indicators - Moving Average Convergence Divergence (MACD), Relative Strength Index (RSI), Bollinger Bands (BB), and volume moving average.
The script starts by defining input variables such as MACD Fast Length, MACD Slow Length, MACD Signal Length, RSI Length, etc. These variables are used to customize the indicator based on the user's preference.
The MACD is calculated using the ta.macd function, which returns three variables: the MACD Line, Signal Line, and Histogram. The MACD line is calculated as the difference between two exponential moving averages of the price. The signal line is a moving average of the MACD line. The histogram shows the difference between the MACD line and the signal line.
The RSI is calculated using the ta.rsi function, which calculates the RSI value based on the number of periods specified in the RSI Length input variable. The RSI is a momentum oscillator that measures the speed and change of price movements.
The Bollinger Bands are calculated using the ta.sma and ta.stdev functions. The Simple Moving Average (SMA) is calculated using the close price over 21 periods, while the Standard Deviation is calculated using the close price over the same 21 periods. The upper and lower bands are then calculated based on the SMA and Standard Deviation.
Finally, the buy and sell signals are generated based on specific conditions that combine the MACD, RSI, and BB values. For example, a buy signal is generated when the RSI value is greater than 30, the volume is greater than the volume moving average, the close price is greater than the 9-period SMA, and the close price is between the upper and lower BBs. Similarly, a sell signal is generated when the RSI value is less than 40, the volume is greater than the volume moving average, the close price is less than the 9-period SMA, and the close price is between the upper and lower BBs.
The buy and sell signals are plotted on the chart using the plotshape function, which creates triangular shapes above and below the bars to indicate the signals. Green triangles indicate a buy signal, while red triangles indicate a sell signal. Overall, the UB Profit Signal indicator can be useful for traders looking to identify potential buy and sell signals in the market and take advantage of price movements.
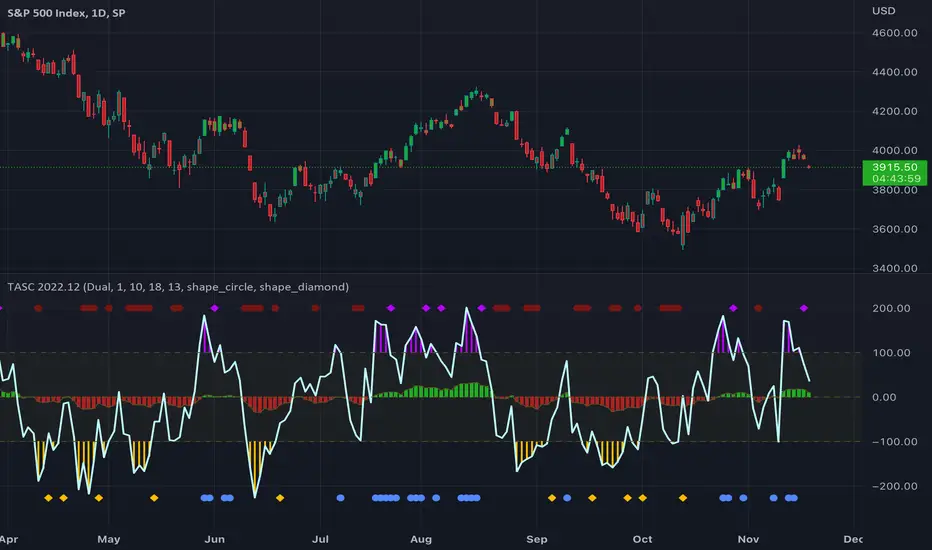
TASC 2022.12 Short-Term Continuation And Reversal Signals█ OVERVIEW
TASC's December 2022 edition Traders' Tips includes an article by Barbara Star titled "Short-Term Continuation And Reversal Signals". This is the code that implements the concepts presented in this publication.
█ CONCEPTS
The article takes two classic indicators, the Commodity Channel Index (CCI) and the Directional Movement Indicator (DMI), makes changes to the traditional ways of visualizing their readings, and uses them together to generate potential signals. The author first discusses the benefits of converting the DMI indicator to an oscillator format by subtracting the −DI from the +DI, which is then displayed as a histogram. Next, the author shows how the use of an on-chart visual framework (i.e., choosing the line style and color, coloring price bars, etc.) can help traders interpret the signals produced the considered pair of indicators.
█ CALCULATIONS
The article offers the following signals based on the readings of the DMI and CCI pair, suitable for several types of trades:
• Short-term trend change signals:
A DMI oscillator above zero indicates that prices are in an uptrend. A DMI oscillator below the zero line and falling means that selling pressure is dominating and price is trending down. The sign of the DMI oscillator is indicated by the color of the price bars (which correlates with the color of the DMI histogram). Namely, green, red and grey price bars correspond to the DMI oscillator above, below and equal to zero . Colored price bars and the DMI oscillator make it easy for trend traders to recognize changes in short-term trends.
• Trend continuation signals:
Blue circles appear near the bottom of the oscillator chart border when the DMI is above the zero line and the price is above its simple moving average in an uptrend . Dark red circles appear near the top of the chart in a downtrend when the DMI oscillator is below its zero line and below the 18-period moving average. Trend continuation signals are useful for those looking to add to existing positions, as well as for traders waiting for a pullback after a trend has started.
• Reversal signals:
The CCI signals a reversal to the downside when it breaks out of its +100 and then returns at some point, crossing below the +100 level. This is indicated by a magenta-colored diamond shape near the top the chart. The CCI signals a reversal to the upside when it moves below its −100 level and then at some point comes back to cross above the −100 level. This is indicated by a yellow diamond near the bottom of the chart. Reversal signals offer short-term rallies for countertrend traders as well as for swing traders looking for longer-term moves using the interplay between continuation and reversal signals.
(JS) Checklist SignalsWhat if I told you that you could use over 10 indicators at once without having a single one of them on you chart? Enter the Checklist Signals. This is probably the most complex yet simple indicator I've ever done.
What you get is 6 rows (if you want them all) of labels that hover at the top of your screen with a ton of extremely useful information. I will go down the list of options in the indicator settings and explain how it all works.
So the label placement is based on ATR. You choose your X Axis and Y Axis starting point then adjust the lookback period. Default lookback is 600 bars. What that means is, the indicator finds the highest high in the last 600 bars, then begins to place the labels above that zone based on the ATR of the chart. Different timeframes require very different combinations so it's all customizable. Sometimes if labels overlap you need to adjust the X Axis starting point, or the spread on either axis.
The next set of options allows you to decide what you'd prefer to be set on or off. Let's start with ATR and VWAP. I have added bands for both of these. When price is below the mean (which is the 21 ema by default), then the labels show you the next 5 standard deviations of ATR going down. When under one of these levels the label turns red. The opposite is true when above the mean and in those instances the labels will be green. It is the same with the VWAP, though instead of using the mean we use the daily VWAP as the starting point. If you choose to have levels switched on then you can see the actual values of each standard deviation level. Down lower in the options you can change the resolution and source used for VWAP.
The next option is "Trending". This creates a moving average using the length of the Trending Lookback Period (default is 5) and then tells you using arrows in the label which direction the trend of the indicator is going.
The next area let's you specify the information you receive in the Squeeze labels. By default all options are one - and this tells you if there's a Squeeze, what type of Squeeze there is, and how many bars the Squeeze has been building up or since it fired. These labels are color coded to correspond with the Squeeze type as well.
Then we get to another one of my indicators, the Ballista. One of the main signals is the "Inverted Squeeze" where the short term momentum inverts against the long term momentum. Here I have the distance between the two oscillators in the first label, and then the second label tells you if there's an Inverted Squeeze signal, if there's potential entry, confirmed entry, or how many bars its been since the last entry signal.
The next feature is off by default, but it will add arrows to your chart based on a simple lower highs and higher lows signals. Turning arrows on will place them right on your chart above or below each bar.
The rest of it is customizable settings of all the other indicators that are shown. Now looking at the labels themselves, starting in the top left corner:
First Row-
ADX + DMI: These labels show the ADX, DI+, & DI- values in each label. Whenever the DI+ or DI- is above the other then their respective label will light up. Also, when the ADX is above 20 (confirming the trend) it lights up in the same color as well.
Squeeze: I described how this worked above, the labels tell you if there's a Squeeze, how long there's been one, and how long since it fired, all while also changing to color of the associated Squeeze type.
Second Row -
Stacked EMAs: The top label looks at the EMA values using the numbers of the Fibonacci sequence. It looks at the EMA 8, 21, 34, 55, 89, & 233 and tells you if they're all stacked in the same direction (Stacked Bear meaning they're all crossed down in order, Stacked Bull meaning they're all crossed up in order). If the EMAs are all stacked but 1 or 2 it will say Stacked -1 or Stacked -2. When they're all over the place it will say they aren't stacked at all.
BB%: This tells you the value of the Bollinger Band %. If this is negative then you know that price is currently below the lower Bollinger Band, and if it is above 100% it is above the upper Bollinger Band.
RSI: This tells you the value of the RSI and the label changes colors based on the value.
Stoch: This tells you the Stochastic value and changes colors based on the value, same as the RSI.
Third Row -
The Mean: This tells you the numerical value of whatever you have the mean set as (21 ema by default). The label changes colors based on price being above or below the mean.
One ATR: This was something I added for those looking to plan their trades out. This tells you the value of one ATR so you can have a better idea of how to plan your trades based on this distance.
VIX: This tells you the current value of the VIX, and color changes based on being green or red on the day.
Ballista: I explained this above, it tells you the distance between the two oscillators and changes colors based on the trend being above or below 0. When there's an Inverted Squeeze this label is gray.
Inverted Squeeze: This label tells you if there's an inverted squeeze as well as if it is showing an entry or how many bars since the last entry signal. This label turns fuchsia on a bear signal and lime on a bull signal.
Fourth Row -
ATR Bands: As I explained above, this plots each standard deviation using ATR and changes colors based on price's relationship to each one.
Fifth Row -
VWAP: The three labels here show the daily, weekly, and monthly VWAP values, and color changes based on price's relationship to each one.
Sixth Row -
VWAP Bands: These are the standard deviation levels of the VWAP resolution of your choosing (as explained above), and just as the others, colors change based on price's relationship to each one.
I thought this was a really cool indicator that could be used for people like me who like knowing the right information, but HATE having their charts clustered with a ton of stuff. Hope you all like it, enjoy!

Momentum 2.0 [AstrideUnicorn]Momentum 2.0 is a normalized Momentum oscillator with a moving base-level. The oscillator value is normalized by its standard deviation, similar to the z-score technique. Instead of the zero level, the indicator uses the base-level calculated as the inverted long-term average value of the oscillator. Similar to the zero-level crossing signal used for the Momentum oscillator, our oscillator calculates the base level crossing signal.
The moving base-level helps to reduce the number of false signals. In an uptrend the base-level is below zero, in a downtrend it is above it. This allows us to take into account the trend stability effect. In this case, to form a reversal signal, the oscillator must cross a lower value in an uptrend and a higher value in a downtrend.
HOW TO USE
When the oscillator crosses above the base-level, it gives a bullish signal, when below it gives a bearish signal. The signals are displayed as green and red labels, respectively.
The color of the histogram shows the current direction of the price momentum. Green indicates an upward move and red indicates a downward move. The blue line represents the base-level.
SETTINGS
Oscillator Period - determines the period of the Momentum oscillator
Base Level Period - determines the period used for long-term averaging when calculating the base-level and normalizing the oscillator

72s Strat: Backtesting Adaptive HMA+ pt.1This is a follow up to my previous publication of Adaptive HMA+ few months ago, as a mean to provide some kind of initial backtesting tools. Which can be use to explore many possible strategies, optimise its settings to better conform user's pair/tf, and hopefully able to help tweaking your general strategy.
If you haven't read the study or use the indicator, kindly go here first to get the overall idea.
The first strategy introduce in this backtest is one most basic already described in the study; buy/sell is when movement is there and everything is on the right side; When RSI has turned to other side, we can use it as exit point (if in profit of course, else just let it hit our TP/SL, why would we exit before profit). Also, base on RSI when we make entry, we can further differentiate type of signals. --Please check all comments in code directly where the signals , entries , and exits section are.
Second additional strategy to check; is when we also use second faster Adaptive HMA+ for exit. So this is like a double orders on a signal but with different exit-rule (/more on this on snapshots below). Alternatively, you can also work the code so to only use this type of exit.
There's also an additional feature which you can enable its visuals, the Distance Zone , is to help measuring price distance to our xHMA+. It's just a simple atr based envelope really, I already put the sample code in study's comment section, but better gonna update it there directly for non-coder too, after this.
In this sample I use Lot for order quantity size just because that's what I use on my broker. Also what few friends use while we forward-testing it since the study is published, so we also checked/compared each profit/loss report by real number. To use default or other unit of measurement, change the entry code accordingly.
If you change your order size, you should also change the commission in Properties Tab. My broker commission is 5 USD per order/lot, so in there with example order size 0.1 lot I put commission 0.5$ per order (I'll put 2.5$ for 0.5 lot, 10$ for 2 lot, and so on). Crypto usually has higher charge. --It is important that you should fill it base on your broker.
SETTINGS
I'm trying to keep it short. Please explore it further again. (Beginner should also first get acquaintance with terms use here.)
ORDERS:
Base Minimum Profit Before Exit:
The number is multiplier of ongoing ATR. Means that when basic exit condition is met, algo will check whether you're already in minimum profit or not, if not, let it still run to TP or SL, or until it meets subsequent exit condition, then it will check again.
Default Target Profit:
Multiplier of ATR at signal. If reached before any eligible exit condition is met, exit TP.
Base StopLoss Point:
You can change directly in code to use other like ATR Trailing SL, fix percent SL, or whatever. In the sample, 4 options provided.
Maximum StopLoss:
This is like a safety-net, that if at some point your chosen SL point from input above happens to be exceeding this maximum input that you can tolerate, then this max point is the one will be use as SL.
Activate 2nd order...:
The additional doubling of certain buy/sell with different exits as described above. If enable, you should also set pyramiding to at least: 2. If not, it does nothing.
ADAPTIVE HMA+ PERIOD
Many users already have their own settings for these. So in here I only sample the default as first presented in the study. Make it to your adaptive.
MARKET MOVEMENT
(1) Now you can check in realtime how much slope degree is best to define your specific pair/tf is out of congestion (yellow) area. And (2) also able to check directly what ATR lengths are more suitable defining your pair's volatility.
DISTANCE ZONE
Distance Multiplier. Each pair/tf has its own best distance zone (in xHMA+ perspective). The zone also determine whether a signal should appear or not. (Or what type of signal, if you wanna go more detail in constructing your strategy)
USAGE
(Provided you already have your own comfortable settings for minimum-maximum period of Adaptive HMA+. Best if you already have backtested it manually too and/or apply as an add-on to your working strategy)
1. In our experiences, first most important to define is both elements in the Market Movement Settings . These also tend to be persistent for whole season since it's kinda describing that pair/tf overall behaviour. Don't worry if you still get a low Profit Factor here, but by tweaking you should start to see positive changes in one of Max Drawdown and Net Profit, or Percent Profitable.
2. Afterwards, find your pair/tf Distance Zone . When optimising this, what we seek is just a "not to bad" equity curves to start forming. At least Max Drawdown should lessen more. Doesn't have to be great already, but should be better, no red in Net Profit.
3. Then go manage the "Trailing Minimum Profit", TP, SL, and max SL.
4. Repeat 1,2,3. 👻
5. Manage order size, commission, and/or enable double-order (need pyramiding) if you like. Check if your equity can handle max drawdown before margin call.
6. After getting an acceptable backtest result, go to List of Trades tab and find the biggest loss or when many sequencing loss in a row happened. Click on it to go to exact point on chart, observe why the signal failed and get at least general idea how it can be prevented . The rest is yours, you should know your pair/tf more than other.
You can also re-explore your minimum-maximum period for both Major and minor xHMA+.
Keep in mind that all numbers in Setting are conceptually in a form of range . You don't want to get superb equity curves but actually a "fragile" , means one can easily turn it to disaster just by changing only a fraction in one/two of the setting.
---
If you just wanna test the strength of the indicator alone, you can disable "Use StopLoss" temporarily while optimising settings.
Using no SL might be tempting in overall result data in some cases, but NOTE: It is not recommended to not using SL, don't forget that we deliberately enter when it's in high volatility. If want to add flexibility or trading for long-term, just maximise your SL. ie.: chose SL Point>ATR only and set it maximum. (Check your max drawdown after this).
I think this is quite important specially for beginners, so here's an example; Hypothetically in below scenario, because of some settings, the buy order after the loss sell signal didn't appear. Let's say if our initial capital only 1000$ using leverage and order size 0,5 lot (risky position sizing already), moreover if this happens at the beginning of your trading season, that's half of account gone already in one trade . Your max SL should've made you exit after that pumping bar.
The Trailing Minimum Profit is actually look like this. Search in the code if you want to plot it. I just don't like too many lines on chart.
To maximise profit we can try enabling double-order. The only added rule coded is: RSI should rising when buy and falling when sell. 2nd signal will appears above or below default buy/sell signal. (Of course it's also prone to double-loss, re-check your max drawdown after. Profit factor play its part in here for a long run). Snapshot in comparison:
Two default sell signals on left closed at RSI exit, the additional sell signal closed later on when price crossover minor xHMA+. On buy side, price haven't met our minimum profit when first crossunder minor xHMA+. If later on we hit SL on this "+buy" signal, at least we already profited from default buy signal. You can also consider/treat this as multiple TP points.
For longer-term trading, what you need to maximise is the Minimum Profit , so it won't exit whenever an exit condition happened, it can happen several times before reaching minimum profit. Hopefully this snapshot can explain:
Notice in comparison default sell and buy signal now close in average after 3 days. What's best is when we also have confirmation from higher TF. It's like targeting higher TF by entering from smaller TF.
As also mention in the study, we can still experiment via original HMA by putting same value for minimum-maximum period setting. This is experimental EU 1H with Major xHMA+: 144-144, Flat market 13, Distance multiplier 3.6, with 2nd order activated.
Kiwi was a bit surprising for me. It's flat market is effectively below 6, with quite far distance zone of 3.5. Probably because I'm using big numbers in adaptive period.
---
The result you see in strategy tester report below for EURUSD 15m is using just default settings you see in code, as follow:
0,1 lot for each order (which is the smallest allowed by my broker).
No pyramiding. Commission: 0.5 usd per order. Slippage: 3
Opening position is only using basic strategy #1 (RSI exit). Additional exit not activated.
Minimum Profit: 1. TP: 3.
SL use: Half-distance zone. Max SL: 4.5.
Major xHMA+: 172-233. minor xHMA+: 89-121
Distance Zone Multiplier: 2.7
RSI: Standard 14.
(From our forward-testing, the difference we get from net profit is because of the spread, our entry isn't exactly at the close/open price. Not so much though, but not the same. If somebody can direct me to any example where we can code our entry via current bid/ask price, that would be awesome!)
It's already a long post (sorry), think I'm gonna pause here. Check out the code :)
---
DISCLAIMER: Past performance is no guarantee of future results , and so on.. you know the drill ;)
Please read whole description first before using, don't take 1-2 paragraph and claim it's the whole logic, you are responsible of your own actions and understanding.

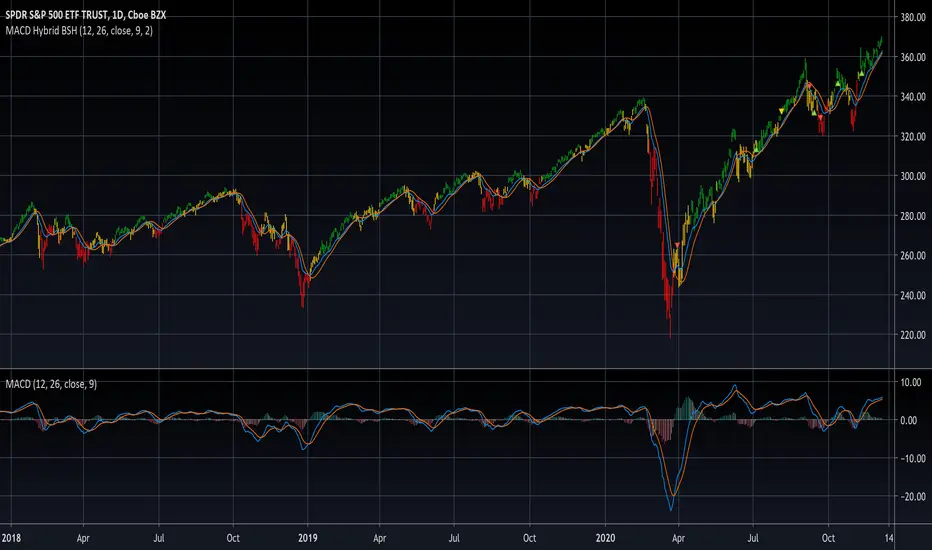
MACD Hybrid BSHMACD = Moving Average Convergence and Divergence
Hybrid = Combining the two main MACD signals into one indicator
BSH = Buy Sell Hold
This indicator looks for a crossover of the MACD moving averages (12ema and 26ema) in order to generate a buy/sell signal and a crossover of the MACD line (12ema minus 26ema) and MACD signal line (9ema of MACD line) in order to generate a completely seperate buy/sell signal. The two buy/sell signals are combined into a hybrid buy/sell/hold indicator which looks for one, neither, or both signals to be "buys." If both signals are buys (fast crossed above slow), a "buy" signal is given (green bar color). If only one signal is a buy, a "hold" signal is given (yellow bar color). If neither signal is a buy, a "sell" signal is given (red bar color). Note: MACD moving averages crossing over is the same thing as the MACD line crossing the zero level in the MACD indicator.
It makes sense to have the MACD indicator loaded as a reference when using this but it isn't required. The lines plotted on the chart are the 12ema and a signal line which is the MACD signal line shown relative to the 12ema rather than the MACD line. The 26ema is not plotted on the chart because the chart becomes cluttered, plus the moving averages crossing over is indicated with the MACD indicator.
This indicator should be used with other indicators such as ATR (1), RSI (14), Bollinger bands (20, 2), etc. in order to determine the best course of action when a signal is given. One way to use this as a strict system is to take a neutral cash position when a yellow "hold" signal is given, to go long when a
green "buy" signal is given, and to go short when a red "sell" signal is given. It can be observed that for many tickers and timeframes that green-yellow-green and red-yellow-red sequences are stronger signals than green-yellow-red and red-yellow-green signals.
Note: Chart type must be "bars" in order for the bar colorization to work properly
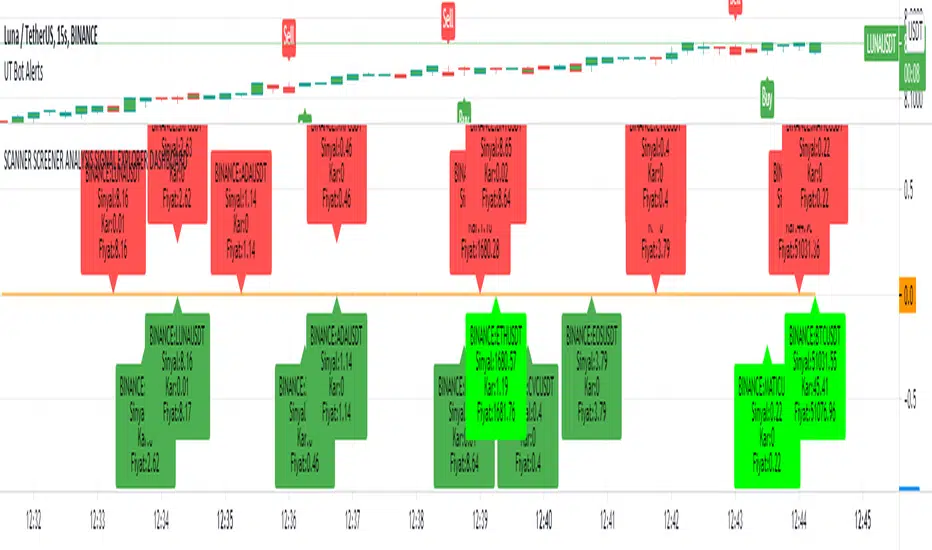
SCANNER SCREENER ANALYSIS SIGNAL EXPLORER DASHBOARDNew Buy signal: light green color
New Sell signal: light red color
Bullish dark green condition
Brearish dark red condition
Set your trend strategy in settings.
You can watch 20 pair in one indicator. Add more indicator panel and move same window and watch more signals in the same window. Set X axis cordinates 0-25-50-75-100-125-150-175-200 etc.for not overlap
You can add your favorite stocks, fx, crypto and analys for buy and sell signal.
When change the time frame new signal show on your selected time frame
it shows profit and signal price.
Look and review my other amazing indicator. It is best on TVs.
For Access and try my other best quality indicators till 7 days, message me. You can monthly subscribe my scripts my google play app on my profile or sent (30 USD) btc my bitcoin adress.
MAC-Z & MACD Leader signal [ChuckBanger]This is a combination of my MACD Leader script and MAC-Z with option to add Laguerre filter. The advantage of the MAC-Z over MACD is that it is a more accurate and “assumption-free” indicator that can more accurately describe how a market actually perform. But you can use this as a regular MACD indicator.
Crossovers signals
The MAC-Z line and signal line can be utilized in the same way as a stochastic oscillator, with the crossover between the two lines providing buy and sell signals. As with most crossover strategies, a buy signal comes when the shorter-term, more reactive line – in this case the MAC-Z line (blue line) crosses above the slower signal line (orange line). For example, when the MAC-Z line crosses below the signal line it provides a bearish sell signal.
Zero line crossing
The zero cross strategy is based on either of the lines crossing the zero line. If the MAC-Z crosses the zero line from below, it is a signal for a possible new uptrend, while the MAC-Z crossing from above is a signal that a new downtrend may be starting. This is special powerful if the lines has a fast up or down movement but the price action doesn't reflect that movement.
Divergences
Bearish and bullish divergences is my favorite signals. When price action and oscillators follow the same path it is called Convergences, when they don’t, it’s called a Divergence. Don't confuse the two because they have not the same meaning. But be aware that for example during consolidation or low liquidity, some small divergences between price and indicators might form, but that doesn't mean we should consider them as real divergences.
There is many different types of divergences. It is easier to show a picture then explaining it so I recommend you to check out the link below. Especially the top image. It sums this up very well
medium.com
MACD Leader
The MACD leader is only showing the crossing of MACD as a vertical line
Green vertical line = MACD Leader Bullish Cross
Red vertical line = MACD Leader Bearish Cross
MACD Leader:
MAC-Z:
More Information
cssanalytics.wordpress.com
en.wikipedia.org
drive.google.com

Scout Regiment - Signal📊 中文版
指标简介
Buy/Sell Signal 多维度交易信号指标
这是一个结合了EMA趋势过滤、CCI动量指标和RSI背景环境的多维度交易信号系统。通过三重过滤机制,帮助交易者在合适的市场环境中捕捉高质量的买卖信号。
核心特点
✅ 趋势过滤:使用233周期EMA确保顺势交易
✅ 动量确认:CCI(33)穿越信号作为入场触发
✅ 背景过滤:RSI(13)环境判断,避免同一背景重复信号
✅ 智能去重:每个RSI背景周期内只标记首次信号
✅ 清晰标识:三角形标记配合颜色区分买卖方向
使用说明
信号逻辑:
做多信号 (Buy):
收盘价 > EMA233(确认上升趋势)
CCI33向上穿越20(动量转强)
情况1:在RSI红色背景中首次出现
情况2:在RSI绿色背景中出现
做空信号 (Sell):
收盘价 < EMA233(确认下降趋势)
CCI33向下穿越80(动量转弱)
情况1:在RSI绿色背景中首次出现
情况2:在RSI红色背景中出现
参数设置
EMA过滤长度:默认233,用于判断主趋势方向
CCI长度:默认33,控制动量指标灵敏度
RSI长度:默认13,用于背景环境判断
重要提示
⚠️ 信号出现后不要立即下单!请务必检查:
CCI中期是否出现"浪子回头"形态
OBV成交量状态是否配合
RSI是否成功穿越50中线
结合其他技术分析工具综合判断
💡 建议配合使用:
支撑阻力位分析
成交量指标(如OBV)
更大周期的趋势确认
📈 English Version
Indicator Overview
Buy/Sell Signal - Multi-Dimensional Trading Signal System
This is a comprehensive trading signal system that combines EMA trend filtering, CCI momentum indicator, and RSI background environment. Through a triple-layer filtering mechanism, it helps traders capture high-quality buy and sell signals in appropriate market conditions.
Key Features
✅ Trend Filter: 233-period EMA ensures trend-following trades
✅ Momentum Confirmation: CCI(33) crossover signals as entry triggers
✅ Background Filter: RSI(13) environment detection to avoid duplicate signals
✅ Smart Deduplication: Only first signal per RSI background cycle
✅ Clear Visualization: Triangle markers with color-coded direction
How to Use
Signal Logic:
Buy Signal:
Close > EMA233 (confirms uptrend)
CCI33 crosses above 20 (momentum strengthens)
Case 1: First occurrence in RSI red background
Case 2: Occurs in RSI green background
Sell Signal:
Close < EMA233 (confirms downtrend)
CCI33 crosses below 80 (momentum weakens)
Case 1: First occurrence in RSI green background
Case 2: Occurs in RSI red background
Parameter Settings
EMA Filter Length: Default 233, for main trend direction
CCI Length: Default 33, controls momentum sensitivity
RSI Length: Default 13, for background environment detection
Important Notes
⚠️ DO NOT enter trades immediately after signal appears! Always check:
Whether CCI shows a "reversal" pattern in medium-term
OBV volume status confirmation
Whether RSI successfully crosses the 50 midline
Combine with other technical analysis tools
💡 Recommended to Use With:
Support/Resistance analysis
Volume indicators (such as OBV)
Higher timeframe trend confirmation
Risk Disclaimer
This indicator is for reference only and does not constitute investment advice. Trading involves risk. Please conduct thorough analysis and use proper risk management before making any trading decisions.
适合交易者类型 / Suitable For:
波段交易者 / Swing Traders
日内交易者 / Day Traders
趋势跟踪者 / Trend Followers
适用市场 / Applicable Markets:
股票 / Stocks
外汇 / Forex
加密货币 / Crypto
期货 / Futures

FluxPulse Momentum [JOAT]FluxPulse Momentum - Adaptive Multi-Component Oscillator
FluxPulse Momentum is a composite oscillator that blends three distinct momentum components into a single, smoothed signal line. Rather than relying on a single indicator, it synthesizes adaptive RSI, normalized rate of change, and a Kaufman-style efficiency ratio to provide a multi-dimensional view of momentum.
What This Indicator Does
Combines RSI, Rate of Change (ROC), and Efficiency Ratio into one weighted composite
Applies EMA smoothing to reduce noise while preserving responsiveness
Displays overbought/oversold zones with optional background highlighting
Generates buy/sell signals when the oscillator crosses its signal line in favorable zones
Provides a real-time dashboard showing current state, momentum direction, and efficiency
Core Components
Adaptive RSI (50% weight) — Standard RSI calculation normalized around the 50 level
Normalized ROC (30% weight) — Rate of change scaled relative to its recent maximum range
Efficiency Ratio (20% weight) — Measures directional movement efficiency, inspired by Kaufman's adaptive concepts
The final composite is smoothed twice using EMA to create both a fast line and a signal line.
Signal Logic
// Buy signal: crossover in lower half
buySignal = ta.crossover(qmo, qmoSmooth) and qmo < 50
// Sell signal: crossunder in upper half
sellSignal = ta.crossunder(qmo, qmoSmooth) and qmo > 50
Signals are generated only when the oscillator is positioned favorably—buy signals occur below the 50 midline, sell signals occur above it.
Dashboard Information
The on-chart table displays:
Current oscillator value with gradient coloring
Momentum state (Overbought, Oversold, Bullish, Bearish, Neutral)
Momentum direction and acceleration
Efficiency ratio percentage
Active signal status
Inputs Overview
RSI Length — Period for RSI calculation (default: 14)
ROC Length — Period for rate of change (default: 10)
Smoothing Length — EMA smoothing period (default: 3)
Overbought/Oversold Levels — Threshold levels for zone detection
Await Bar Confirmation — Wait for bar close before triggering alerts
How to Use It
Watch for crossovers between the main line and signal line
Use overbought/oversold zones to identify potential reversal areas
Monitor the histogram for momentum acceleration or deceleration
Combine with price action analysis for confirmation
Alerts
Buy Signal — Bullish crossover in the lower zone
Sell Signal — Bearish crossunder in the upper zone
Overbought/Oversold Crosses — Level threshold crossings
This indicator is provided for educational purposes. It does not constitute financial advice. Always conduct your own analysis before making trading decisions.
— Made with passion by officialjackofalltrades

EMA/SMA Crossover Signals📊 EMA/SMA Crossover Signals
A professional trading indicator that identifies golden and death crosses between a customizable EMA and SMA with clear BUY/SELL labels displayed directly on your chart.
🎯 Key Features:
✅ Customizable Moving Averages - Adjust both EMA and SMA periods to match your trading strategy
✅ Clear Signal Labels - Large, color-coded "BUY" and "SELL" labels that are impossible to miss
✅ Adjustable Label Positioning - Control the vertical distance of signal labels from price action
✅ Professional Color Customization - Change colors for both moving averages and signals to match your theme
✅ Label Size Options - Choose from 4 different sizes (Tiny, Small, Normal, Large)
✅ Audio Alerts - Get notified instantly when crossovers occur
✅ Overlay Display - Signals appear directly on your price chart for better context
📈 How It Works:
🟢 BUY Signal: Triggered when the EMA crosses above the SMA (bullish crossover)
🔴 SELL Signal: Triggered when the EMA crosses below the SMA (bearish crossover)
⚙️ Customizable Settings:
Moving Averages:
- EMA Period (Default: 8)
- SMA Period (Default: 200)
Colors:
- EMA Color
- SMA Color
- Buy Signal Color
- Sell Signal Color
Signal Settings:
- Signal Vertical Offset
- Label Vertical Offset
- Label Size
💡 Best For:
- Day Trading (1-5 min timeframes)
- Swing Trading (4H-Daily)
- Trend Following Strategies
- Identifying momentum shifts
- Confirming market structure changes
🔔 Perfect for traders using ICT, Wyckoff, and institutional trading methodologies
Use this indicator as part of your complete trading system. Always combine with proper risk management and additional confluence factors.

Sniper 50: The Trend Master [Pure Signal]Overview Sometimes, the simplest strategies are the deadliest. This indicator brings the legendary "EMA 50 Strategy" to your chart in its purest form. It is designed to capture major market trends and reversals immediately as they happen, stripping away complex filters that often cause lag.
Why the EMA 50? The 50-period Exponential Moving Average is widely regarded by institutional traders as the primary divider between bullish and bearish territory. This tool automates the monitoring of this key level.
How It Works The logic is raw and direct:
BUY Signal: Triggered immediately when the candle closes ABOVE the EMA 50.
SELL Signal: Triggered immediately when the candle closes BELOW the EMA 50.
Key Features
Zero Noise Technology: Includes a built-in state machine that prevents repetitive signals. You will receive exactly ONE signal when the trend flips, and silence until the next reversal.
Dynamic Visuals: The EMA line changes color (Green for Bullish, Red for Bearish) to give you instant context.
Lag-Free: unlike other tools that wait for multiple confirmations, this tool prioritizes speed to catch sharp moves (like sudden crashes or rallies).
Best For
Trend Following
Swing Trading (Crypto & Stocks)
Catching rapid reversals that complex indicators might miss.

TTP IFVG Signals With EMA /ICT Gold scalpingThis script uses original logic and alerting rules. in Japan
finding ICT IFVG and EMA conditions.
#IFVG, Forex, ICT, EMA, Scalping, Indicator
This indicator automatically finds IFVG (Imbalance / Fair Value Gap) zones and gives you a buy or sell signal when price comes back and breaks out through that gap.
It also draws a colored box over the gap so you can see the zone visually, and it raises alerts when a new signal appears.
High-level logic:
On every bar, the script looks back up to “IFVG_GapBars” bars.
For each offset i it checks a 3-candle pattern:
– If the low of the newer candle is above the high of the older candle: bullish FVG (price jumped up, leaving a gap).
– If the high of the newer candle is below the low of the older candle: bearish FVG (price jumped down, leaving a gap).
When a valid FVG is found:
– For a bullish FVG it looks for a later close that breaks down through that gap (sell signal).
– For a bearish FVG it looks for a later close that breaks up through that gap (buy signal).
– A moving-average trend filter must agree (downtrend for sells, uptrend for buys).
– It checks that price has not already “filled” the gap before the breakout.
If all conditions are satisfied, it:
– Sets signal_dir = 1 for a buy, or -1 for a sell.
– Draws a box from the original FVG bar to the bar just before the breakout (extended a bit to the right), between the gap high and gap low.
– Plots an ▲ label for buys or ▼ label for sells.
– Triggers the corresponding alert conditions.
Now the parameters:
PipSizeMultilier (PipSizeManual)
Multiplies the symbol’s minimum tick size (syminfo.mintick).
It is used when converting “MinFVG_Pips” into an actual price distance.
If you feel the indicator is too sensitive (too many small gaps), you can increase this multiplier to effectively require a larger price difference.
TickSize
Internal value = syminfo.mintick * PipSizeMultiplier.
This is the actual price step the script uses as a “pip” when checking minimum gap size.
FVG Search Lookback (IFVG_GapBars)
How many bars back from the current bar the script will scan for a 3-candle FVG pattern.
Larger value = it can find older FVGs, but loop cost is higher.
Min FVG Size (Pips/Points) (MinFVG_Pips)
Minimum allowed size of the gap, measured in “pips/points” using TickSize.
If the vertical distance between the gap high and gap low is smaller than this, the gap is ignored.
0.0 means “no size filter” (every FVG is allowed).
FVG Epsilon (Price Units) (FVG_EpsPoints)
Tolerance for the FVG detection.
It is subtracted/added in the condition that checks “low > old high” or “high < old low”.
0.0 means strict gap (no overlap at all). A small positive epsilon allows tiny overlaps to still count as a gap.
Show IFVG Zones (ShowZones)
If true, the script draws a box over the IFVG zone when a signal is confirmed.
If false, no boxes are drawn; you only see the ▲ / ▼ markers and alerts.
Buy Zone Color (ZoneColorBuy)
Fill color and border color for boxes created from bearish FVGs that later produce a buy signal.
Sell Zone Color (ZoneColorSell)
Fill color and border color for boxes created from bullish FVGs that later produce a sell signal.
Box Extension (Bars) (BoxExtension)
How many extra bars to extend the right side of the box beyond the breakout bar.
The internal right coordinate is “bar_index - 1 + BoxExtension”.
Increase this if you want the zone to visually extend further into the future.
MA Period (MA_Period)
Lookback length of the moving average used as a trend filter.
MA Type (MA_Kind)
Type of moving average: “SMA” or “EMA”.
If SMA is chosen, the script uses ta.sma; if EMA, it uses ta.ema.
Moving-average filter behavior:
For sell signals (from bullish FVG): MA must be sloping down (MA < MA ) and price must be below MA.
For buy signals (from bearish FVG): MA must be sloping up (MA > MA ) and price must be above MA.
If these conditions are not satisfied, the FVG is ignored even if the gap and breakout conditions are met.
Signals and alerts:
signal_dir = 1 → buy signal, ▲ label below the bar, “IFVG Buy Alert” / “IFVG Buy/Sell Alert” can fire.
signal_dir = -1 → sell signal, ▼ label above the bar, “IFVG Sell Alert” / “IFVG Buy/Sell Alert” can fire.
signal_dir = 0 → no new signal on this bar.
In short:
This indicator finds 3-candle IFVG gaps, filters them by size and trend, waits for a clean breakout through the gap, draws a box on the original gap zone, and gives you a clear buy or sell signal plus alerts.

Pivot Reversal Signals - Multi ConfirmationPivot Reversal Signals - Multi-Confirmation System
Overview
A comprehensive reversal detection indicator designed for daytraders that combines six independent technical signals to identify high-probability pivot points. The indicator uses a scoring system to classify signal strength as Weak, Medium, or Strong based on the number of confirmations present.
How It Works
The indicator monitors six key reversal signals simultaneously:
1. RSI Divergence - Detects when price makes new highs/lows but RSI shows weakening momentum
2. MACD Divergence - Identifies divergence between price action and MACD histogram
3. Key Level Touch - Confirms price is at significant support/resistance (previous day high/low, premarket high/low, VWAP, 50 SMA)
4. Reversal Candlestick Patterns - Recognizes bullish/bearish engulfing, hammers, and shooting stars
5. Moving Average Confluence - Validates bounces/rejections at stacked moving averages (9/20/50)
6. Volume Spike - Confirms increased participation (default: 1.5x average volume)
Signal Strength Classification
• Weak (3/6 confirmations) - Small circles for situational awareness only
• Medium (4/6 confirmations) - Regular triangles, viable entry signals
• Strong (5-6/6 confirmations) - Large triangles with background highlight, highest probability setups
Visual Features
• Entry Signals: Green triangles (up) for long entries, red triangles (down) for short entries
• Exit Warnings: Orange X markers when opposing signals appear
• Signal Labels: Show confirmation score (e.g., "5/6") and strength level
• Key Levels Displayed:
o Previous Day High/Low - Solid green/red lines (uses actual daily data)
o Premarket High/Low - Blue/orange circles (4:00 AM - 9:30 AM EST)
o VWAP - Purple line
o Moving Averages - 9 EMA (blue), 20 EMA (orange), 50 SMA (red)
• Background Tinting: Subtle color on strongest reversal zones
Key Level Detection
The indicator uses request.security() to accurately fetch previous day's high/low from daily timeframe data, ensuring precise level placement. Premarket high/low levels are dynamically tracked during premarket sessions (4:00 AM - 9:30 AM EST) and plotted throughout the trading day, providing critical support/resistance zones that often influence price action during regular hours.
Customizable Parameters
• Signal strength thresholds (adjust required confirmations)
• RSI settings (length, overbought/oversold levels)
• MACD parameters (fast/slow/signal lengths)
• Moving average periods
• Volume spike multiplier
• Toggle individual display elements (levels, MAs, labels)
Best Practices
• Use on 5-minute charts for entries, confirm on 15-minute for direction
• Focus on Medium and Strong signals; Weak signals provide context only
• Strong signals (5-6 confirmations) have the highest win rate
• Pay special attention to reversals at premarket high/low - these levels frequently hold
• Previous day high/low often acts as major support/resistance
• Always use proper risk management and stop losses
• Works best in moderately trending markets
Alert Capabilities
Set custom alerts for:
• Strong long/short signals
• All entry signals (medium + strong)
• Exit warnings for open positions
Ideal For
• Daytraders and scalpers (especially SPY, QQQ, and liquid equities)
• Swing traders seeking precise entries
• Traders who prefer confirmation-based systems
• Anyone looking to reduce false signals with multi-factor validation
• Traders who utilize premarket levels in their strategy
Technical Notes
• Uses Pine Script v6
• Premarket hours: 4:00 AM - 9:30 AM EST
• Previous day levels pulled from daily timeframe for accuracy
• Maximum 500 labels to maintain chart performance
• All key levels update dynamically in real-time
________________________________________
Note: This indicator provides signal analysis only and should be used as part of a complete trading strategy. Past performance does not guarantee future results. Always practice proper risk management.

BTC Halving Cycle SignalsBTC Halving Cycle Signals
What signals does this script give in real history (2011-2025):
2015 → BUY (bear market bottom)
2019 → BUY (post-2018 bottom)
October 2020 → BUY
November 2023 → BUY
And right now (Nov 2025) → green bottom + price above weekly EMA200 → about to give a buy signal if it breaks $72k strongly.
BUY signal: ~500 days pre-halving + price > weekly EMA200 + monthly RSI <60 (accumulation).
SELL signal: ~1064 days post-halving + RSI >75 or close < SuperTrend (distribution).
Hardcoded halving dates (can be edited). Works on BTCUSD weekly/monthly, gives 1-2 signals per cycle.

Stochastic RSI - WT Confluence Signal Detectors (TraderDemircan)Description
What This Indicator Does:
This indicator combines two powerful momentum oscillators—WaveTrend and Stochastic RSI—to identify high-probability trading signals through confluence. Instead of relying on a single indicator that may generate false signals, this tool only triggers buy/sell alerts when both oscillators simultaneously confirm extreme market conditions and trend reversals. This confluence approach significantly reduces noise and helps traders focus on the most reliable setups.
Key Features:
Dual-Oscillator Confluence: Generates signals only when both WaveTrend crossovers and Stochastic RSI extreme levels align
Normalized Scale Display: Both oscillators are plotted on a unified -100 to +100 scale for easy visual comparison
Visual Signal Confirmation: Clear intersection points marked with colored circles, plus optional candle coloring at crossover moments
Customizable Thresholds: Adjust overbought/oversold levels for both oscillators to match your trading style and asset volatility
Clean Visual Presentation: Optional area fill showing WaveTrend momentum difference, making divergences easier to spot
How It Works:
The indicator operates on a confluence principle where multiple conditions must align:
For BUY Signals (Green):
WaveTrend 1 crosses above WaveTrend 2 (bullish crossover)
WaveTrend is in oversold territory (below -53 or -60)
Stochastic RSI K-line is below 20 (oversold)
For SELL Signals (Red):
WaveTrend 1 crosses below WaveTrend 2 (bearish crossover)
WaveTrend is in overbought territory (above 53 or 60)
Stochastic RSI K-line is above 80 (overbought)
WaveTrend Component:
Uses the hlc3 price (average of high, low, close) to calculate a channel index that identifies market momentum waves. The two WaveTrend lines (WT1 and WT2) act similarly to MACD, where crossovers indicate momentum shifts. The oscillator ranges from approximately -100 to +100, with extreme values suggesting potential reversals.
Stochastic RSI Component:
Applies stochastic calculations to RSI values rather than raw price, creating a more sensitive momentum indicator. Values above 80 indicate overbought conditions (potential selling opportunity), while values below 20 indicate oversold conditions (potential buying opportunity). The indicator includes both K-line (faster) and D-line (slower, smoothed) for additional confirmation.
Normalization Technology:
To enable direct visual comparison, the Stochastic RSI (normally 0-100 scale) is normalized to match WaveTrend's -100 to +100 scale. This allows traders to see both oscillators' movements in relation to the same reference levels, making divergences and convergences more apparent.
How to Use:
For Trend Traders:
Wait for confluence signals in the direction of the larger trend
Use buy signals in uptrends as entry points during pullbacks
Use sell signals in downtrends as entry points during bounces
For Reversal Traders:
Focus on confluence signals at major support/resistance levels
Look for divergences between price and oscillators before confluence signals
Consider stronger signals when both oscillators reach extreme levels (WT beyond ±60, Stoch beyond 20/80)
For Scalpers:
Lower the WaveTrend Channel Length (default 10) to 5-7 for more frequent signals
Tighten overbought/oversold thresholds slightly (e.g., WT: ±50, Stoch: 30/70)
Use on lower timeframes (5m, 15m) with strict stop losses
Settings Guide:
WaveTrend Parameters:
Channel Length (10): Controls sensitivity. Lower = more signals but more noise. Higher = fewer but more reliable signals
Average Length (21): Smoothing period for WT2. Higher values reduce whipsaws
Overbought Levels (60/53): Two-tier system. Breaching 60 indicates strong overbought, 53 is moderate
Oversold Levels (-60/-53): Mirror of overbought levels for downside extremes
Stochastic RSI Parameters:
K-Smooth (3): Smoothing for the K-line. Higher = smoother but delayed
D-Smooth (3): Additional smoothing for the D-line signal
RSI Period (14): Standard RSI calculation period
Stoch Period (14): Stochastic calculation lookback
Oversold (20) / Overbought (80): Classic thresholds for extreme conditions
Visual Options:
Show WT Difference Area: Displays the momentum difference between WT1 and WT2 as a blue shaded area
Show WT Intersection Points: Marks crossover points with colored circles (red for bearish, green for bullish)
Color Candles at Intersection: Changes candle colors at crossover moments (blue for bearish, yellow for bullish)
Show Stoch Over Signals: Displays when Stochastic RSI breaches extreme levels
What Makes This Original:
While WaveTrend and Stochastic RSI are established indicators, this script's originality lies in:
Confluence Logic: The specific combination requiring simultaneous confirmation from both oscillators in extreme zones, not just simple crossovers
Normalization Approach: Displaying both oscillators on the same -100 to +100 scale for direct visual comparison, which is not standard
Multi-Tier Overbought/Oversold: Using two levels (60/53) instead of one, allowing for nuanced signal strength assessment
Integrated Visual System: Combining area fills, intersection markers, and candle coloring in a coordinated display that shows momentum flow at a glance
Important Considerations:
This is a momentum-based oscillator system, which performs best in ranging or trending markets with clear swings
In strong trending markets, the oscillator may remain in extreme zones for extended periods (remain overbought during strong uptrends, oversold during strong downtrends)
Confluence signals are intentionally rare to maintain quality—expect fewer signals than with single-indicator systems
Always combine with price action analysis, support/resistance levels, and proper risk management
Not recommended for extremely low volatility or thin markets where oscillators may produce erratic readings
Best Timeframes:
Intraday: 15m, 1H (with tighter parameters)
Swing Trading: 4H, Daily (with default parameters)
Position Trading: Daily, Weekly (with extended Channel Length 15-20)
Typical Use Cases:
Identifying exhaustion points in trending markets
Timing entries during pullbacks in established trends
Spotting potential reversal zones at key price levels
Filtering out weak momentum signals during consolidation

Advanced Multi-Timeframe Trend & Signal System═══════════════════════════════════════════════════════════════
ADVANCED MULTI-TIMEFRAME TREND & SIGNAL SYSTEM v1.0
═══════════════════════════════════════════════════════════════
Created by: Zakaria Safri
License: Mozilla Public License 2.0
A comprehensive technical analysis tool designed for traders seeking
multi-dimensional market insights. This indicator combines proven
technical analysis methods with modern visualization techniques.
═══════════════════════════════════════════════════════════════
KEY FEATURES
═══════════════════════════════════════════════════════════════
✓ SUPERTREND SIGNAL GENERATION
- Customizable sensitivity settings
- Clear long/short entry signals
- Automatic trend direction detection
- ATR-based dynamic calculations
✓ MULTI-TIMEFRAME DASHBOARD
- Real-time trend analysis across 6 timeframes
- Synchronized trend confirmation
- Customizable table position and size
- Current: 1M, 5M, 15M, 1H, 1D coverage
✓ QQE REVERSAL DETECTION
- Quantitative Qualitative Estimation algorithm
- Early reversal signal identification
- Adjustable RSI and smoothing parameters
- Confirmation-based plotting
✓ DYNAMIC SUPPORT & RESISTANCE
- Pivot-based level calculation
- Quick and standard pivot detection
- Color-coded zones (8 levels)
- Automatic level updates
✓ MOMENTUM BREAKOUT SIGNALS
- Ichimoku-inspired calculations
- Bullish and bearish breakout detection
- Visual zone highlighting
- Trend confirmation filters
✓ RISK MANAGEMENT SYSTEM
- ATR-based stop loss calculation
- Multiple take profit targets (TP1, TP2, TP3)
- Customizable risk-to-reward ratios
- Dynamic price level tracking
- Hit detection markers
✓ VOLATILITY BANDS
- Keltner Channel implementation
- Multiple band layers (3 levels)
- EMA-based calculations
- Adaptive to market conditions
✓ TREND CLOUD VISUALIZATION
- Dual moving average cloud
- Clear trend direction indication
- Customizable color scheme
- Trend bar coloring
═══════════════════════════════════════════════════════════════
HOW TO USE
═══════════════════════════════════════════════════════════════
SETUP:
1. Add indicator to your chart
2. Configure sensitivity in Core Signals section
3. Enable desired features (signals, reversals, breakouts)
4. Set up risk management levels if trading
5. Position MTF dashboard to preference
SIGNAL INTERPRETATION:
• LONG Signal: Price crosses above Supertrend
• SHORT Signal: Price crosses below Supertrend
• REV (Reversal): QQE indicates potential trend change
• Diamond Breakouts: Momentum shift confirmation
• T1/T2/T3: Take profit level hits
MULTI-TIMEFRAME ANALYSIS:
• Green (BULL): Higher timeframe supports uptrend
• Red (BEAR): Higher timeframe supports downtrend
• Use for trend alignment and confirmation
• Best results when multiple timeframes align
RISK MANAGEMENT:
• Enable Stop Loss for automatic SL calculation
• Activate TP levels based on trading style
• Adjust Risk-to-Reward ratio (1:1 to 1:10)
• Monitor hit detection circles for exits
═══════════════════════════════════════════════════════════════
TECHNICAL SPECIFICATIONS
═══════════════════════════════════════════════════════════════
CALCULATIONS:
• Supertrend: ATR-based with customizable multiplier
• QQE: Modified RSI with Wilders smoothing
• Keltner Channels: EMA basis with ATR bands
• Pivots: Standard left/right bar methodology
• Support/Resistance: Multi-level pivot analysis
PARAMETERS:
• Supertrend Sensitivity: 0.5 to 10.0 (default: 2.0)
• RSI Period: 5 to 50 (default: 14)
• QQE Multiplier: 1.0 to 10.0 (default: 4.238)
• Risk-to-Reward: 1 to 10 (default: 4)
TIMEFRAMES:
Compatible with all timeframes. MTF dashboard displays:
• 1 Minute (1M)
• 5 Minutes (5M)
• 15 Minutes (15M)
• 1 Hour (1H)
• 1 Day (1D)
• Current chart timeframe
═══════════════════════════════════════════════════════════════
CUSTOMIZATION OPTIONS
═══════════════════════════════════════════════════════════════
VISUAL:
• Professional color scheme (Cyan/Orange)
• Adjustable table position (9 positions)
• Table size options (tiny/small/normal/large)
• Transparent zone highlighting
• Clean, modern label design
TOGGLES:
• Enable/disable any feature independently
• Show/hide signals, reversals, breakouts
• Toggle S/R levels and zones
• Control trend cloud and bands
• Master trend line optional
ALERTS:
The indicator provides visual signals that can be used with
TradingView's alert system by setting alerts on the indicator.
═══════════════════════════════════════════════════════════════
BEST PRACTICES
═══════════════════════════════════════════════════════════════
✓ Combine signals for higher probability setups
✓ Use MTF dashboard for trend confirmation
✓ Respect S/R levels for entry/exit planning
✓ Monitor QQE reversals at key price levels
✓ Adjust sensitivity based on asset volatility
✓ Test on demo/paper trading first
✓ Use proper risk management always
═══════════════════════════════════════════════════════════════
IMPORTANT DISCLAIMER
═══════════════════════════════════════════════════════════════
This indicator is a technical analysis tool and does NOT:
• Guarantee profitable trades
• Provide financial advice
• Predict future price movements with certainty
• Replace proper risk management
• Substitute for personal due diligence
Past performance does not indicate future results. All trading
involves risk. Users should:
- Understand the indicator's logic
- Test thoroughly before live trading
- Use appropriate position sizing
- Never risk more than they can afford to lose
- Consult financial advisors if needed
═══════════════════════════════════════════════════════════════
CODING STANDARDS
═══════════════════════════════════════════════════════════════
This indicator follows PineCoders Coding Conventions:
✓ Proper variable naming (prefixes: i_, f_, c_)
✓ Clear function documentation
✓ Organized code structure
✓ Type declarations
✓ Efficient calculations
✓ No repainting (confirmed signals)
✓ Proper use of request.security
═══════════════════════════════════════════════════════════════
SUPPORT & UPDATES
═══════════════════════════════════════════════════════════════
Version: 1.0
Author: Zakaria Safri
License: MPL 2.0
Last Updated: 2024
For questions, feedback, or suggestions, please comment below.
═══════════════════════════════════════════════════════════════
#trading #signals #supertrend #multiTimeframe #QQE #reversals
#supportResistance #riskManagement #trendAnalysis #momentum

Swing AURORA v4.0 — Refined Trend Signals### Swing Algo v4.0 — Refined Trend Signals
#### Overview
Swing Algo v4.0 is an advanced technical indicator designed for TradingView, built to detect trend changes and provide actionable buy/sell signals in various market conditions. It combines multiple technical elements like moving averages, ADX for trend strength, Stochastic RSI for timing, and RSI divergence for confirmation, all while adapting to different timeframes through auto-tuning. This indicator overlays on your chart, highlighting trend regimes with background colors, displaying buy/sell labels (including "strong" variants), and offering early "potential" signals for proactive trading decisions. It's suitable for swing trading, trend following, or as a filter for other strategies across forex, stocks, crypto, and other assets.
#### Purpose
The primary goal of Swing Algo v4.0 is to help traders identify high-probability trend reversals and continuations early, reducing noise and false signals. It aims to provide clear, non-repainting signals that align with market structure, volatility, and momentum. By incorporating filters like higher timeframe (HTF) alignment, bias EMAs, and divergence, it refines entries for better accuracy. The indicator emphasizes balanced performance across aggressive, balanced, and conservative modes, making it versatile for both novice and experienced traders seeking to optimize their decision-making process.
#### What It Indicates
- **Trend Regimes (Background Coloring)**: The chart background changes color to reflect the current market regime:
- **Green (Intense for strong uptrends, faded when cooling)**: Indicates bullish trends where price is above the baseline and EMAs are aligned upward.
- **Red/Maroon (Intense maroon for strong downtrends, faded red when cooling)**: Signals bearish trends with price below the baseline and downward EMA alignment.
- **Faded Yellow**: Marks "no-trade" zones or potential trend changes, where conditions are choppy, weak, or neutral (e.g., low ADX, near baseline, or low volatility).
- **Buy/Sell Signals**: Labels appear on the chart for confirmed entries:
- "BUY" or "STRONG BUY" for bullish signals (strong variants require higher scores and optional divergence).
- "SELL" or "STRONG SELL" for bearish signals.
- **Potential Signals**: Early warnings like "Potential BUY" or "Potential SELL" appear before full confirmation, allowing traders to anticipate moves (confirmed after a few bars based on the trigger window).
- **Divergence Marks**: Small "DIV↑" (bullish) or "DIV↓" (bearish) labels highlight RSI divergences on pivots, adding confluence for strong signals.
- **Lines**: Optional plots for baseline (teal), EMA13/21 (lime/red based on crossover), providing visual trend context.
Signals are anchored either to the current bar or confirmed pivots, ensuring alignment with price action. The indicator avoids repainting by confirming on close if enabled.
#### Key Parameters and Customization
Swing Algo v4.0 offers minimal yet efficient parameters for fine-tuning, with defaults optimized for common use cases. Most can be auto-tuned based on timeframe for simplicity:
- **Confirm on Close (no repaint)**: Boolean (default: true) – Ensures signals don't repaint by waiting for bar confirmation.
- **Auto-tune by Timeframe**: Boolean (default: true) – Automatically adjusts lengths and sensitivity for 5-15m, 30-60m, 2-4h, or higher frames.
- **Mode**: String (options: Aggressive, Balanced , Conservative) – Controls signal thresholds; Aggressive for more signals, Conservative for fewer but higher-quality ones.
- **Signal Anchor**: String (options: Pivot (divLB) , Current bar) – Places labels on confirmed pivots or the current bar.
- **Trigger Window (bars)**: Integer (default: 3) – Window for signal timing; auto-tuned if enabled.
- **Baseline Type**: String (options: HMA , EMA, ALMA) – Core trend line; lengths auto-tune (e.g., 55 for short frames).
- **Use Bias EMA Filter**: Boolean (default: false) – Adds a long-term EMA for trend bias.
- **Use HTF Filter**: Boolean (default: false) – Aligns with higher timeframe (auto or manual like 60m, 240m, D); override for stricter scoring.
- **Sensitivity (10–90)**: Integer (default: 55) – Adjusts ADX threshold for trend detection; higher = more sensitive.
- **Use RSI-Stoch Trigger**: Boolean (default: true) – Enables Stochastic RSI for entry timing; customizable lengths, smooths, and levels.
- **Use RSI Divergence for STRONG**: Boolean (default: true) – Requires divergence for strong signals; pivot lookback (default: 5).
- **Visual Options**: Booleans for background regime, labels, divergence marks, and lines (all default: true).
These parameters are grouped for ease, with tooltips in TradingView for quick reference. Start with defaults and tweak based on backtesting.
#### How It Works
At its core, Swing Algo v4.0 calculates a baseline (e.g., HMA) to define the trend direction. It then scores potential buys/sells using factors like:
- **Trend Strength**: ADX above a dynamic threshold, combined with EMA crossovers (13/21) and slope analysis.
- **Volatility/Volume**: Bollinger/Keltner squeeze exits, volume z-score, and ATR filters to avoid choppy markets.
- **Timing**: Stochastic RSI crossovers or micro-timing via DEMA/TEMA for precise entries.
- **Filters**: Bias EMA, HTF alignment, gap from baseline, and no-trade zones (weak ADX, near baseline, low vol).
- **Divergence**: RSI pivots confirm strong signals.
- **Scoring**: Buy/sell scores (min 3-5 based on mode) trigger labels only when all gates pass, with early "potential" detection for foresight.
The algorithm processes these in real-time, auto-adapting to timeframe for efficiency. Signals flip only on direction changes to prevent over-trading. For best results, use on liquid assets and combine with risk management.
#### Disclaimer
This indicator is for educational and informational purposes only and does not constitute financial advice, investment recommendations, or trading signals. Trading involves significant risk of loss and is not suitable for all investors. Past performance is not indicative of future results. Always backtest the indicator on your preferred assets and timeframes, and consult a qualified financial advisor before making any trading decisions. The author assumes no liability for any losses incurred from using this script. Use at your own risk.

Adaptive HMA SignalsAdaptive HMA Signals
This indicator pairs nicely with the Contrarian 100 MA and can be located here:
Overview
The "Adaptive HMA Signals" indicator is a sophisticated technical analysis tool designed for traders aiming to capture trend changes with precision. By leveraging Hull Moving Averages (HMAs) that adapt dynamically to market conditions (volatility or volume), this indicator generates actionable buy and sell signals based on price interactions with adaptive HMAs and slope analysis. Optimized for daily charts, it is highly customizable and suitable for trading forex, stocks, cryptocurrencies, or other assets. The indicator is ideal for swing traders and trend followers seeking to time entries and exits effectively.
How It Works
The indicator uses two adaptive HMAs—a primary HMA and a minor HMA—whose periods adjust dynamically based on user-selected market conditions (volatility via ATR or volume via RSI). It calculates the slope of the primary HMA to identify trend strength and generates exit signals when the price crosses the minor HMA under specific slope conditions. Signals are plotted as circles above or below the price, with inverted colors (white for buy, blue for sell) to enhance visibility on any chart background.
Key Components
Adaptive HMAs: Two HMAs (primary and minor) with dynamic periods that adjust based on volatility (ATR-based) or volume (RSI-based) conditions. Periods range between user-defined minimum and maximum values, adapting by a fixed percentage (3.141%).
Slope Analysis: Calculates the slope of the primary HMA over a 34-bar period to gauge trend direction and strength, normalized using market range data.
Signal Logic: Generates buy signals (white circles) when the price falls below the minor HMA with a flat or declining slope (indicating a potential trend reversal) and sell signals (blue circles) when the price rises above the minor HMA with a flat or rising slope.
Signal Visualization: Plots signals at an offset based on ATR for clarity, using semi-transparent colors to avoid chart clutter.
Mathematical Concepts
Dynamic Period Adjustment:
Primary HMA period adjusts between minLength (default: 144) and maxLength (default: 200).
Minor HMA period adjusts between minorMin (default: 55) and minorMax (default: 89).
Periods decrease by 3.141% under high volatility/volume and increase otherwise.
HMA Calculation:
Uses the Hull Moving Average formula: WMA(2 * WMA(src, length/2) - WMA(src, length), sqrt(length)).
Provides a smoother, faster-responding moving average compared to traditional MAs.
Slope Calculation:
Computes the slope of the primary HMA using a 34-bar period, normalized by the market range (highest high - lowest low over 34 bars).
Slope angle is converted to degrees using arccosine for intuitive trend strength interpretation.
Signal Conditions:
Buy: Slope ≥ 17° (flat or rising), price < minor HMA, low volatility/volume.
Sell: Slope ≤ -17° (flat or declining), price > minor HMA, low volatility/volume.
Signals are triggered only on confirmed bars to avoid repainting.
Entry and Exit Rules
Buy Signal (White Circle): Triggered when the price crosses below the minor HMA, the slope of the primary HMA is flat or rising (≥17°), and volatility/volume is low. The signal appears as a white circle above the price bar, offset by 0.72 * ATR(5).
Sell Signal (Blue Circle): Triggered when the price crosses above the minor HMA, the slope of the primary HMA is flat or declining (≤-17°), and volatility/volume is low. The signal appears as a blue circle below the price bar, offset by 0.72 * ATR(5).
Exit Rules: Exit a buy position on a sell signal and vice versa. Combine with other tools (e.g., support/resistance, RSI) for additional confirmation. Always apply proper risk management.
Recommended Usage
The "Adaptive HMA Signals" indicator is optimized for daily charts but can be adapted to other timeframes (e.g., 1H, 4H) with adjustments to period lengths. It performs best in trending or range-bound markets with clear reversal points. Traders should:
Backtest the indicator on their chosen asset and timeframe to validate signal reliability.
Combine with other technical tools (e.g., trendlines, Fibonacci retracements) for stronger trade setups.
Adjust minLength, maxLength, minorMin, and minorMax based on market volatility and timeframe.
Use the Charger input to toggle between volatility (ATR) and volume (RSI) adaptation for optimal performance in specific market conditions.
Customization Options
Source: Choose the price source (default: close).
Show Signals: Toggle visibility of buy/sell signals (default: true).
Charger: Select adaptation trigger—Volatility (ATR-based) or Volume (RSI-based) (default: Volatility).
Main HMA Periods: Set minimum (default: 144) and maximum (default: 200) periods for the primary HMA.
Minor HMA Periods: Set minimum (default: 55) and maximum (default: 89) periods for the minor HMA.
Slope Period: Fixed at 34 bars for slope calculation, adjustable via code if needed.
Why Use This Indicator?
The "Adaptive HMA Signals" indicator combines the responsiveness of HMAs with dynamic adaptation to market conditions, offering a robust tool for identifying trend reversals. Its clear visual signals, customizable periods, and adaptive logic make it versatile for various markets and trading styles. Whether you’re a beginner or an experienced trader, this indicator enhances your ability to time entries and exits with precision.
Tips for Users
Test the indicator thoroughly on your chosen market and timeframe to optimize settings (e.g., adjust period lengths for non-daily charts).
Use in conjunction with price action or other indicators (e.g., RSI, MACD) for stronger trade confirmation.
Monitor volatility/volume conditions to ensure the Charger setting aligns with market dynamics.
Ensure your chart timeframe aligns with the selected period lengths for accurate signal generation.
Apply strict risk management to protect against false signals in choppy markets.
Happy trading with the Adaptive HMA Signals indicator! Share your feedback and strategies in the TradingView community!

RSI ROC Signals with Price Action# RSI ROC Signals with Price Action
## Overview
The RSI ROC (Rate of Change) Signals indicator is an advanced momentum-based trading system that combines RSI velocity analysis with price action confirmation to generate high-probability buy and sell signals. This indicator goes beyond traditional RSI analysis by measuring the speed of RSI changes and requiring price confirmation before triggering signals.
## Core Concept: RSI Rate of Change (ROC)
### What is RSI ROC?
RSI ROC measures the **velocity** or **acceleration** of the RSI indicator, providing insights into momentum shifts before they become apparent in traditional RSI readings.
**Formula**: `RSI ROC = ((Current RSI - Previous RSI) / Previous RSI) × 100`
### Why RSI ROC is Superior to Standard RSI:
1. **Early Momentum Detection**: Identifies momentum shifts before RSI reaches traditional overbought/oversold levels
2. **Velocity Analysis**: Measures the speed of momentum changes, not just absolute levels
3. **Reduced False Signals**: Filters out weak momentum moves that don't sustain
4. **Dynamic Thresholds**: Adapts to market volatility rather than using fixed RSI levels
5. **Leading Indicator**: Provides earlier signals compared to traditional RSI crossovers
## Signal Generation Logic
### 🟢 Buy Signal Process (3-Stage System):
#### Stage 1: Trigger Activation
- **RSI ROC** > threshold (default 7%) - RSI accelerating upward
- **Price ROC** > 0 - Price moving higher
- Records the **trigger high** (highest point during trigger)
#### Stage 2: Invalidation Check
- Signal invalidated if **RSI ROC** drops below negative threshold
- Prevents false signals during momentum reversals
#### Stage 3: Confirmation
- **Price breaks above trigger high** - Price action confirmation
- **Current candle is green** (close > open) - Bullish price action
- **State alternation** - Ensures no consecutive duplicate signals
### 🔴 Sell Signal Process (3-Stage System):
#### Stage 1: Trigger Activation
- **RSI ROC** < negative threshold (default -7%) - RSI accelerating downward
- **Price ROC** < 0 - Price moving lower
- Records the **trigger low** (lowest point during trigger)
#### Stage 2: Invalidation Check
- Signal invalidated if **RSI ROC** rises above positive threshold
- Prevents false signals during momentum reversals
#### Stage 3: Confirmation
- **Price breaks below trigger low** - Price action confirmation
- **Current candle is red** (close < open) - Bearish price action
- **State alternation** - Ensures no consecutive duplicate signals
## Key Features
### 🎯 **Smart Signal Management**
- **State Alternation**: Prevents signal clustering by alternating between buy/sell states
- **Trigger Invalidation**: Automatically cancels weak signals that lose momentum
- **Price Confirmation**: Requires actual price breakouts, not just momentum shifts
- **No Repainting**: Signals are confirmed and won't disappear or change
### ⚙️ **Customizable Parameters**
#### **RSI Length (Default: 14)**
- Standard RSI calculation period
- Shorter periods = more sensitive to price changes
- Longer periods = smoother, less noisy signals
#### **Lookback Period (Default: 1)**
- Period for ROC calculations
- 1 = compares to previous bar (most responsive)
- Higher values = smoother momentum detection
#### **RSI ROC Threshold (Default: 7%)**
- Minimum RSI velocity required for signal trigger
- Lower values = more signals, potentially more noise
- Higher values = fewer but higher-quality signals
### 📊 **Visual Signals**
- **Green Arrow Up**: Buy signal below price bar
- **Red Arrow Down**: Sell signal above price bar
- **Clean Chart**: No additional lines or oscillators cluttering the view
- **Size Options**: Customizable arrow sizes for visibility preferences
## Advantages Over Traditional Indicators
### vs. Standard RSI:
✅ **Earlier Signals**: Detects momentum changes before RSI reaches extremes
✅ **Dynamic Thresholds**: Adapts to market conditions vs. fixed 30/70 levels
✅ **Velocity Focus**: Measures momentum speed, not just position
✅ **Better Timing**: Combines momentum with price action confirmation
### vs. Moving Average Crossovers:
✅ **Leading vs. Lagging**: RSI ROC is forward-looking vs. backward-looking MAs
✅ **Volatility Adaptive**: Automatically adjusts to market volatility
✅ **Fewer Whipsaws**: Built-in invalidation logic reduces false signals
✅ **Momentum Focus**: Captures acceleration, not just direction changes
### vs. MACD:
✅ **Price-Normalized**: RSI ROC works consistently across different price ranges
✅ **Simpler Logic**: Clear trigger/confirmation process vs. complex crossovers
✅ **Built-in Filters**: Automatic signal quality control
✅ **State Management**: Prevents over-trading through alternation logic
## Trading Applications
### 📈 **Trend Following**
- Use in trending markets to catch momentum continuations
- Combine with trend filters for directional bias
- Excellent for breakout strategies
### 🔄 **Swing Trading**
- Ideal timeframes: 4H, Daily, Weekly
- Captures major momentum shifts
- Perfect for position entries/exits
### ⚡ **Scalping (Advanced Users)**
- Lower timeframes: 1m, 5m, 15m
- Reduce threshold for more frequent signals
- Combine with volume confirmation
### 🎯 **Momentum Strategies**
- Perfect for momentum-based trading systems
- Identifies acceleration phases in trends
- Complements breakout and continuation patterns
## Optimization Guidelines
### **Conservative Settings (Lower Risk)**
- RSI Length: 21
- ROC Threshold: 10%
- Lookback: 2
### **Standard Settings (Balanced)**
- RSI Length: 14 (default)
- ROC Threshold: 7% (default)
- Lookback: 1 (default)
### **Aggressive Settings (Higher Frequency)**
- RSI Length: 7
- ROC Threshold: 5%
- Lookback: 1
## Best Practices
### 🎯 **Entry Strategy**
1. Wait for signal arrow confirmation
2. Consider market context (trend, support/resistance)
3. Use proper position sizing based on volatility
4. Set stop-loss below/above trigger levels
### 🛡️ **Risk Management**
1. **Stop Loss**: Place beyond trigger high/low levels
2. **Position Sizing**: Use 1-2% risk per trade
3. **Market Context**: Avoid counter-trend signals in strong trends
4. **Time Filters**: Consider avoiding signals near major news events
### 📊 **Backtesting Recommendations**
1. Test on multiple timeframes and instruments
2. Analyze win rate vs. average win/loss ratio
3. Consider transaction costs in backtesting
4. Optimize threshold values for different market conditions
## Technical Specifications
- **Pine Script Version**: v6
- **Signal Type**: Non-repainting, confirmed signals
- **Calculation Basis**: RSI velocity with price action confirmation
- **Update Frequency**: Real-time on bar close
- **Memory Management**: Efficient state tracking with minimal resource usage
## Ideal For:
- **Momentum Traders**: Captures acceleration phases
- **Swing Traders**: Medium-term position entries/exits
- **Breakout Traders**: Confirms momentum behind breakouts
- **System Traders**: Mechanical signal generation with clear rules
This indicator represents a significant evolution in momentum analysis, combining the reliability of RSI with the precision of rate-of-change analysis and the confirmation of price action. It's designed for traders who want sophisticated momentum detection with built-in quality controls.
