ATR Bands (Keltner Channel), Wick and SRSI Signals [MW]Introduction
This indicator uses a novel combination of ATR Bands, candle wicks crossing the ATR upper and lower bands, and baseline, and combines them with the Stochastic SRSI oscillator to provide early BUY and SELL signals in uptrends, downtrends, and in ranging price conditions.
How it’s unique
People generally understand Bollinger Bands and Keltner Channels. Buy at the bottom band, sell at the top band. However, because the bands themselves are not static, impulsive moves can render them useless. People also generally understand wicks. Candles with large wicks can represent a change in pattern, or volatile price movement. Combining those two to determine if price is reaching a pivot point is relatively novel. When Stochastic RSI (SRSI) filtering is also added, it becomes a genuinely unique combination that can be used to determine trade entries and exits.
What’s the benefit
The benefit of the indicator is that it can help potentially identify pivots WHEN THEY HAPPEN, and with potentially minimal retracement, depending on the trader’s time window. Many indicators wait for a trend to be established, or wait for a breakout to occur, or have to wait for some form of confirmation. In the interpretation used by this indicator, bands, wicks, and SRSI cycles provide both the signal and confirmation.
It takes into account 3 elements:
Price approaching the upper or lower band or the baseline - MEANING: Price is becoming extended based on calculations that use the candle trading range.
A candle wick of a defined proportion (e.g. wick is 1/2 the size of a full candle OR candle body) crosses a band or baseline, but the body does not cross the band or baseline - MEANING: Buyers and sellers are both very active.
The Stochastic RSI reading is above 80 for SELL signals and below 20 for BUY signals - MEANING: Additional confirmation that price is becoming extended based on the current cyclic price pattern.
How to Use
SIGNALS
Buy Signals - Green(ish):
B Signal - Potential pivot up from the lower band when using the preferred multiplier
B1 Signal - Potential pivot up from the lower band when using phi * multiplier
B2 Signal - Potential pivot up from the lower band when using 1/2 * multiplier
B3 Signal - Potential pivot up from baseline
Sell Signals - Red(ish):
S Signal - Potential pivot down from the upper band when using the preferred multiplier
S1 Signal - Potential pivot down from the upper band when using
S2 Signal - Potential pivot down from the upper band when using 1/2 * multiplier
S3 Signal - Potential pivot down from the baseline
DISCUSSION
During an uptrend or downtrend, signals from the baseline can help traders identify areas where they may enter the trending move with the least amount of drawdown. In both cases, entry points can occur with baseline signals in the direction of the trend.
For example, in an uptrend (when the price is forming higher highs and higher lows, or when the baseline is rising), price tends to oscillate between the upper band and baseline. In this case, the baseline BUY signal (B3) can show an entry point.
In a downtrend (when the price is forming lower highs and lower lows, or when the baseline is falling), price tends to oscillate between the baseline and the lower band. In this case, the baseline SELL signal (S3) can show an entry point.
During consolidation, when price is ranging, price tends to oscillate between the upper and lower bands, while crossing through the baseline unperturbed. Here, entry points can occur at the upper and lower bands.
When all conditions are met at the lower band during consolidation, a BUY signal (B), can occur. This signal may also occur prior to a break out of consolidation to the upside.
When all conditions are met at the upper band during consolidation, a SELL signal (S), can occur. This signal may also occur prior to a break out of consolidation to the downside.
Additional B1, B2, and S1, and S2 signals can be displayed that use the bands based on a multiplier that is half that of the primary one, and phi (0.618) times the primary multiplier as a way to quickly check for signals occurring along different, but related, bands.
Calculations
ATR Bands, or Keltner Channels, are a technical analysis tool that are used to measure market volatility and identify overbought or oversold conditions in the trading of financial instruments, such as stocks, bonds, commodities, and currencies. ATR Bands consist of three lines plotted on a price chart:
Middle Band, Basis, or Baseline: This is typically a simple moving average (SMA) of the closing prices over a certain period. It represents the intermediate-term trend of the asset's price.
Upper Band: This is calculated by adding a certain number of ATRs to the middle band (SMA). The upper band adjusts itself with the increase in volatility.
Lower Band: This is calculated by subtracting the same number of ATRs from the middle band (SMA). Like the upper band, the lower band adjusts to changes in volatility.
The candle wick signals occur if the wick is at the specified ratio compared to either the entire candle or the candle body. The upper band, lower band, and baseline signals happen if the wick is the specified ratio of the total candle size. For the major signals for upper and lower bands, these occur when the wick extends outside of the bands while closing a candle inside of the bands. For the baseline signals, they occur if a wick crosses a baseline but closes on the other side.
Settings
CHANNEL SETTINGS
Baseline EMA Period (Default: 21): Period length of the moving average basis line.
ATR Period (Default: 21): The number of periods over which the Average True Range (ATR) is calculated.
Basis MA Type (Default: SMA): The moving average type for the basis line.
Multiplier (Default: 2.5: The deviation multiplier used to calculate the band distance from the basis line.
ADDITIONAL CHANNELS
Half of Multiplier Offset (Default: True): Toggles the display of the ATR bands that are set a distance of half of the ATR multiplier.
Quarter of Multiplier Offset (Default: false): Toggles the display of the ATR bands that are set a distance of one quarter of the ATR multiplier.
Phi (Φ) Offset (Default: false): Toggles the display of the ATR bands that are set a distance of phi (Φ) times the ATR multiplier.
WICK SETTINGS FOR CANDLE FILTERS
Wick Ratio for Bands (Default: 0.4): The ratio of wick size to total candle size for use at upper and lower bands.
Wick Ratio for Baseline (Default: 0.4): The ratio of wick size to total candle size for use at baseline.
Use Candle Body (rather than full candle size) (Default: false): Determines whether wick calculations use the candle body or the entire candle size.
VISUAL PREFERENCES - SIGNALS
Show Signals (Default: true): Allows signal labels to be shown.
Show Signals from 1/2 Band Offset (Default: false): Toggle signals originating from 1/2 offset upper and lower bands.
Show Signals from Phi (Φ) Band Offset (Default: false): Toggle signals originating from phi (Φ) offset upper and lower bands.
Show Baseline Signals (Default: false): Toggle Baseline signals.
VISUAL PREFERENCES - BANDS
Show ATR (Keltner) Bands (Default: true): Use a background color inside the Bollinger Bands.
Fill Bands (Default: true): Use a background color inside the Bollinger Bands.
STOCHASTIC SETTINGS
Use Stochastic RSI Filtering (Default: False): This will only trigger some SELL signals when the stochastic RSI is above 80, and BUY signals when below 20.
K (Default: 3): The smoothing level for the Stochastic RSI.
RSI Length (Default: 14): The period length for the RSI calculation.
Stochastic Length (Default: 8): The period length over which the stochastic calculation is performed.
Other Usage Notes and Limitations
To understand future price movement, this indicator assumes that 3 things must be known:
Evidence of a change of market structure. This can be demonstrated by increased volatility, consolidation, volume spikes (which can be tracked with the MW Volume Impulse Indicator) or, in the case of this indicator, candle wicks.
The potential cause of the change. It could be a VWAP line (which can be tracked with the Multi VWAP , and Multi VWAP from Gaps indicators), an event, an important support or resistance level, a key moving average, or many other things. This indicator assumes the ATR bands can be a cause.
The current position in the price cycle. Oscillators like the RSI, and MACD, are typical measures of price oscillation (other oscillators like the Price and Volume Stochastic Divergence indicator can also be useful). This indicator uses the Stochastic RSI oscillator to determine overbought and oversold conditions.
When evidence of the change appears, and the potential cause of the change is identified, and the price oscillation is at a favorable position for the desired trading direction, this indicator will generate a signal.
ATR Bands (or Keltner Channels) are used to determine when price might “revert to the mean”. Crossing, or being near the upper or lower band, can indicate an overbought or oversold condition, which could lead to a price reversal. By tracking the behavior of candle wicks during these events, we can see how active the battle is between buyers and sellers.
If the top of a wick is large, it may indicate that sellers are aggressively attempting to bring the price down. Conversely, if the bottom wick is large, it can indicate that buyers are actively trying to counter the price action caused by selling pressure.
When this wicking action occurs at times when price is not near the upper band, lower band, or baseline, it could indicate the presence of an important level. That could mean a nearby VWAP line, a supply or demand zone, a round price number, or a number of other factors. In any case, this wick may be the first indication of a price reversal.
Shorter baseline periods may be better for short period trading like scalping or day trading, while longer period baselines can show signals that are better suited to swing trading, or longer term investing.
It's important for traders to be aware of the limitations of any indicator and to use them as part of a broader, well-rounded trading strategy that includes risk management, fundamental analysis, and other tools that can help with reducing false signals, determining trend direction, and providing additional confirmation for a trade decision. Diversifying strategies and not relying solely on one type of indicator or analysis can help mitigate some of these risks.
The TradingView platform allows a maximum of 500 labels per chart. This means that if your settings allow for a lot of signals, labels for earlier ones may not appear if the total number of labels exceeds 500 for the chart.
Cerca negli script per "signal"

Range Breakout Signals (Intrabar) [LuxAlgo]The Range Breakout Signals (Intrabar) is a novel indicator highlighting trending/ranging intrabar candles and providing signals when the price breaks the extremities of a ranging intrabar candles.
🔶 USAGE
The indicator highlights candles with trending intrabar prices, with uptrending candles being highlighted in green, and down-trending candles being highlighted in red.
This highlighting is affected by the selected intrabar timeframe, with a lower timeframe returning a more precise estimation of a candle trending/ranging state.
When a candle intrabar prices are ranging the body of the candle is hidden from the chart, and one upper & lower extremities are displayed, the upper extremity is equal to the candle high and the lower extremity to the candle low. Price breaking one of these extremities generates a signal.
The indicator comes with two modes, "Trend Following" and "Reversal", these modes determine the extremities that need to be broken in order to return a signal. The "Trend Following" mode as its name suggests will provide trend-following signals, while "Reversal" will aim at providing early signals suggesting a potential reversal.
🔶 DETAILS
To determine if intrabar prices are trending or ranging we calculate the r-squared of the intrabar data, if the r-squared is above 0.5 it would suggest that lower time frame prices are trending, else ranging.
This approach allows almost obtaining a "settings" free indicator, which is uncommon. The intrabar timeframe setting only controls the intrabar precision, with a timeframe significantly lower than the chart timeframe returning more intrabar data as a result, this however might not necessarily affect the displayed information by the indicator.
🔶 SETTINGS
Intrabar Timeframe: Timeframe used to retrieve the intrabar data within a chart candle. Must be lower than the user chart timeframe.
Auto: Select the intrabar timeframe automatically. This setting is more adapted to intraday charts.
Mode: Signal generation mode.
Filter Out Successive Signals: Allows removing successive signals of the same type, returning a more easily readable chart.

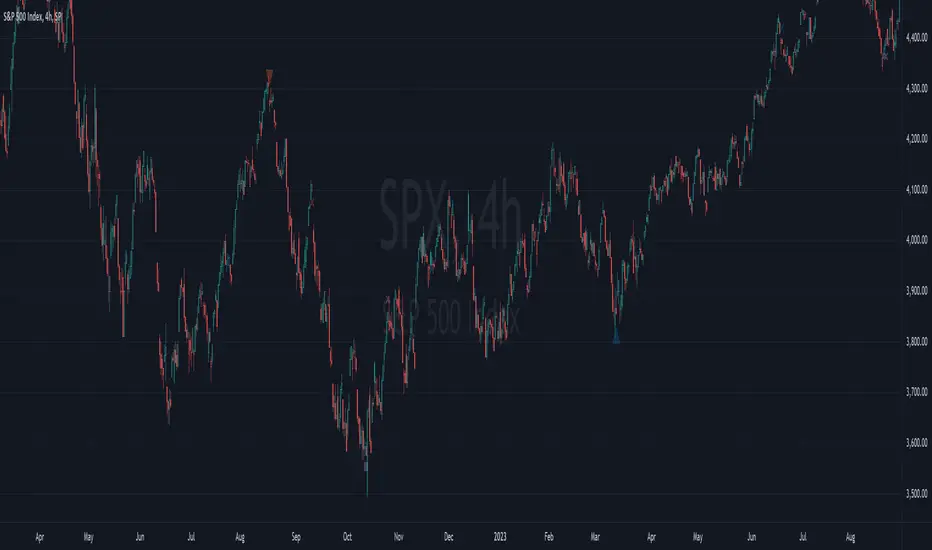
Diluted Earnings Per Share Signal [AstrideUnicorn]Earnings Per Share (EPS) is a financial metric closely monitored by investors. The so-called "positive earnings surprise" - a situation when EPS reading for a stock beats the value forecasted by analysts gives a bullish signal for this stock. The EPS reading lower than the analysts' estimate gives a bearish signal.
The Diluted Earnings Per Share (Diluted EPS) metric calculates a company's potential earnings per share value in the case if all convertible securities get converted to common shares. Convertible securities include preferred shares, stock options, warrants, convertible debt, etc. Diluted EPS is a more scientific way to estimate earnings per share, and it is usually lower than the ordinary EPS.
The Diluted EPS Signal indicator (DEPSS) is a fundamental indicator that calculates trading signals by comparing the Diluted EPS to the EPS Estimate. In many cases, Diluted EPS gives better insight into how a reported EPS reading may impact the stock price.
HOW TO USE
For each earnings date, the indicator calculates the Diluted Earnings Surprise percentage value :
Diluted Earnings Surprise = (Diluted EPS - EPS Estimate)/ EPS Estimate.
Diluted Earnings Surprise higher than the specified threshold value is a bullish signal. In this case, the indicator displays a green triangle pointing up.
Diluted Earnings Surprise lower than the specified threshold value is a bearish signal displayed as a red triangle pointing down.
As one can see on the chart, there are a lot of situations where EPS readings with green labels (the ones that beat analysts' estimates) lead to down moves. The DEPSS indicator can spot weak earnings and give opposite signals.
SETTINGS
Earnings Surprise Threshold (%) : the threshold value (in percentage units) for the Diluted Earnings Surprise. The calculated Diluted Earnings Surprise must be higher than Earnings Surprise Threshold to be considered a BUY signal or lower than minus Earnings Surprise Threshold to be considered a SELL signal. The default value for Earnings Surprise Threshold is 20%.

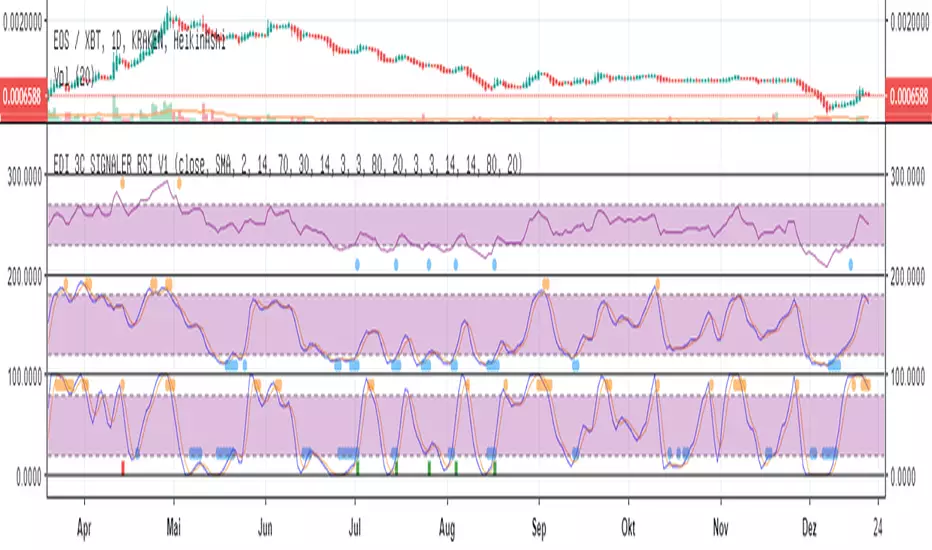
Eds Bot Signaler on Basis of RSI Stoch StochRSIEDS AWESOME BOT SIGNALER
Specially for use with e.g. 3commas or autoview
But can also be used just in normal manual (visual) mode
This Script is very early Beta. Works for visual manual use....
and also for 3Commas Bot as "Signaler" (how to connect with Bot, see the docu on 3commas).
... but can use as Signaler for any Bot who is able to get Tradingview sms-mails. (e.g. autoview)
It combines RSI, Stoch and Stoch-RSI.
You can choose normal RSI, or " returning RSI " (signals when leaving the sell/buy-zone. much higher profits with this)
You can choose how many of the indicators are needed to "fire".
You can choose if one of the indicators is a "must"
For Stoch & Stoch-RSI you can Choose sma or ema calculations of the moving average.
All the Values speak for themselves, if you are used to technical analyses (stay away in the moment, if you dont know, what rsi, stoch etc is used.
The Signals are also shown in the chart, the single ones, but also the combined which fires the Bot-Signal (shown as green and red column-candle at bottom)
Enjoy !! Free use in the moment.
More detailled Explanation in the future. Just play around!
If you wanna give something back:
BTC: 15buigKjh4JYnuVwcEWiYMpYvP3Lbp4ypL
Zero Lag Trend Signals (MTF) [Quant Trading] V7Overview
The Zero Lag Trend Signals (MTF) V7 is a comprehensive trend-following strategy that combines Zero Lag Exponential Moving Average (ZLEMA) with volatility-based bands to identify high-probability trade entries and exits. This strategy is designed to reduce lag inherent in traditional moving averages while incorporating dynamic risk management through ATR-based stops and multiple exit mechanisms.
This is a longer term horizon strategy that takes limited trades. It is not a high frequency trading and therefore will also have limited data and not > 100 trades.
How It Works
Core Signal Generation:
The strategy uses a Zero Lag EMA (ZLEMA) calculated by applying an EMA to price data that has been adjusted for lag:
Calculate lag period: floor((length - 1) / 2)
Apply lag correction: src + (src - src )
Calculate ZLEMA: EMA of lag-corrected price
Volatility bands are created using the highest ATR over a lookback period multiplied by a band multiplier. These bands are added to and subtracted from the ZLEMA line to create upper and lower boundaries.
Trend Detection:
The strategy maintains a trend variable that switches between bullish (1) and bearish (-1):
Long Signal: Triggers when price crosses above ZLEMA + volatility band
Short Signal: Triggers when price crosses below ZLEMA - volatility band
Optional ZLEMA Trend Confirmation:
When enabled, this filter requires ZLEMA to show directional momentum before entry:
Bullish Confirmation: ZLEMA must increase for 4 consecutive bars
Bearish Confirmation: ZLEMA must decrease for 4 consecutive bars
This additional filter helps avoid false signals in choppy or ranging markets.
Risk Management Features:
The strategy includes multiple stop-loss and take-profit mechanisms:
Volatility-Based Stops: Default stop-loss is placed at ZLEMA ± volatility band
ATR-Based Stops: Dynamic stop-loss calculated as entry price ± (ATR × multiplier)
ATR Trailing Stop: Ratcheting stop-loss that follows price but never moves against position
Risk-Reward Profit Target: Take-profit level set as a multiple of stop distance
Break-Even Stop: Moves stop to entry price after reaching specified R:R ratio
Trend-Based Exit: Closes position when price crosses EMA in opposite direction
Performance Tracking:
The strategy includes optional features for monitoring and analyzing trades:
Floating Statistics Table: Displays key metrics including win rate, GOA (Gain on Account), net P&L, and max drawdown
Trade Log Labels: Shows entry/exit prices, P&L, bars held, and exit reason for each closed trade
CSV Export Fields: Outputs trade data for external analysis
Default Strategy Settings
Commission & Slippage:
Commission: 0.1% per trade
Slippage: 3 ticks
Initial Capital: $1,000
Position Size: 100% of equity per trade
Main Calculation Parameters:
Length: 70 (range: 70-7000) - Controls ZLEMA calculation period
Band Multiplier: 1.2 - Adjusts width of volatility bands
Entry Conditions (All Disabled by Default):
Use ZLEMA Trend Confirmation: OFF - Requires ZLEMA directional momentum
Re-Enter on Long Trend: OFF - Allows multiple entries during sustained trends
Short Trades:
Allow Short Trades: OFF - Strategy is long-only by default
Performance Settings (All Disabled by Default):
Use Profit Target: OFF
Profit Target Risk-Reward Ratio: 2.0 (when enabled)
Dynamic TP/SL (All Disabled by Default):
Use ATR-Based Stop-Loss & Take-Profit: OFF
ATR Length: 14
Stop-Loss ATR Multiplier: 1.5
Profit Target ATR Multiplier: 2.5
Use ATR Trailing Stop: OFF
Trailing Stop ATR Multiplier: 1.5
Use Break-Even Stop-Loss: OFF
Move SL to Break-Even After RR: 1.5
Use Trend-Based Take Profit: OFF
EMA Exit Length: 9
Trade Data Display (All Disabled by Default):
Show Floating Stats Table: OFF
Show Trade Log Labels: OFF
Enable CSV Export: OFF
Trade Label Vertical Offset: 0.5
Backtesting Date Range:
Start Date: January 1, 2018
End Date: December 31, 2069
Important Usage Notes
Default Configuration: The strategy operates in its most basic form with default settings - using only ZLEMA crossovers with volatility bands and volatility-based stop-losses. All advanced features must be manually enabled.
Stop-Loss Priority: If multiple stop-loss methods are enabled simultaneously, the strategy will use whichever condition is hit first. ATR-based stops override volatility-based stops when enabled.
Long-Only by Default: Short trading is disabled by default. Enable "Allow Short Trades" to trade both directions.
Performance Monitoring: Enable the floating stats table and trade log labels to visualize strategy performance during backtesting.
Exit Mechanisms: The strategy can exit trades through multiple methods: stop-loss hit, take-profit reached, trend reversal, or trailing stop activation. The trade log identifies which exit method was used.
Re-Entry Logic: When "Re-Enter on Long Trend" is enabled with ZLEMA trend confirmation, the strategy can take multiple long positions during extended uptrends as long as all entry conditions remain valid.
Capital Efficiency: Default setting uses 100% of equity per trade. Adjust "default_qty_value" to manage position sizing based on risk tolerance.
Realistic Backtesting: Strategy includes commission (0.1%) and slippage (3 ticks) to provide realistic performance expectations. These values should be adjusted based on your broker and market conditions.
Recommended Use Cases
Trending Markets: Best suited for markets with clear directional moves where trend-following strategies excel
Medium to Long-Term Trading: The default length of 70 makes this strategy more appropriate for swing trading rather than scalping
Risk-Conscious Traders: Multiple stop-loss options allow traders to customize risk management to their comfort level
Backtesting & Optimization: Comprehensive performance tracking features make this strategy ideal for testing different parameter combinations
Limitations & Considerations
Like all trend-following strategies, performance may suffer in choppy or ranging markets
Default 100% position sizing means full capital exposure per trade - consider reducing for conservative risk management
Higher length values (70+) reduce signal frequency but may improve signal quality
Multiple simultaneous risk management features may create conflicting exit signals
Past performance shown in backtests does not guarantee future results
Customization Tips
For more aggressive trading:
Reduce length parameter (minimum 70)
Decrease band multiplier for tighter bands
Enable short trades
Use lower profit target R:R ratios
For more conservative trading:
Increase length parameter
Enable ZLEMA trend confirmation
Use wider ATR stop-loss multipliers
Enable break-even stop-loss
Reduce position size from 100% default
For optimal choppy market performance:
Enable ZLEMA trend confirmation
Increase band multiplier
Use tighter profit targets
Avoid re-entry on trend continuation
Visual Elements
The strategy plots several elements on the chart:
ZLEMA line (color-coded by trend direction)
Upper and lower volatility bands
Long entry markers (green triangles)
Short entry markers (red triangles, when enabled)
Stop-loss levels (when positions are open)
Take-profit levels (when enabled and positions are open)
Trailing stop lines (when enabled and positions are open)
Optional ZLEMA trend markers (triangles at highs/lows)
Optional trade log labels showing complete trade information
Exit Reason Codes (for CSV Export)
When CSV export is enabled, exit reasons are coded as:
0 = Manual/Other
1 = Trailing Stop-Loss
2 = Profit Target
3 = ATR Stop-Loss
4 = Trend Change
Conclusion
Zero Lag Trend Signals V7 provides a robust framework for trend-following with extensive customization options. The strategy balances simplicity in its core logic with sophisticated risk management features, making it suitable for both beginner and advanced traders. By reducing moving average lag while incorporating volatility-based signals, it aims to capture trends earlier while managing risk through multiple configurable exit mechanisms.
The modular design allows traders to start with basic trend-following and progressively add complexity through ZLEMA confirmation, multiple stop-loss methods, and advanced exit strategies. Comprehensive performance tracking and export capabilities make this strategy an excellent tool for systematic testing and optimization.
Note: This strategy is provided for educational and backtesting purposes. All trading involves risk. Past performance does not guarantee future results. Always test thoroughly with paper trading before risking real capital, and adjust position sizing and risk parameters according to your risk tolerance and account size.
================================================================================
TAGS:
================================================================================
trend following, ZLEMA, zero lag, volatility bands, ATR stops, risk management, swing trading, momentum, trend confirmation, backtesting
================================================================================
CATEGORY:
================================================================================
Strategies
================================================================================
CHART SETUP RECOMMENDATIONS:
================================================================================
For optimal visualization when publishing:
Use a clean chart with no other indicators overlaid
Select a timeframe that shows multiple trade signals (4H or Daily recommended)
Choose a trending asset (crypto, forex major pairs, or trending stocks work well)
Show at least 6-12 months of data to demonstrate strategy across different market conditions
Enable the floating stats table to display key performance metrics
Ensure all indicator lines (ZLEMA, bands, stops) are clearly visible
Use the default chart type (candlesticks) - avoid Heikin Ashi, Renko, etc.
Make sure symbol information and timeframe are clearly visible
================================================================================
COMPLIANCE NOTES:
================================================================================
✅ Open-source publication with complete code visibility
✅ English-only title and description
✅ Detailed explanation of methodology and calculations
✅ Realistic commission (0.1%) and slippage (3 ticks) included
✅ All default parameters clearly documented
✅ Performance limitations and risks disclosed
✅ No unrealistic claims about performance
✅ No guaranteed results promised
✅ Appropriate for public library (original trend-following implementation with ZLEMA)
✅ Educational disclaimers included
✅ All features explained in detail
================================================================================

Estimated Manipulation Movement Signal [AlgoPoint]Follow the Footprints of Whale Movements That Drive the Market
Overview
The market is not always driven by natural supply and demand. Large players—often called "whales" or institutions—can create artificial price movements to trigger stop-losses, induce panic or FOMO, and build their large positions at favorable prices. These events are known as "stop hunts" or "liquidity grabs."
The EMMS indicator is a specialized tool designed to detect these specific moments of potential market manipulation. It does not follow trends in a traditional sense; instead, it identifies high-probability reversal points created by the calculated actions of Smart Money trapping other market participants.
How It Works: The 3-Module Logic
The indicator uses a multi-stage confirmation process to identify a potential stop hunt:
1. Anomaly Detection: The engine first scans the chart for "Anomaly Candles." These are candles with unusually high volume and a very long wick relative to their body. This combination signals a sudden, forceful, and potentially unnatural price push.
2. Liquidity Zone Detection: The indicator automatically identifies and tracks recent significant swing highs and lows. These levels are considered "Liquidity Zones" because they are areas where a large number of stop-loss orders are likely clustered. These are the "hunting grounds" for whales.
3. The Stop Hunt Signal: A final signal is generated only when these two events align in a specific sequence:
An Anomaly Candle (high volume, long wick) spikes through a previously identified Liquidity Zone.
The same candle then reverses, closing back inside the previous price range.
This sequence confirms that the move was likely a "trap" designed to engineer liquidity, and a reversal in the opposite direction is now highly probable.
How to Interpret & Use This Indicator
BUY Signal: A BUY signal appears after a sharp price drop that pierces a recent swing low (taking out the stops of long positions) and then aggressively reverses to close higher. This suggests that Smart Money has absorbed the panic selling they just induced. The signal indicates a potential move UP.
SELL Signal: A SELL signal appears after a sharp price spike that pierces a recent swing high (taking out the stops of short positions) and then aggressively reverses to close lower. This suggests that Smart Money has sold into the FOMO buying they just created. The signal indicates a potential move DOWN.
This indicator is best used as a high-probability confirmation tool, ideally in conjunction with your understanding of the overall market trend and structure.

Weekly RSI Buy/Sell SignalsWeekly RSI Buy/Sell Signal Indicator
This indicator is designed to help traders identify high-probability buy and sell opportunities on the weekly chart by using the Relative Strength Index (RSI). By utilizing weekly RSI values, this indicator ensures signals align with broader market trends, providing a clearer view of potential price reversals and continuation.
How It Works:
Weekly RSI Calculation: This script calculates the RSI using a 14-period setting, focusing on the weekly timeframe regardless of the user’s current chart view. The weekly RSI is derived using request.security, allowing for consistent signals even on intraday charts.
Signal Conditions:
Buy Signal: A buy signal appears when the RSI crosses above the oversold threshold of 30, suggesting that price may be gaining momentum after a potential bottom.
Sell Signal: A sell signal triggers when the RSI crosses below the overbought threshold of 70, indicating a possible momentum shift downwards.
Visual Cues:
Buy/Sell Markers: Clear green "BUY" and red "SELL" markers are displayed on the chart when buy or sell conditions are met, making it easy to identify entry and exit points.
RSI Line and Thresholds: The weekly RSI value is plotted in real time with color-coded horizontal lines at 30 (oversold) and 70 (overbought), providing a visual reference for key levels.
This indicator is ideal for traders looking for reliable, trend-based signals on higher timeframes and can be a helpful tool for filtering out shorter-term market noise.

Buy/Sell Signals [WynTrader]Hello dear Friend
Here is a new version ( B-S_251121_wt ) of my Buy/Sell Signals indicator.
Some calculation updates and useful enhancements have been applied.
Concepts
This Buy/Sell Signals indicator generates Buy/Sell signals as accurately as possible, identifying trend changes. Compared to other tools that detect trend shifts, this one is simple, easy to use, and demonstrates its efficiency on its own.
- Its features are carefully designed to minimize false signals while ensuring optimal signal placement.
- The Table results allow you to quickly evaluate signal performance, both on their own and compared to a Buy & Hold strategy.
- The Table calculations are fully synchronized with the visible chart (WYSIWYG – What You See Is What You Get). You can also scroll the chart across different date ranges to see how a stock or product performs under various market conditions.
- Seeing Buy/Sell signals on a chart is appealing, but assessing their performance in a Table makes it even more convincing. And without running a full backtest, you can get a clear overview of overall performance immediately.
Features
This indicator generates Buy/Sell signals using:
- Fast and Slow Moving Averages (adjustable).
- Bollinger Bands (adjustable).
- Filters (optional, adjustable) to refine signals, including : Bollinger Bands Lookback Trend Filter; High-Low vs Candle Range Threshold %; Distance from Fast and Slow MAs Threshold %.
- Results are displayed in a Table on the chart, based on the currently visible start and end dates.
Functionality
- The indicator aims to confirm trend changes through timely Buy/Sell signals.
- It uses two Moving Averages and Bollinger Bands, combined with filters such as BB Lookback, -- The variable settings have been tested with a mix of manual and AI testing to find the optimal configuration. You can adjust the variables to suit your goals.
- The design is simple, with clear parameters and instant readability of Buy/Sell Signals on the chart and in the Table results, without complex interpretation needed.
- It works effectively by requiring both trend confirmation and volatility control management.
- Signals are timed to be as accurate as possible, avoiding futile weak or false ones.
- A Table shows the effectiveness of the signals on the current visible chart, providing immediate, realistic feedback. The Buy & Hold strategy results are also included for comparison with the Buy/Sell swing strategy. The Buy & Hold results start from the first Buy signal to ensure a fair comparison.
- Changing the parameters instantly updates the Table, giving a quick, at-a-glance performance check.
Caution
- No technical tool is perfect; it cannot predict disasters, wars, or the actions of large fund managers or short sellers.
- After testing thousands of TradingView indicators over 24 years, I’ve found none to be 100% accurate all the time.
- This Buy/Sell Signals indicator may outperform some others but is still not perfect.
So, just be aware, and don’t be fooled by this tool.

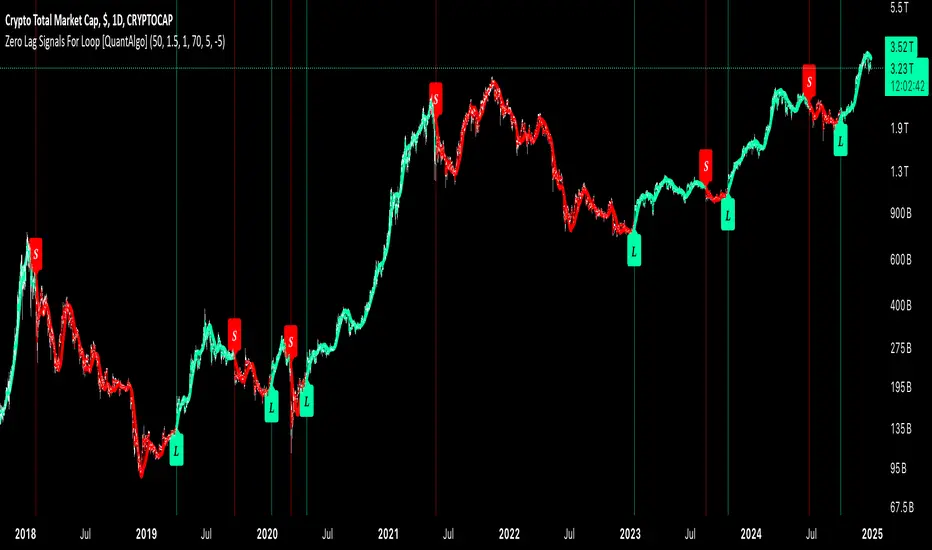
Zero Lag Signals For Loop [QuantAlgo]Elevate your trend-following investing and trading strategy with Zero Lag Signals For Loop by QuantAlgo , a simple yet effective technical indicator that merges advanced zero-lag mechanism with adaptive trend analysis to bring you a fresh take on market momentum tracking. Its aim is to support both medium- to long-term investors monitoring broader market shifts and precision-focused traders seeking quality entries through its dual-focused analysis approach!
🟢 Core Architecture
The foundation of this indicator rests on its zero-lag implementation and dynamic trend assessment. By utilizing a loop-driven scoring system alongside volatility-based filtering, each market movement is evaluated through multiple historical lenses while accounting for current market conditions. This multi-layered approach helps differentiate between genuine trend movements and market noise across timeframe and asset classes.
🟢 Technical Foundation
Three distinct components of this indicator are:
Zero Lag EMA : An enhanced moving average calculation designed to minimize traditional lag effects
For Loop Scoring System : A comprehensive scoring mechanism that weighs current price action against historical contexts
Dynamic Volatility Analysis : A sophisticated ATR-based filter that adjusts signal sensitivity to market conditions
🟢 Key Features & Signals
The Zero Lag Signals For Loop provides market insights through:
Color-coded Zero Lag line that adapts to trend direction
Dynamic fills between price and Zero Lag basis for enhanced visualization
Trend change markers (L/S) that highlight potential reversal points
Smart bar coloring that helps visualize market momentum
Background color changes with vertical lines at significant trend shifts
Customizable alerts for both bullish and bearish reversals
🟢 Practical Usage Tips
Here's how you can get the most out of the Zero Lag Signals For Loop :
1/ Setup:
Add the indicator to your TradingView chart by clicking on the star icon to add it to your favorites ⭐️
Start with the default Zero Lag length for balanced sensitivity
Use the standard volatility multiplier for proper filtering
Keep the default loop range for comprehensive trend analysis
Adjust threshold levels based on your investing and/or trading style
2/ Reading Signals:
Watch for L/S markers - they indicate validated trend reversals
Pay attention to Zero Lag line color changes - they confirm trend direction
Monitor bar colors for additional trend confirmation
Configure alerts for trend changes in both bullish and bearish directions, ensuring you can act on significant technical developments promptly.
🟢 Pro Tips
Fine-tune the Zero Lag length based on your timeframe:
→ Lower values (20-40) for more responsive signals
→ Higher values (60-100) for stronger trend confirmation
Adjust volatility multiplier based on market conditions:
→ Increase multiplier in volatile markets
→ Decrease multiplier in stable trending markets
Combine with:
→ Volume analysis for trade validation
→ Multiple timeframe analysis for broader context
→ Other technical tools for comprehensive analysis
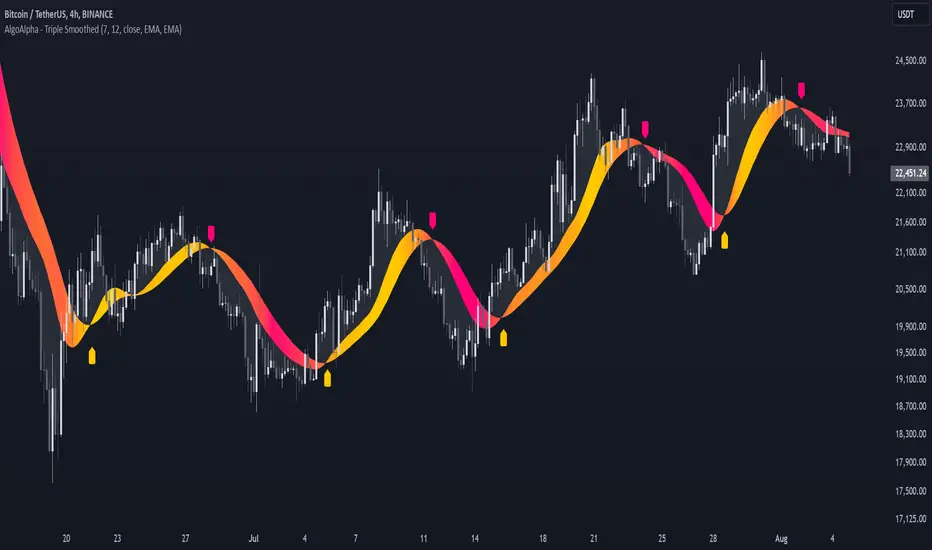
Triple Smoothed Signals [AlgoAlpha]Introducing the Triple Smoothed Signals indicator by AlgoAlpha, a powerful tool designed to help traders identify trend direction and market momentum with greater accuracy. By applying triple smoothing techniques to your chosen data source, this indicator filters out market noise, allowing you to focus on significant price movements. Perfect for traders looking to enhance their technical analysis and gain an edge in the markets.
Key Features
🎨 Customizable Moving Averages : Choose between EMA, SMA, RMA, or WMA for both the triple smoothing and the signal line to tailor the indicator to your trading style.
🛠 Adjustable Smoothing Lengths : Configure the main smoothing length and signal length to fit different timeframes and market conditions.
🌈 Dynamic Color Fills : Visual gradients and fills highlight trend strength and direction, making chart analysis more intuitive.
🔔 Alerts : Set alerts for bullish and bearish crossover signals to stay ahead of market moves without constant chart monitoring.
📈 Clear Signal Visualization : Bullish and bearish signals are plotted directly on your chart for easy interpretation and timely decision-making.
Quick Guide to Using the Triple Smoothed Signals Indicator
🛠 Add the Indicator : Add the indicator to your TradingView chart by clicking on the star icon to add it to your favorites. Customize the settings such as the main smoothing length, signal length, data source, and moving average types to match your trading strategy.
📊 Market Analysis : Monitor the crossovers between the triple smoothed moving average and the signal line. A bullish signal is generated when the signal line crosses under the triple smoothed MA, indicating a potential upward trend. Conversely, a bearish signal occurs when the signal line crosses over the triple smoothed MA, suggesting a possible downward trend.
🔔 Alerts : Enable notifications for reversal signals and trend shifts to stay informed about market movements without constantly monitoring the chart.
How It Works
The Triple Smoothed Signals indicator enhances trend detection by applying a triple smoothing process to your selected data source using the moving average type of your choice (EMA, SMA, RMA, or WMA). This triple smoothed moving average (v1) effectively reduces short-term fluctuations and noise, revealing the underlying market trend. A signal line (v2) is then calculated by smoothing the triple smoothed MA with a separate moving average, further refining the signal. The indicator calculates the normalized distance between the triple smoothed MA and the signal line over a specified period, which is used to create dynamic color gradients and fills on the chart. These visual elements provide immediate insight into trend strength and direction. Bullish and bearish signals are generated based on the crossovers between the signal line and the triple smoothed MA, and are plotted directly on the chart along with customizable alerts to assist traders in making timely decisions.
Fibonacci Buy /Sell SignalsHere is a Fibonacci-based Buy/Sell Indicator using retracement levels for potential support and resistance zones. This indicator plots Fibonacci levels and provides buy/sell signals based on price interaction with these levels.
Fibonacci Levels:
Highest high and lowest low over the lookback period.
Key levels: 38.2% (retracement), 50% (midpoint), 61.8% (strong retracement).
Buy Signal: When the price crosses above the 61.8% Fibonacci level (bullish).
Sell Signal: When the price crosses below the 38.2% Fibonacci level (bearish).

Inversion Fair Value Gaps [TradingFinder] IFVG ICT Signal| Alert🔵 Introduction
🟣 Inversion Fair Value Gap (IFVG)
An ICT Inversion Fair Value Gap, or reverse FVG, occurs when a fair value gap fails to hold its price, resulting in the price moving beyond and breaking the gap. This situation marks the initial change in price momentum.
Generally, prices respect fair value gaps and continue in their trend direction. However, when a fair value gap is breached, it transforms into an inversion fair value gap, signaling a potential short-term reversal or a subsequent change in direction.
🔵 How to Use
🟣 Identifying an Inversion Fair Value Gap
To spot an IFVG, you must first identify a fair value gap.
Inversion fair value gaps can be categorized into two types :
🟣 Bullish Inversion Fair Value Gap
A bullish IFVG occurs when a bearish fair value gap is invalidated by the price closing above it.
Steps to identify it :
Identify a bearish fair value gap.
When the price closes above this gap, it becomes a bullish inversion fair value gap.
This gap acts as a support level, pushing the price upwards and indicating a shift in momentum from sellers to buyers.
🟣 Bearish Inversion Fair Value Gap
A bearish IFVG happens when a bullish fair value gap fails, with the price closing below it.
Steps to identify it :
Identify a bullish fair value gap.
When the price closes below this gap, it becomes a bearish inversion fair value gap.
This gap acts as a resistance level, pushing the price downwards and indicating a shift in momentum from buyers to sellers.
🔵 Settings
🟣 Global Settings
Show All Inversion FVG: If disabled, only the most recent FVG will be displayed.
IFVG Validity Period (Bar): Determines the maximum duration (in number of candles) that the FVG and IFVG remain valid.Switching Colors Theme Mode: Includes three modes: "Off", "Light", and "Dark". "Light" mode adjusts colors for light mode use, "Dark" mode adjusts colors for dark mode use, and "Off" disables color adjustments.
🟣 Logic Settings
FVG Filter : This refines the number of identified FVG areas based on a specified algorithm to focus on higher quality signals and reduce noise.
Types of FVG filters :
Very Aggressive Filter : Adds a condition where, for an upward FVG, the last candle's highest price must exceed the middle candle's highest price, and for a downward FVG, the last candle's lowest price must be lower than the middle candle's lowest price. This minimally filters out FVGs.
Aggressive Filte r: Builds on the Very Aggressive mode by ensuring the middle candle is not too small, filtering out more FVGs.
Defensive Filter : Adds criteria regarding the size and structure of the middle candle, requiring it to have a substantial body and specific polarity conditions, filtering out a significant number of FVGs.
Very Defensive Filter : Further refines filtering by ensuring the first and third candles are not small-bodied doji candles, retaining only the highest quality signals.
Mitigation Level FVG and IFVG : Options include "Proximal", "Distal", or "50 % OB" modes, which you can choose based on your needs. The "50 % OB" line is the midpoint between distal and proximal.
🟣 Display Settings
Show Bullish IFVG : Toggles the display of demand-related boxes.
Show Bearish IFVG : Toggles the display of supply-related boxes.
🟣 Alert Settings
Alert Inversion FVG Mitigation : Enables alerts for Inversion FVG mitigation.
Message Frequency : Determines the frequency of alerts. Options include 'All' (every function call), 'Once Per Bar' (first call within the bar), and 'Once Per Bar Close' (final script execution of the real-time bar). Default is 'Once per Bar'.
Show Alert Time by Time Zone : Configures the time zone for alert messages. Default is 'UTC'.
Display More Info : Provides additional details in alert messages, including price range, date, hour, and minute. Set to 'Off' to exclude this information.

No Code SignalsNo Code Signals is an intuitive user interface for users to generate their own signals based on indicators they already have applied to their chart.
This indicator makes use of the new input.source() limits for importing data from external sources (indicators) into 1 indicator.
You are now able to import ANY number of sources from up to 10 different indicators.
Features:
- Import up to 10 unique values from up to 10 different indicators already on your chart!
- Compare those values against other imported indicator values, or chart ohlc values.
- Option to use a defined level instead of an active source.
- 5 Signal Options (Currently)
- Alerts, Each signal has its own alert condition.
- Labeled Signals, to tell which signal is which.
Potential Future Plans:
- More Signals & Analysis Options
- Possibly more imports
- Combining 2 (or more) signals into 1
Here is a Screenshot of a chart with signals, and the Interface creating the signals.
Enjoy!

Click Signal IndicatorThis is a Signal Indicator that emits signals based on mouse clicks when the indicator is added to the chart, or later on in the "Settings/Inputs" tab by changing/selecting the open time of the desired bar of each one of the signals.
It is designed to be used as an External Input for the "Template Trailing Strategy" to verify the correctness of the features the aforementioned script offers, and to provide an easy way to play around with this framework.
Last but not least this script offers a way to debug and report problems when this is necessary. Moreover, this script is a simple example you can copy-paste and create your own custom signal indicator that can be "plugged into"
the "Template Trailing Strategy" taking advantage of all the fancy stuff the TTS framework can provide!
To connect this signal indicator to the TTS you have to change the "Deal Conditions Mode" to '🔨External' and the 'External Input 🛈➡' to 'CSI:🔌Signal' in the TTS "Settings/Inputs" tab. For more information check the "Template Trailing Strategy - Part 02" video tutorial.
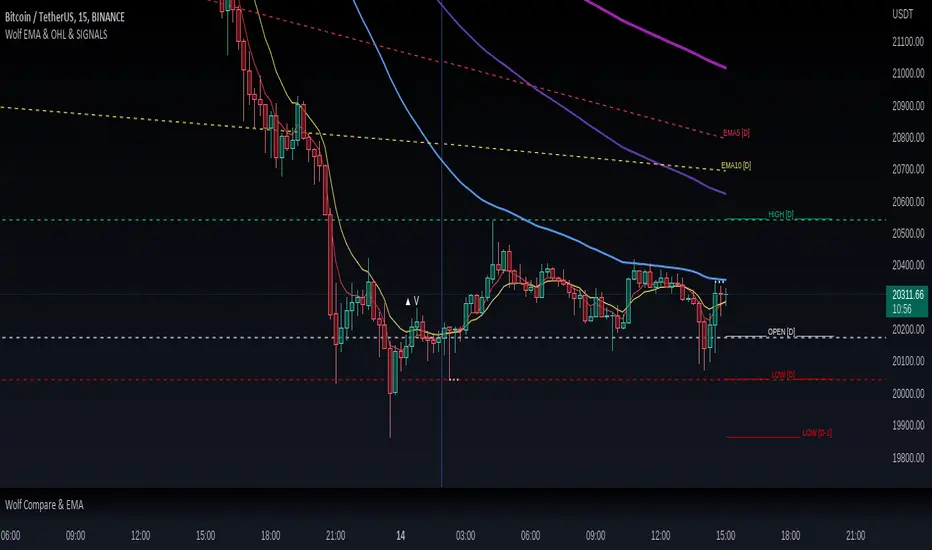
Wolf EMA & OHL & SIGNALSWolf EMA & OHL & SIGNALS
this indicator is mainly used for fast trading techniques (scalping). provides various tools for comprehensive trend analysis.
5 EMAs are used to have possible market entry or exit signals.
EMA
Thanks to the combination of the EMAs of different timeframes,
you can immediately get an idea of the resistances or supports
of the higher timeframes.
HOL
Lines are drawn on the right side indicating the maximum, minimum and opening
of the day, past day, week and past week respectively.
These levels are excellent as price acceleration points.
SIGNALS
There are three types of signals that are monitored by this indicator:
- Shimano
This signal is generated if the price remains compressed between two EMAs, more precisely between the third and the fifth, at the point where the price breaks one of these EMAs there can be a strong price movement.
- Viagra
This signal is generated if the price remains below the second EMA for a long time without ever closing above / below, at the point where it closes by climbing over the EMA there may be a change in trend.
-Bud
This signal is generated if a positive candle is formed and subsequently at least two that close within the high and low of the positive candle. Where the price breaks through the high of the positive candle is a great entry point.
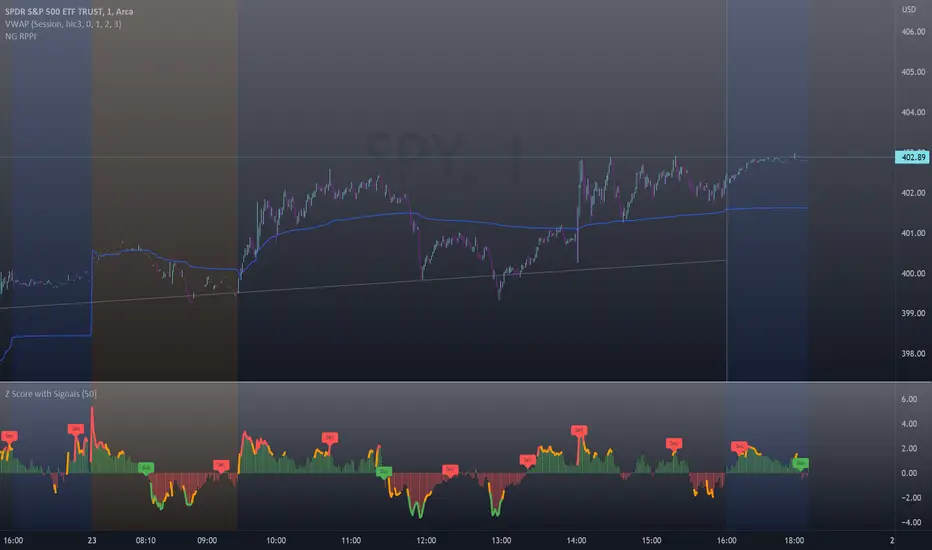
Z-Score with Buy & Sell SignalsThis is my open-source indicator of z-score with buy and sell indicators.
I see there are other z-score indicators, I just am particular about how I like my z-scores calculated and so decided to make my own and add buy and sell signals to help guide me. And I figured I could share it openly here!
What is a Z-Score
A z-score is a statistical measures of the distance, in standard deviations, a value is from its given mean. It is expressed as a standard deviation (or SD). The further a value (in this case, a stock) is from their mean, the more likely a regression to the mean is possible (i.e. a return to the average). So if a stock is trading at 3 standard deviations away from its mean, then we can anticipate it wanting to regress back towards 1 to 0 standard deviations from its mean (i.e. sell off back to a value that brings it closer to that SD).
The inverse is true if it is trading below.
Z-Scores and Stocks
Stocks, like everything in nature, like to trade between -1 and +1 SD away from its mean. Anything above this, we can interpret that there is "stress" on the stock. Anything over 2.50 is tremendous stress on the stock and we can anticipate that it will want to revert to its mean in the near future and bring that value down to at least 1, ideally between the -0.5 and 0.5 range.
Please note, I set the standard VERY high for the indicator to issue a buy and sell signal (/=2.50). Lately with the volatility, stocks have been entering these ranges frequently and so there have been plenty of signals, but traditionally in a stable environment you may not get these signals. I set the bar extremely high because I want to avoid false buy and sell signals (you will still get them though, nothing is perfect!). So the value in this indicator is in interpreting the actual z-score itself, so please be sure you understand exactly what the Z-score is (see the description above).
How the indicator works
The indicator works by calculating the average Z-Score between a stocks high and low. This indicator will present the average deviation a stock has from its high and low average. The higher the Z-Score, the more "overbought" the stock is. The lower the z-score, the more "oversold" the stock is. It uses the previous 500 candles worth of data to calculate its SMA and its Standard deviation in order to calculate the z-score.
Anytime a stock trades 2.50 SDs or more above or below its mean, you will be presented with a Buy or Sell signal, as generally, statistically speaking, after something has travelled 2.50 SDs aware from its mean, there is an increased probability of a reversion happening.
You can use this indicator to determine whether the stock is trading within normal parameters or not and to help you in your analysis as to whether or not a stock could be shorted or longed.
I personally like this for swing trading on the 1 hour chart; however, this can be used on any time from 1 minute to 1 hour. It also allows you to track a stocks progress in its reversion to the mean.
Examples of it in Use:
Gold ETF (ARCA: GLD) on 1 minute
Dow Jones ETF (ARCA: DIA) on 1 minute (my favourite Stock!)
SPY ETF (ARCA: SPY) on 1 hour chart
Disclaimer:
This is not meant to be placed as a sole and single strategy. It should be used in COJUNCTION with your other strategies to help you make a determination.
No indicator is infallible and should never be relied on 100%!
Please let me know your questions/comments/experiences/recommendations below!
Thanks everyone!
[pp] Signal GeneratorResearch and Development Tool.
For anyone who is familiar with working with digital signals (audio/electrical engineers) you might appreciate this Signal Generator.
You can select and vary 4 different types of signals.
Logistic Map
If you're not familiar with the logistic map, then go watch a youtube video. By default the equation is meant to represent chaos and is a good alternative for random number generation.
Random
This uses the built-in random number generator. I'm not sure if it's better to use this or the logmap default settings. Either way, you have a choice.
Unit Impulse
Good for creating a transient impulse.
Step Impulse
Similar to the unit impulse. Except constant and not a transient.
Synthesizer
It comes with 4 wave functions (Sine, Triangle, Square, Saw) that can be combined for additive synthesis. Each wave function contains its own respective phase and amplitude control.
Credits
Many of these functions were taken from www.pinecoders.com with the exception of the logistic map. I simply aggregated them all into this toolkit for ease of use.
How to use
This is not a trading indicator. This is meant to be used for research and development. You could use it to test strategies, by generating white noise with the logmap and creating trading signals. Or you could use it for teaching and learning. Using the constant data as a dependable, repeatable resource.

Luxy Adaptive MA Cloud - Trend Strength & Signal Tracker V2Luxy Adaptive MA Cloud - Professional Trend Strength & Signal Tracker
Next-generation moving average cloud indicator combining ultra-smooth gradient visualization with intelligent momentum detection. Built for traders who demand clarity, precision, and actionable insights.
═══════════════════════════════════════════════
WHAT MAKES THIS INDICATOR SPECIAL?
═══════════════════════════════════════════════
Unlike traditional MA indicators that show static lines, Luxy Adaptive MA Cloud creates a living, breathing visualization of market momentum. Here's what sets it apart:
Exponential Gradient Technology
This isn't just a simple fill between two lines. It's a professionally engineered gradient system with 26 precision layers using exponential density distribution. The result? An organic, cloud-like appearance where the center is dramatically darker (15% transparency - where crossovers and price action occur), while edges fade gracefully (75% transparency). Think of it as a visual "heat map" of trend strength.
Dynamic Momentum Intelligence
Most MA clouds only show structure (which MA is on top). This indicator shows momentum strength in real-time through four intelligent states:
- 🟢 Bright Green = Explosive bullish momentum (both MAs rising strongly)
- 🔵 Blue = Weakening bullish (structure intact, but momentum fading)
- 🟠 Orange = Caution zone (bearish structure forming, weak momentum)
- 🔴 Deep Red = Strong bearish momentum (both MAs falling)
The cloud literally tells you when trends are accelerating or losing steam.
Conditional Performance Architecture
Every calculation is optimized for speed. Disable a feature? It stops calculating entirely—not just hidden, but not computed . The 26-layer gradient only renders when enabled. Toggle signals off? Those crossover checks don't run. This makes it one of the most efficient cloud indicators available, even with its advanced visual system.
Zero Repaint Guarantee
All signals and momentum states are based on confirmed bar data only . What you see in historical data is exactly what you would have seen trading live. No lookahead bias. No repainting tricks. No signals that "magically" appear perfect in hindsight. If a signal shows in history, it would have triggered in real-time at that exact moment.
Educational by Design
Every single input includes comprehensive tooltips with:
- Clear explanations of what each parameter does
- Practical examples of when to use different settings
- Recommended configurations for scalping, day trading, and swing trading
- Real-world trading impact ("This affects entry timing" vs "This is visual only")
You're not just getting an indicator—you're learning how to use it effectively .
═══════════════════════════════════════════════
THE GRADIENT CLOUD - TECHNICAL DETAILS
═══════════════════════════════════════════════
Architecture:
26 precision layers for silk-smooth transitions
Exponential density curve - layers packed tightly near center (where crossovers happen), spread wider at edges
75%-15% transparency range - center is highly opaque (15%), edges fade gracefully (75%)
V-Gradient design - emphasizes the action zone between Fast and Medium MAs
The Four Momentum States:
🟢 GREEN - Strong Bullish
Fast MA above Medium MA
Both MAs rising with momentum > 0.02%
Action: Enter/hold LONG positions, strong uptrend confirmed
🔵 BLUE - Weak Bullish
Fast MA above Medium MA
Weak or flat momentum
Action: Caution - bullish structure but losing strength, consider trailing stops
🟠 ORANGE - Weak Bearish
Medium MA above Fast MA
Weak or flat momentum
Action: Warning - bearish structure developing, consider exits
🔴 RED - Strong Bearish
Medium MA above Fast MA
Both MAs falling with momentum < -0.02%
Action: Enter/hold SHORT positions, strong downtrend confirmed
Smooth Transitions: The momentum score is smoothed using an 8-bar EMA to eliminate noise and prevent whipsaws. You see the true trend , not every minor fluctuation.
═══════════════════════════════════════════════
FLEXIBLE MOVING AVERAGE SYSTEM
═══════════════════════════════════════════════
Three Customizable MAs:
Fast MA (default: EMA 10) - Reacts quickly to price changes, defines short-term momentum
Medium MA (default: EMA 20) - Balances responsiveness with stability, core trend reference
Slow MA (default: SMA 200, optional) - Long-term trend filter, major support/resistance
Six MA Types Available:
EMA - Exponential; faster response, ideal for momentum and day trading
SMA - Simple; smooth and stable, best for swing trading and trend following
WMA - Weighted; middle ground between EMA and SMA
VWMA - Volume-weighted; reflects market participation, useful for liquid markets
RMA - Wilder's smoothing; used in RSI/ADX, excellent for trend filters
HMA - Hull; extremely responsive with minimal lag, aggressive option
Recommended Settings by Trading Style:
Scalping (1m-5m):
Fast: EMA(5-8)
Medium: EMA(10-15)
Slow: Not needed or EMA(50)
Day Trading (5m-1h):
Fast: EMA(10-12)
Medium: EMA(20-21)
Slow: SMA(200) for bias
Swing Trading (4h-1D):
Fast: EMA(10-20)
Medium: EMA(34-50)
Slow: SMA(200)
Pro Tip: Start with Fast < Medium < Slow lengths. The gradient works best when there's clear separation between Fast and Medium MAs.
═══════════════════════════════════════════════
CROSSOVER SIGNALS - CLEAN & RELIABLE
═══════════════════════════════════════════════
Golden Cross ⬆ LONG Signal
Fast MA crosses above Medium MA
Classic bullish reversal or trend continuation signal
Most reliable when accompanied by GREEN cloud (strong momentum)
Death Cross ⬇ SHORT Signal
Fast MA crosses below Medium MA
Classic bearish reversal or trend continuation signal
Most reliable when accompanied by RED cloud (strong momentum)
Signal Intelligence:
Anti-spam filter - Minimum 5 bars between signals prevents noise
Clean labels - Placed precisely at crossover points
Alert-ready - Built-in ALERTS for automated trading systems
No repainting - Signals based on confirmed bars only
Signal Quality Assessment:
High-Quality Entry:
Golden Cross + GREEN cloud + Price above both MAs
= Strong bullish setup ✓
Low-Quality Entry (skip or wait):
Golden Cross + ORANGE cloud + Choppy price action
= Weak bullish setup, likely whipsaw ✗
═══════════════════════════════════════════════
REAL-TIME INFO PANEL
═══════════════════════════════════════════════
An at-a-glance dashboard showing:
Trend Strength Indicator:
Visual display of current momentum state
Color-coded header matching cloud color
Instant recognition of market bias
MA Distance Table:
Shows percentage distance of price from each enabled MA:
Green rows : Price ABOVE MA (bullish)
Red rows : Price BELOW MA (bearish)
Gray rows : Price AT MA (rare, decision point)
Distance Interpretation:
+2% to +5%: Healthy uptrend
+5% to +10%: Getting extended, caution
+10%+: Overextended, expect pullback
-2% to -5%: Testing support
-5% to -10%: Oversold zone
-10%+: Deep correction or downtrend
Customization:
4 corner positions
5 font sizes (Tiny to Huge)
Toggle visibility on/off
═══════════════════════════════════════════════
HOW TO USE - PRACTICAL TRADING GUIDE
═══════════════════════════════════════════════
STRATEGY 1: Trend Following
Identify trend : Wait for GREEN (bullish) or RED (bearish) cloud
Enter on signal : Golden Cross in GREEN cloud = LONG, Death Cross in RED cloud = SHORT
Hold position : While cloud maintains color
Exit signals :
• Cloud turns ORANGE/BLUE = momentum weakening, tighten stops
• Opposite crossover = close position
• Cloud turns opposite color = full reversal
STRATEGY 2: Pullback Entries
Confirm trend : GREEN cloud established (bullish bias)
Wait for pullback : Price touches or crosses below Fast MA
Enter when : Price rebounds back above Fast MA with cloud still GREEN
Stop loss : Below Medium MA or recent swing low
Target : Previous high or when cloud weakens
STRATEGY 3: Momentum Confirmation
Your setup triggers : (e.g., chart pattern, support/resistance)
Check cloud color :
• GREEN = proceed with LONG
• RED = proceed with SHORT
• BLUE/ORANGE = skip or reduce size
Use gradient as confluence : Not as primary signal, but as momentum filter
Risk Management Tips:
Never enter against the cloud color (don't LONG in RED cloud)
Reduce position size during BLUE/ORANGE (transition periods)
Place stops beyond Medium MA for swing trades
Use Slow MA (200) as final trend filter - don't SHORT above it in uptrends
═══════════════════════════════════════════════
PERFORMANCE & OPTIMIZATION
═══════════════════════════════════════════════
Tested On:
Crypto: BTC, ETH, major altcoins
Stocks: SPY, AAPL, TSLA, QQQ
Forex: EUR/USD, GBP/USD, USD/JPY
Indices: S&P 500, NASDAQ, DJI
═══════════════════════════════════════════════
TRANSPARENCY & RELIABILITY
═══════════════════════════════════════════════
Educational Focus:
Detailed tooltips on every input
Clear documentation of methodology
Practical examples in descriptions
Teaches you why , not just what
Open Logic:
Momentum calculation: (Fast slope + Medium slope) / 2
Smoothing: 8-bar EMA to reduce noise
Thresholds: ±0.02% for strong momentum classification
Everything is transparent and explainable
═══════════════════════════════════════════════
COMPLETE FEATURE LIST
═══════════════════════════════════════════════
Visual Components:
26-layer exponential gradient cloud
3 customizable moving average lines
Golden Cross / Death Cross labels
Real-time info panel with trend strength
MA distance table
Calculation Features:
6 MA types (EMA, SMA, WMA, VWMA, RMA, HMA)
Momentum-based cloud coloring
Smoothed trend strength scoring
Conditional performance optimization
Customization Options:
All MA lengths adjustable
All colors customizable (when gradient disabled)
Panel position (4 corners)
Font sizes (5 options)
Toggle any feature on/off
Signal Features:
Anti-spam filter (configurable gap)
Clean, non-overlapping labels
Built-in alert conditions
No repainting guarantee
═══════════════════════════════════════════════
IMPORTANT DISCLAIMERS
═══════════════════════════════════════════════
This indicator is for educational and informational purposes only
Not financial advice - always do your own research
Past performance does not guarantee future results
Use proper risk management - never risk more than you can afford to lose
Test on paper/demo accounts before using with real money
Combine with other analysis methods - no single indicator is perfect
Works best in trending markets; less effective in choppy/sideways conditions
Signals may perform differently in different timeframes and market conditions
The indicator uses historical data for MA calculations - allow sufficient lookback period
═══════════════════════════════════════════════
CREDITS & TECHNICAL INFO
═══════════════════════════════════════════════
Version: 2.0
Release: October 2025
Special Thanks:
TradingView community for feedback and testing
Pine Script documentation for technical reference
═══════════════════════════════════════════════
SUPPORT & UPDATES
═══════════════════════════════════════════════
Found a bug? Comment below with:
Ticker symbol
Timeframe
Screenshot if possible
Steps to reproduce
Feature requests? I'm always looking to improve! Share your ideas in the comments.
Questions? Check the tooltips first (hover over any input) - most answers are there. If still stuck, ask in comments.
═══════════════════════════════════════════════
Happy Trading!
Remember: The best indicator is the one you understand and use consistently. Take time to learn how the cloud behaves in different market conditions. Practice on paper before going live. Trade smart, manage risk, and may the trends be with you! 🚀

Power Hour Breakout Signals [LuxAlgo]The Power Hour Breakout tool helps traders identify key price levels from the Power Hour and spot breakouts from those levels easily. This tool features Power Hour extensions, Fibonacci levels, and session break marks for the trader's convenience.
🔶 USAGE
The Power Hour is defined as the last hour of the trading session and is set by default from 3:00 p.m. to 4:00 p.m. New York time. During this period, volume and volatility enter the market. Traders using higher timeframes may use this period to enter or exit positions by placing MOC (Market on Close) orders.
This tool highlights the Power Hour and the top and bottom price levels. Each time prices break out from these levels, a signal is displayed on the chart.
We can use the Power Hour to gauge market sentiment:
Bullish sentiment: Price trades above the Power Hour.
Mixed sentiment: Price trades within the Power Hour.
Bearish sentiment: Price trades below the Power Hour.
🔹 Displaying Power Hours and Breakouts
By default, all detected Power Hours are displayed. Traders can manually adjust this number by disabling the "Display All" parameter in the Settings panel.
Breakouts are displayed by default, too, but this feature can be disabled as well.
The chart above shows different configurations of these parameters.
🔹 Power Hour Extensions
Traders can use Power Hour extensions as potential targets for breakout signals.
In the settings panel, traders can select the percentage of the Power Hour price range to use for each extension. For example, 100% uses the full range, 200% uses the range twice, and so on.
As seen on the chart, traders can configure different percentages for the top and bottom extensions.
🔹 Fibonacci Levels
Traders can display default or custom Fibonacci levels on the Power Hour range to identify retracement opportunities and evaluate market movement strength. Each level can be enabled or disabled, as well as customized by level, color, and line style.
For example, as we can see on the chart, prices attempt to break out at the Power Hour top level, then retrace to the 0.618 Fibonacci level, and then rise to the 200% Power Hour top extension.
🔶 SETTINGS
Display Last X Power Hours: Select how many Power Hours to display or enable the Display All feature.
Power Hour (NY Time): Choose a custom Power Hour in New York time.
🔹 Breakouts
Breakouts: Enable or disable breakouts.
Bullish Breakout: Select color for bullish breakouts.
Bearish Breakout: Select color for bearish breakouts.
🔹 Extensions
Top Extension: Enable or disable the top extension and choose the percentage of Power Hour to use.
Bottom extension: Enable or disable the bottom extension and choose the percentage of Power Hour to use.
🔹 Fibonacci Levels
Display Fibonacci: Enable or disable Fibonacci levels.
Reverse: Reverse Fibonacci levels.
Levels, Colors & Style
Display Labels: Enable or disable labels and choose text size.
🔹 Style
Power Hour Colors
Extension Transparency: Choose the extension's transparency. 0 is solid, and 100 is fully transparent.
Session Breaks: Enable or disable session breaks.

Reverse RSI Signals [AlgoAlpha]🟠 OVERVIEW
This script introduces the Reverse RSI Signals system, an original approach that inverts traditional RSI values back into price levels and then overlays them directly on the chart as dynamic bands. Instead of showing RSI in a subwindow, the script calculates the exact price thresholds that correspond to common RSI levels (30/70/50) and displays them as upper, lower, and midline bands. These are further enhanced with an adaptive Supertrend filter and divergence detection, allowing traders to see overbought/oversold zones translated into actionable price ranges and trend signals. The script combines concepts of RSI inversion, volatility envelopes, and divergence tracking to provide a context-driven tool for spotting reversals and regime shifts.
🟠 CONCEPTS
The script relies on inverting RSI math: by solving for the price that would yield a given RSI level, it generates real chart levels tied to oscillator conditions. These RSI-derived price bands act like support/resistance, adapting each bar as RSI changes. On top of this, a Supertrend built around the RSI midline introduces directional bias, switching regimes when the midline is breached. Regular bullish and bearish divergences are detected by comparing RSI pivots against price pivots, highlighting early reversal conditions. This layered approach means the indicator is not just RSI on price but a hybrid of oscillator translation, volatility-tracking midline envelopes, and divergence analysis.
🟠 FEATURES
Inverted RSI bands: upper (70), lower (30), and midline (50), smoothed with EMA for noise reduction.
Supertrend overlay on the RSI midline to confirm regime direction (bullish or bearish).
Gradient-filled zones between outer and inner RSI bands to visualize proximity and exhaustion.
Non-repainting bullish and bearish divergence markers plotted directly on chart highs/lows.
🟠 USAGE
Apply the indicator to any chart and use the plotted RSI price bands as adaptive support/resistance. The midline defines equilibrium, while upper and lower bands represent classic RSI thresholds translated into real price action. In bullish regimes (green candles), long trades are stronger when price approaches or bounces from the lower band; in bearish regimes (red candles), shorts are favored near the upper band. Divergence markers (▲ for bullish, ▼ for bearish) flag potential reversal points early. Traders can combine the band proximity, divergence alerts, and Supertrend context to time entries, exits, or to refine ongoing trend trades. Adjust smoothing and Supertrend ATR settings to match the volatility of the instrument being analyzed.

FVG & IFVG ICT [TradingFinder] Inversion Fair Value Gap Signal🔵 Introduction
🟣 Fair Value Gap (FVG)
To spot a Fair Value Gap (FVG) on a chart, you need to perform a detailed candle-by-candle analysis.
Here’s the process :
Focus on Candles with Large Bodies : Identify a candle with a substantial body and examine it alongside the preceding candle.
Check Surrounding Candles : The candles immediately before and after the central candle should have long shadows.
Ensure No Overlap : The bodies of the candles before and after the central candle should not overlap with the body of the central candle.
Determine the FVG Range : The gap between the shadows of the first and third candles forms the FVG range.
🟣 ICT Inversion Fair Value Gap (IFVG)
An ICT Inversion Fair Value Gap, also known as a reverse FVG, is a failed fair value gap where the price does not respect the gap. An IFVG forms when a fair value gap fails to hold the price and the price moves beyond it, breaking the fair value gap.
This marks the initial shift in price momentum. Typically, when the price moves in one direction, it respects the fair value gaps and continues its trend.
However, if a fair value gap is violated, it acts as an inversion fair value gap, indicating the first change in price momentum, potentially leading to a short-term reversal or a subsequent change in direction.
🟣 Bullish Inversion Fair Value Gap (Bullish IFVG)
🟣 Bearish Inversion Fair Value Gap (Bearish IFVG)
🔵 How to Use
🟣 Identify an Inversion Fair Value Gap
To identify an IFVG, you first need to recognize a fair value gap. Just as fair value gaps come in two types, inversion fair value gaps also fall into two categories:
🟣 Bullish Inversion Fair Value Gap
A bullish IFVG is essentially a bearish fair value gap that is invalidated by the price closing above it.
Here’s how to identify it :
Identify a bearish fair value gap.
When the price closes above this bearish fair value gap, it transforms into a bullish inversion fair value gap.
This gap acts as support for the price and drives it upwards, indicating a reduction in sellers' strength and an initial shift in momentum towards buyers.
🟣 Bearish Inversion Fair Value Gap
A bearish IFVG is primarily a bullish fair value gap that fails to hold the price, with the price closing below it.
Here’s how to identify it :
Identify a bullish fair value gap.
When the price closes below this gap, it becomes a bearish inversion fair value gap.
This gap acts as resistance for the price, pushing it downwards. A bearish inversion fair value gap signifies a decrease in buyers' momentum and an increase in sellers' strength.
🔵 Setting
🟣 Global Setting
Show All FVG : If it is turned off, only the last FVG will be displayed.
S how All Inversion FVG : If it is turned off, only the last FVG will be displayed.
FVG and IFVG Validity Period (Bar) : You can specify the maximum time the FVG and the IFVG remains valid based on the number of candles from the origin.
Switching Colors Theme Mode : Three modes "Off", "Light" and "Dark" are included in this parameter. "Light" mode is for color adjustment for use in "Light Mode".
"Dark" mode is for color adjustment for use in "Dark Mode" and "Off" mode turns off the color adjustment function and the input color to the function is the same as the output color.
🟣 Logic Setting
FVG Filter
When utilizing FVG filtering, the number of identified FVG areas undergoes refinement based on a specified algorithm. This process helps to focus on higher quality signals and eliminate noise.
Here are the types of FVG filters available :
Very Aggressive Filter : Introduces an additional condition to the initial criteria. For an upward FVG, the highest price of the last candle must exceed the highest price of the middle candle. Similarly, for a downward FVG, the lowest price of the last candle should be lower than the lowest price of the middle candle. This mode minimally filters out FVGs.
Aggressive Filter : Builds upon the Very Aggressive mode by considering the size of the middle candle. It ensures the middle candle is not too small, thereby eliminating more FVGs compared to the Very Aggressive mode.
Defensive Filter : In addition to the conditions of the Very Aggressive mode, the Defensive mode incorporates criteria regarding the size and structure of the middle candle. It requires the middle candle to have a substantial body, with specific polarity conditions for the second and third candles relative to the first candle's direction. This mode filters out a significant number of FVGs, focusing on higher-quality signals.
Very Defensive Filter : Further refines filtering by adding conditions that the first and third candles should not be small-bodied doji candles. This stringent mode eliminates the majority of FVGs, retaining only the highest quality signals.
Mitigation Level FVG and IFVG : Its inputs are one of "Proximal", "Distal" or "50 % OB" modes, which you can enter according to your needs. The "50 % OB" line is the middle line between distal and proximal.
🟣 Display Setting
Show Bullish FVG : Enables the display of demand-related boxes, which can be toggled on or off.
Show Bearish FVG : Enables the display of supply-related boxes along the path, which can also be toggled on or off.
Show Bullish IFVG : Enables the display of demand-related boxes, which can be toggled on or off.
Show Bearish IFVG : Enables the display of supply-related boxes along the path, which can also be toggled on or off.
🟣 Alert Setting
Alert FVG Mitigation : If you want to receive the alert about FVG's mitigation after setting the alerts, leave this tick on. Otherwise, turn it off.
Alert Inversion FVG Mitigation : If you want to receive the alert about Inversion FVG's mitigation after setting the alerts, leave this tick on. Otherwise, turn it off.
Message Frequency : This parameter, represented as a string, determines the frequency of announcements. Options include: 'All' (triggers the alert every time the function is called), 'Once Per Bar' (triggers the alert only on the first call within the bar), and 'Once Per Bar Close' (activates the alert only during the final script execution of the real-time bar upon closure). The default setting is 'Once per Bar'.
Show Alert time by Time Zone : The date, hour, and minute displayed in alert messages can be configured to reflect any chosen time zone. For instance, if you prefer London time, you should input 'UTC+1'. By default, this input is configured to the 'UTC' time zone.
Display More Info : The 'Display More Info' option provides details regarding the price range of the order blocks (Zone Price), along with the date, hour, and minute. If you prefer not to include this information in the alert message, you should set it to 'Off'.

Velocity and Acceleration SignalsThe "Velocity and Acceleration Signals" indicator is a versatile tool designed to provide traders with valuable insights into price momentum and acceleration. By harnessing the power of mathematics and visualization, this indicator helps traders make informed decisions in the fast-paced world of financial markets.
Crunching the Numbers: How It Works
At its core, the indicator relies on two key concepts: velocity and acceleration. Here's how it operates:
-- Velocity Calculation : The indicator takes a step back in time, considering a user-defined historical period (typically around 14 bars). It calculates the velocity of price movements during this period. Velocity represents the speed at which an asset's price is changing and is derived by examining how much the price has moved between bars. Specifically, it computes the rate of change in price over time.
-- Acceleration Calculation : Building upon velocity, the indicator goes one step further and calculates acceleration. Acceleration signifies how quickly the velocity is changing. It quantifies whether the price is speeding up or slowing down in its ascent or descent.
-- Smoothing with EMA : To enhance clarity and reduce noise, the indicator smooths the velocity using an Exponential Moving Average (EMA) with a user-defined length. This smoothed velocity provides a more comprehensive view of the price momentum trend.
Visualizing Market Dynamics
The indicator doesn't just crunch numbers; it also paints a vivid picture of market sentiment:
-- Coloration : The indicator employs a color scheme to visualize market conditions. It uses lime for positive acceleration and fuchsia for negative acceleration. The color green represents positive smoothed velocity, while red denotes negative smoothed velocity. A gray hue signals a neutral or transitional phase.
-- Plotting Velocity and Acceleration : The indicator provides visual representations of both smoothed velocity and acceleration. Smoothed velocity is depicted as columns, with green or red coloring indicating the direction. Acceleration is displayed as a histogram, with lime or fuchsia bars showcasing bullish or bearish momentum. A gray zero line offers a reference point for changes in momentum direction.
-- Strong Up and Strong Down Conditions : For traders seeking distinctive signals, the indicator identifies "Strong Up" and "Strong Down" conditions. A "Strong Up" occurs when smoothed velocity crosses above a user-defined threshold, coupled with positive acceleration. Conversely, a "Strong Down" emerges when smoothed velocity crosses below another threshold, accompanied by negative acceleration. These conditions are marked with prominent triangular shapes.
Unlocking Trading Potential
Now, let's explore how traders can leverage the indicator:
-- Trend Confirmation : Traders can use this indicator to validate the prevailing market trend. A robust smoothed velocity, combined with acceleration in the same direction, can confirm the current trend.
-- Contrarian Signals : Extreme conditions signaled by a strong crossover or crossunder of the smoothed velocity threshold, along with appropriate acceleration, can hint at potential trend reversals.
-- Divergence Analysis : Savvy traders can employ this indicator to identify divergences between price movements and momentum. If the price exhibits higher highs while the indicator shows lower highs (or vice versa), it may signify a weakening or strengthening trend.
Navigating Limitations
As with any trading tool, it's essential to acknowledge the indicator's limitations:
-- Lookback Period : The indicator's effectiveness may vary based on the chosen historical period. Longer periods smooth out fluctuations but may lag in capturing recent changes in sentiment.
-- Threshold Sensitivity : Interpreting threshold crossovers or crossunders can be subjective. Traders should carefully fine-tune these threshold values based on their trading strategy and market conditions.
-- Context Matters : The indicator focuses solely on velocity and acceleration signals and does not incorporate other critical factors such as trading volume, market news, or fundamental analysis. Therefore, traders should use it in conjunction with additional indicators and analysis techniques.
While the primary focus is on trend and momentum analysis, this indicator indirectly provides information about volatility as well. Rapid changes in velocity and acceleration can indicate increasing volatility in the market, which may be of interest to traders looking for opportunities during volatile conditions.
However, this indicator doesn't directly measure volume. To incorporate volume analysis into your trading strategy, you may want to combine this indicator with volume-based indicators or consider other tools specifically designed for volume analysis.
In conclusion, this indicator is a valuable ally for traders looking to decode market dynamics and make data-driven trading decisions. While it offers powerful insights, it's crucial to recognize its limitations and deploy it as part of a comprehensive trading strategy.
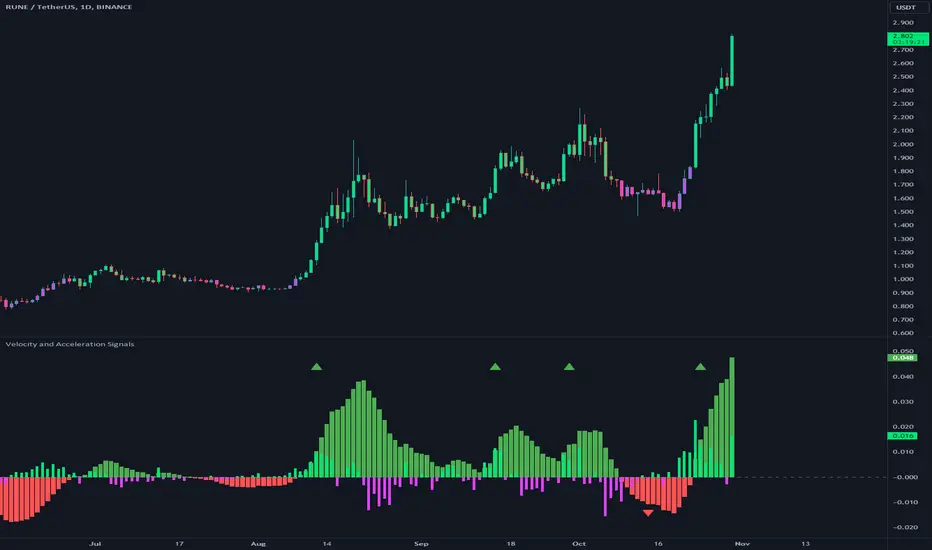
[LazyBear] SQZ Momentum + 1st Gray Cross Signals ━ whvntrI have modified LazyBears Squeeze Momentum Indicator with enhancements, plus added signals
LazyBear mentioned that in John F. Carter's book, Chapter 11, "Mastering the Trade", that "Mr. Carter suggests waiting till the first gray after a black cross, and taking a position in the direction of the momentum (for ex., if momentum value is above zero, go long). Exit the position when the momentum changes (increase or decrease --- signified by a color change)." I have done just that. Now at each "first gray after a black cross", there are now Bearish and Bullish signals.. The signals only appear in the direction of the momentum.
Disclaimer: This indicator does not constitute investment advice. Trade at your own
risk with this method of identifying changes in stock market momentum.
