Smartos VWAPSmartos VWAP Indicator Description
Smartos VWAP is a versatile and customizable technical analysis tool designed for traders and analysts to gauge the average price of a security based on its trading volume. The indicator calculates the Volume Weighted Average Price (VWAP) over six different customizable periods, allowing users to adapt the analysis to their trading strategies.
Key Features:
Volume Weighted Average Price (VWAP): The Smartos VWAP provides a dynamic measure of the average price at which a security has traded throughout the day, weighted by volume. This makes it a useful reference point for assessing price levels.
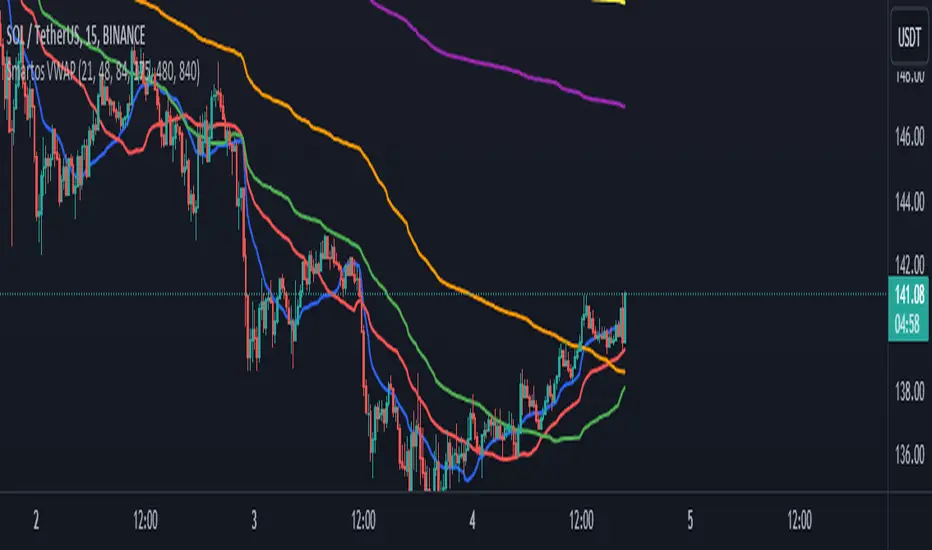
Customizable Periods: The indicator allows users to set six different candle lengths for VWAP calculations, with default values of 21, 48, 84, 175, 480, and 840 candles. Users can easily modify these values to suit their trading preferences.
Multiple VWAP Lines: The indicator plots six distinct VWAP lines on the chart, each representing a different period. This enables traders to observe price action relative to multiple VWAPs, helping identify trends and potential support and resistance levels.
Visual Clarity: Each VWAP line is color-coded for easy differentiation, making it simple for traders to analyze price movements and the relationship between the current price and the average price over the selected periods.
Usage:
Traders can use the Smartos VWAP indicator to make informed decisions regarding entry and exit points, as well as to assess overall market sentiment. By observing the position of the price relative to the VWAP lines, traders can gain insights into potential bullish or bearish trends.
Cerca negli script per "smart"
Smart VWAP FVG SystemSmart VWAP FVG System - Professional Multi-Filter Trading Indicator
📊 OVERVIEW
The Smart VWAP FVG System is an advanced multi-layered trading indicator that combines institutional volume analysis, multi-timeframe VWAP trend confirmation, and Fair Value Gap detection to identify high-probability trade entries. This indicator uses a sophisticated filtering mechanism where signals appear only when multiple independent confirmation criteria align simultaneously.
Recommended Timeframe: 5-minute (M5) or higher. The indicator works best on M5, M15, and M30 charts for intraday trading.
🎯 ORIGINALITY & PURPOSE
This indicator is original because it combines three distinct analytical methods into a unified decision-making system:
Market Profile Volume Analysis - Identifies institutional accumulation/distribution zones
Dual VWAP Filtering - Confirms trend direction using two independent VWAP calculations
Fair Value Gap Detection - Validates institutional interest through price inefficiency zones
The key innovation is the directional filter system: the primary Market Profile generates BUY-ONLY or SELL-ONLY states based on higher timeframe value area reversals, which then controls which signals from the main system are displayed. This creates a multi-timeframe confluence that significantly reduces false signals.
Unlike simple indicator mashups, each component serves a specific purpose:
Market Profile → Direction bias (trend filter)
Primary VWAP (Session) → Short-term trend confirmation
Secondary VWAP (Week) → Medium-term trend confirmation
FVG Detection → Institutional activity validation
🔧 HOW IT WORKS
1. Primary Market Profile Filter (Higher Timeframe)
The indicator calculates Market Profile on a higher timeframe (default: 1 hour) to determine the overall market structure:
Value Area High (VAH): Top 70% of volume distribution
Value Area Low (VAL): Bottom 70% of volume distribution
Point of Control (POC): Price level with highest volume
When price reaches VAH and reverses down → SELL-ONLY mode activated
When price reaches VAL and reverses up → BUY-ONLY mode activated
This higher timeframe filter ensures you're trading in the direction of institutional flow.
2. Dual VWAP System
Two independent VWAP calculations provide multi-timeframe trend confirmation:
Primary VWAP (Session-based): Resets daily, tracks intraday momentum
Secondary VWAP (Week-based): Resets weekly, confirms longer-term trend
Filter Logic:
BUY signals require: Price > Primary VWAP AND Price > Secondary VWAP
SELL signals require: Price < Primary VWAP AND Price < Secondary VWAP
This dual confirmation prevents counter-trend trades during ranging conditions.
3. Fair Value Gap (FVG) Detection
FVG zones identify price inefficiencies where institutional orders were executed rapidly:
Bullish FVG: Gap between candle .high and candle .low (upward imbalance)
Bearish FVG: Gap between candle .high and candle .low (downward imbalance)
The indicator monitors recent FVG formation (lookback: 50 bars) and requires:
Bullish FVG present for BUY signals
Bearish FVG present for SELL signals
FVG zones are displayed as colored boxes and automatically marked as "mitigated" when price fills the gap.
4. Main Trading Signal Logic
The secondary Market Profile (default: 1 hour) generates the actual trading signals:
BUY Signal Conditions:
Price reaches Value Area Low
Reversal pattern confirmed (minimum 1 bar)
Price > Primary VWAP
Price > Secondary VWAP (if filter enabled)
Recent Bullish FVG detected (if filter enabled)
Primary MP Filter = BUY-ONLY or NEUTRAL
SELL Signal Conditions:
Price reaches Value Area High
Reversal pattern confirmed (minimum 1 bar)
Price < Primary VWAP
Price < Secondary VWAP (if filter enabled)
Recent Bearish FVG detected (if filter enabled)
Primary MP Filter = SELL-ONLY or NEUTRAL
All conditions must be TRUE simultaneously for a signal to appear.
📈 VISUAL ELEMENTS
On Chart:
🟢 Green Triangle (▲) = BUY Signal
🔴 Red Triangle (▼) = SELL Signal
🟦 Blue horizontal lines = Value Area zones
🟡 Yellow line = Point of Control (POC)
🟩 Green boxes = Bullish FVG zones
🟥 Red boxes = Bearish FVG zones
🔵 Blue line = Primary VWAP (Session)
⚪ White line = Secondary VWAP (Week)
Info Panel (Top Right):
Real-time status display showing:
Filter Direction (BUY ONLY / SELL ONLY / NEUTRAL)
Active timeframes for both MP filters
FVG filter status and count
VWAP positions (ABOVE/BELOW)
Signal enablement status
Alert status
⚙️ KEY SETTINGS
MP/TPO Filter Settings (Primary Indicator)
MP Filter Time Frame: 60 minutes (controls directional bias)
Filter Value Area %: 70% (standard Market Profile calculation)
Filter Alert Distance: 1 bar
Filter Min Bars for Reversal: 1 bar
Filter Alert Zone Margin: 0.01 (1%)
FVG Filter Settings
Use FVG Filter: Enabled (toggle on/off)
FVG Timeframe: 60 minutes (1 hour)
FVG Filter Mode: Both (require bullish FVG for BUY, bearish for SELL)
FVG Lookback Period: 50 bars (how far back to search)
Show FVG Formation Signals: Optional visual markers
Max FVG on Chart: 50 zones
Show Mitigated FVG: Display filled gaps
Market Profile Settings
Higher Time Frame: 60 minutes (for main signals)
Percent for Value Area: 70%
Show POC Line: Enabled
Keep Old MPs: Enabled (maintain historical profiles)
Primary VWAP Filter
Use Primary VWAP Filter: Enabled
Primary VWAP Anchor Period: Session (resets daily)
Primary VWAP Source: HLC3 (typical price)
Secondary VWAP Filter
Use Secondary VWAP Filter: Enabled
Secondary VWAP Anchor Period: Week (resets weekly)
Secondary VWAP Filter Mode: Both
Secondary VWAP Line Color: White
Trading Signals
Show Trading Signals on Chart: Enabled
Show SELL Signals: Enabled
Show BUY Signals: Enabled
Alert Distance: 1 bar
Min Bars for Reversal: 1 bar
Alert Zone Margin: 0.01 (1%)
Retest Search Period: 20 bars
Min Bars Between Retests: 5 bars
Show Only Retests: Disabled
Alert Settings
Enable Trading Notifications: Enabled
VAH Reversal Alert: Enabled (SELL signals)
VAL Reversal Alert: Enabled (BUY signals)
Time Filter Settings
Filter Alerts By Time: Optional (exclude specific hours)
⚠️ IMPORTANT WARNINGS & LIMITATIONS
1. Repainting Behavior
CRITICAL: This indicator uses lookahead=barmerge.lookahead_on to access higher timeframe data immediately for FVG detection. This is necessary to provide real-time FVG zone visualization but has the following implications:
FVG zones may shift slightly until the higher timeframe candle closes
FVG detection signals are preliminary until HTF bar confirmation
The main trading signals (triangles) appear on confirmed bars and do not repaint
Best Practice: Always wait for the current timeframe bar to close before acting on signals. The filter status and FVG zones are informational but may adjust as new data arrives.
2. Minimum Timeframe
Do NOT use on timeframes below 5 minutes (M5)
Recommended: M5, M15, M30 for intraday trading
Higher timeframes (H1, H4) can also be used but will generate fewer signals
3. Multiple Filters Can Block Signals
By design, this indicator is conservative. When all filters are enabled:
Signals appear ONLY when all conditions align
You may see extended periods with no signals
This is intentional to reduce false positives
If you see no signals:
Check the Info Panel to see which filters are failing
Consider adjusting FVG lookback period
Temporarily disable FVG filter to test
Verify VWAP filters match current market trend
4. Market Profile Limitations
Market Profile requires sufficient volume data
Low-volume instruments may produce unreliable profiles
Value Areas update only on higher timeframe bar close
Works best on liquid markets (major forex pairs, indices, crypto)
📖 HOW TO USE
Step 1: Add to Chart
Apply indicator to M5 or higher timeframe chart
Ensure chart shows volume data
Use standard candles (NOT Heikin Ashi, Renko, etc.)
Step 2: Configure Settings
Primary MP Filter TF: Set to 60 (1 hour) minimum, or 240 (4 hour) for swing trading
Main MP TF: Set to 60 (1 hour) for intraday signals
FVG Timeframe: Match or exceed main MP timeframe
Leave other settings at default initially
Step 3: Understand the Info Panel
Monitor the top-right panel:
FILTER STATUS: Shows current directional bias
NEUTRAL = Both signals allowed
BUY ONLY = Only green triangles will appear
SELL ONLY = Only red triangles will appear
FVG Filter: Shows if bullish/bearish gaps detected recently
VWAP positions: Confirms trend alignment
Step 4: Take Signals
For BUY Signal (Green Triangle ▲):
Wait for green triangle to appear
Check Info Panel shows ✓ for BUY signals
Confirm current bar has closed
Enter long position
Stop loss: Below recent VAL or swing low
Target: Previous Value Area High or 1.5-2× risk
For SELL Signal (Red Triangle ▼):
Wait for red triangle to appear
Check Info Panel shows ✓ for SELL signals
Confirm current bar has closed
Enter short position
Stop loss: Above recent VAH or swing high
Target: Previous Value Area Low or 1.5-2× risk
Step 5: Risk Management
Risk per trade: Maximum 1-2% of account equity
Position sizing: Adjust based on stop loss distance
Avoid trading: During major news events or time filter periods
Multiple confirmations: Look for confluence with price action (support/resistance, trendlines)
🎓 UNDERLYING CONCEPTS
Market Profile Theory
Developed by J. Peter Steidlmayer in the 1980s, Market Profile organizes price and volume data to identify:
Value Areas: Where 70% of trading activity occurred
POC: Price level with highest acceptance (most volume)
Imbalances: When price moves away from value quickly
This indicator uses TPO (Time Price Opportunity) calculation method to build the volume profile distribution.
VWAP (Volume Weighted Average Price)
VWAP represents the average price weighted by volume, showing where institutional traders are positioned:
Price above VWAP = Bullish (institutions accumulated lower)
Price below VWAP = Bearish (institutions distributed higher)
Using dual VWAP (Session + Week) creates multi-timeframe trend alignment.
Fair Value Gaps (FVG)
Also known as "imbalance" or "inefficiency," FVG occurs when:
Price moves so rapidly that a gap forms in the candlestick structure
Indicates institutional order flow (large market orders)
Price often returns to "fill" these gaps (rebalance)
The 3-candle FVG pattern (gap between candle and candle ) is widely used in ICT (Inner Circle Trader) methodology and Smart Money Concepts.
🔍 CREDITS & CODE ATTRIBUTION
This indicator builds upon established technical analysis concepts and combines multiple methodologies:
1. Market Profile / TPO Calculation
Concept Origin: J. Peter Steidlmayer (Chicago Board of Trade, 1980s)
Code Inspiration: TradingView's public domain Market Profile examples
Modifications: Custom filtering logic for directional bias, dual timeframe implementation
2. VWAP Calculation
Concept Origin: Standard financial instrument (widely used since 1980s)
Code Base: TradingView built-in ta.vwap() function (public domain)
Modifications: Dual VWAP system with independent anchor periods, custom filtering modes
3. Fair Value Gap Detection
Concept Origin: Inner Circle Trader (ICT) / Smart Money Concepts methodology
Code Implementation: Original implementation based on 3-candle gap pattern
Features: Multi-timeframe detection, automatic mitigation tracking, visual zone display
4. Pine Script Framework
Language: Pine Script v6 (TradingView)
Built-in Functions Used:
ta.vwap() - Volume weighted average price
request.security() - Higher timeframe data access
ta.change() - Period detection
ta.cum() - Cumulative volume
time() - Timestamp functions
Note: All code is original implementation. While concepts are based on established trading methodologies, the combination, filtering logic, and execution are unique to this indicator.
📊 RECOMMENDED INSTRUMENTS
Best Performance:
Major Forex Pairs (EURUSD, GBPUSD, USDJPY)
Stock Indices (ES, NQ, SPX, DAX)
Major Cryptocurrencies (BTCUSD, ETHUSD)
Liquid Stocks (high daily volume)
Avoid:
Low-volume altcoins
Illiquid stocks
Exotic forex pairs with wide spreads
⚡ PERFORMANCE TIPS
Start Conservative: Enable all filters initially
Reduce Filters Gradually: If too few signals, disable Secondary VWAP filter first
Match Timeframes: Keep MP Filter TF and FVG TF at same value
Backtest First: Review historical performance on your preferred instrument/timeframe
Combine with Price Action: Look for support/resistance confluence
Use Time Filter: Avoid low-liquidity hours (optional setting)
🚫 WHAT THIS INDICATOR DOES NOT DO
Does not guarantee profits - No trading system is 100% accurate
Does not predict the future - Based on historical patterns
Does not replace risk management - Always use stop losses
Does not work on all instruments - Requires volume data and liquidity
Does not provide exact entry/exit prices - Signals are zones, not precise levels
Does not account for fundamentals - Purely technical analysis
📜 DISCLAIMER
This indicator is provided for educational and informational purposes only. It is not financial advice, and past performance does not guarantee future results.
Trading Risk Warning:
All trading involves risk of loss
You can lose more than your initial investment (leverage products)
Only trade with capital you can afford to lose
Always use appropriate position sizing and risk management
Consider seeking advice from a licensed financial advisor
Technical Limitations:
Indicator may repaint FVG zones until HTF bar closes
Signals are based on historical patterns that may not repeat
Market conditions change and no system works in all environments
Volume data quality varies by exchange/broker
By using this indicator, you acknowledge these risks and agree that the author bears no responsibility for trading losses.
📞 SUPPORT & UPDATES
Questions? Comment on this publication
Issues? Describe the problem with chart screenshot
Feature Requests? Suggest improvements in comments
Updates: Will be published as new versions using TradingView's update feature
📝 VERSION HISTORY
Version 1.0 (Current)
Initial public release
Multi-filter system: MP + Dual VWAP + FVG
Directional bias filter
Real-time info panel
Comprehensive alert system
Time-based filtering
Thank you for using Smart VWAP FVG System!
Happy Trading! 📈

Smart Margin Zone
SMART MARGIN ZONE - CME-BASED SUPPORT & RESISTANCE INDICATOR
TITLE FOR PUBLICATION:
Smart Margin Zone - CME Margin-Based Support and Resistance
CATEGORY:
Support and Resistance
SHORT DESCRIPTION (for preview):
Automatically plots margin zones based on CME Group requirements. These zones represent critical price levels where leveraged traders face margin calls, creating natural support and resistance through forced liquidations.
═══════════════════════════════════════════════════════════════
FULL DESCRIPTION FOR TRADINGVIEW:
═══════════════════════════════════════════════════════════════
📊 Smart Margin Zone - Professional Trading Zones Based on CME Data
This indicator automatically calculates and displays margin zones derived from official CME Group margin requirements. These zones represent critical price levels where traders using leverage receive margin calls, triggering forced position closures that create natural support and resistance levels.
═══════════════════════════════════════════════════════════════
🎯 CORE CONCEPT
═══════════════════════════════════════════════════════════════
When price reaches calculated margin zones, traders using 2:1 or 4:1 leverage on CME futures receive margin calls. Brokers automatically liquidate these positions, creating waves of buying or selling pressure that form strong support and resistance levels.
This is not theoretical - it's based on actual margin requirements from CME Group, the world's largest derivatives marketplace.
═══════════════════════════════════════════════════════════════
📐 CALCULATION METHODOLOGY
═══════════════════════════════════════════════════════════════
The indicator uses the following formula to calculate zone sizes:
Zone Size = (Margin Requirement / Tick Value) × Tick Size × 1.10
Where:
• Margin Requirement = Official CME initial margin (updated November 2024)
• Tick Value = Dollar value of minimum price movement
• Tick Size = Minimum price increment
• 1.10 = 10% buffer for realistic zone width
SUPPORTED INSTRUMENTS WITH CME DATA:
Currency Pairs:
• EURUSD: $2,100 margin → 0.0168 zone size
• GBPUSD: $1,800 margin → 0.0144 zone size
• AUDUSD: $1,300 margin → 0.0065 zone size
• NZDUSD: $1,100 margin → 0.0055 zone size
• USDJPY: $3,200 margin → custom calculation
• USDCAD: $950 margin → calculated
• USDCHF: $1,650 margin → calculated
Commodities:
• Gold (XAUUSD): $8,000 margin → 80 points zone size
• Silver (XAGUSD): $6,500 margin → calculated
• WTI Crude Oil: $4,500 margin → calculated
═══════════════════════════════════════════════════════════════
🔍 HOW IT WORKS
═══════════════════════════════════════════════════════════════
1. SWING POINT DETECTION
The indicator automatically identifies swing highs and swing lows using a configurable lookback period (default 10 bars). These become anchor points for zone calculations.
2. FIVE ZONE LEVELS
From each swing point, five zone levels are calculated:
• Zone 1/4 (25%) - First correction level
• Zone 1/2 (50%) - KEY ZONE for trend determination
• Zone 3/4 (75%) - Intermediate level
• Zone 1/1 (100%) - Full margin zone (strongest level)
• Zone 5/4 (125%) - Extended zone
3. TREND IDENTIFICATION
• Close above Zone 1/2 resistance = Bullish trend
• Close below Zone 1/2 support = Bearish trend
• Between zones = Range/consolidation
4. HISTORICAL CONTEXT
Current zones are displayed prominently with fills and labels. Historical zones appear as thin, semi-transparent lines for context without cluttering the chart.
═══════════════════════════════════════════════════════════════
⚙️ FEATURES
═══════════════════════════════════════════════════════════════
AUTOMATED CALCULATION:
✅ Auto-detection of swing highs and lows
✅ Real-time zone updates as new swings form
✅ CME margin data built-in for major instruments
✅ Manual override option for custom calculations
VISUAL CLARITY:
✅ Color-coded zones (red=resistance, green=support)
✅ Adjustable transparency for fills and lines
✅ Current zones bold with fills and price labels
✅ Historical zones thin and transparent
✅ Swing point markers show calculation origins
CUSTOMIZATION:
✅ Show/hide individual zone levels (1/4, 1/2, 3/4, 1/1, 5/4)
✅ Toggle historical zones on/off
✅ Adjustable lookback period (5-50 bars)
✅ Customizable colors for all elements
✅ Line width and transparency controls
✅ Zone extension options (none/right/both)
TREND ANALYSIS:
✅ Optional trend background coloring
✅ Customizable trend colors and transparency
✅ Real-time trend identification display
STATISTICS:
✅ Live statistics table showing:
- Current instrument
- Active zone size
- Calculation mode
- Current trend direction
- Number of zones displayed
ALERTS:
✅ Zone 1/2 breakout (up/down)
✅ Full margin zone 1/1 reached
✅ Customizable alert messages
═══════════════════════════════════════════════════════════════
📈 TRADING APPLICATIONS
═══════════════════════════════════════════════════════════════
ENTRY SIGNALS:
• Bounces from zone levels = potential entry points
• Zone 1/2 breakouts = trend continuation entries
• Zone rejections = reversal opportunities
RISK MANAGEMENT:
• Zone levels = logical stop-loss placement
• Zone 1/1 = maximum risk level
• Zone spacing = position sizing guide
PROFIT TARGETS:
• Next zone level = first target
• Zone 1/1 = full profit target
• Zone breakouts = extended targets
TREND CONFIRMATION:
• Price above Zone 1/2 resistance = confirmed uptrend
• Price below Zone 1/2 support = confirmed downtrend
• Consolidation between zones = wait for breakout
═══════════════════════════════════════════════════════════════
📚 USAGE INSTRUCTIONS
═══════════════════════════════════════════════════════════════
GETTING STARTED:
1. Add indicator to chart of any supported instrument
2. Zones automatically calculate and display
3. Adjust swing detection period if needed (default 10 works well)
4. Customize colors and visibility to your preference
OPTIMAL SETTINGS:
• Best timeframes: H1, H4, Daily, Weekly
• Default swing length (10) suitable for most markets
• Show 2-3 historical zones for context
• Enable swing point markers to see calculation origins
INTERPRETATION:
• Watch for price reactions at zone boundaries
• Strong bounces = respect for margin level
• Clean breaks = momentum continuation
• Multiple touches = zone strength confirmation
SET ALERTS:
• Zone 1/2 breakouts for trend entries
• Zone 1/1 reaches for profit-taking
• Custom alerts for your specific strategy
═══════════════════════════════════════════════════════════════
⚠️ IMPORTANT NOTES
═══════════════════════════════════════════════════════════════
DATA ACCURACY:
• CME margin requirements updated November 2024
• Margins change periodically - check CME Group website
• Manual mode available for latest margin data
• Indicator provides analysis tool, not financial advice
STATISTICAL PERFORMANCE:
• Historical data shows >60% probability of continued movement after Zone 1/2 breakout
• Zone effectiveness varies by market conditions
• Best results in trending markets with clear swings
LIMITATIONS:
• Margin requirements change - monitor CME updates
• Works best on liquid instruments with clear swings
• Not a standalone trading system
• Should be combined with additional analysis
═══════════════════════════════════════════════════════════════
🔧 METHODOLOGY CREDIT
═══════════════════════════════════════════════════════════════
This indicator is based on the margin zones concept developed by Alexander Bazylev (BTrade indicator for MetaTrader platforms).
The TradingView implementation has been completely rewritten with original enhancements:
• Multiple zone levels instead of single level
• Automatic swing point detection algorithm
• Direct CME data integration
• Historical zone visualization
• Advanced customization options
• Comprehensive statistics and alerts
All code is original and specifically designed for TradingView's Pine Script v5 environment.
═══════════════════════════════════════════════════════════════
💡 BEST PRACTICES
═══════════════════════════════════════════════════════════════
COMBINE WITH:
• Volume analysis for confirmation
• Trend indicators for direction bias
• Price action patterns at zones
• Higher timeframe analysis
AVOID:
• Trading against strong trends at minor zones
• Over-leveraging based solely on zone placement
• Ignoring broader market context
• Expecting perfect bounces every time
OPTIMIZE:
• Adjust swing length for different timeframes
• Shorter period (5-7) for intraday trading
• Longer period (15-20) for swing trading
• Test historical effectiveness on your instruments
═══════════════════════════════════════════════════════════════
📖 EDUCATIONAL VALUE
═══════════════════════════════════════════════════════════════
This indicator helps traders understand:
• How institutional margin requirements affect price
• Where forced liquidations create pressure
• Natural support and resistance formation
• Relationship between leverage and price levels
• Market structure and key technical levels
═══════════════════════════════════════════════════════════════
🔄 VERSION HISTORY
═══════════════════════════════════════════════════════════════
Version 1.0 (Initial Release):
• CME-based zone calculation for 10 instruments
• Automatic swing high/low detection
• 5 zone levels with customizable display
• Historical zones with transparency control
• Swing point markers
• Trend background indicator
• Live statistics table
• Multiple alert conditions
• Fully customizable colors and styles
• English language interface
═══════════════════════════════════════════════════════════════
📞 SUPPORT & FEEDBACK
═══════════════════════════════════════════════════════════════
Questions or suggestions? Leave a comment below!
If you find this indicator useful:
⭐ Please leave a like
💬 Share your experience in comments
🔔 Follow for updates and new indicators
═══════════════════════════════════════════════════════════════
⚖️ DISCLAIMER
═══════════════════════════════════════════════════════════════
This indicator is provided for educational and analytical purposes only. It is not financial advice and should not be the sole basis for trading decisions.
• Past performance does not guarantee future results
• Trading involves substantial risk of loss
• CME margin requirements subject to change
• Always do your own research and risk management
• Consult a financial advisor for investment advice
The creator is not responsible for any trading losses incurred through use of this indicator.

Smart MACD Volume Trader# Smart MACD Volume Trader
## Overview
Smart MACD Volume Trader is an enhanced momentum indicator that combines the classic MACD (Moving Average Convergence Divergence) oscillator with an intelligent high-volume filter. This combination significantly reduces false signals by ensuring that trading signals are only generated when price momentum is confirmed by substantial volume activity.
The indicator supports over 24 different instruments including major and exotic forex pairs, precious metals (gold and silver), energy commodities (crude oil, natural gas), and industrial metals (copper). For forex and commodity traders, the indicator automatically maps to CME and COMEX futures contracts to provide accurate institutional-grade volume data.
## Originality and Core Concept
Traditional MACD indicators generate signals based solely on price momentum, which can result in numerous false signals during low-activity periods or ranging markets. This indicator addresses this critical weakness by introducing a volume confirmation layer with automatic institutional volume integration.
**What makes this approach original:**
- Signals are triggered only when MACD crossovers coincide with elevated volume activity
- Implements a lookback mechanism to detect volume spikes within recent bars
- Automatically detects and maps 24+ forex pairs and commodities to their corresponding CME and COMEX futures contracts
- Provides real institutional volume data for forex pairs where spot volume is unreliable
- Combines two independent market dimensions (price momentum and volume) into a single, actionable signal
- Includes intelligent asset detection that works across multiple exchanges and ticker formats
**The underlying principle:** Volume validates price movement. When institutional money enters the market, it creates volume signatures. By requiring high volume confirmation and using actual institutional volume data from futures markets, this indicator filters out weak price movements and focuses on trades backed by genuine market participation. The automatic futures mapping ensures that forex and commodity traders always have access to the most accurate volume data available, without manual configuration.
## How It Works
### MACD Component
The indicator calculates MACD using standard methodology:
1. **Fast EMA (default: 12 periods)** - Tracks short-term price momentum
2. **Slow EMA (default: 26 periods)** - Tracks longer-term price momentum
3. **MACD Line** - Difference between Fast EMA and Slow EMA
4. **Signal Line (default: 9-period SMA)** - Smoothed average of MACD line
**Crossover signals:**
- **Bullish:** MACD line crosses above Signal line (momentum turning positive)
- **Bearish:** MACD line crosses below Signal line (momentum turning negative)
### Volume Filter Component
The volume filter adds an essential confirmation layer:
1. **Volume Moving Average** - Calculates exponential MA of volume (default: 20 periods)
2. **High Volume Threshold** - Multiplies MA by ratio (default: 2.0x or 200%)
3. **Volume Detection** - Identifies bars where current volume exceeds threshold
4. **Lookback Period** - Checks if high volume occurred in recent bars (default: 5 bars)
**Signal logic:**
- Buy/Sell signals only trigger when BOTH conditions are met:
- MACD crossover/crossunder occurs
- High volume detected within lookback period
### Automatic CME Futures Integration
For forex traders, spot FX volume data can be unreliable or non-existent. This indicator solves this problem by automatically detecting forex pairs and mapping them to corresponding CME futures contracts with real institutional volume data.
**Supported Major Forex Pairs (7):**
- EURUSD → CME:6E1! (Euro FX Futures)
- GBPUSD → CME:6B1! (British Pound Futures)
- AUDUSD → CME:6A1! (Australian Dollar Futures)
- USDJPY → CME:6J1! (Japanese Yen Futures)
- USDCAD → CME:6C1! (Canadian Dollar Futures)
- USDCHF → CME:6S1! (Swiss Franc Futures)
- NZDUSD → CME:6N1! (New Zealand Dollar Futures)
**Supported Exotic Forex Pairs (4):**
- USDMXN → CME:6M1! (Mexican Peso Futures)
- USDRUB → CME:6R1! (Russian Ruble Futures)
- USDBRL → CME:6L1! (Brazilian Real Futures)
- USDZAR → CME:6Z1! (South African Rand Futures)
**Supported Cross Pairs (6):**
- EURJPY → CME:6E1! (Uses Euro Futures)
- GBPJPY → CME:6B1! (Uses British Pound Futures)
- EURGBP → CME:6E1! (Uses Euro Futures)
- AUDJPY → CME:6A1! (Uses Australian Dollar Futures)
- EURAUD → CME:6E1! (Uses Euro Futures)
- GBPAUD → CME:6B1! (Uses British Pound Futures)
**Supported Precious Metals (2):**
- Gold (XAUUSD, GOLD) → COMEX:GC1! (Gold Futures)
- Silver (XAGUSD, SILVER) → COMEX:SI1! (Silver Futures)
**Supported Energy Commodities (3):**
- WTI Crude Oil (USOIL, WTIUSD) → NYMEX:CL1! (Crude Oil Futures)
- Brent Oil (UKOIL) → NYMEX:BZ1! (Brent Crude Futures)
- Natural Gas (NATGAS) → NYMEX:NG1! (Natural Gas Futures)
**Supported Industrial Metals (1):**
- Copper (COPPER) → COMEX:HG1! (Copper Futures)
**How the automatic detection works:**
The indicator intelligently identifies the asset type by analyzing:
1. Exchange name (FX, OANDA, TVC, COMEX, NYMEX, etc.)
2. Currency pair pattern (6-letter codes like EURUSD, GBPUSD)
3. Commodity identifiers (XAU for gold, XAG for silver, OIL for crude)
When a supported instrument is detected, the indicator automatically switches to the corresponding futures contract for volume analysis. For stocks, cryptocurrencies, and other assets, the indicator uses the native volume data from the current chart.
**Visual feedback:**
An information table appears in the top-right corner of the MACD pane showing:
- Current chart symbol
- Exchange name
- Currency pair or asset name
- Volume source being used (highlighted in orange for futures, yellow for native volume)
- Current high volume status
This provides complete transparency about which data source the indicator is using for its volume analysis.
## How to Use
### Basic Setup
1. Add the indicator to your chart
2. The indicator displays in a separate pane (MACD) and overlay (signals/volume bars)
3. Default settings work well for most assets, but can be customized
### Signal Interpretation
### Visual Signals
**Visual Signals:**
- **Green "BUY" label** - Bullish MACD crossover confirmed by high volume
- **Red "SELL" label** - Bearish MACD crossunder confirmed by high volume
- **Green/Red candles** - Highlight bars with volume exceeding the threshold
- **Light green/red background** - Emphasizes signal bars on the chart
**Information Table:**
A detailed information table appears in the top-right corner of the MACD pane, providing real-time transparency about the indicator's operation:
- **Chart:** Current symbol being analyzed
- **Exchange:** The exchange or data feed being used
- **Pair:** The currency pair or asset name extracted from the ticker
- **Volume From:** The actual symbol used for volume analysis
- Orange color indicates CME or COMEX futures are being used (automatic institutional volume)
- Yellow color indicates native volume from the chart symbol is being used
- Hover tooltip shows whether automatic futures mapping is active
- **High Volume:** Current status showing YES (green) when volume exceeds threshold, NO (gray) otherwise
This table ensures complete transparency and allows you to verify that the correct volume source is being used for your analysis.
**Volume Analysis:**
- Gray histogram bars = Normal volume
- Red histogram bars = High volume (exceeds threshold)
- Green line = Volume moving average baseline
**MACD Analysis:**
- Blue line = MACD line (momentum indicator)
- Orange line = Signal line (trend confirmation)
- Gray dotted line = Zero line (bullish above, bearish below)
### Parameter Customization
**MACD Parameters:**
- Adjust Fast/Slow EMA lengths for different sensitivities
- Shorter periods = More signals, faster response
- Longer periods = Fewer signals, less noise
**Volume Parameters:**
- **Volume MA Period:** Higher values smooth volume analysis
- **High Volume Ratio:** Lower values (1.5x) = More signals; Higher values (3.0x) = Fewer, stronger signals
- **Volume Lookback Bars:** Controls how recent the volume spike must be
**Direction Filters:**
- **Only Buy Signals:** Enables long-only strategy mode
- **Only Sell Signals:** Enables short-only strategy mode
### Alert Configuration
The indicator includes three alert types:
1. **Buy Signal Alert** - Triggers when bullish signal appears
2. **Sell Signal Alert** - Triggers when bearish signal appears
3. **High Volume Alert** - Triggers when volume exceeds threshold
To set up alerts:
1. Click the indicator name → "Add alert on Smart MACD Volume Trader"
2. Select desired alert condition
3. Configure notification method (popup, email, webhook, etc.)
## Trading Strategy Guidelines
### Best Practices
**Recommended markets:**
- Liquid stocks (large-cap, high daily volume)
- Major forex pairs (EURUSD, GBPUSD, USDJPY, AUDUSD, USDCAD, USDCHF, NZDUSD)
- Exotic forex pairs (USDMXN, USDRUB, USDBRL, USDZAR)
- Cross pairs (EURJPY, GBPJPY, EURGBP, AUDJPY, EURAUD, GBPAUD)
- Precious metals (Gold, Silver with automatic COMEX futures mapping)
- Energy commodities (Crude Oil, Natural Gas with automatic NYMEX futures mapping)
- Industrial metals (Copper with automatic COMEX futures mapping)
- Major cryptocurrency pairs
- Index futures and ETFs
**Timeframe recommendations:**
- **Day trading:** 5-minute to 15-minute charts
- **Swing trading:** 1-hour to 4-hour charts
- **Position trading:** Daily charts
**Risk management:**
- Use signals as entry confirmation, not standalone strategy
- Combine with support/resistance levels
- Consider overall market trend direction
- Always use stop-loss orders
### Strategy Examples
**Trend Following Strategy:**
1. Identify overall trend using higher timeframe (e.g., daily chart)
2. Trade only in trend direction
3. Use "Only Buy" filter in uptrends, "Only Sell" in downtrends
4. Enter on signal, exit on opposite signal or at resistance/support
**Volume Breakout Strategy:**
1. Wait for consolidation period (low volume, tight MACD range)
2. Enter when signal appears with high volume (confirms breakout)
3. Target previous swing highs/lows
4. Stop loss below/above recent consolidation
**Forex Scalping Strategy (with automatic CME futures):**
1. The indicator automatically detects forex pairs and uses CME futures volume
2. Trade during active sessions only (use session filter)
3. Focus on quick profits (10-20 pips)
4. Exit at opposite signal or profit target
**Commodities Trading Strategy (Gold, Silver, Oil):**
1. The indicator automatically maps to COMEX and NYMEX futures contracts
2. Trade during high-liquidity sessions (overlap of major markets)
3. Use the high volume confirmation to identify institutional entry points
4. Combine with key support and resistance levels for entries
5. Monitor the information table to confirm futures volume is being used (orange color)
6. Exit on opposite MACD signal or at predefined profit targets
## Why This Combination Works
### The Volume Advantage
Studies consistently show that price movements accompanied by high volume are more likely to continue, while low-volume movements often reverse. This indicator leverages this principle by requiring volume confirmation.
**Key benefits:**
1. **Reduced False Signals:** Eliminates MACD whipsaws during low-volume consolidation
2. **Confirmation Bias:** Two independent indicators (price momentum + volume) agreeing
3. **Institutional Alignment:** High volume often indicates institutional participation
4. **Trend Validation:** Volume confirms that price momentum has "conviction"
### Statistical Edge
By combining two uncorrelated signals (MACD crossovers and volume spikes), the indicator creates a higher-probability setup than either signal alone. The lookback mechanism ensures signals aren't missed if volume spike slightly precedes the MACD cross.
## Supported Exchanges and Automatic Detection
The indicator includes intelligent asset detection that works across multiple exchanges and ticker formats:
**Forex Exchanges (Automatic CME Mapping):**
- FX (TradingView forex feed)
- OANDA
- FXCM
- SAXO
- FOREXCOM
- PEPPERSTONE
- EASYMARKETS
- FX_IDC
**Commodity Exchanges (Automatic COMEX/NYMEX Mapping):**
- TVC (TradingView commodity feed)
- COMEX (directly)
- NYMEX (directly)
- ICEUS
**Other Asset Classes (Native Volume):**
- Stock exchanges (NASDAQ, NYSE, AMEX, etc.)
- Cryptocurrency exchanges (BINANCE, COINBASE, KRAKEN, etc.)
- Index providers (SP, DJ, etc.)
The detection algorithm analyzes three factors:
1. Exchange prefix in the ticker symbol
2. Pattern matching for currency pairs (6-letter codes)
3. Commodity identifiers in the symbol name
This ensures accurate automatic detection regardless of which data feed or exchange you use for charting. The information table in the top-right corner always displays which volume source is being used, providing complete transparency.
## Technical Details
**Calculations:**
- MACD Fast MA: EMA(close, fastLength)
- MACD Slow MA: EMA(close, slowLength)
- MACD Line: Fast MA - Slow MA
- Signal Line: SMA(MACD Line, signalLength)
- Volume MA: Exponential MA of volume
- High Volume: Current volume >= Volume MA × Ratio
**Signal logic:**
```
Buy Signal = (MACD crosses above Signal) AND (High volume in last N bars)
Sell Signal = (MACD crosses below Signal) AND (High volume in last N bars)
```
## Parameters Reference
| Parameter | Default | Description |
|-----------|---------|-------------|
| Volume Symbol | Blank | Manual override for volume source (leave blank for automatic detection) |
| Use CME Futures | False | Legacy option (automatic detection is now built-in) |
| Alert Session | 1530-2200 | Active session time range for alerts |
| Timezone | UTC+1 | Timezone for alert sessions |
| Volume MA Period | 20 | Number of periods for volume moving average |
| High Volume Ratio | 2.0 | Volume threshold multiplier (2.0 = 200% of average) |
| Volume Lookback | 5 | Number of bars to check for high volume confirmation |
| MACD Fast Length | 12 | Fast EMA period for MACD calculation |
| MACD Slow Length | 26 | Slow EMA period for MACD calculation |
| MACD Signal Length | 9 | Signal line SMA period |
| Only Buy | False | Filter to show only bullish signals |
| Only Sell | False | Filter to show only bearish signals |
| Show Signals | True | Display buy and sell labels on chart |
## Optimization Tips
**For volatile markets (crypto, small caps):**
- Increase High Volume Ratio to 2.5-3.0
- Reduce Volume Lookback to 3-4 bars
- Consider faster MACD settings (8, 17, 9)
**For stable markets (large-cap stocks, bonds):**
- Decrease High Volume Ratio to 1.5-1.8
- Increase Volume MA Period to 30-50
- Use standard MACD settings
**For forex (with automatic CME futures):**
- The indicator automatically uses CME futures when forex pairs are detected
- Set appropriate trading session based on your timezone
- Use Volume Lookback of 5-7 bars
- Consider session-based alerts only
- Monitor the information table to verify correct futures mapping
**For commodities (Gold, Silver, Oil, Copper):**
- The indicator automatically maps to COMEX and NYMEX futures
- Increase High Volume Ratio to 2.0-2.5 for metals
- Use slightly higher Volume MA Period (25-30) for smoother analysis
- Trade during active market hours for best volume data
- The information table will show the futures contract being used (orange highlight)
## Limitations and Considerations
**What this indicator does NOT do:**
- Does not predict future price direction
- Does not guarantee profitable trades
- Does not replace proper risk management
- Does not work well in extremely low-volume conditions
**Market conditions to avoid:**
- Pre-market and after-hours sessions (low volume)
- Major news events (volatile, unpredictable volume)
- Holidays and low-liquidity periods
- Extremely low float stocks
## Conclusion
Smart MACD Volume Trader represents a significant evolution of the traditional MACD indicator by combining volume confirmation with automatic institutional volume integration. This dual-confirmation approach significantly improves signal quality by filtering out low-conviction price movements and ensuring traders work with accurate volume data.
The indicator's automatic detection and mapping system supports over 24 instruments across forex, commodities, and metals markets. By intelligently switching to CME and COMEX futures contracts when appropriate, the indicator provides forex and commodity traders with the same quality of volume data that stock traders naturally have access to.
This indicator is particularly valuable for traders who want to:
- Align their entries with institutional money flow
- Avoid getting trapped in false breakouts
- Trade forex pairs with reliable volume data
- Access accurate volume information for gold, silver, and energy commodities
- Combine momentum and volume analysis in a single, streamlined tool
Whether you are day trading stocks, swing trading forex pairs, or positioning in commodities markets, this indicator provides a robust framework for identifying high-probability momentum trades backed by genuine institutional participation. The automatic futures mapping works seamlessly across all supported instruments, requiring no manual configuration or expertise in futures markets.
---
## Support and Updates
This indicator is actively maintained and updated based on user feedback and market conditions. For questions about implementation or custom modifications, please use the comments section below.
**Disclaimer:** This indicator is for educational and informational purposes only. Past performance does not guarantee future results. Always conduct your own analysis and risk management before trading.

SMART4TRADER-Margin ZONEIndicator based on marginal zones (according to Mityukov Sergey). In open source.
Formula for calculating the margin:
Margin size / cost tick * minimum price change
Example:
EURUSD = 2100 $ / 6.25 $ * 0.00005 points = 0.01680 points
....
For currency pairs where USD is in the first place it is necessary to write so that the indicator is taken away from zero
Iff (ticker == "USDCAD", (0- (950/5 * 0.00005)),
//////////////////////////////////////////////////////////////////////////////////////////////////
Индикатор на основе маржинальных зон (по Митюкову Сергею). В открытом исходном коде.
Формула рассчета маржи:
размер маржи / стоимость тика * минимальное ценовое изменение
Пример:
EURUSD = 2100 $ / 6.25 $ * 0.00005 points = 0.01680 points
....
Для валютных пар где USD стоит на первом месте нужно писать так, чтобы показатель отнимался от нуля
iff (ticker=="USDCAD", (0-(950/5*0.00005)),
//////////////////////////////////////////////////////////////////////////////////////////////////

Smart Money ConceptSmart Money Concept is being used to understand the Market Structure, Demand/Supply, and Risk Management.
- Lines represent BoS and CHoCH.
- X-cross and Diamond shapes represent Peak and Trough.
- Numbers represent the Spread Percentages.

Smart Money Oscillator [Nic]Smart money index (SMI) or smart money flow index is a technical analysis indicator demonstrating investors' sentiment. The index was invented and popularized by money manager Don Hays. The indicator is based on intra-day price patterns.
The main idea is that the majority of traders (emotional, news-driven) overreact at the beginning of the trading day because of the overnight news and economic data. There is also much buying on market orders and short covering at the opening. Therefore, the basic strategy is to bet against the morning price trend and bet with the evening price trend. The SMI may be calculated for many markets and market indices (S&P 500, Dow Jones, etc.)
This script turns the smart money index into an oscillator so you can determine the relative strength of the smart money.
Smart Money Index (SMI)Smart money index (SMI) or smart money flow index is a technical analysis indicator demonstrating investors sentiment.
The index was invented and popularized by money manager Don Hays. The indicator is based on intra-day price patterns.
The main idea is that the majority of traders (emotional, news-driven) overreact at the beginning of the trading day
because of the overnight news and economic data. There is also a lot of buying on market orders and short covering at the opening.
Smart, experienced investors start trading closer to the end of the day having the opportunity to evaluate market performance.
Therefore, the basic strategy is to bet against the morning price trend and bet with the evening price trend. The SMI may be calculated
for many markets and market indices (S&P 500, DJIA, etc.)
The SMI sends no clear signal whether the market is bullish or bearish. There are also no fixed absolute or relative readings signaling
about the trend. Traders need to look at the SMI dynamics relative to that of the market. If, for example, SMI rises sharply when the
market falls, this fact would mean that smart money is buying, and the market is to revert to an uptrend soon. The opposite situation
is also true. A rapidly falling SMI during a bullish market means that smart money is selling and that market is to revert to a downtrend
soon. The SMI is, therefore, a trend-based indicator.
Some analysts use the smart money index to claim that precious metals such as gold will continually maintain value in the future.

Smart MACD Divergence ScannerOriginal Base Indicator: "CM_MacD_Ult_MTF" by ChrisMoody
This indicator builds upon ChrisMoody's excellent multi-timeframe MACD foundation and transforms it into a professional divergence scanner with advanced quality assessment and filtering capabilities. The original MACD visualization and MTF functionality have been preserved while adding completely new divergence detection, scoring, and filtering systems.
🎯 What Makes This Indicator Unique:
Smart MACD Divergence Scanner is a professional tool for detecting MACD-based divergences with an advanced filtering system and signal quality assessment. Unlike standard divergence indicators, this version includes innovative features:
Adaptive Quality Scoring System — each signal receives a score from 0 to 100 based on multiple factors
Volatility Filter — automatic signal suppression during low market volatility periods
Multi-Timeframe Confirmation — divergence verification on higher timeframe for increased reliability
Divergence Strength Analysis — calculation of percentage difference between price and indicator movement
Information Dashboard — detailed real-time signal statistics
Cooldown System — prevention of multiple consecutive signals
💡 How It Works:
The indicator uses the classic divergence concept — the divergence between price movement and the MACD oscillator. However, instead of simple pivot detection, the algorithm:
Scans the market for local extremes (pivots) on price and MACD histogram
Searches for divergences — when price updates low/high while MACD shows opposite movement
Assesses quality — analyzes divergence strength, volatility, higher timeframe confirmation
Filters noise — eliminates weak signals through threshold system and cooldown
Generates signal — only when all quality criteria are met
🔧 Key Parameters:
MACD Settings: Fast Length (12), Slow Length (26), Signal Length (9)
Divergence Detection: Pivot Lookback (5), Max Lookback Range (60), Min Divergence Strength (15%)
Quality Filters: Min Quality Score (60), Volatility Filter, MTF Confirmation, Signal Cooldown (5)
📊 How to Use:
Add indicator to chart — it will automatically start scanning
Configure filters — start with default settings, then adapt to your trading style
Watch for signals: 🟢 Green "BUY" label = bullish divergence, 🔴 Red "SELL" label = bearish divergence
Check quality score on labels (Q: XX)
Use information panel to monitor statistics and current market conditions
⚙️ Settings Guide:
For swing trading (4H-Daily): Increase Pivot Lookback to 7-10, set Min Quality Score to 70+
For day trading (15m-1H): Keep default settings, enable all filters
For scalping (1m-5m): Decrease Min Quality Score to 50, disable MTF Confirmation
For volatile markets (crypto): Increase Min Divergence Strength to 20-25%, enable Volatility Filter
⚠️ Important Notes:
Divergences are probabilistic signals, not guaranteed reversals
Use additional confirmation (support/resistance levels, volume, price action)
Adjust parameters for specific asset and timeframe
Signals appear with Pivot Lookback bars delay (retrospective confirmation)
On volatile markets, increase Min Quality Score to reduce false signals

Smart Adaptive Signal SystemSmart Adaptive Signal System
Description: The Smart Adaptive Signal System is a sophisticated indicator that generates intelligent buy/sell signals by dynamically adapting to market conditions. It predicts target prices based on momentum and volatility, providing more accurate and reliable trading opportunities.
How It Works:
Dynamic Signal Generation: The system predicts target prices by considering factors such as volatility and momentum. This allows it to react instantly to trend changes and market fluctuations.
Adaptive Thresholds: Buy and sell signals are triggered with adaptive thresholds, adjusting according to market volatility. This ensures flexibility in the face of sudden market changes.
Trend-Based Reset: Users can choose to reset threshold values based on a time interval or trend change. This feature helps the system re-adapt to current market conditions for greater accuracy.
Target Price Prediction: Target prices are calculated using momentum and volatility, helping the system predict future price movements.
How to Use:
Buy/Sell Signals: The indicator generates buy and sell signals based on market conditions. Look for a "down arrow" for a buy signal and an "up arrow" for a sell signal on the chart.
Target Price Lines: Along with buy and sell signals, the system draws target price lines. This helps you visualize potential future price levels.
Flexible Settings: Users can customize analysis periods, minimum change percentages, and other parameters to fit their needs.
Features:
Dynamic buy and sell signals
Target price predictions
Volatility and momentum-based analysis
User-friendly and flexible settings
Trend-based adaptive resetting
Alerts: The Smart Adaptive Signal System responds quickly to sudden market changes, but always use it in conjunction with other indicators like support and resistance levels. Signal accuracy may vary depending on market conditions.
ADR/AWR/AMR Average Daily+Weekly+Monthly Range[Traders Reality]Advanced ADR/AWR/AMR indicator created for Traders Reality community, as well as the greater trading community.
Thanks to the TR community discord guys: infernix, peshocore and xtech5192
Everything is modular and can be turned on/off, including a customisable table showing daily/weekly/monthly average pips/dollars.
If you just want the average daily range lines for example, you can just disable everything else. You can choose how many days to look back; as well as for weeks or months.
Check out Traders Reality on YouTube if you want to see this implemented as part of Tino's strategy that utilizes market manipulation, imbalances, times of day etc.
Price regularly reverses from ADR, making it one of the few highly valuable indicators in price action/smart money trading.

Smart Money Structure FilterEnglish Description
Overview
Smart Money Structure Analyzer is a professional trading tool that implements Smart Money Concepts (SMC) to identify key market structure shifts, Break of Structure (BOS), and Change of Character (CHoCH) patterns. This indicator helps traders follow the "smart money" flow by detecting institutional order flow patterns on any timeframe.
Key Features
Swing Point Detection - Identifies significant highs and lows using fractal-based logic
Market Structure Analysis - Classifies market conditions as Uptrend, Downtrend, or Consolidation
Break of Structure (BOS) - Detects when price breaks key structural levels
Change of Character (CHoCH) - Identifies potential trend reversals
Mitigation Levels - Shows potential retracement targets after structure breaks
How It Works
The indicator analyzes price action through several layers:
Swing Detection Algorithm
Uses a configurable swing period (3-21 bars)
Identifies valid swing highs and lows that are confirmed by surrounding price action
Stores the last 20 swings for structure analysis
Structure Determination
Uptrend: Higher Highs (HH) + Higher Lows (HL)
Downtrend: Lower Lows (LL) + Lower Highs (LH)
Consolidation: Mixed structure or ranging market
Break of Structure (BOS) Logic
Bearish BOS: Price closes below the last confirmed Higher Low (HL)
Bullish BOS: Price closes above the last confirmed Lower High (LH)
Change of Character (CHoCH) Logic
Bearish CHoCH: After a bearish BOS, price forms a Lower Low (confirms trend reversal)
Bullish CHoCH: After a bullish BOS, price forms a Higher High (confirms trend reversal)
Mitigation Levels
Calculates potential retracement levels after BOS (typically ±0.2% from broken structure)
Visual Elements
Fractals: Swing points (optional display)
Structure Lines: Last Higher Low (blue) and Last Lower High (purple)
BOS Signals: Triangles marking structure breaks
CHoCH Signals: Circles confirming trend changes
Mitigation Levels: Dotted orange lines for potential retracements
Info Label: Real-time structure status and key levels
Alerts
The indicator provides alerts for:
Break of Structure (BOS) events
Change of Character (CHoCH) confirmations
Settings
Swing Period: Sensitivity of swing detection (default: 3)
Show Fractals: Toggle swing point markers
Show Structure Lines: Display key structure levels
Show Break of Structure: Display BOS signals
Show Change of Character: Display CHoCH signals
Show Mitigation Levels: Display retracement levels
Best Practices
Use on higher timeframes (1H+) for more reliable signals
Combine with volume analysis for confirmation
Wait for CHoCH confirmation before entering trades
Use mitigation levels as potential entry zones
Русское описание
Обзор
Smart Money Structure Analyzer - профессиональный торговый инструмент, реализующий концепции Smart Money (SMC) для определения ключевых сдвигов рыночной структуры, Break of Structure (BOS) и Change of Character (CHoCH). Индикатор помогает отслеживать поток "умных денег", выявляя паттерны институционального ордерного потока на любом таймфрейме.
Ключевые возможности
Определение свингов - Выявляет значимые максимумы и минимумы с помощью фрактальной логики
Анализ структуры рынка - Классифицирует состояние рынка: Восходящий тренд, Нисходящий тренд или Консолидация
Break of Structure (BOS) - Обнаружение пробития ключевых уровней структуры
Change of Character (CHoCH) - Определение потенциальных разворотов тренда
Уровни митигации - Показывает потенциальные цели отката после пробоя структуры
Принцип работы
Индикатор анализирует ценовое действие через несколько уровней:
Алгоритм определения свингов
Использует настраиваемый период свинга (3-21 свечи)
Определяет валидные максимумы и минимумы, подтвержденные окружающим движением цены
Сохраняет последние 20 свингов для анализа структуры
Определение структуры
Восходящий тренд: Higher Highs (HH) + Higher Lows (HL)
Нисходящий тренд: Lower Lows (LL) + Lower Highs (LH)
Консолидация: Смешанная структура или флет
Логика Break of Structure (BOS)
Медвежий BOS: Цена закрывается ниже последнего Higher Low (HL)
Бычий BOS: Цена закрывается выше последнего Lower High (LH)
Логика Change of Character (CHoCH)
Медвежий CHoCH: После медвежьего BOS формируется Lower Low (подтверждает разворот)
Бычий CHoCH: После бычьего BOS формируется Higher High (подтверждает разворот)
Уровни митигации
Расчет потенциальных уровней отката после BOS (обычно ±0.2% от сломанной структуры)
Визуальные элементы
Фракталы: Точки свингов (опционально)
Линии структуры: Последний Higher Low (синий) и последний Lower High (фиолетовый)
Сигналы BOS: Треугольники, отмечающие пробой структуры
Сигналы CHoCH: Круги, подтверждающие изменение тренда
Уровни митигации: Пунктирные оранжевые линии для потенциальных откатов
Инфо-метка: Статус структуры и ключевые уровни в реальном времени
Оповещения
Индикатор предоставляет алерты для:
Событий Break of Structure (BOS)
Подтверждений Change of Character (CHoCH)
Настройки
Период свинга: Чувствительность определения свингов (по умолчанию: 3)
Показывать фракталы: Включение/выключение маркеров свингов
Показывать линии структуры: Отображение ключевых уровней структуры
Показывать Break of Structure: Отображение сигналов BOS
Показывать Change of Character: Отображение сигналов CHoCH
Показывать уровни митигации: Отображение уровней отката
Рекомендации по использованию
Используйте на старших таймфреймах (1H+) для более надежных сигналов
Комбинируйте с анализом объема для подтверждения
Ждите подтверждения CHoCH перед входом в сделку
Используйте уровни митигации как потенциальные зоны входа
Технические особенности
Максимальное количество меток: 500
Работает на любых таймфреймах
Не перерисовывает прошлые сигналы
Эффективно использует ресурсы благодаря ограничению хранения свингов
Индикатор предназначен для трейдеров, работающих с Price Action и концепциями Smart Money, и помогает систематизировать анализ рыночной структуры в соответствии с подходами институциональных трейдеров.

Smart Money Concept [TradingFinder] Major OB + FVG + Liquidity🔵 Introduction
"Smart Money" refers to funds under the control of institutional investors, central banks, funds, market makers, and other financial entities. Ordinary people recognize investments made by those who have a deep understanding of market performance and possess information typically inaccessible to regular investors as "Smart Money".
Consequently, when market movements often diverge from expectations, traders identify the footprints of smart money. For example, when a classic pattern forms in the market, traders take short positions. However, the market might move upward instead. They attribute this contradiction to smart money and seek to capitalize on such inconsistencies in their trades.
The "Smart Money Concept" (SMC) is one of the primary styles of technical analysis that falls under the subset of "Price Action". Price action encompasses various subcategories, with one of the most significant being "Supply and Demand", in which SMC is categorized.
The SMC method aims to identify trading opportunities by emphasizing the impact of large traders (Smart Money) on the market, offering specific patterns, techniques, and trading strategies.
🟣 Key Terms of Smart Money Concept (SMC)
• Market Structure (Trend)
• Change of Character (ChoCh)
• Break of Structure (BoS)
• Order Blocks (Supply and Demand)
• Imbalance (IMB)
• Inefficiency (IFC)
• Fair Value Gap (FVG)
• Liquidity
• Premium and Discount
🔵 How Does the "Smart Money Concept Indicator" Work?
🟣 Market Structure
a. Accumulation
b. Market-Up
c. Distribution
d. Market-Down
a) Accumulation Phase : During the accumulation period, typically following a downtrend, smart money enters the market without significantly affecting the pricing trend.
b) Market-Up Phase : In this phase, the price of an asset moves upward from the accumulation range and begins to rise. Usually, the buying by retail investors is the main driver of this trend, and due to positive market sentiment, it continues.
c) Distribution Phase : The distribution phase, unlike the accumulation stage, occurs after an uptrend. In this phase, smart money attempts to exit the market without causing significant price fluctuations.
d) Market-Down Phase : In this stage, the price of an asset moves downward from the distribution phase, initiating a prolonged downtrend. Smart money liquidates all its positions by creating selling pressure, trapping latecomer investors.
The result of these four phases in the market becomes the market trend.
Types of Trends in Financial Markets :
a. Up-Trend
b. Down Trend
c. Range (No Trend)
a) Up-Trend : The market breaks consecutive highs.
b) Down Trend : The market breaks consecutive lows.
c) No Trend or Range : The market oscillates within a range without breaking either highs or lows.
🟣 Change of Character (ChoCh)
The "ChoCh" or "Change of Character" pattern indicates an initial change in order flow in financial markets. This structural change occurs when a major pivot in the opposite direction of the market trend fails. It signals a potential change in the market trend and can serve as a signal for short-term or long-term trend changes in a trading symbol.
🟣 Break of Structure (BoS)
The "BoS" or "Break of Structure" pattern indicates the continuation of the trend in financial markets. This structure forms when, in an uptrend, the price breaks its ceiling or, in a downtrend, the price breaks its floor.
🟣 Order Blocks (Supply and Demand)
Order blocks consist of supply and demand areas where the likelihood of price reversal is higher. There are six order blocks in this indicator, categorized based on their origin and formation reasons.
a. Demand Main Zone, "ChoCh" Origin.
b. Demand Sub Zone, "ChoCh" Origin.
c. Demand All Zone, "BoS" Origin.
d. Supply Main Zone, "ChoCh" Origin.
e. Supply Sub Zone, "ChoCh" Origin.
f. Supply All Zone, "BoS" Origin.
🟣 FVG | Inefficiency | Imbalance
These three terms are almost synonymous. They describe the presence of gaps between consecutive candle shadows. This inefficiency occurs when the market moves rapidly. Primarily, imbalances and these rapid movements stem from the entry of smart money and the imbalance between buyer and seller power. Therefore, identifying these movements is crucial for traders.
These areas are significant because prices often return to fill these gaps or even before they occur to fill price gaps.
🟣 Liquidity
Liquidity zones are areas where there is a likelihood of congestion of stop-loss orders. Liquidity is considered the driving force of the entire market, and market makers may manipulate the market using these zones. However, in many cases, this does not happen because there is insufficient liquidity in some areas.
Types of Liquidity in Financial Markets :
a. Trend Lines
b. Double Tops | Double Bottoms
c. Triple Tops | Triple Bottoms
d. Support Lines | Resistance Lines
All four types of liquidity in this indicator are automatically identified.
🟣 Premium and Discount
Premium and discount zones can assist traders in making better decisions. For instance, they may sell positions in expensive ranges and buy in cheaper ranges. The closer the price is to the major resistance, the more expensive it is, and the closer it is to the major support, the cheaper it is.
🔵 How to Use
🟣 Change of Character (ChoCh) and Break of Structure (BoS)
This indicator detects "ChoCh" and "BoS" in both Minor and Major states. You can turn on the display of these lines by referring to the last part of the settings.
🟣 Order Blocks (Supply and Demand)
Order blocks are Zones where the probability of price reversal is higher. In demand Zones you can buy opportunities and in supply Zones you can check sell opportunities.
The "Refinement" feature allows you to adjust the width of the order block according to your strategy. There are two modes, "Aggressive" and "Defensive," in the "Order Block Refine". The difference between "Aggressive" and "Defensive" lies in the width of the order block.
For risk-averse traders, the "Defensive" mode is suitable as it provides a lower loss limit and a greater reward-to-risk ratio. For risk-taking traders, the "Aggressive" mode is more appropriate. These traders prefer to enter trades at higher prices, and this mode, which has a wider order block width, is more suitable for this group of individuals.
🟣 Fair Value Gap (FVG) | Imbalance (IMB) | Inefficiency (IFC)
In order to identify the "fair value gap" on the chart, it must be analyzed candle by candle. In this process, it is important to pay attention to candles with a large size, and a candle and a candle should be examined before that.
Candles before and after this central candle should have long shadows and their bodies should not overlap with the central candle body. The distance between the shadows of the first and third candles is known as the FVG range.
These areas work in two ways :
• Supply and demand area : In this case, the price reacts to these areas and the trend is reversed.
• Liquidity zone : In this scenario, the price "fills" the zone and then reaches the order block.
Important note : In most cases, the FVG zone of very small width acts as a supply and demand zone, while the zone of significant width acts as a liquidity zone and absorbs price.
When the FVG filter is activated, the FVG regions are filtered based on the specified algorithm.
FVG filter types include the following :
1. Very Aggressive Mode : In addition to the initial condition, an additional condition is considered. For bullish FVG, the maximum price of the last candle must be greater than the maximum price of the middle candle.
Similarly, for a bearish FVG, the minimum price of the last candle must be lower than the minimum price of the middle candle. This mode removes the minimum number of FVGs.
2. Aggressive : In addition to the very aggressive condition, the size of the middle candle is also considered. The size of the center candle should not be small and therefore more FVGs are removed in this case.
3. Defensive : In addition to the conditions of the very aggressive mode, this mode also considers the size of the middle pile, which should be relatively large and make up the majority of the body.
Also, to identify bullish FVGs, the second and third candles must be positive, while for bearish FVGs, the second and third candles must be negative. This mode filters out a significant number of FVGs and keeps only those of good quality.
4. Very Defensive : In addition to the conditions of the defensive mode, in this mode the first and third candles should not be very small-bodied doji candles. This mode filters out most FVGs and only the best quality ones remain.
🟣 Liquidity
These levels are where traders intend to exit their trades. "Market makers" or smart money usually accumulate or distribute their trading positions near these levels, where many retail traders have placed their "stop loss" orders. When liquidity is collected from these losses, the price often reverses.
A "Stop hunt" is a move designed to offset liquidity generated by established stop losses. Banks often use major news events to trigger stop hunts and capture liquidity released into the market. For example, if they intend to execute heavy buy orders, they encourage others to sell through stop-hots.
Consequently, if there is liquidity in the market before reaching the order block area, the validity of that order block is higher. Conversely, if the liquidity is close to the order block, that is, the price reaches the order block before reaching the liquidity limit, the validity of that order block is lower.
🟣 Alert
With the new alert functionality in this indicator, you won't miss any important trading signals. Alerts are activated when the price hits the last order block.
1. It is possible to set alerts for each "symbol" and "time frame". The system will automatically detect both and include them in the warning message.
2. Each alert provides the exact date and time it was triggered. This helps you measure the timeliness of the signal and evaluate its relevance.
3. Alerts include target order block price ranges. The "Proximal" level represents the initial price level strike, while the "Distal" level represents the maximum price gap in the block. These details are included in the warning message.
4. You can customize the alert name through the "Alert Name" entry.
5. Create custom messages for "long" and "short" alerts to be sent with notifications.
🔵 Setting
a. Pivot Period of Order Blocks Detector :
Using this parameter, you can set the zigzag period that is formed based on the pivots.
b. Order Blocks Validity Period (Bar) :
You can set the validity period of each Order Block based on the number of candles that have passed since the origin of the Order Block.
c. Demand Main Zone, "ChoCh" Origin :
You can control the display or not display as well as the color of Demand Main Zone, "ChoCh" Origin.
d. Demand Sub Zone, "ChoCh" Origin :
You can control the display or not display as well as the color of Demand Sub Zone, "ChoCh" Origin.
e. Demand All Zone, "BoS" Origin :
You can control the display or not display as well as the color of Demand All Zone, "BoS" Origin.
f. Supply Main Zone, "ChoCh" Origin :
You can control the display or not display as well as the color of Supply Main Zone, "ChoCh" Origin.
g. Supply Sub Zone, "ChoCh" Origin :
You can control the display or not display as well as the color of Supply Sub Zone, "ChoCh" Origin.
h. Supply All Zone, "BoS" Origin :
You can control the display or not display as well as the color of Supply All Zone, "BoS" Origin.
i. Refine Demand Main : You can choose to be refined or not and also the type of refining.
j. Refine Demand Sub : You can choose to be refined or not and also the type of refining.
k. Refine Demand BoS : You can choose to be refined or not and also the type of refining.
l. Refine Supply Main : You can choose to be refined or not and also the type of refining.
m. Refine Supply Sub : You can choose to be refined or not and also the type of refining.
n. Refine Supply BoS : You can choose to be refined or not and also the type of refining.
o. Show Demand FVG : You can choose to show or not show Demand FVG.
p. Show Supply FVG : You can choose to show or not show Supply FVG
q. FVG Filter : You can choose whether FVG is filtered or not. Also specify the type of filter you want to use.
r. Show Statics High Liquidity Line : Show or not show Statics High Liquidity Line.
s. Show Statics Low Liquidity Line : Show or not show Statics Low Liquidity Line.
t. Show Dynamics High Liquidity Line : Show or not show Dynamics High Liquidity Line.
u. Show Dynamics Low Liquidity Line : Show or not show Dynamics Low Liquidity Line.
v. Statics Period Pivot :
Using this parameter, you can set the Swing period that is formed based on Static Liquidity Lines.
w. Dynamics Period Pivot :
Using this parameter, you can set the Swing period that is formed based Dynamics Liquidity Lines.
x. Statics Liquidity Line Sensitivity :
is a number between 0 and 0.4. Increasing this number decreases the sensitivity of the "Statics Liquidity Line Detection" function and increases the number of lines identified. The default value is 0.3.
y. Dynamics Liquidity Line Sensitivity :
is a number between 0.4 and 1.95. Increasing this number increases the sensitivity of the "Dynamics Liquidity Line Detection" function and decreases the number of lines identified. The default value is 1.
z. Alerts Name : You can customize the alert name using this input and set it to your desired name.
aa. Alert Demand Main Mitigation :
If you want to receive the alert about Demand Main 's mitigation after setting the alerts, leave this tick on. Otherwise, turn it off.
bb. Alert Demand Sub Mitigation :
If you want to receive the alert about Demand Sub's mitigation after setting the alerts, leave this tick on. Otherwise, turn it off.
cc. Alert Demand BoS Mitigation :
If you want to receive the alert about Demand BoS's mitigation after setting the alerts, leave this tick on. Otherwise, turn it off.
dd. Alert Supply Main Mitigation :
If you want to receive the alert about Supply Main's mitigation after setting the alerts, leave this tick on. Otherwise, turn it off.
ee. Alert Supply Sub Mitigation :
If you want to receive the alert about Supply Sub's mitigation after setting the alerts, leave this tick on. Otherwise, turn it off.
ff. Alert Supply BoS Mitigation :
If you want to receive the alert about Supply BoS's mitigation after setting the alerts, leave this tick on. Otherwise, turn it off.
gg. Message Frequency :
This parameter, represented as a string, determines the frequency of announcements. Options include: 'All' (triggers the alert every time the function is called), 'Once Per Bar' (triggers the alert only on the first call within the bar), and 'Once Per Bar Close' (activates the alert only during the final script execution of the real-time bar upon closure). The default setting is 'Once per Bar'.
hh. Show Alert time by Time Zone :
The date, hour, and minute displayed in alert messages can be configured to reflect any chosen time zone. For instance, if you prefer London time, you should input 'UTC+1'. By default, this input is configured to the 'UTC' time zone.
ii. Display More Info : The 'Display More Info' option provides details regarding the price range of the order blocks (Zone Price), along with the date, hour, and minute. If you prefer not to include this information in the alert message, you should set it to 'Off'.
You also have access to display or not to display, choose the Style and Color of all the lines below :
a. Major Bullish "BoS" Lines
b. Major Bearish "BoS" Lines
c. Minor Bullish "BoS" Lines
d. Minor Bearish "BoS" Lines
e. Major Bullish "ChoCh" Lines
f. Major Bearish "ChoCh" Lines
g. Minor Bullish "ChoCh" Lines
h. Minor Bearish "ChoCh" Lines
i. Last Major Support Line
j. Last Major Resistance Line
k. Last Minor Support Line
l. Last Minor Resistance Line

Smart Money Setup 05 [TradingFinder] Minor OB & Trend Proof🔵 Introduction
The "Smart Money Concept" transcends the realm of mere technical trading strategies to embody a comprehensive philosophy on the dynamics of market operations. It posits that key market participants engage in price manipulation, thereby complicating the trading landscape for smaller, retail traders.
Under this doctrine, retail traders are advised to tailor their strategies in alignment with the maneuvers of "Smart Money" - essentially, the capital operated by market makers.
To this end, one should endeavor to mirror the trading patterns of these influential market participants, who are adept at navigating through the nuances of supply, demand, and overall market structure. As a proponent of Smart Money trading, these elements are pivotal in your decision-making process for trade entries.
🟣 Key Insights
The core principle of this strategy hinges on misleading other traders. A sudden market movement against the prevailing trend that results in the formation of either a lower low or a higher high, followed by a pullback where a divergence pattern emerges, sets the stage.
Subsequently, the market may form another lower low or higher high. Traders, persuaded that the market will continue along the trajectory of the new movement, are caught off-guard when the price abruptly reverses direction. Following a "Stop Hunt" of the traders' open positions, the market resumes its initial trend.
To grasp the essence of this setup, observe the following illustrations.
"Bullish Setup" :
"Bearish Setup" :
🔵 How to Use
The setups can be customized based on the desired formation period. This adjustment can be made through the indicator's price setting options, where the default period is set at 2.
Upon configuring your preferred period, the signals become actionable. Once a setup forms, the subsequent step involves waiting for the price to reach the "Order Block".
"Bullish Setup" :
"Bearish Setup" :
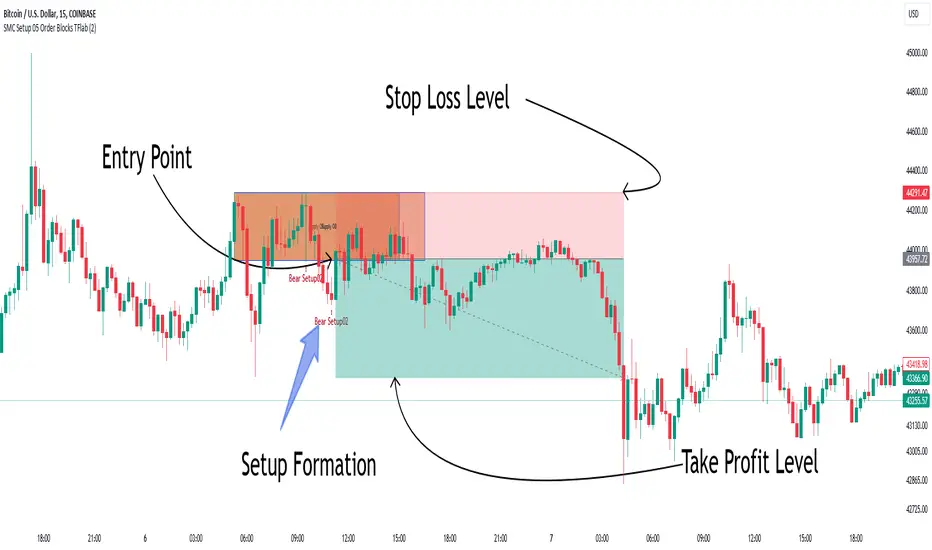
Smart Money Concepts Probability (Expo)█ Overview
The Smart Money Concept Probability (Expo) is an indicator developed to track the actions of institutional investors, commonly known as "smart money." This tool calculates the likelihood of smart money being actively engaged in buying or selling within the market, referred to as the "smart money order flow."
The indicator measures the probability of three key events: Change of Character ( CHoCH ), Shift in Market Structure ( SMS ), and Break of Structure ( BMS ). These probabilities are displayed as percentages alongside their respective levels, providing a straightforward and immediate understanding of the likelihood of smart money order flow.
Finally, the backtested results are shown in a table, which gives traders an understanding of the historical performance of the current order flow direction.
█ Calculations
The algorithm individually computes the likelihood of the events ( CHoCH , SMS , and BMS ). A positive score is assigned for events where the price successfully breaks through the level with the highest probability, and a negative score when the price fails to do so. By doing so, the algorithm determines the probability of each event occurring and calculates the total profitability derived from all the events.
█ Example
In this case, we have an 85% probability that the price will break above the upper range and make a new Break Of Structure and only a 16.36% probability that the price will break below the lower range and make a Change Of Character.
█ Settings
The Structure Period sets the pivot period to use when calculating the market structure.
The Structure Response sets how responsive the market structure should be. A low value returns a more responsive structure. A high value returns a less responsive structure.
█ How to use
This indicator is a perfect tool for anyone that wants to understand the probability of a Change of Character ( CHoCH ), Shift in Market Structure ( SMS ), and Break of Structure ( BMS )
The insights provided by this tool help traders gain an understanding of the smart money order flow direction, which can be used to determine the market trend.
█ Any Alert function call
An alert is sent when the price breaks the upper or lower range, and you can select what should be included in the alert. You can enable the following options:
Ticker ID
Timeframe
Probability percentage
-----------------
Disclaimer
The information contained in my Scripts/Indicators/Ideas/Algos/Systems does not constitute financial advice or a solicitation to buy or sell any securities of any type. I will not accept liability for any loss or damage, including without limitation any loss of profit, which may arise directly or indirectly from the use of or reliance on such information.
All investments involve risk, and the past performance of a security, industry, sector, market, financial product, trading strategy, backtest, or individual's trading does not guarantee future results or returns. Investors are fully responsible for any investment decisions they make. Such decisions should be based solely on an evaluation of their financial circumstances, investment objectives, risk tolerance, and liquidity needs.
My Scripts/Indicators/Ideas/Algos/Systems are only for educational purposes!

Smart Money Concept, Modern ViewSmart Money Concept, Modern View (SMCMV)
Institutional Volume Flow Analysis with VWMA Matrix
━━━━━━━━━━━━━━━━━━━━━━━━━━━━━━━━━━━━━━━━━━━━━━━━━━
📌 OVERVIEW
SMCMV is an advanced institutional-grade indicator that combines Volume-Weighted Moving Average (VWMA) matrix analysis with sophisticated volume decomposition to detect buyer and seller entry points. The indicator provides a comprehensive real-time dashboard displaying market structure, volume dynamics, and validated trading signals.
Key Features:
• Dual Volume Model: Geometry-based (candle range split) and Intrabar (precise LTF data)
• 10-Period VWMA Spectrum: Multi-timeframe support/resistance matrix (7, 13, 19, 23, 31, 41, 47, 67, 83, 97)
• 5-Layer Scoring System: 100-point institutional-grade signal quality assessment
• State Machine Signal Engine: Validated entry/exit signals with timer and range confirmation
• Real-time Prediction Engine: Candle-by-candle buyer/seller probability estimation
• High Volume Node Detection: Automatic identification of significant volume zones
━━━━━━━━━━━━━━━━━━━━━━━━━━━━━━━━━━━━━━━━━━━━━━━━━━
📊 DASHBOARD REFERENCE
1) NOW VECTOR (Current Market State)
This section captures the immediate market conditions:
• FLOW ANGLE: Directional angle of price movement in degrees (from VWMA-5). Positive = bullish, Negative = bearish.
• LTP: Last Traded Price - current close price.
• NET FLOW (Δ): Volume Delta - net difference between buying and selling volume. Shows ⚡+ or ⚡-.
• LIQUIDITY: Total volume on the current bar (K/M format).
• BUY VOL: Estimated buying volume based on selected model.
• SELL VOL: Estimated selling volume.
• BID PRES.: Buying volume as percentage of total volume.
• ASK PRES.: Selling volume as percentage of total volume.
• DIRECTION: Current state with hysteresis: BULL (🐂), BEAR (🐻), or NEUT (⚪).
2) DATA QUALITY / CONFIG
Configuration status and data integrity monitoring:
• VOL MODEL: INTRABAR (uses LTF data) or GEOMETRY (estimates from candle structure).
• IB LTF: Intrabar Lower Timeframe for precise volume decomposition.
• MODE: Micro (7 periods: 7-47) or Macro (10 periods: 7-97).
• IB OK: Intrabar data validity - OK or NO.
• IB STREAK: Consecutive bars with valid intrabar data.
• LATENCY: Data freshness indicator. ✓ = current, ↺ = using historical reference.
3) STRUCTURE RADAR
Market structure analysis showing price position relative to VWMA matrix:
• WIRES ▲/▼: Count of VWMAs above (resistance) and below (support).
• RES: Nearest Resistance - shows MA period, "ZN RES", or "BLUE SKY".
• SUPP: Nearest Support - shows MA period, "ZN SUPP", or "FREE FALL".
4) ACTIVE INTERACTION
Real-time analysis of price interaction with key levels:
• Header Status: "⚠ TESTING SUPPLY (ASK SIDE)" / "⚠ TESTING DEMAND (BID SIDE)" / "--- NO KEY INTERACTION ---"
• TARGET: Active level being tested (MA period or zone type).
• TEST LEVEL: Exact price level being tested.
• SCORE: Total score (0-100%) with letter grade .
• VOLUME POWER: Volume ratio vs historical average (e.g., "2.5x").
• BREAKOUT: "CONFIRMED" if attacking volume exceeds defending, "REJECTED" otherwise.
• DELTA DIR: "ALIGNED" if delta matches accumulation trend, "CONFLICT" if opposing.
━━━━━━━━━━━━━━━━━━━━━━━━━━━━━━━━━━━━━━━━━━━━━━━━━━
🎯 5-LAYER SCORING SYSTEM (100 Points Total)
Layer 1: Volume Quality (Max 25 pts)
• Mass (0-10): Volume ratio vs average. 0.5x=0, 1.0x=5, 2.0x=8, 3.0x+=10
• Spike (0-8): Volume Z-Score intensity
• Trend (0-7): Volume trend alignment with price direction
Layer 2: Battle Structure (Max 25 pts)
• Break (0-10): Breakout intensity ratio (attacker vs defender)
• Dom (0-8): Internal dominance ratio
• Pres (0-7): Pressure imbalance percentage
Layer 3: Flow & Energy (Max 20 pts)
• Delta (0-8): Delta alignment with accumulation trend
• Accel (0-6): Delta acceleration
• Mom (0-6): Flow momentum
Layer 4: Geometry (Max 15 pts)
• Impact (0-7): Impact angle directness
• Vec (0-5): Vector alignment
• PriceZ (0-3): Price Z-Score position
Layer 5: Army Structure (Max 15 pts)
• Stack (0-5): MA stack depth
• Conf (0-5): Confluence percentage
• Trend (0-5): Trend alignment count (7>13, 13>23, 23>97)
Grade Scale:
• A+ = 90-100 pts (Exceptional)
• A = 80-89 pts (Strong)
• B+ = 70-79 pts (Good)
• B = 60-69 pts (Moderate)
• C+ = 50-59 pts (Below average)
• C/D/F = Below 50 pts (Weak)
━━━━━━━━━━━━━━━━━━━━━━━━━━━━━━━━━━━━━━━━━━━━━━━━━━
5) SIGNAL STATUS PANEL
Real-time signal state machine status:
• Header: "🐂 BUYERS ACTIVE" / "🐻 SELLERS ACTIVE" / "⏳ VALIDATING..." / "⏸ RANGE / FLAT"
• LOCK PRICE: Price at which signal was locked/confirmed.
• RANGE ±: Validation range percentage.
• POSITION: Price vs lock: "▲ ABOVE" / "▼ BELOW" / "● AT LOCK"
• DISTANCE: Percentage distance from lock price.
• vs RANGE: Position vs validation range: "IN_RANGE" / "ABOVE" / "BELOW"
• VAL TICKS: Validation progress (current/required ticks).
6) REALTIME PREDICTION PANEL
Candle prediction engine:
• WINNER: Predicted dominant side: "BUYERS" / "SELLERS" / "NEUTRAL"
• CONFIDENCE: Prediction confidence percentage.
• ACCURACY: Historical prediction accuracy (session-specific).
• BUY/SELL PROB: Individual probabilities for each side.
━━━━━━━━━━━━━━━━━━━━━━━━━━━━━━━━━━━━━━━━━━━━━━━━━━
🏷️ SIGNAL LABELS REFERENCE
• 🐂 BUYER ENTRY (Green): Confirmed buyer entry signal. Validation complete.
• 🐻 SELLER ENTRY (Red): Confirmed seller entry signal. Validation complete.
• 🔻 REVERSAL BUY→SELL (Magenta): Reversal from buyer to seller position.
• 🔺 REVERSAL SELL→BUY (Cyan): Reversal from seller to buyer position.
• ⏹ EXIT → FLAT (Gray): Position exit to flat/neutral state.
• ⬆ BUYER STRONGER (Small Green): Lock price updated higher during buyer state.
• ⬇ SELLER STRONGER (Small Red): Lock price updated lower during seller state.
Display Modes:
• Minimal: Icon only (hover for tooltip details)
• Normal: Icon + Price level
• Detailed: Full information (price, score, grade)
━━━━━━━━━━━━━━━━━━━━━━━━━━━━━━━━━━━━━━━━━━━━━━━━━━
📈 CHART ELEMENTS
VWMA Spectrum Lines
Colored gradient lines representing the 10-period VWMA matrix. Color progresses from light blue (fast: 7-period) through purple to orange (slow: 97-period). These act as dynamic support/resistance levels weighted by volume.
High Volume Node Lines
• Blue Lines: High Buy Volume zones - potential demand areas
• Red Lines: High Sell Volume zones - potential supply areas
• Yellow Lines: Overlapping zones (buy + sell extremes) - high conflict areas
Lock Price Line & Range Band
• Dashed Line: Locked price level (green for buyers, red for sellers)
• Dotted Lines: Upper/lower bounds of validation range
━━━━━━━━━━━━━━━━━━━━━━━━━━━━━━━━━━━━━━━━━━━━━━━━━━
⚙️ INPUT SETTINGS GUIDE
Volume Model
• Calculation Method: "Geometry (Candle-Range Split)" for universal compatibility or "Intrabar (Precise)" for accurate buy/sell separation.
• Intrabar LTF: Lower timeframe for Intrabar mode (e.g., "1" for 1-minute).
Direction Filter
• Direction Trigger Angle: Threshold for directional state change (default: 1.5°)
• Neutral Reset Angle: Threshold for returning to neutral (default: 0.7°)
Testing Filter
• Level Proximity (%): How close price must be to "test" a level (default: 0.25%)
• Require Wick Touch: If enabled, requires high/low to touch proximity band.
Signal Validation
• Lock Range (%): Price range for validation (default: 0.5%)
• Validation Ticks: Consecutive bars required (default: 3)
• Validation Time: Minimum seconds for real-time confirmation (default: 5)
• Minimum Hold Bars: Stay in position for at least this many bars (default: 5)
• Exit Mode: "Reversal Only" / "Signal Loss" / "Price Stop"
• Stop Loss (%): Exit threshold (default: 1.0%)
Signal Score Filter
• Score Range Minimum: Minimum score for signal generation (default: 10%)
• Score Range Maximum: Maximum score threshold (default: 100%)
━━━━━━━━━━━━━━━━━━━━━━━━━━━━━━━━━━━━━━━━━━━━━━━━━━
💡 USAGE RECOMMENDATIONS
1. Start with Macro mode to see the complete VWMA spectrum, then switch to Micro for cleaner charts.
2. Use Intrabar mode when your broker provides lower timeframe data.
3. Focus on high-grade signals (B+ or better) for higher probability setups.
4. Wait for validation to complete before acting on signals.
5. Use the Lock Price line as your reference for position management.
━━━━━━━━━━━━━━━━━━━━━━━━━━━━━━━━━━━━━━━━━━━━━━━━━━
⚠️ IMPORTANT NOTES
• This indicator is designed for educational and analytical purposes.
• Always combine with proper risk management and additional confirmation.
• Past performance and signal quality do not guarantee future results.
• The prediction accuracy is session-specific and resets on chart reload.
━━━━━━━━━━━━━━━━━━━━━━━━━━━━━━━━━━━━━━━━━━━━━━━━━━
Volume-Based Indicator — Data Granularity & Table Guide
1) Critical warning about data granularity (read first)
Important: This indicator is built entirely on volume-derived calculations (volume, volume delta, and related flow metrics). Because of that, its precision is only as good as the granularity and history of the data you feed it.
The most granular view is a tick-based interval (e.g., 1T = one trade/tick). If tick-based intervals are not available for your symbol or your plan, the closest time-based approximation is a 1-second chart (1S).
If you enable any "high-precision / intrabar" options (anything that relies on the smallest updates), make sure you understand which TradingView plan you are using, because intrabar historical depth (how many bars you can load) varies by plan. More history generally means more stable baselines for volume statistics, regime detection, and long lookback features.
Plan-related notes (TradingView)
TradingView limits how many intrabar historical bars can be loaded, depending on your plan. The exact limits are defined by TradingView and can change over time, but as of the current documentation, the intrabar limits are:
• Basic: 5,000 bars
• Essential: 10,000 bars
• Plus: 10,000 bars
• Premium: 20,000 bars
• Expert: 25,000 bars
• Ultimate: 40,000 bars
Tick charts / tick-based intervals are currently positioned as a feature of professional-tier plans (e.g., Expert/Elite/Ultimate). Availability may also vary by symbol and data feed.

Smart Money Concepts - Absorption Smart Money Concepts - Absorption (SMC-ABS)
Absorption event detector using split-volume VWMA ribbons, entropy filtering, and elasticity validation
Overview
This indicator highlights potential absorption/defense events: moments where price touches a volume-weighted band and then rejects, while additional filters confirm that market conditions are not random/noisy.
What it plots
• Energy ribbons (bands): two split-volume VWMA ribbon sets - Buy-weighted (cyan) and Sell-weighted (magma).
• ABS markers: printed when touch + rejection + validation conditions are met (see Logic section).
• Dashboard (HUD): real-time metrics such as price/volume z-scores, delta, entropy state, and resonance momentum states.
Core logic
1) Volume engine
The script builds Buy Volume and Sell Volume series using one of two modes:
• Geometry (candle-range split): estimates buy/sell participation from the close position within the candle range.
• Intrabar (precise): uses lower-timeframe up/down volume to derive buy/sell flows when data is available.
2) Split-VWMA resonance score
For multiple periods (5, 10, 20, 30, 40, 50), the script computes:
• A standard SMA of price.
• A Buy-weighted VWMA of price (weighted by Buy Volume).
• A Sell-weighted VWMA of price (weighted by Sell Volume).
Resonance is derived from the normalized divergence between the SMA and the split VWMAs, aggregated across the available periods.
3) Validation filters
Signals can be filtered by the following components (each toggleable):
• Volume-weighted entropy: a fractal-efficiency style disorder metric (TR-sum vs range) adjusted by relative volume; high entropy blocks signals.
• Momentum alignment (resonance velocity) : direction filter requiring positive velocity for buy events and negative velocity for sell events.
• Elasticity (recoil vs penetration): rejection quality check based on the bounce-back strength relative to the penetration depth into the fast band.
Absorption event conditions (ABS markers)
ABS markers are generated using the fastest ribbon band (length 5) for the touch/rejection logic:
• Buy absorption: low touches/penetrates the Buy band and the candle closes back above it, with filters passing.
• Sell absorption: high touches/penetrates the Sell band and the candle closes back below it, with filters passing.
Note: acceleration/deceleration is displayed in the HUD as a state; the primary directional filter is the resonance velocity.
Settings
• Volume Model: choose Geometry or Intrabar.
• Intrabar LTF: lower timeframe used by the Intrabar model (only applies when Intrabar is selected).
• Global Lookback: lookback window used for z-score statistics and related calculations.
• Quantum Filters: toggles and thresholds for entropy, momentum alignment, and elasticity validation.
• Dashboard Settings :/ Energy Ribbons / Absorption Events: controls for visuals and filtering behavior.
Usage notes and limitations
• Signals are most reliable after candle close. On the forming candle, conditions can change until the bar closes.
• Results depend on the availability and quality of volume data for the selected symbol and exchange.
• The Geometry mode is an estimate based on candle structure; it is not tick-accurate order flow.
• Terms such as “quantum” and “physics” are metaphorical labels for statistical filters and validation heuristics.
Disclaimer
This tool is provided for analytical and educational use only. It does not constitute investment advice. Trading involves risk.
Important note about Intrabar data and TradingView plan limits
This indicator is volume-dependent. When using the Intrabar model, the best results typically come from very low intrabar timeframes such as 1 tick or 1 second (if your symbol and data feed support it). Please check your TradingView subscription plan and data entitlements - access to 1-second/1-tick lower timeframes is commonly restricted to higher-tier plans (often referred to as Premium/Ultra tiers). If intrabar data is not available, the script falls back to relative buy/sell volume estimation (Geometry mode), and results may be less precise.

Smarter Money Concepts Dashboard [PhenLabs]📊Smarter Money Concepts Dashboard
Version: PineScript™v6
📌Description
The Smarter Money Concepts Dashboard is a comprehensive institutional trading analysis tool that combines six of our most powerful smarter money concepts indicators into one unified suite. This advanced system automatically detects and visualizes Fair Value Gaps, Inverted FVGs, Order Blocks, Wyckoff Springs/Upthrusts, Wick Rejection patterns, and ICT Market Structure analysis.
Built for serious traders who need institutional-grade market analysis, this dashboard eliminates subjective interpretation by automatically identifying where smart money is likely positioned. The integrated real-time dashboard provides instant status updates on all active patterns, making it easy to monitor market conditions at a glance.
🚀Points of Innovation
● Multi-Module Integration: Six different SMC concepts unified in one comprehensive system
● Real-Time Dashboard Display: Live tracking of all active patterns with customizable positioning
● Advanced Volume Filtering: Institutional volume confirmation across all pattern types
● Automated Pattern Management: Smart memory system prevents chart clutter while maintaining relevant zones
● Probability-Based Wyckoff Detection: Mathematical probability calculations for spring/upthrust patterns
● Dual FVG System: Both standard and inverted Fair Value Gap detection with equilibrium analysis
🔧Core Components
● Fair Value Gap Engine: Detects standard FVGs with volume confirmation and equilibrium line analysis
● Inverted FVG Module: Advanced IFVG detection using RVI momentum filtering for inversion confirmation
● Order Block System: Institutional order block identification with customizable mitigation methods
● Wyckoff Pattern Recognition: Automated spring and upthrust detection with probability scoring
● Wick Rejection Analysis: High-probability reversal patterns based on wick-to-body ratios
● ICT Market Structure: Simplified institutional concepts with commitment tracking
🔥Key Features
● Comprehensive Pattern Detection: All major SMC concepts in one indicator with automatic identification
● Volume-Confirmed Signals: Multiple volume filters ensure only institutional-grade patterns are highlighted
● Interactive Dashboard: Real-time status display with active pattern counts and module status
● Smart Memory Management: Automatic cleanup of old patterns while preserving relevant market zones
● Full Alert System: Complete notification coverage for all pattern types and signal generations
● Customizable Display Options: Adjustable colors, transparency, and positioning for all visual elements
🎨Visualization
● Color-Coded Zones: Distinct color schemes for bullish/bearish patterns across all modules
● Dynamic Box Extensions: Automatically extending zones until mitigation or invalidation
● Equilibrium Lines: Fair Value Gap midpoint analysis with dotted line visualization
● Signal Markers: Clear spring/upthrust signals with directional arrows and probability indicators
● Dashboard Table: Professional-grade status panel with module activation and pattern counts
● Candle Coloring: Wick rejection highlighting with transparency-based visual emphasis
📖Usage Guidelines
Fair Value Gap Settings
● Days to Analyze: Default 15, Range 1-100 - Controls historical FVG detection period
● Volume Filter: Enables institutional volume confirmation for gap validity
● Min Volume Ratio: Default 1.5 - Minimum volume spike required for gap recognition
● Show Equilibrium Lines: Displays FVG midpoint analysis for precise entry targeting
Order Block Configuration
● Scan Range: Default 25 bars - Lookback period for structure break identification
● Volume Filter: Institutional volume confirmation for order block validation
● Mitigation Method: Wick or Close-based invalidation for different trading styles
● Min Volume Ratio: Default 1.5 - Volume threshold for significant order block formation
Wyckoff Analysis Parameters
● S/R Lookback: Default 20 - Support/resistance calculation period for spring/upthrust detection
● Volume Spike Multiplier: Default 1.5 - Required volume increase for pattern confirmation
● Probability Threshold: Default 0.7 - Minimum probability score for signal generation
● ATR Recovery Period: Default 5 - Price recovery calculation for pattern strength assessment
Market Structure Settings
● Auto-Detect Zones: Automatic identification of high-volume thin zones
● Proximity Threshold: Default 0.20% - Price proximity requirements for zone interaction
● Test Window: Default 20 bars - Time period for zone commitment calculation
Display Customization
● Dashboard Position: Four corner options for optimal chart layout
● Text Size: Scalable from Tiny to Large for different screen configurations
● Pattern Colors: Full customization of all bullish and bearish zone colors
✅Best Use Cases
● Swing Trading: Identify major institutional zones for multi-day position entries
● Day Trading: Precise intraday entries at Fair Value Gaps and Order Block boundaries
● Trend Analysis: Market structure confirmation for directional bias establishment
● Risk Management: Clear invalidation levels provided by all pattern boundaries
● Multi-Timeframe Analysis: Works across all timeframes from 1-minute to monthly charts
⚠️Limitations
● Market Condition Dependency: Performance varies between trending and ranging market environments
● Volume Data Requirements: Requires accurate volume data for optimal pattern confirmation
● Lagging Nature: Some patterns confirmed after initial price movement has begun
● Pattern Density: High-volatility markets may generate excessive pattern signals
● Educational Tool: Requires understanding of smart money concepts for effective application
💡What Makes This Unique
● Complete SMC Integration: First indicator to combine all major smart money concepts comprehensively
● Real-Time Dashboard: Instant visual feedback on all active institutional patterns
● Advanced Volume Analysis: Multi-layered volume confirmation across all detection modules
● Probability-Based Signals: Mathematical approach to Wyckoff pattern recognition accuracy
● Professional Memory Management: Sophisticated pattern cleanup without losing market relevance
🔬How It Works
1. Pattern Detection Phase:
● Multi-timeframe scanning for institutional footprints across all enabled modules
● Volume analysis integration confirms patterns meet institutional trading criteria
● Real-time pattern validation ensures only high-probability setups are displayed
2. Signal Generation Process:
● Automated zone creation with precise boundary definitions for each pattern type
● Dynamic extension system maintains relevance until mitigation or invalidation occurs
● Alert system activation provides immediate notification of new pattern formations
3. Dashboard Update Cycle:
● Live status monitoring tracks all active patterns and module states continuously
● Pattern count updates provide instant feedback on current market condition density
● Commitment tracking for market structure analysis shows institutional engagement levels
💡Note:
This indicator represents institutional trading concepts and should be used as part of a comprehensive trading strategy. Pattern recognition accuracy improves with understanding of smart money principles. Combine with proper risk management and multiple confirmation methods for optimal results.

Smarter Money Concepts - OBs [PhenLabs]📊 Smarter Money Concepts - OBs
Version: PineScript™ v6
📌 Description
Smarter Money Concepts - OBs (Order Blocks) is an advanced technical analysis tool designed to identify and visualize institutional order zones on your charts. Order blocks represent significant areas of liquidity where smart money has entered positions before major moves. By tracking these zones, traders can anticipate potential reversals, continuations, and key reaction points in price action.
This indicator incorporates volume filtering technology to identify only the most significant order blocks, eliminating low-quality signals and focusing on areas where institutional participation is likely present. The combination of price structure analysis and volume confirmation provides traders with high-probability zones that may attract future price action for tests, rejections, or breakouts.
🚀 Points of Innovation
Volume-Filtered Block Detection : Identifies only order blocks formed with significant volume, focusing on areas with institutional participation
Advanced Break of Structure Logic : Uses sophisticated price action analysis to detect legitimate market structure breaks preceding order blocks
Dynamic Block Management : Intelligently tracks, extends, and removes order blocks based on price interaction and time-based expiration
Structure Recognition System : Employs technical analysis algorithms to find significant swing points for accurate order block identification
Dual Directional Tracking : Simultaneously monitors both bullish and bearish order blocks for comprehensive market structure analysis
🔧 Core Components
Order Block Detection : Identifies institutional entry zones by analyzing price action before significant breaks of structure, capturing where smart money has likely positioned before moves.
Volume Filtering Algorithm : Calculates relative volume compared to a moving average to qualify only order blocks formed with significant market participation, eliminating noise.
Structure Break Recognition : Uses price action analysis to detect legitimate breaks of market structure, ensuring order blocks are identified only at significant market turning points.
Dynamic Block Management : Continuously monitors price interaction with existing blocks, extending, maintaining, or removing them based on current market behavior.
🔥 Key Features
Volume-Based Filtering : Filter out insignificant blocks by requiring a minimum volume threshold, focusing only on zones with likely institutional activity
Visual Block Highlighting : Color-coded boxes clearly mark bullish and bearish order blocks with customizable appearance
Flexible Mitigation Options : Choose between “Wick” or “Close” methods for determining when a block has been tested or mitigated
Scan Range Adjustment : Customize how far back the indicator looks for structure points to adapt to different market conditions and timeframes
Break Source Selection : Configure which price component (close, open, high, low) is used to determine structure breaks for precise block identification
🎨 Visualization
Bullish Order Blocks : Blue-colored rectangles highlighting zones where bullish institutional orders were likely placed before upward moves, representing potential support areas.
Bearish Order Blocks : Red-colored rectangles highlighting zones where bearish institutional orders were likely placed before downward moves, representing potential resistance areas.
Block Extension : Order blocks extend to the right of the chart, providing clear visualization of these significant zones as price continues to develop.
📖 Usage Guidelines
Order Block Settings
Scan Range : Default: 25. Defines how many bars the indicator scans to determine significant structure points for order block identification.
Bull Break Price Source : Default: Close. Determines which price component is used to detect bullish breaks of structure.
Bear Break Price Source : Default: Close. Determines which price component is used to detect bearish breaks of structure.
Visual Settings
Bullish Blocks Color : Default: Blue with 85% transparency. Controls the appearance of bullish order blocks.
Bearish Blocks Color : Default: Red with 85% transparency. Controls the appearance of bearish order blocks.
General Options
Block Mitigation Method : Default: Wick, Options: Wick, Close. Determines how block mitigation is calculated - “Wick” uses high/low values while “Close” uses close values for more conservative mitigation criteria.
Remove Filled Blocks : Default: Disabled. When enabled, order blocks are removed once they’ve been mitigated by price action.
Volume Filter
Volume Filter Enabled : Default: Enabled. When activated, only shows order blocks formed with significant volume relative to recent average.
Volume SMA Period : Default: 15, Range: 1-50. Number of periods used to calculate the average volume baseline.
Min. Volume Ratio : Default: 1.5, Range: 0.5-10.0. Minimum volume ratio compared to average required to display an order block; higher values filter out more blocks.
✅ Best Use Cases
Identifying high-probability support and resistance zones for trade entries and exits
Finding optimal stop-loss placement behind significant order blocks
Detecting potential reversal areas where price may react after extended moves
Confirming breakout trades when price clears major order blocks
Building a comprehensive market structure map for medium to long-term trading decisions
Pinpointing areas where smart money may have positioned before major market moves
⚠️ Limitations
Most effective on higher timeframes (1H and above) where institutional activity is more clearly defined
Can generate multiple signals in choppy market conditions, requiring additional filtering
Volume filtering relies on accurate volume data, which may be less reliable for some securities
Recent market structure changes may invalidate older order blocks not yet automatically removed
Block identification is based on historical price action and may not predict future behavior with certainty
💡 What Makes This Unique
Volume Intelligence : Unlike basic order block indicators, this script incorporates volume analysis to identify only the most significant institutional zones, focusing on quality over quantity.
Structural Precision : Uses sophisticated break of structure algorithms to identify true market turning points, going beyond simple price pattern recognition.
Dynamic Block Management : Implements automatic block tracking, extension, and cleanup to maintain a clean and relevant chart display without manual intervention.
Institutional Focus : Designed specifically to highlight areas where smart money has likely positioned, helping retail traders align with institutional perspectives rather than retail noise.
🔬 How It Works
1. Structure Identification Process :
The indicator continuously scans price action to identify significant swing points and structure levels within the specified range, establishing a foundation for order block recognition.
2. Break Detection :
When price breaks an established structure level (crossing below a significant low for bearish breaks or above a significant high for bullish breaks), the indicator marks this as a potential zone for order block formation.
3. Volume Qualification :
For each potential order block, the algorithm calculates the relative volume compared to the configured period average. Only blocks formed with volume exceeding the minimum ratio threshold are displayed.
4. Block Creation and Management :
Valid order blocks are created, tracked, and managed as price continues to develop. Blocks extend to the right of the chart until they are either mitigated by price action or expire after the designated timeframe.
5. Continuous Monitoring :
The indicator constantly evaluates price interaction with existing blocks, determining when blocks have been tested, mitigated, or invalidated, and updates the visual representation accordingly.
💡 Note:
Order Blocks represent areas where institutional traders have likely established positions and may defend these zones during future price visits. For optimal results, use this indicator in conjunction with other confluent factors such as key support/resistance levels, trendlines, or additional confirmation indicators. The most reliable signals typically occur on higher timeframes where institutional activity is most prominent. Start with the default settings and adjust parameters gradually to match your specific trading instrument and style.

Smart Money Concepts (SMC) [LuxAlgo]This all-in-one indicator displays real-time market structure (internal & swing BOS / CHoCH), order blocks, premium & discount zones, equal highs & lows, and much more...allowing traders to automatically mark up their charts with widely used price action methodologies. Following the release of our Fair Value Gap script, we received numerous requests from our community to release more features in the same category.
"Smart Money Concepts" (SMC) is a fairly new yet widely used term amongst price action traders looking to more accurately navigate liquidity & find more optimal points of interest in the market. Trying to determine where institutional market participants have orders placed (buy or sell side liquidity) can be a very reasonable approach to finding more practical entries & exits based on price action.
The indicator includes alerts for the presence of swing structures and many other relevant conditions.
Features
This indicator includes many features relevant to SMC, these are highlighted below:
Full internal & swing market structure labeling in real-time
Break of Structure (BOS)
Change of Character (CHoCH)
Order Blocks (bullish & bearish)
Equal Highs & Lows
Fair Value Gap Detection
Previous Highs & Lows
Premium & Discount Zones as a range
Options to style the indicator to more easily display these concepts
Settings
Mode: Allows the user to select Historical (default) or Present, which displays only recent data on the chart.
Style: Allows the user to select different styling for the entire indicator between Colored (default) and Monochrome.
Color Candles: Plots candles based on the internal & swing structures from within the indicator on the chart.
Internal Structure: Displays the internal structure labels & dashed lines to represent them. (BOS & CHoCH).
Confluence Filter: Filter non-significant internal structure breakouts.
Swing Structure: Displays the swing structure labels & solid lines on the chart (larger BOS & CHoCH labels).
Swing Points: Displays swing points labels on chart such as HH, HL, LH, LL.
Internal Order Blocks: Enables Internal Order Blocks & allows the user to select how many most recent Internal Order Blocks appear on the chart.
Swing Order Blocks: Enables Swing Order Blocks & allows the user to select how many most recent Swing Order Blocks appear on the chart.
Equal Highs & Lows: Displays EQH/EQL labels on chart for detecting equal highs & lows.
Bars Confirmation: Allows the user to select how many bars are needed to confirm an EQH/EQL symbol on chart.
Fair Value Gaps: Displays boxes to highlight imbalance areas on the chart.
Auto Threshold: Filter out non-significant fair value gaps.
Timeframe: Allows the user to select the timeframe for the Fair Value Gap detection.
Extend FVG: Allows the user to choose how many bars to extend the Fair Value Gap boxes on the chart.
Highs & Lows MTF: Allows the user to display previous highs & lows from daily, weekly, & monthly timeframes as significant levels.
Premium/Discount Zones: Allows the user to display Premium, Discount, and Equilibrium zones on the chart
Usage
Users can see automatic CHoCH and BOS labels to highlight breakouts of market structure, which allows to determine the market trend. In the chart below we can see the internal structure which displays more frequent labels within larger structures. We can also see equal highs & lows (EQH/EQL) labels plotted alongside the internal structure to frequently give indications of potential reversals.
In the chart below we can see the swing market structure labels. These are also labeled as BOS and CHoCH but with a solid line & larger text to show larger market structure breakouts & trend reversals. Users can be mindful of these larger structure labels while trading internal structures as displayed in the previous chart.
Order blocks highlight areas where institutional market participants open positions, one can use order blocks to determine confirmation entries or potential targets as we can expect there is a large amount of liquidity at these order blocks. In the chart below we can see 2 potential trade setups with confirmation entries. The path outlined in red would be a potential short entry targeting the blue order block below, and the path outlined in green would be a potential long entry, targeting the red order blocks above.
As we can see in the chart below, the bullish confirmation entry played out in this scenario with the green path outlined in hindsight. As price breaks though the order blocks above, the indicator will consider them mitigated causing them to disappear, and as per the logic of these order blocks they will always display 5 (by default) on the chart so we can now see more actionable levels.
The Smart Money Concepts indicator has many other features and here we can see how they can also help a user find potential levels for price action trading. In the screenshot below we can see a trade setup using the Previous Monthly High, Strong High, and a Swing Order Block as a stop loss. Accompanied by the Premium from the Discount/Premium zones feature being used as a potential entry. A potential take profit level for this trade setup that a user could easily identify would be the 50% mark labeled with the Fair Value Gap & the Equilibrium all displayed automatically by the indicator.
Conclusion
This indicator highlights all relevant components of Smart Money Concepts which can be a very useful interpretation of market structure, liquidity, & more simply put, price action. The term was coined & popularized primarily within the forex community & by ICT while making its way to become a part of many traders' analysis. These concepts, with or without this indicator do not guarantee a trader to be trading within the presence of institutional or "bank-level" liquidity, there is no supporting data regarding the validity of these teachings.

Smarter Money Volume Rejection Blocks [PhenLabs]📊 Smarter Money Volume Rejection Blocks – Institutional Rejection Zone Detection
The Smarter Money Volume Rejection Blocks indicator combines high-volume analysis with statistical confidence intervals to identify where institutional traders are actively defending price levels through volume spikes and rejection patterns.
🔥 Core Methodology
Volume Spike Detection analyzes when current volume exceeds moving average by configurable multipliers (1.0-5.0x) to identify institutional activity
Rejection Candle Analysis uses dual-ratio system measuring wick percentage (30-90%) and maximum body ratio (10-60%) to confirm genuine rejections
Statistical Confidence Channels create three-level zones (upper, center, lower) based on ATR or Standard Deviation calculations
Smart Invalidation Logic automatically clears zones when price significantly breaches confidence levels to maintain relevance
Dynamic Channel Projection extends confidence intervals forward up to 200 bars with customizable length
Support Zone Identification detects bullish rejections where smart money absorbs selling pressure with high volume and strong lower wicks
Resistance Zone Mapping identifies bearish rejections where institutions defend price levels with volume spikes and pronounced upper wicks
Visual Information Dashboard displays real-time status table showing volume spike conditions and active support/resistance zones
⚙️ Technical Configuration
Dual Confidence Interval Methods: Choose between ATR-Based for trend-following environments or StdDev-Based for range-bound statistical precision
Volume Moving Average: Configurable period (default 20) for baseline volume comparison calculations
Volume Spike Multiplier: Adjustable threshold from 1.0 to 5.0 times average volume to filter institutional activity
Rejection Wick Percentage: Set minimum wick size from 30% to 90% of candle range for valid rejection detection
Maximum Body Ratio: Configure body-to-range ratio from 10% to 60% to ensure genuine rejection structures
Confidence Multiplier: Statistical multiplier (default 1.96) for 95% confidence interval calculations
Channel Projection Length: Extend confidence zones forward from 10 to 200 bars for anticipatory analysis
ATR Period: Customize Average True Range lookback from 5 to 50 bars for volatility-based calculations
StdDev Period: Adjust Standard Deviation period from 10 to 100 bars for statistical precision
🎯 Real-World Trading Applications
Identify high-probability support zones where institutional buyers have historically defended price with significant volume
Map resistance levels where smart money sellers consistently reject higher prices with volume confirmation
Combine with price action analysis to confirm breakout validity when price approaches confidence channel boundaries
Use invalidation signals to exit positions when smart money zones are definitively breached
Monitor the real-time dashboard to quickly assess current market structure and active rejection zones
Adapt strategy based on calculation method: ATR for trending markets, StdDev for ranging conditions
Set alerts on confidence level breaches to catch potential trend reversals or continuation patterns
📈 Visual Interpretation Guide
Green Zones indicate bullish rejection blocks where buyers defended with high volume and lower wicks
Red Zones indicate bearish rejection blocks where sellers defended with high volume and upper wicks
Solid Center Lines represent the core rejection price level where maximum volume activity occurred
Dashed Confidence Boundaries show upper and lower statistical limits based on volatility calculations
Zone Opacity decreases as channels extend forward to indicate decreasing confidence over time
Dashboard Color Coding provides instant visual feedback on active volume spike and zone conditions
⚠️ Important Considerations
Volume-based indicators identify historical rejection zones but cannot predict future price action with certainty
Market conditions change rapidly and institutional activity patterns evolve continuously
High volume does not guarantee level defense as market structure can shift without warning
Confidence intervals represent statistical probabilities, not guaranteed price boundaries

Smarter Money Flow Divergence Detector [PhenLabs]📊 Smarter Money Flow Divergence Detector
Version: PineScript™ v6
📌 Description
SMFD was developed to help give you guys a better ability to “read” what is going on behind the scenes without directly having access to that level of data. SMFD is an enhanced divergence detection indicator that identifies money flow patterns from advanced volume analysis and price action correspondence. The detection portion of this indicator combines intelligent money flow calculations with multi timeframe volume analysis to help you see hidden accumulation and distribution phases before major price movements occur.
The indicator measures institutional trading activity by looking at volume surges, price volume dynamics, and the factors of momentum to construct an overall picture of market sentiment. It’s built to assist traders in identifying high probability entries by identifying if smart money is positioning against price action.
🚀 Points of Innovation
● Advanced Smart Money Flow algorithm with volume spike detection and large trade weighting
● Multi timeframe volume analysis for enhanced institutional activity detection
● Dynamic overbought/oversold zones that adapt to current market conditions
● Enhanced divergence detection with pivot confirmation and strength validation
● Color themes with customizable visual styling options
● Real time institutional bias tracking through accumulation/distribution analysis
🔧 Core Components
● Smart Money Flow Calculation: Combines price momentum, volume expansion, and VWAP analysis
● Institutional Bias Oscillator: Tracks accumulation/distribution patterns with volume pressure analysis
● Enhanced Divergence Engine: Detects bullish/bearish divergences with multiple confirmation factors
● Dynamic Zone Detection: Automatically adjusts overbought/oversold levels based on market volatility
● Volume Pressure Analysis: Measures buying vs selling pressure over configurable periods
● Multi factor Signal System: Generates entries with trend alignment and strength validation
🔥 Key Features
● Smart Money Flow Period: Configurable calculation period for institutional activity detection
● Volume Spike Threshold: Adjustable multiplier for detecting unusual institutional volume
● Large Trade Weight: Emphasis factor for high volume periods in flow calculations
● Pivot Detection: Customizable lookback period for accurate divergence identification
● Signal Sensitivity: Three tier system (Conservative/Medium/Aggressive) for signal generation
● Themes: Four color schemes optimized for different chart backgrounds
🎨 Visualization
● Main Oscillator: Line, Area, or Histogram display styles with dynamic color coding
● Institutional Bias Line: Real time tracking of accumulation/distribution phases
● Dynamic Zones: Adaptive overbought/oversold boundaries with gradient fills
● Divergence Lines: Automatic drawing of bullish/bearish divergence connections
● Entry Signals: Clear BUY/SELL labels with signal strength indicators
● Information Panel: Real time statistics and status updates in customizable positions
📖 Usage Guidelines
Algorithm Settings
● Smart Money Flow Period
○ Default: 20
○ Range: 5-100
○ Description: Controls the calculation period for institutional flow analysis.
Higher values provide smoother signals but reduce responsiveness to recent activity
● Volume Spike Threshold
○ Default: 1.8
○ Range: 1.0-5.0
○ Description: Multiplier for detecting unusual volume activity indicating institutional participation. Higher values require more extreme volume for detection
● Large Trade Weight
○ Default: 2.5
○ Range: 1.5-5.0
○ Description: Weight applied to high volume periods in smart money calculations. Increases emphasis on institutional sized transactions
Divergence Detection
● Pivot Detection Period
○ Default: 12
○ Range: 5-50
○ Description: Bars to analyze for pivot high/low identification.
Affects divergence accuracy and signal frequency
● Minimum Divergence Strength
○ Default: 0.25
○ Range: 0.1-1.0
○ Description: Required price change percentage for valid divergence patterns.
Higher values filter out weaker signals
✅ Best Use Cases
● Trading with intraday to daily timeframes for institutional position identification
● Confirming trend reversals when divergences align with support/resistance levels
● Entry timing in trending markets when institutional bias supports the direction
● Risk management by avoiding trades against strong institutional positioning
● Multi timeframe analysis combining short term signals with longer term bias
⚠️ Limitations
● Requires sufficient volume for accurate institutional detection in low volume markets
● Divergence signals may have false positives during highly volatile news events
● Best performance on liquid markets with consistent institutional participation
● Lagging nature of volume based calculations may delay signal generation
● Effectiveness reduced during low participation holiday periods
💡 What Makes This Unique
● Multi Factor Analysis: Combines volume, price, and momentum for comprehensive institutional detection
● Adaptive Zones: Dynamic overbought/oversold levels that adjust to market conditions
● Volume Intelligence: Advanced algorithms identify institutional sized transactions
● Professional Visualization: Multiple display styles with customizable themes
● Confirmation System: Multiple validation layers reduce false signal generation
🔬 How It Works
1. Volume Analysis Phase:
● Analyzes current volume against historical averages to identify institutional activity
● Applies multi timeframe analysis for enhanced detection accuracy
● Calculates volume pressure through buying vs selling momentum
2. Smart Money Flow Calculation:
● Combines typical price with volume weighted analysis
● Applies institutional trade weighting for high volume periods
● Generates directional flow based on price momentum and volume expansion
3. Divergence Detection Process:
● Identifies pivot highs/lows in both price and indicator values
● Validates divergence strength against minimum threshold requirements
● Confirms signals through multiple technical factors before generation
💡 Note: This indicator works best when combined with proper risk management and position sizing. The institutional bias component helps identify market sentiment shifts, while divergence signals provide specific entry opportunities. For optimal results, use on liquid markets with consistent institutional participation and combine with additional technical analysis methods.

Smart Money Trades Pro [BOSWaves]Smart Money Trades Pro – Advanced Market Structure & Liquidity Visualizer
Overview
Smart Money Trades Pro is a comprehensive trading tool designed for traders seeking an in-depth understanding of market structure, liquidity dynamics, and institutional flow. The indicator systematically identifies key market turning points, including break of structure (BOS) and change of character (CHoCH) events, and overlays these with adaptive visualizations to highlight high-probability trade setups. By integrating ATR-based risk zones, progressive take-profit levels, and real-time trade analytics, Smart Money Trades Pro transforms complex price action into an interpretable framework suitable for multiple trading styles, including scalping, intraday, and swing trading.
Unlike traditional static indicators, Smart Money Trades Pro adapts continuously to market conditions. It evaluates swing highs and lows over a configurable lookback period, then determines structural breaks using customizable confirmation methods (candle body or wick). The resulting signals are augmented with dynamic entry, stop-loss, and target levels, allowing traders to analyze potential trade opportunities with both precision and context. The indicator’s design ensures that each visual element—trend-colored candles, signal markers, and risk/reward boxes—reflects real-time market conditions, offering an actionable interpretation of institutional activity.
How It Works
The indicator’s foundation is built upon market structure analysis. By calculating pivot highs and lows over a specified period, Smart Money Trades Pro identifies potential points of liquidity accumulation and exhaustion. When price breaks a pivot high or low, the indicator evaluates whether this constitutes a BOS or a CHoCH, signaling trend continuation or reversal. These events are marked on the chart with distinct visual cues, allowing traders to quickly discern shifts in market sentiment without manually analyzing historical price action.
Once a structural break is confirmed, the indicator automatically determines entry levels, stop-loss placements, and progressive take-profit zones (TP1, TP2, TP3). These calculations are based on ATR-derived volatility, ensuring that targets scale with current market conditions. Risk and reward zones are plotted as shaded boxes, providing a clear visual representation of potential profit relative to risk for each trade setup. This system allows traders to maintain discipline and consistency, with dynamic trade management baked directly into the visualization.
Trend direction is further reinforced by color-coded candles, which reflect the prevailing market bias. Bullish trends are represented by one color, bearish trends by another, and neutral conditions are displayed in muted tones. This continuous visual feedback simplifies the process of trend assessment and helps confirm the validity of trade setups alongside BOS and CHoCH markers.
Signals and Breakouts
Smart Money Trades Pro includes structured visual signals to indicate actionable price movements:
Bullish Break Signals – Triangular markers below the candle appear when a swing high is broken, suggesting potential long opportunities.
Bearish Break Signals – Triangular markers above the candle appear when a swing low is broken, indicating potential short setups.
Change of Character (CHoCH) – Special markers highlight trend reversals, showing where momentum shifts from bullish to bearish or vice versa.
These markers are strategically spaced to prevent overlap and remain clear during high-volatility periods. Traders can use them in combination with trend-colored candles, risk/reward zones, and ATR-based targets to assess the strength and reliability of each setup. The integrated table provides live trade information, including entry price, stop-loss level, take-profit levels, risk/reward ratio, and trade direction, ensuring that trade decisions are informed and data-driven.
Interpretation
Trend Analysis : The indicator’s trend coloring, combined with BOS and CHoCH detection, provides an immediate view of market direction. Rising structures indicate bullish momentum, while falling structures signal bearish momentum. CHoCH markers highlight potential trend reversals or significant liquidity sweeps.
Volatility and Risk Assessment : ATR-based calculations determine stop-loss distances and target levels, giving a quantitative measure of risk relative to market volatility. Wide ATR readings indicate periods of high price fluctuation, whereas narrow readings suggest consolidation and reduced risk exposure.
Market Structure Insights : By monitoring swing highs and lows alongside break confirmations, traders can identify where institutional players are likely active. Areas with multiple structural breaks or overlapping targets can indicate liquidity hotspots, potential reversal zones, or areas of market congestion.
Trade Management : The built-in trade zones allow traders to visualize entry, risk, and reward simultaneously. Progressive targets (TP1, TP2, TP3) reflect incremental profit-taking strategies, while dynamic stop-loss levels help preserve capital during adverse moves.
Strategy Integration
Smart Money Trades Pro supports a range of trading approaches:
Trend Following : Enter trades in the direction of confirmed BOS while using CHoCH markers and trend-colored candles to validate momentum.
Pullback Entries : Use failed breakout retests or minor reversals toward broken structure levels for lower-risk entries.
Mean Reversion : In consolidated zones with narrow ATR and repeated BOS/CHoCH activity, anticipate reversals or short-term corrective moves.
Multi-Timeframe Confirmation : Overlay signals on higher or lower timeframes to filter noise and improve trade accuracy.
Stop-loss levels should be placed just beyond the opposing structural point, while take-profit targets can be scaled using the ATR-based zones. Progressive targets allow for partial exits or scaling out of trades while maintaining exposure to larger moves.
Advanced Techniques
Traders seeking greater precision can combine Smart Money Trades Pro with volume, momentum, or volatility indicators to validate signals. Observing sequences of BOS and CHoCH markers across multiple timeframes provides insight into liquidity accumulation and depletion trends. Tracking the expansion or contraction of ATR-based zones helps anticipate shifts in volatility, enabling better timing for entries and exits.
Customizing the structure period and confirmation type allows the indicator to adapt to different asset classes and timeframes. Shorter periods increase sensitivity to smaller swings, while longer periods filter noise and emphasize higher-probability structural breaks. By integrating these features, the indicator offers a robust statistical framework for disciplined, data-driven trading decisions.
Inputs and Customization
Structure Detection Period : Defines the lookback window for pivot high and low calculation.
Break Confirmation : Choose whether to confirm breaks using candle body or wick.
Display CHoCH : Toggle visibility of change-of-character markers.
Color Trend Bars : Enable color-coding of candles based on market structure direction.
Show Info Table : Display trade dashboard showing entry, stop-loss, take-profits, risk/reward, and bias.
Table Position : Choose from top-left, top-right, bottom-left, or bottom-right placement.
Color Customization : Configure bullish, bearish, neutral, risk, reward, and text colors for enhanced visual clarity.
Why Use Smart Money Trades Pro
Smart Money Trades Pro transforms complex market behavior into an actionable visual framework. By combining market structure analysis, liquidity tracking, ATR-based risk/reward mapping, and a dynamic trade dashboard, it provides a multidimensional view of the market. Traders can focus on execution, interpret trends, and evaluate overextensions or reversals without relying on guesswork. The indicator is suitable for scalping, intraday, and swing strategies, offering a comprehensive system for understanding and trading alongside institutional participants.
