SPY Ninja
SPY Ninja correlates the true strength index exponential moving averages of SPY and VIX together. In doing so we can determine the start of trend shifts via SPY / VIX convergence in addition to crossover, with potential market entries and exits represented by the LONG and SELL signals.
SMMA 50,100, and 200 have been added to chart due to the historic SPY market reactivity to these moving averages. They often act as natural support and resistance levels with SPY, and when coinciding LONG and SHORT signals appear touching any of these levels, it adds an extra layer of confidence for traders' decisions. Also, by highlighting the areas on our SPY chart (red background areas) that represent a VIX threshold higher than 25, we can bring attention to areas with potentially higher volatility immediately so that traders know to proceed with caution.
SPY Ninja works harmoniously with the SPY Ninja Oscillator; Ninja provides the signals highlighting risky VIX areas of concern, while the Ninja Oscillator adds an additional 3 levels of potential confirmation for your trade decisions.
Cerca negli script per "spy"
SPY Downside Risk - Bond Flow Indicator (Daily)## **SPY Downside Risk - Bond Flow Indicator**
### 📊 **Overview**
A professional bond market risk monitoring indicator that assesses SPY (S&P 500 ETF) downside risk by tracking Treasury yield spreads and credit spreads. The indicator provides two complementary display modes for comprehensive market analysis.
---
### 🎯 **Key Features**
#### **Mode 1: Spreads Analysis**
Monitor critical fixed-income risk indicators:
- **10Y-2Y Treasury Spread**
- 🔵 Blue Line (> 20bp): Normal economic expansion
- 🟠 Orange Line (0-20bp): Flight-to-safety sentiment emerging
- 🔴 Red Line (< 0bp): **Yield curve inversion - Recession warning**
- **HY-IG Credit Spread** (High Yield - Investment Grade)
- 🟣 Purple Line: Credit spread widening - Rising default risk
- 🟢 Green Line: Credit spread tightening - Risk appetite improving
#### **Mode 2: Bond ETFs Capital Flow**
Track capital movements across four major bond ETFs:
- **SHY** (🔴 Red): 1-3 Year Treasury - Short-term safety
- **TLT** (🟠 Orange): 20+ Year Treasury - Long-term safety
- **LQD** (🟡 Yellow): Investment Grade Bonds - Quality credit
- **HYG** (🔵 Blue): High Yield Bonds - Risk appetite
---
### 🔧 **Input Parameters**
| Parameter | Default | Description |
|-----------|---------|-------------|
| **Display Mode** | Spreads | Choose between "Spreads" or "Bond ETFs" view |
| **ROC Period** | 10 | Rate of change period (for Bond ETFs mode smoothing) |
| **10Y-2Y Threshold** | 20 bp | Spread narrowing threshold indicating safe-haven flows |
| **VIX Filter Level** | 18 | Volatility threshold for heightened market stress |
---
### 📈 **How to Use**
#### **Yield Curve Inversion Signal**
When 10Y-2Y spread inverts (< 0bp):
- Historically precedes recession within 6-24 months
- Equity markets may face correction in 3-12 months
- Consider defensive positioning (bonds, gold, utilities)
#### **Credit Spread Expansion**
When HY-IG spread rapidly widens:
- Corporate default risk increasing
- Capital flowing from risky assets to safety
- Potential equity market pullback ahead
#### **Capital Flow Analysis**
- **SHY ⬆️ + HYG ⬇️** = Risk-off mode, equity pressure mounting
- **HYG ⬆️ + SHY ⬇️** = Risk-on sentiment, bullish for equities
- **TLT surge** = Long rates falling, economic slowdown expected
- **LQD + HYG divergence** = Credit quality differentiation
---
### 📊 **Real-Time Debug Table**
Upper-right corner displays key metrics:
**Spreads Mode:**
- **10Y-2Y Spread**: Current yield curve spread (basis points)
- **Credit Spread**: HY-IG spread (basis points)
- **VIX**: Market volatility index
**Bond ETFs Mode:**
- **SHY Flow**: Short-term Treasury momentum (%)
- **HYG Flow**: High-yield bond momentum (%)
- **VIX**: Market volatility index
**Color Coding:**
- 🔴 Red = High risk / Inverted
- 🟠 Orange = Caution / Elevated
- 🔵 Blue/Gray = Normal conditions
---
### ⚠️ **Trading Signals**
#### **High Risk Scenarios**
1. **Yield curve inverted** (Red line < 0) + **VIX > 18** (Orange)
- Action: Reduce equity exposure, increase cash/bonds
2. **Credit spread widening** + **HYG Flow negative**
- Action: Avoid high-yield debt, favor quality bonds
3. **SHY Flow positive** + **SPY declining**
- Action: Flight-to-safety confirmed, defensive positioning
#### **Bullish Scenarios**
1. **Steep yield curve** (Blue line > 50bp) + **HYG Flow > 3%**
- Action: Risk-on environment, equity allocation appropriate
2. **Credit spread tightening** + **Low VIX** (< 15)
- Action: Favorable credit conditions, growth exposure
---
### 🔔 **Alert System**
**Built-in Alert:**
- **Treasury Spread Inversion Alert**: Triggers when 10Y-2Y spread crosses below 0
**How to Set Up:**
1. Click "Create Alert" in TradingView
2. Select condition: "Treasury Spread Inversion Alert"
3. Configure notification preferences
---
### 📚 **Data Sources**
**Treasury Yields** - Federal Reserve Economic Data (FRED):
- `DGS2`: 2-Year Treasury Constant Maturity Rate
- `DGS10`: 10-Year Treasury Constant Maturity Rate
**Credit Spreads** - FRED:
- `BAMLC0A1CAAAEY`: ICE BofA US Corporate Index Option-Adjusted Spread
- `BAMLH0A0HYM2`: ICE BofA US High Yield Index Option-Adjusted Spread
**ETF Data** - AMEX/NASDAQ:
- iShares 1-3 Year Treasury Bond ETF (SHY)
- iShares 20+ Year Treasury Bond ETF (TLT)
- iShares iBoxx $ Investment Grade Corporate Bond ETF (LQD)
- iShares iBoxx $ High Yield Corporate Bond ETF (HYG)
**Volatility** - CBOE:
- VIX Index (Volatility Index)
**Update Frequency**: Daily (FRED data typically 1-2 day lag)
---
### 💡 **Best Practices**
1. **Timeframe**: Use on **Daily charts** for optimal signal quality
2. **Confirmation**: Combine with SPY price action, volume, and momentum indicators
3. **Risk Management**: Signals are early warnings - adjust positions gradually
4. **Mode Switching**: Toggle between modes weekly to understand both spread dynamics and flow patterns
5. **Historical Context**: Review past inversion periods (2000, 2007, 2019) for signal validation
---
### 📖 **Interpretation Guide**
#### **Recession Probability Matrix**
| 10Y-2Y Spread | Credit Spread | VIX | Risk Level |
|---------------|---------------|-----|------------|
| < -20bp | Widening | > 25 | 🔴 Very High |
| -20bp to 0 | Widening | > 18 | 🟠 High |
| 0-20bp | Stable | 15-18 | 🟡 Moderate |
| > 20bp | Tightening | < 15 | 🟢 Low |
#### **Lead Times (Historical Average)**
- Yield curve inversion → Recession: **12-18 months**
- Credit spread surge → Equity peak: **3-6 months**
- Safe-haven flows → Volatility spike: **1-4 weeks**
---
### 🎓 **Educational Notes**
**Why Monitor Treasury Spreads?**
- Long-term rates reflect growth expectations
- Short-term rates reflect Fed policy
- Inversion = Market expects Fed to cut rates (recession ahead)
**Why Track Credit Spreads?**
- Measures corporate borrowing stress
- Leading indicator of credit cycle turns
- High correlation with equity risk premiums
**Why Bond ETF Flows Matter?**
- Real-time capital allocation signals
- Faster than spread movements
- Shows risk sentiment shifts
---
### ⚙️ **Technical Specifications**
- **Version**: PineScript v5
- **Type**: Indicator (Non-overlay)
- **Calculation**: Daily timeframe only
- **Lookback Period**: 10 bars (customizable for ETF mode)
---
### 🚨 **Risk Disclaimer**
**IMPORTANT NOTICES:**
1. **Historical Performance**: Past yield curve inversions don't guarantee future recession timing
2. **False Signals**: Brief inversions (<30 days) may not indicate recession
3. **Data Lag**: FRED economic data has 1-2 business day delay
4. **Complementary Tool**: Use alongside fundamental and technical analysis
5. **Not Financial Advice**: For educational and research purposes only
**This indicator does not:**
- Provide specific buy/sell signals
- Guarantee trading profits
- Replace professional financial advice
- Account for individual risk tolerance
---
### 📞 **Support & Updates**
- **Questions**: Contact via TradingView private message
- **Bug Reports**: Describe issue with screenshot and chart settings
- **Feature Requests**: Suggestions welcome for future versions
---
### 📋 **Version History**
**v1.0** (December 2025)
- Initial release
- Dual-mode display (Spreads + Bond ETFs)
- Real-time debug table
- Yield curve inversion alert
- VIX filter integration
---
### 📄 **License**
**Protected Script** - Source code is not publicly available. Authorized users only.
---
**DISCLAIMER**: This indicator is provided "as-is" for educational purposes. Trading and investing involve substantial risk of loss. Always conduct your own research and consult with a licensed financial advisor before making investment decisions.
---
**© 2025 | SPY Downside Risk Indicator | All Rights Reserved**

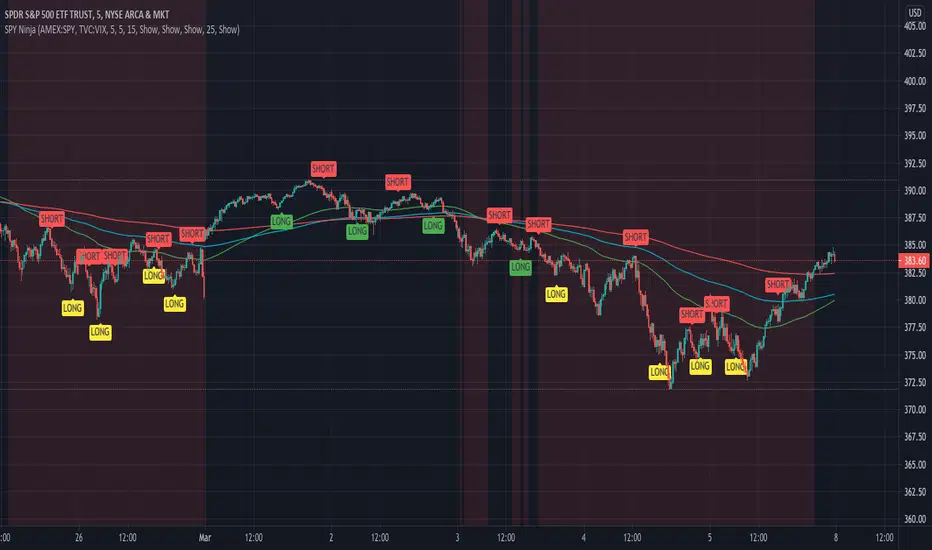
Multi-Ticker RS vs SPYThis Pine Script, titled "Multi-Ticker RS vs SPY," is a clean and efficient indicator designed for TradingView, enabling traders to monitor the relative strength (RS) of up to 10 ticker symbols compared to the S&P 500 ETF (SPY) on a single chart. Ideal for options traders, such as those managing a $1,400 account, it provides a simple way to assess which stocks are outperforming or underperforming the broader market. As of February 26, 2025, the script supports any chart timeframe, such as 5-minute or daily intervals, and calculates RS based on a user-defined lookback period, defaulting to 1 bar for real-time insights.
Users can input ticker symbols via customizable settings, with defaults set to popular stocks like AAPL, TSLA, NVDA, GOOGL, AMZN, MSFT, FB, NFLX, INTC, and PYPL. The script fetches closing prices for each ticker and SPY, computes their percentage changes over the lookback period, and determines RS as the ratio of each ticker’s change to SPY’s change, handling division by zero gracefully. It displays each ticker’s current RS score in a vertical column of labels on the chart’s top-left corner, updated on the last bar to avoid clutter. Users can adjust label size (tiny, small, normal, large) and text color for visibility, ensuring a tailored, error-free experience for quick market analysis.

High Low Index SPY Top 40Modification from original code for "High Low Index" by © LonesomeTheBlue
- Made modification specifically for Top 40 AMEX:SPY holdings
- Added Market sentiment histogram (Total count green vs red), and SMA line for it
- Added arrows for peaks and dips on High Low Index and Market Sentiment MA
Idea behind this indicator is that SPY should follow the overall sentiment of its top holdings. I believe this bring great value to SPY traders.
Enjoy~!

Stochastic & SPY StochasticUsing this indicator you will be able to use the standard stochastic of a stock ticker as well as the stochastic of the S&P 500 (SPY) index simultaneously and without changing charts - both stochastics combined in only one indicator.
The S&P 500 (SPY) stochastic is displayed with higher transparency. The degree of transparency and default color settings can be adjusted in the indicator settings.
For special analysis purposes, it is possible to display only the stochastic of the selected stock ticker or only the stochastic of the S&P 500 (SPY) index.

SPY Ninja Oscillator
SPY Ninja Oscillator correlates the true strength index exponential moving averages of SPY (green) and VIX (red) together. In doing so we can determine the start of trend shifts via SPY / VIX convergence in addition to crossover, with potential market entries and exits represented by the vertical green and red bars.
MACD and RSI have been scaled proportionally to the oscillator range ( for rsi: (rsi-50)*. 01 , and for macd: macd /3) and when overlaid and used in conjunction with the market vertical entry and exit signals, potential trend prediction becomes much more apparent.

SPY SECTOR MONEY FLOW ANALYTICSSPY AND DJI SECTOR VOLUME ADVANCE AND DECLINE
THIS CONTAINS THE KEY CONSTITUENTS OF SPY AND DJI TO HELP TRADERS TO PROVIDE HOW UNDERLYING VOLUME AFFECTS THE REVERSAL

SPY Flow + ORBSPY Flow is an intraday overlay indicator combining:
9/21 EMA ribbon calculated on Heikin-Ashi candles
5-minute opening range high/ low with persistent box and breakout detection
Daily VWAP (Heikin-Ashi based)
Unique behavior: master signals fire only on concurrent ORB breakout and EMA ribbon direction alignment. All other conditions are suppressed. Result is extremely low signal frequency with high alignment probability on SPY.

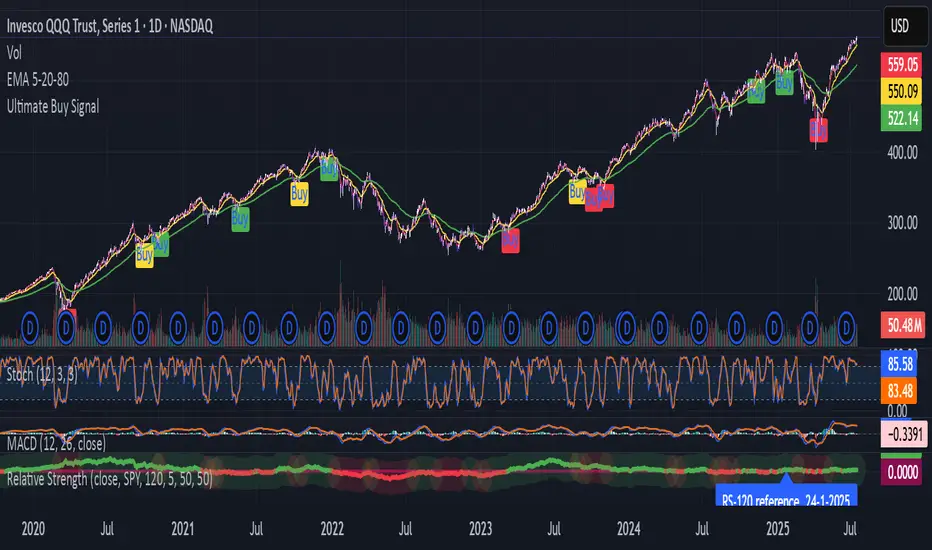
SPY Trend-Based Buy Signals🔹 Overview
This indicator identifies potential buy signals on any asset by combining MACD and Stochastic Oscillator crossovers, while using the SPY’s trend (via exponential moving averages) as a broader market filter.
It helps traders stay aligned with macro momentum and avoid counter-trend entries.
🔍 How it works
SPY Trend Filter (Daily Timeframe):
Pulls SPY (S&P 500 ETF) data using EMAs (5, 20, 80)
Categorizes SPY market trend with color codes:
🟢 Green: Strong uptrend (EMA5 > EMA20 > EMA80)
🟡 Yellow: Potential uptrend / early momentum (EMA5 < EMA20 > EMA80)
🔴 Red: Downtrend (EMA5 < EMA20 < EMA80)
🔵 Blue: Possible trend reversal or mixed trend (EMA5 > EMA20 < EMA80)
Buy Signal Conditions (Combined Logic):
A signal is only triggered when:
- SPY trend is either yellow or blue (indicating a neutral-to-bullish or early recovery environment)
-The Stochastic Oscillator's %D line is below 50, showing possible upside
- A bullish MACD crossover occurs on the current symbol
🟢 Green signal: MACD crossover occurs below 0 (early reversal)
🟠 Orange signal: MACD crossover occurs above 0 (momentum continuation)
📈 Visual Output
🟢 Green label below the bar when an early reversal setup occurs
🟠 Orange label above the bar when a trend continuation signal appears
✅ Best Use Case
Ideal for:
Swing traders and position traders
LEAPS (long-term options) traders aligning entries with SPY trend
Anyone seeking clean, contextual entries filtered by market momentum
⚠️ Note: This indicator is most effective when used on fundamentally strong stocks that are sector leaders with solid earnings growth and market presence. Use technical signals as a complement to quality fundamentals.
ℹ️ Clarification: The moving averages displayed on the chart (e.g., on QQQ) are for visual reference only, to help users understand the color logic of the SPY trend filter. The actual logic and signals are based on SPY’s moving averages, regardless of the charted symbol.
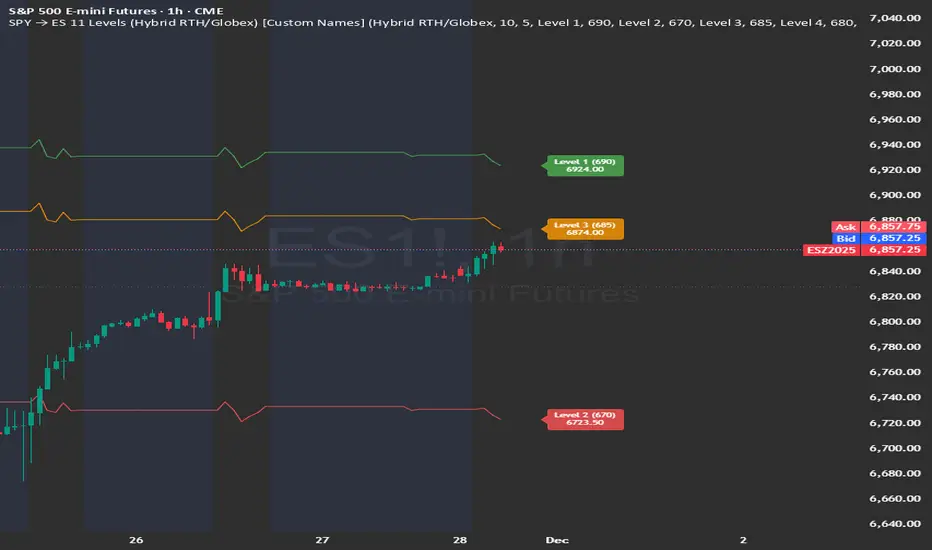
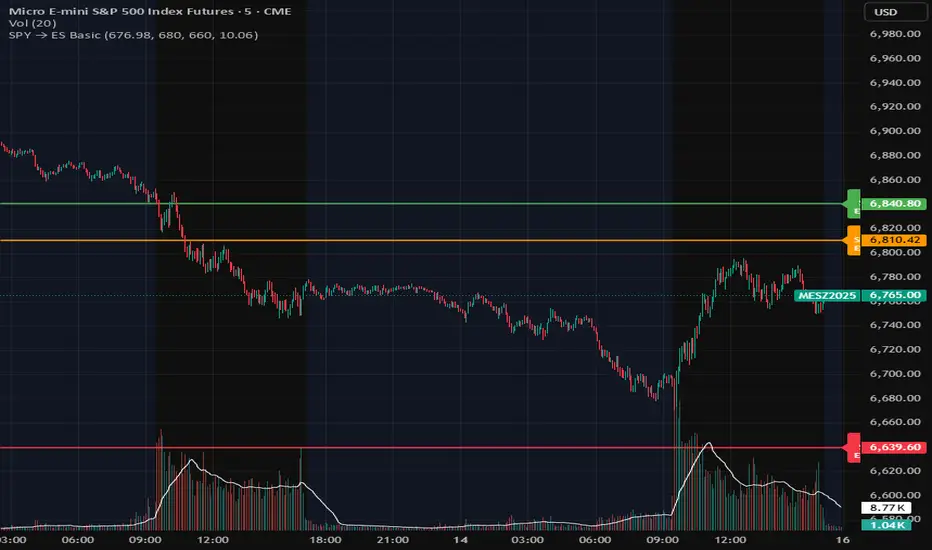
SPY → ES 11 Levels (Hybrid RTH/Globex) [Tick Fixed]📌 Description for SPY → ES 11-Level Converter (with Labels)
This script converts important SPY options-based levels into their equivalent ES futures prices and plots them directly on the ES chart.
Because SPY trades at a different price scale than ES, each SPY level is multiplied by a customizable ES/SPY ratio to project accurate ES levels.
It is designed for traders who use SpotGamma, GEXBot, MenthorQ, Vol-trigger levels, or their own gamma/oi/volume models.
🔍 Features
✅ Converts SPY → ES using custom or automatic ratio
Option to manually enter a ratio (recommended for accuracy)
Or automatically compute ES/SPY from live prices
✅ Plots 11 major levels on the ES chart
Each level can be individually turned ON/OFF:
Call Wall
Put Wall
Volume Trigger
Spot Price
+Gamma Level
–Gamma Level
Zero Gamma
Positive OI
Negative OI
Positive Volume
Negative Volume
All levels are drawn as clean horizontal lines using the converted ES value.
SPY → ES 11 Levels with Labels📌 Description for SPY → ES 11-Level Converter (with Labels)
This script converts important SPY options-based levels into their equivalent ES futures prices and plots them directly on the ES chart.
Because SPY trades at a different price scale than ES, each SPY level is multiplied by a customizable ES/SPY ratio to project accurate ES levels.
It is designed for traders who use SpotGamma, GEXBot, MenthorQ, Vol-trigger levels, or their own gamma/oi/volume models.
🔍 Features
✅ Converts SPY → ES using custom or automatic ratio
Option to manually enter a ratio (recommended for accuracy)
Or automatically compute ES/SPY from live prices
✅ Plots 11 major levels on the ES chart
Each level can be individually turned ON/OFF:
Call Wall
Put Wall
Volume Trigger
Spot Price
+Gamma Level
–Gamma Level
Zero Gamma
Positive OI
Negative OI
Positive Volume
Negative Volume
All levels are drawn as clean horizontal lines using the converted ES value.

SPY vs VIX SMA Slope Alignment (Adjustable Days)Use this on VIX Chart only.
This indicator compares the SLOPE of the daily SMA of SPY, to the SLOPE of the Daily SMA to VIX
When SPY and VIX are trending UP for the length of time that you define, you will get a GREEN ARROW on the VIX chart showing that the condition has been met.
EXAMPLE:
Set 3 day SMA for VIX and SPY
THEN
Set Look back time to 2 days
---IF SPY 3day SMA AND VIX 3day SMA are both ASCENDING during any 3 day lookback period, a green indicator arrow will be showing on the VIX Chart
DO NOT Use this indicator on SPY Chart
(SPY and VIX have different daily open/close times. This indicator DOES NOT work propertly on SPY Chart. But it DOES work properly on VIX chart. )

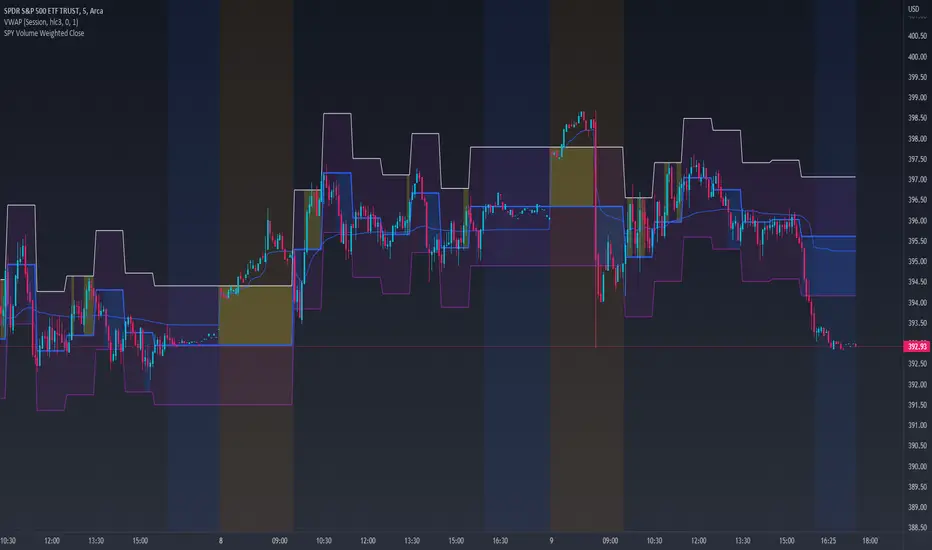
SPY Volume Weighted CloseHey everyone!
Deciding to make this indicator public and open access.
This is a volume weighted close indicator for SPY. It is a statistics based indicator.
How it works:
It uses volume data mixed with some price action data to prospectively predict where SPY's price will close within a 30 minute interval.
As such, its different from other indicators in the sense that its not reactive, it proactive and actively predicts the price that SPY will see within the next 30 minutes and where SPY will most likely close at.
It has 3 bands. The main centre band (blue, but colour can be changed) is the most likely price that SPY will close at within the next 30 minutes.
The Upper Level Confidence and Lower Level Confidence bands are the expected range that the analysis thinks SPY will remain confined in based on current volume and price action.
How to Use it:
I personally use this in place of VWAP, but the applications are infinite. Take a look at the chart below:
Applications:
This is specifically programmed for SPY but I have used it with other stocks such as QQQ, UPRO and DIA. However, using it with those stocks, the upper and lower confidence bands are not helpful. But YMMV with other stocks. This is specifically designed for SPY.
Let me know your questions and thoughts!
Thanks for reading and checking this out!
SPY SRX S&R Levels - Premium EditionSRX SPY Predictive Support & Resistance Levels
SRX is not a typical TradingView support/resistance indicator.
These levels are not calculated on TradingView at all . Instead, every morning after market open, nearly 20,000 data points are analyzed externally to determine where SPY is statistically most likely to react.
This produces support and resistance levels that are hyper-accurate, mathematically derived, and consistently respected intraday , not hand-drawn guesses or generic indicator outputs.
On top of that, SRX plots dynamic volatility-based zones around each major level so you can catch moves that don’t hit the level penny-perfect.
SRX also generates Buy/Sell Arrows during trending conditions and Buy/Sell Circles during non-trending or early-trend conditions.
Arrows = higher-probability trend-aligned setups.
Circles = lower-confidence ideas that can often be scalped on 1m–3m charts.
This tool is built for traders who want clarity, precision, and the ability to anticipate key reactions on SPY with confidence.
Features:
Externally Calculated SRX Levels: Nearly 20,000 data points analyzed daily to produce statistically significant support & resistance levels.
Dynamic Volatility Zones: Capture moves that don’t hit levels perfectly with automatically adjusting upper/lower zones.
Expected Daily Range: Session high/low projections based on historical and current volatility.
Support Levels (S1–S4): Up to four graduated support zones for precision planning.
Resistance Levels (R1–R4): Up to four graduated resistance zones built from the same predictive model.
Premarket High/Low (PMH/PML): Toggleable levels from premarket session.
Previous Day High/Low (PDH/PDL): Quickly mark the prior day’s key reaction points.
Previous Day Open/Close (PDO/PDC): Additional contextual levels (toggle on/off).
Buy/Sell Arrows: Trigger when price interacts with both the EMA and an SRX level/zone in trending conditions.
Buy/Sell Circles: Trigger in non-trending environments — lower confidence but often scalp-friendly.
EMA Overlay: Adjustable EMA used for signal confirmation (default length 8).
Runway Filter: Optional filter that improves signal quality by measuring available “runway” before the next SRX level.
Near EMA Touch Logic: Helps detect momentum shifts and avoid false signals.
Bias Filter: Determines whether the market is trending up, trending down, or neutral — off by default but extremely powerful.
Historical Data Section: View previous SRX levels for backtesting and strategy review.
Customizable Appearance: Colors, transparency, labels, arrows, zone styling and more.
Built-In Alerts:
Zone/Level Touch or Cross
PMH/PML Touch or Cross
PDH/PDL Touch or Cross
PDO/PDC Touch or Cross
Max-Range High/Low Reached
Buy/Sell Arrow Signals
How to Use:
Copy the daily SRX data string from the official Discord channel.
Paste it into the “SRX Levels Input” field inside the indicator settings.
Customize colors, zones, EMA, signals, and filters to match your trading style.
Use SRX support/resistance levels as the foundation for intraday setups.
Use Arrows when the market is trending and the bias is clear.
Use Circles cautiously during choppy or unconfirmed conditions (often great for scalp entries on 1m/3m).
Optionally enable alerts for level reactions or signal prints.
Ideal For:
Intraday traders who rely on precise support/resistance
SPY scalpers seeking high-probability reaction zones
Momentum traders catching breakouts or bounces
Traders who want statistical structure, not subjective drawings
Important Notes:
SRX levels are calculated externally using proprietary models.
This indicator requires a paid subscription to access the daily SRX support/resistance data.
Daily levels are delivered through our private Discord.
Without the SRX daily data string, the indicator will not display levels.
You can join here to get access to the SRX Levels feed:
stockalertsreviewed.clickfunnels.com
SRX currently works exclusively with SPY (as of Dec 2025). We plan to expand to additional tickers in 2026.
Buy/Sell signals are trade ideas — always confirm with market context.

SPY Checker v2Using this indicator allows you to check the SPY for large gaps and candles (e.g. >1%) directly in your stock chart at first glance. The algorithm of the * SPY Checker v2* indicator was optimized in this new indicator as well as it using the new pine script version v4. For backwards compatibility reasons this indicator is published as v2.
It is now also possible to use this indicator for all stock charts and to get the SPY indication on them visible without opening the SPY chart explicitly. Additionally added a several days trading stop feature, which is visible on the chart through the green and red background color. This configuration is available in the indicator settings.
Hope this helps many of you to be more efficient in your SPY indication - have fun!

SPY - VPIN [VWAP] - 195min/DailyVolume Synchronized Probability of INformed Trading (VPIN) modified with VWAP and extended to be applicable to higher timeframes (195min/daily).
The buy/sell signal theoretically based on the informed decisions of smart money. For individual stocks, there is too much noise as a large fund liquidating can create false signals on the longer timeframe.
Recommend to use on SPY to follow the movement of macro-based institutional funds. A sell signal here could mean, and this "could" is doing a lot of heavy lifting, a consensus among big players of impending systematic risk, and vice versa for buy signal. Institutions could be selling for whatever reason, and they usually sell over large periods. Also remember that this doesn't include dark pool data so it is half-baked.
Signal basically showing when smart money smarts to buy during crash, or starts to sell during melt-up phase.
This is not a complete buy/sell signal, it ONLY tries to show signals from the movement of large players so no red signal does not mean there isn't systematic risk and no green signal does not mean there is systematic risk. Combine this with other indicators.
***Remember that institutions also could be retarded, and their "informed" decision might just be them acting like a retard***
Best used on SPY on 195min timeframe. Use this signal on SPY on 195min timeframe to buy/sell high beta stocks indirectly.

(SPY to ES) ETF→Futures Multi-Level (10 Levels + Select All)Converts selected ETF levels (SPY or QQQ) into equivalent futures levels (ES or NQ).
Uses live price ratio between ETF and futures for real-time level translation.
Supports 10 independent levels (A–J) with user-defined ETF price inputs.
Provides checkboxes to toggle each level’s visibility or show all at once.
Applies smoothing (ta.sma) to reduce noise from short-term price movement.
Lets user customize each line’s color, width, and style (solid, dashed, dotted).
Automatically updates lines as new bars form without user interaction.
Uses persistent line objects to keep levels stable when scrolling or zooming.
Adapts to either SPY→ES or QQQ→NQ depending on the “Convert SPY?” toggle.
Draws clean horizontal lines without legend clutter for visual precision.
SOME ONE PUBLISHED THIS FUNCTIONALITY FOR A CHARGE SO I MADE IT FREE.
-rA

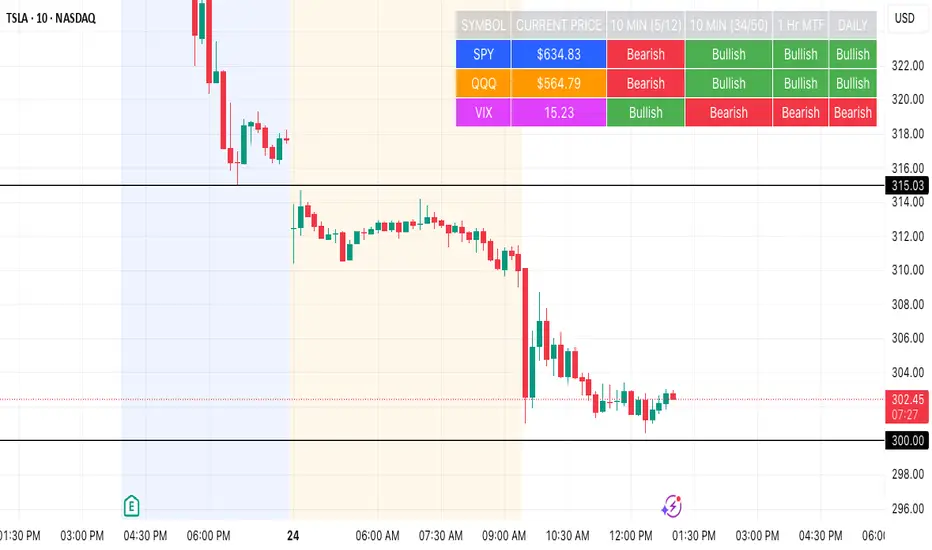
SPY, QQQ, VIX Status TableBased on Ripster EMA and 1 hour MTF Clouds, this custom TradingView indicator displays a visual trend status table for SPY, QQQ, and VIX using multiple timeframes and EMA-based logic to be used on any stock ticker.
🔍 Key Features:
✅ Tracks 3 symbols: SPY, QQQ, and VIX
✅ Multiple trend conditions:
10-min (5/12 EMA) Ripster cloud trend
10-min (34/50 EMA) Ripster cloud trend
1-Hour Multi-Timeframe Ripster EMA trend
Daily open/close trend
✅ Color-coded trend strength:
🟩 Green = Bullish
🟥 Red = Bearish
🟨 Yellow = Sideways
✅ TO save screen space, customizations available:
Show/hide individual rows (SPY, QQQ, VIX)
Show/hide any trend column (10m, 1H MTF, Daily)
Change header/background colors and font color
Bold white top row for readability
✅ Auto-updating table appears on your chart, top-right
This tool is great for active traders looking to quickly scan short-term and longer-term momentum in key market instruments without having to go back and forth market charts.
SPY VXX RSI crisscross// Shows mean of SPY and VXX RSI's. While SPY and VXX often play "tag",
//crisscrossing each other, the game of tag is either 'down' or 'up'
LIME= SPY RSI
AQUA=VXX RSI
BLUE= Average of both
Gray= change of blue
The indicator: is the average above or below 50 (are we going up or down).
Reminder - its an RSI 0-100
// Useful in taking hedged positions in Volatility
//Ex. Short VXX and Long SDS
//Ex. Short XIV and Long SSO

SPY Key LevelsUse Case
Do you belong to a group of traders that post key levels based on their technical analysis to be utilized for trading opportunities? The goal of this indicator is to reduce your daily prep time by allowing you to paste in the actual level values instead of trying to manually create each of the horizontal lines.
How it works
Simply enter the values of the key levels that you would like to plot horizontal lines for
Settings
You can enable/disable any of the levels
You can change the colors of the levels
You can add Previous Day High and Previous Day Low levels to the chart
Limitations
Currently the levels (besides PDH/PDL) are hardcoded to only display for the SPY security "AMEX:SPY"
// Terms \\
Feel free to use the script, If you do use the script could you please just tag me as I am interested to see how people are using it. Good Luck!

SPY Sniper Levels [Day Trader]Here is a professional, concise description you can copy and paste directly into the TradingView publication description box. I’ve written it to appeal to other serious price action traders.
***
**Title:** SPY Sniper Levels
**Description:**
Designed for high-speed day trading on **SPY** and major indices. This lightweight script eliminates the need for manual morning prep by automatically plotting the four critical liquidity zones that institutional algorithms target every session.
**Features:**
* **PDH / PDL (Solid Lines):** Previous Day High & Low. These are the major "walls" for the session.
* **PMH / PML (Dotted Circles):** Pre-Market High & Low. These levels automatically track during the pre-market session (04:00–09:30 EST) and **lock** the moment the market opens. This creates a static reference for Opening Range Breakouts (ORB).
**How to Trade This Setup:**
1. **The Breakout:** Look for high-volume candles closing outside the PMH/PML in the first 30 minutes.
2. **The Fade:** Watch for "traps" (long wicks) at the PDH/PDL to fade the price back toward VWAP.
3. **The Trend:** If price holds above the PDH, look for a trend day. If it fails to break the PML, look for a chop day.
**Best Settings:**
* Optimized for **1m, 2m, and 5m** timeframes.
* Works best on Dark Mode charts.
***
googleusercontent.com

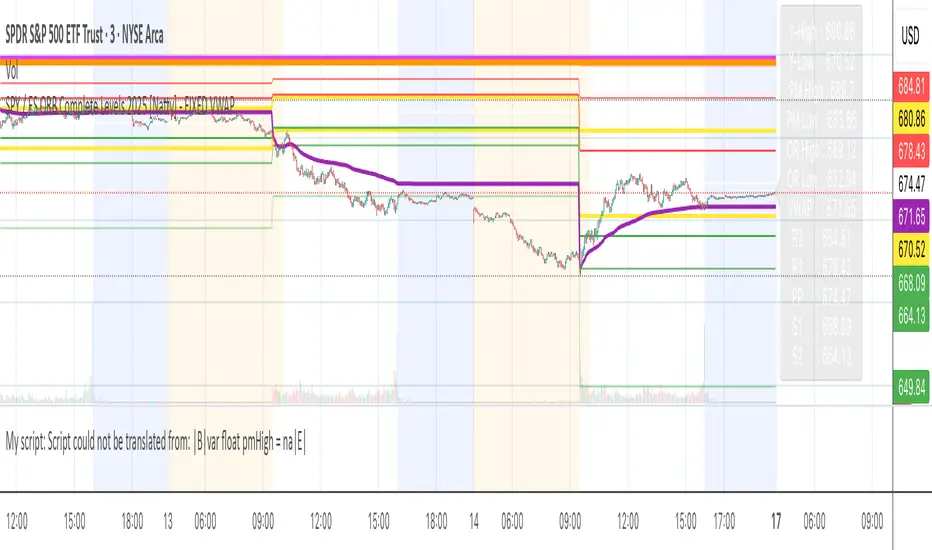
SPY / ES ORB Complete Levels 2025 [Natty] - FIXED VWAPAll-in-one Opening Range Breakout (ORB) levels indicator for SPY & /ES (and works on any index/futures contract).
Automatically draws every key level serious day-traders and scalpers watch in 2025:
• Yesterday’s High & Low (yellow)
• Pre-Market High & Low – 04:00–09:30 ET (fuchsia)
• True Regular-Trading-Hours VWAP – anchored at 09:30 ET, ignores pre-market volume (purple)
• Full Classic Pivot Points – PP, R1–R3, S1–S3 (white/red/green)
• 30-minute Opening Range High & Low – 09:30–10:00 ET (thick orange) with light shading
• Clean price label panel on the right edge (updates live) so you never have to hover
No paid scripts or external data needed – 100 % free, lightweight, zero lag.
Perfect for:
- 30-minute ORB breakout trading
- SPY & /ES scalping
- 0DTE SPX options directional entries
- Quick pre-market bias checks
Just add to any chart with Extended Hours enabled and you’re ready for the bell.