Doble stochastic oscillator fast and slowThis is a two stochastic in one indicator :
We have a normal stochastic, and a slower one in order to identify changes in the price movement.
At the same time I added more levels, so its easier visually to identify in each scenario we are.
The slower oscillator, also change color based on direction it has.
Green color = long direction - > buy
Red color = short direction - > sell
Cerca negli script per "stoch"

Stochastic / RSI (Wilder's [RMA] or Arnaud Legoux [ALMA])This script displays the Stochastic and Relative Strength Index ("RSI") indicators. Each indicator can be displayed standalone or shown together. The Stochastic indicator also has functionality to highlight overbought/oversold levels as well as relative placement of K and D. The RSI indicator can also be updated to utilize the Arnaud Legoux Moving Average ("ALMA") (vs. the standard Wilder's Moving Average).
I use based on default settings. ALMA RSI can help indicate extent of drop/rise from Stochastic overbought/oversold levels.
Recognition due to @kurtsmock for the work on validating the ALMA calculation (pinescript built-in function has slight deviation from original design) ---> LINK ().

Stochastic %BIt's a Stochastic indicator combined with Bollinger %B. This way you just need to check if it is above 1.0 or below 0.0 (Outside Bollinger Bands).

Stochastic Pop and Drop by Jake Bernstein v1 [Bitduke]I found a simple strategy by Jake Bernstein, modified it a little and created a strategy with Risk Management System (SL+TP); After that I test it on the different cryptocurrency pairs.
About the Indicator
Basically it's the strategy of 2 indicators: Stochastic Oscillator to define the bias and Average Directional Index to confirm it.
One again, It uses Stochastic Oscillator to define the trading bias. In particular, the trading bias was deemed bullish when the weekly 14-period Stochastic Oscillator was above some default value (in him paper - 50) and rising and vice versa.
Once the trading bias is established, Steckler used the Average Directional Index (ADX) to define a slowdown in the trend. ADX measures the strength of the trend and a move below 20 signals a weak trend.
Modifications
I didn't implement Average Directional Index (ADX) and test just different sources for data, oscillator periods and different levels in relation to the crypto market.
So, it shows good results with two tight thresholds at 55 and 45 level.
The bar chart below the defining the bullish and bearish periods (green and red) and gives a signal to enter the trade (purple bars).
Backtesting
Backtested on XBTUSD , BTCPERP (FTX) pairs. You may notice it shows good results on 3h timeframe.
Relatively low drawdown
~ 10% (from 2019 to date) FTX
~ 22% (4 years from 2016) Bitmex
I backtested on the different altcoin pairs as well, but the results were just not good.
Relatively good results were shown by some index pairs from the FTX exchange ( FTX:SHITPERP ), but I think there is a few data for backtesting to be asure in them.
Bitmex 3h (2017 - 2020) :
i.imgur.com
FTX 3h (2019 - 2020):
i.imgur.com
Possible Improvements
- Regarding trading algorithm it would be good to check with strategy with ADX somehow. Maybe for the better entries
- As for Risk Management system, it can be improved by adding trailing stop to the strategy.
Link: school.stockcharts.com

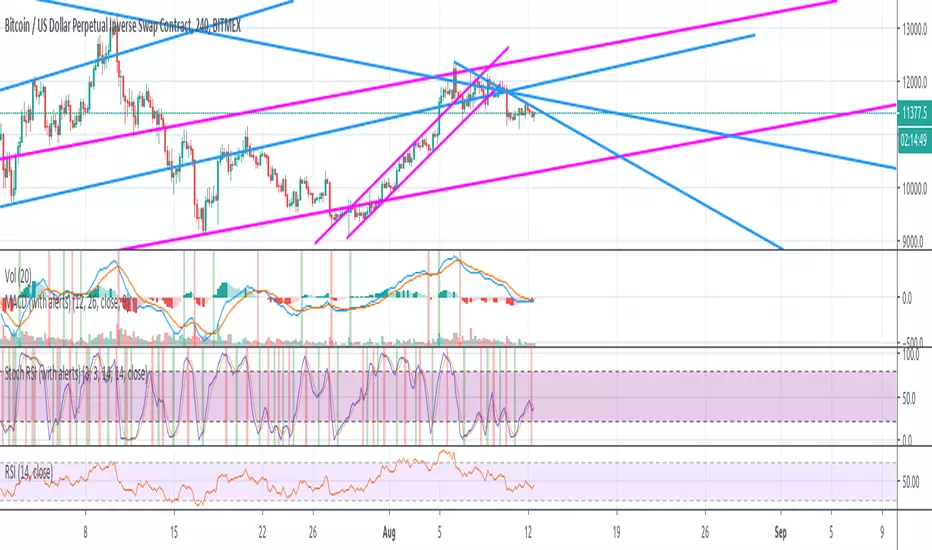
Stochastic RSI (with alerts)This is a modification of original Stochastic RSI oscillator, but with addition of highlighted death and golden crosses. It also allows you to receive alerts: "Stochastic RSI: Death cross on 4hours"
Hashem Extended Stochastic (V2)Extended Stochastic with All Zones. From Neutral to Danger Zones.
The Most Complete and Extended Stochastic Indicator.


IFT Stochastic + Trailing StopInverse fisher transform on stochastic strategy with trailing stop. Good work on flats with mid-wave length


Stochastic Strategy of BiznesFilosofThis strategy allows you to test the stochastic indicator, as well as adjust it to a specific trading pair. The parameters indicated in the books are too approximate and have nothing to do with modern reality. The optimal parameters for Bitcoin are now set. You can customize better for yourself. This strategy allows you to make settings.
===
Эта стратегия позволяет протестировать индикатор стохастик, а также настроить его на конкретную торговую пару. Параметры, указанные в книжках слишком приблизительные и не имеют ничего общего с современной реальностью. Сейчас установлены оптимальные параметры для биткоина. Вы же можете настроить лучше под себя. Это стратегия позволяет сделать в настройках.

STOCHASTIC-RSI / RSI AREASAn easy Stochastic-RSI and RSI combined to show oversold and overbought areas.

Stochastic RSI Threads by SpiralmanTook a Spuds Stochastic Threads idea code by Chris Moody and redone into sRSI version.
More on the subject you can read here www.forexfactory.com


Ehlers-Smoothed Stochastic Oscillator [Krypt]This indicator is in principle similar to Stochastic Oscillator, but contains the following improvements:
- advanced Ehlers-based smoothing (typically results in earlier signals than regular EMA smoothing)
- graceful degradation when few candles present for improved accuracy in the beginning of the chart
- buy/sell signals based on K-D crossover above/below thresholds

[M] StochasticNormal Stochastic has, painted in color when coming out of the zone of 80-20, remains in the gray zone. It makes for convenience.
-------------------
Обычный Stochastic, окрашивается в цвета когда выходит из зоны 80-20 , в зоне остается серым. Делался для удобства.

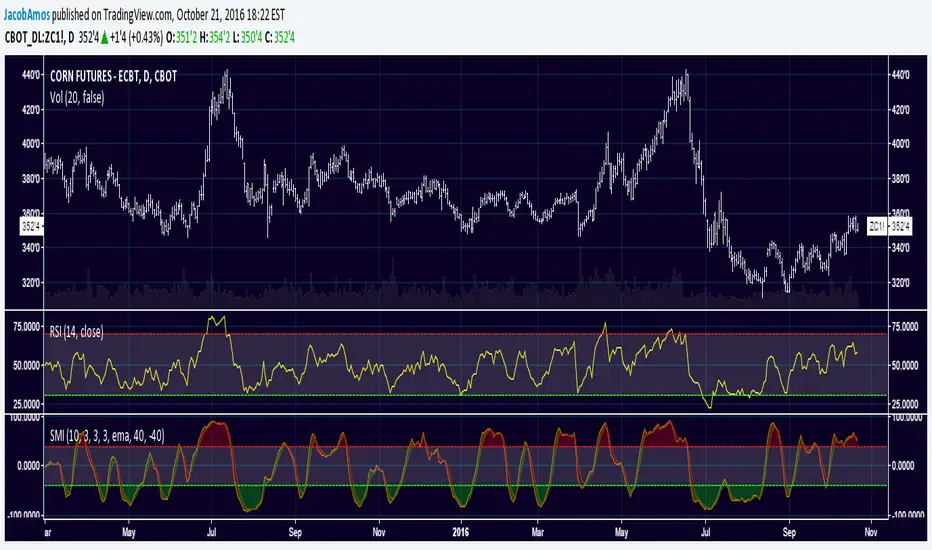
Stochastic Momentum IndexThis is an implementation of the Stochastic Momentum Index from William Blau's his article in Stocks & Commodities .
This also allows the use of various different kinds of moving averages for the signal line. Options for this argument are:
sma (simple moving average)
ema (exponential moving average)
wma (weighted moving average)
trima (triangular moving average)
zlema (zero-lag exponential moving average)
dema (double exponential moving average)
tema (triple exponential moving average)
hma (hull moving average)
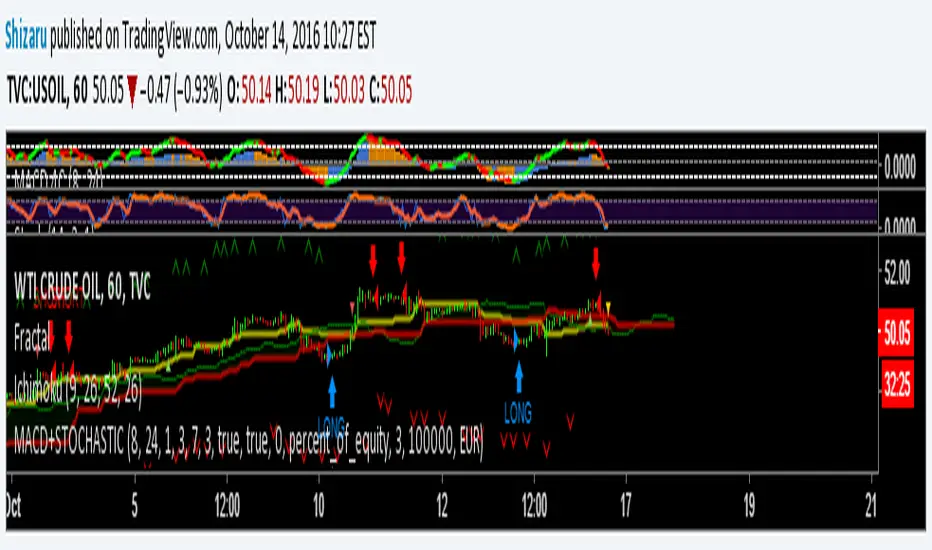
MACD+STOCHASTICA simple strategy that use MACD and STOCHASTIC to give buy/sell signal. Use fractals to put stop loss
RSI-Stochastic Hybrid v2**For those who like a smooth ride...v2 of this script is now updated with optional exponential averaging of the stochastic and RSI. So for instance a value of 3 for smoothing of the stochastic is like using %D instead of %K. **
This is a very simple idea - an average of RSI and the Stochastic Oscillator. However it offers plenty of flexibility for tuning to your requirements. You can change the lengths of either indicator and the weighting of each. By default it's set to 50/50 (just change the percent RSI to adjust). There is also an optional EMA which can be used as a signal line.
This idea comes from Greg Morris who likes to use it for trend following. I would buy when the indicator hits the overbought line and sell when it goes below 50.


SMI 30m With Built-in Divergence AlertsStochastic Momentum Index SMI 30m is a simplified, single-timeframe Stochastic Momentum Index (SMI) designed for traders who want a clean momentum oscillator with clear crossover signals and automatic higher-timeframe filtering.
This version is locked to a 30-minute timeframe, making it consistent across any chart you place it on.
The script plots:
SMI Blue Line – the main momentum line
SMI Orange Line – the signal line (EMA-smoothed)
Overbought / Oversold regions
Optional colored background zones that highlight strong momentum extremes
Both the Blue and Orange plots are fully exposed, allowing users to manually create TradingView alerts for crossovers.
Additionally, the script includes two built-in alert conditions for traders who prefer automatic signals.
How the SMI is calculated
This script uses a double-EMA smoothing method to stabilize momentum:
Highest and lowest price ranges are calculated over the selected %K period.
Relative position of price inside that range is computed.
A double EMA is applied to both the range and the midpoint offset.
The SMI result is scaled to ±200 for clarity.
The Signal Line is a single-EMA applied to the SMI.
These parameters can be adjusted:
%K Length
%D Length
EMA Length
The default values match traditional 13-3-3 SMI settings.
Visual Components
1. SMI Blue Line
Represents the primary momentum movement.
Values above 40 indicate positive momentum; values below −40 indicate negative momentum.
2. SMI Orange Line
Acts as a smoothing signal line.
Crossovers between Blue and Orange often indicate momentum shifts.
3. Overbought / Oversold Zones
+40 = overbought boundary
−40 = oversold boundary
These levels help identify exhaustion points.
4. Gradient High/Low Zones
The script includes colored fill zones above +40 and below −40 to visually highlight extreme momentum regions.
Built-In Alerts
The indicator includes two pre-configured alert conditions:
1. Bearish Cross (Overbought)
Triggers when:
The Blue SMI crosses below the Orange SMI
AND the Blue SMI value is above 80
This represents a potential bearish divergence or momentum reversal from extreme highs.
Alert title:
SMI Bearish Cross
2. Bullish Cross (Oversold)
Triggers when:
The Blue SMI crosses above the Orange SMI
AND the Blue SMI value is below −80
This represents a potential bullish divergence or reversal from extreme lows.
Alert title:
SMI Bullish Cross
How to Use Alerts
After adding the indicator to your chart:
Open the Alerts panel
Select Condition → SMI (1 TF) 30m
Choose either:
SMI Bearish Cross
SMI Bullish Cross
Set your preferred trigger method:
Once per bar close
Once per bar
Once per minute
Create the alert
Traders can also manually create alerts for:
Blue crossing above Orange
Blue crossing below Orange
Because both plots are fully exposed.
Purpose
This indicator is intended for traders who want a stable, single-timeframe SMI with:
Clear structure
Extreme-zone highlighting
Exposed plots for custom alerts
Built-in reversal alerts
Consistent 30-minute TF regardless of chart
It can be used for:
Identifying trend reversals
Detecting momentum exhaustion
Confirming entries/exits
Spotting early divergence signals

stochastic supper trendstocastic supper trend channel based on sk trading system with dynamic od os lines changing color
