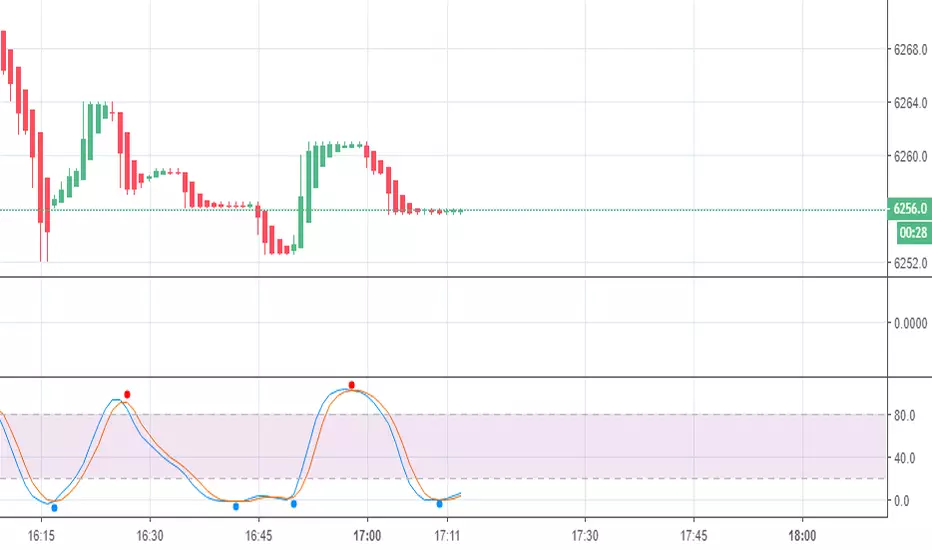
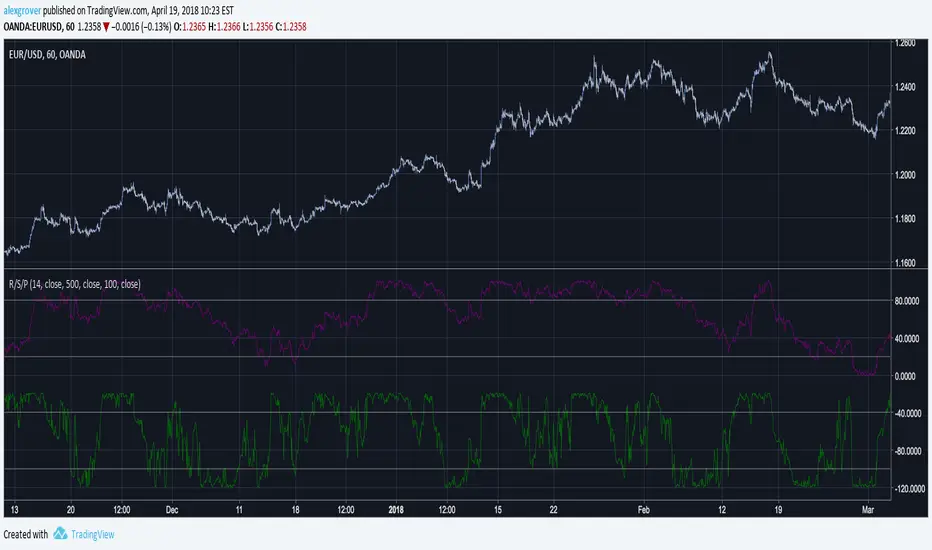
Triple Stochastic3 stochastic K-lines with short, medium & long periods & the D-lines removed.
Provides a good indication of where you are in the current supply/demand cycle & I find it helpful for timing entries.
Look for peaks & valleys formed by 2 or 3 lines, & entry would be when they start to turn around.
Try it on multiple timeframes & of course use confluence with other indicators & data.
Cerca negli script per "stoch"
TA-Money Flow-v2, Stochastic OBVNot sure where I originally got this (somewhere off Tradingview several years ago, thanks to the person who shared), just publishing because of a request.
This is basically a stochastic OBV movement indicator. It is good to work with both price and volume. I've updated to be able to display either as positive only, or both sides (50/-50), also included an invert function. It works great on any time frame, but you need to have volume data.
Enjoy.
I've got a version 3 if you're interested.

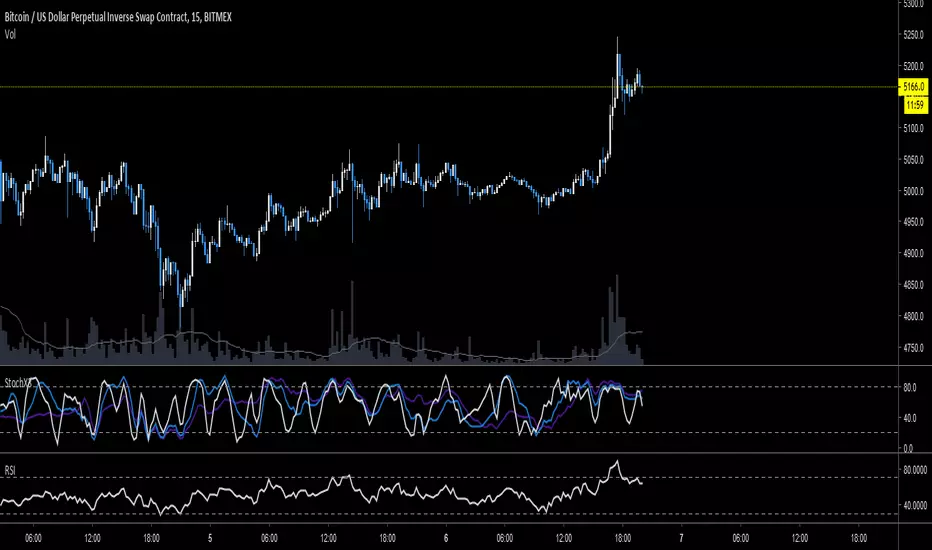
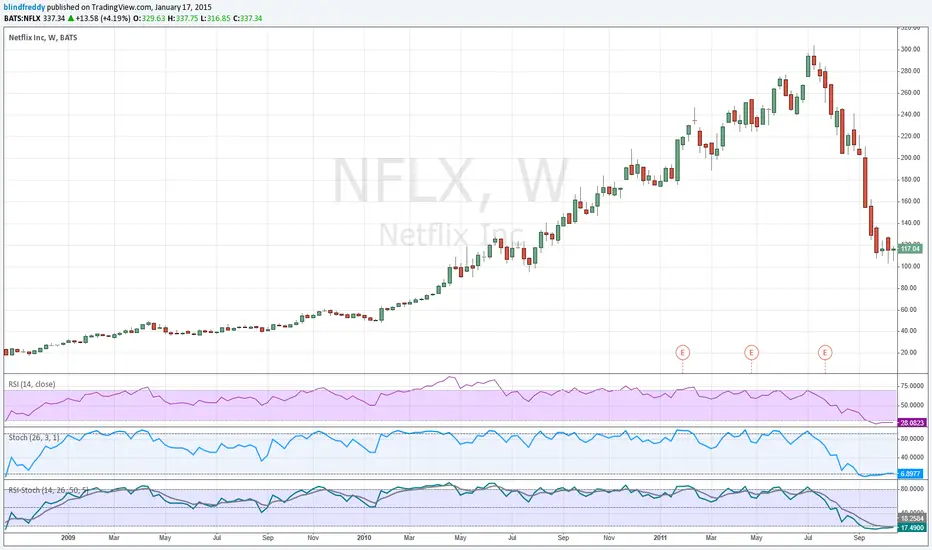
Relative Strength Index & Stochastic RSIThis script calculates both RSI (Relative Strength Index) and Stock (Stochastic) RSI Indicators, and plots them with a distinctive background on the same graph. The colors were chosen to be very easy on the eyes.
I published it as a way to give back to this community. Use your own judgement when trading, I am not responsible for any losses resulting from the use of my script.
Feel free to modify the script with no attribution.
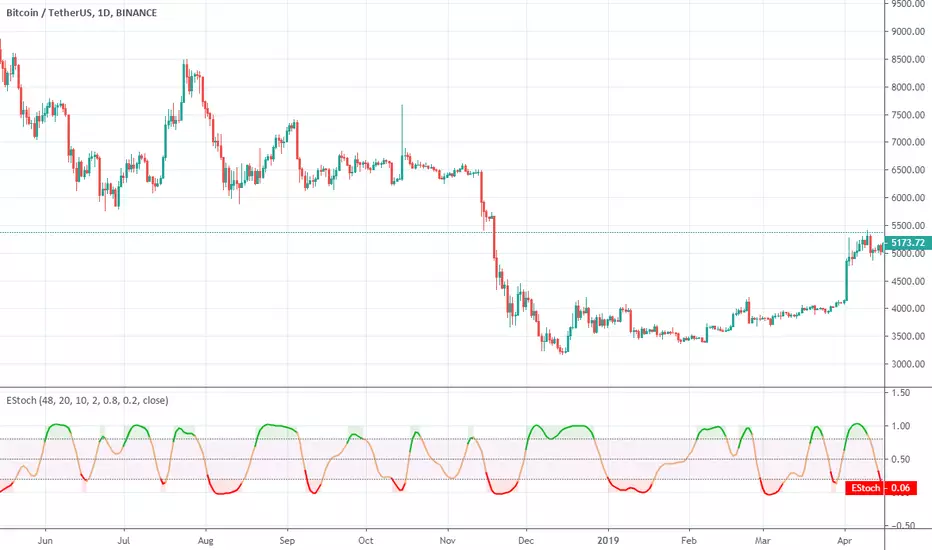
Ehlers StochasticEhlers Stochastic script.
This indicator was originally developed by John F. Ehlers (Stocks & Commodities V. 32:1: Predictive And Successful Indicators).
Ehlers Stochastic Cyber CycleEhlers Stochastic Cyber Cycle indicator script.
This indicator was originally developed by John F. Ehlers (see his book `Cybernetic Analysis for Stocks and Futures`, Chapter 8: `Stochasticization and Fisherization of Indicators`).

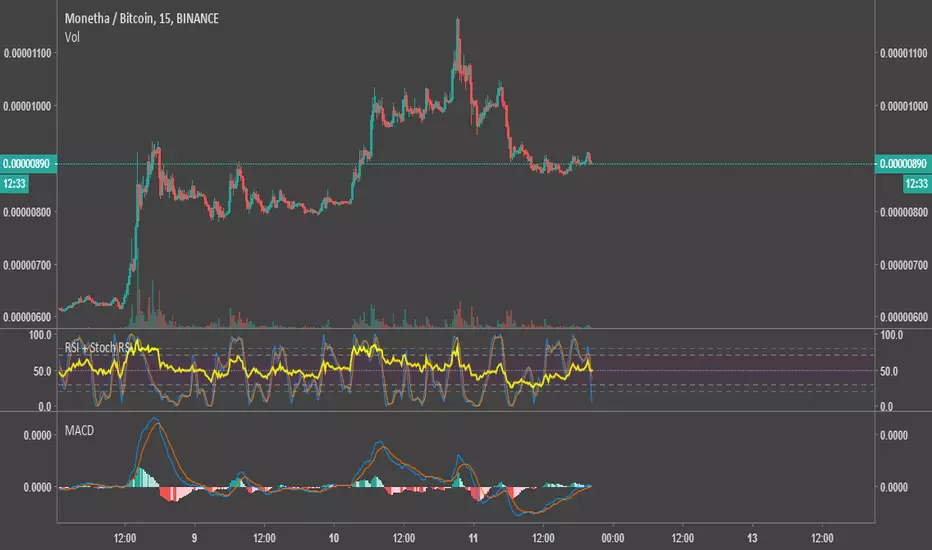
RSI/Stochastic/Percentrank all on chart and all in oneThe limitation of max 3 indicators on tradingview is pretty bad for indicators lovers (like me) so i made this script able to contain a rsi, a stochastic and a percent rank and that in only one indicator !! Pretty cool isn't it ? ;)
Every parameter is linked to one indicator, you can have all of them with differents period lengths
You have the possibility to disable each indicators and add clarity to the chart.
Do you want me to add more indicators ? If yes witch ? Comment bellow :D
Hope this help
SW SVE - Stochastic+Vol+EMAs [Sergio Waldoke]Script created by Sergio Waldoke (BETA VERSION v0.5, fine tuning PENDING)
Stochastic process is the main source of signals, reinforced on buying by Volume. Also by Golden Cross.
Selling is determined by K and D entering overselling zone or EMA's Death Cross signal, the first occurring,
and some other signals combined.
Buy Long when you see a long buy arrow.
Sell when you see a close arrow.
This is a version to be tuned and improved, but already showing excelent results after tune some parameters
according to the kind of market.
Strategy ready for doing backtests.

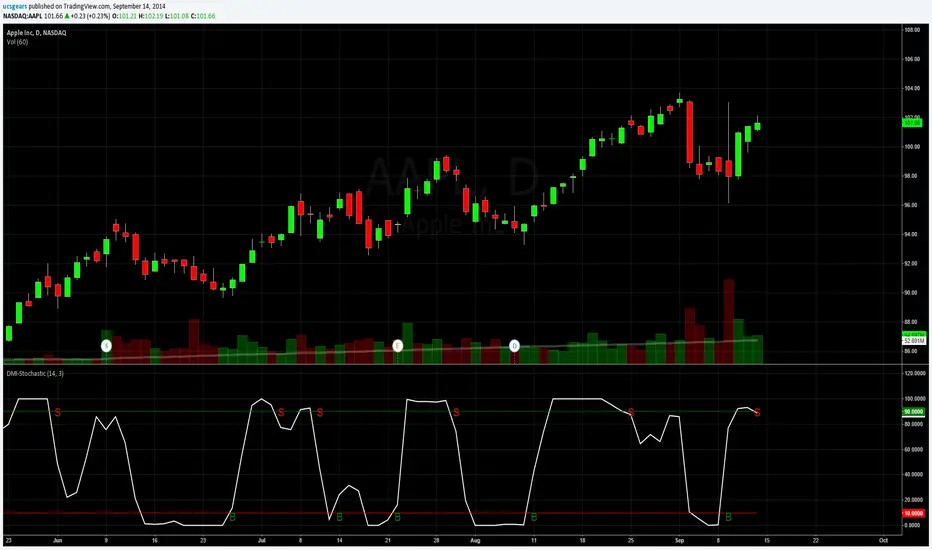
DMI StochasticModification of DMI Stochastic indicator created by USGEARS, as requested by another user. This version just colors columns along with the indicator arrow.

B3 Stochastic FullA colorful take on the classic stochastic indicator, coded from scratch. Enjoy! :)

RSI-Stochastic HybridThis is a very simple idea - an average of RSI and the Stochastic Oscillator. However it offers plenty of flexibility for tuning to your requirements. You can change the lengths of either indicator and the weighting of each. By default it's set to 50/50 (just change the percent RSI to adjust). There is also an optional EMA which can be used as a signal line.
This idea comes from Greg Morris who likes to use it for trend following. I would buy when the indicator hits the overbought line and sell when it goes below 50.
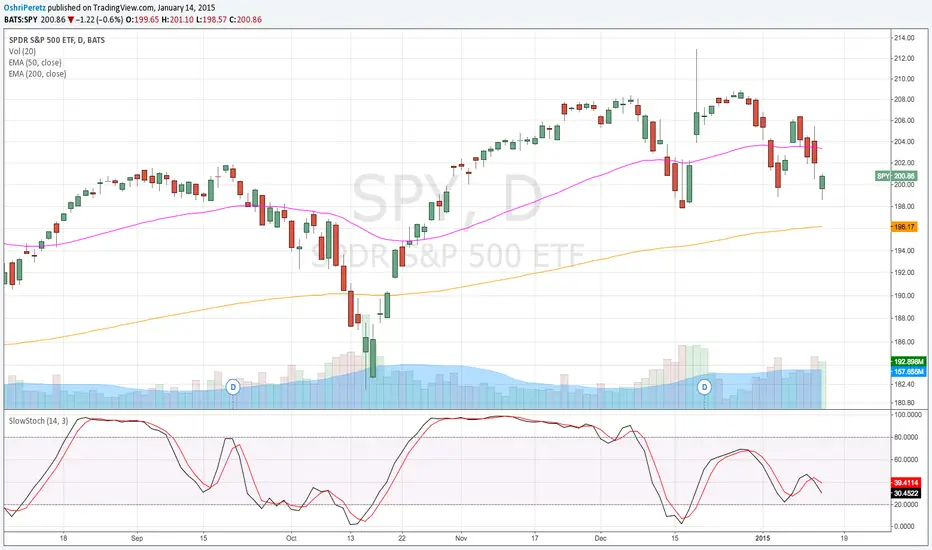
Slow StochasticThe slow stochastic indicator is a price oscillator that compares a security’s closing price over “n” range. The most commonly used range for the slow stochastic indicator is 14.
Defaults K=14, D=3

DMI Stochastic Extreme - DMI Stochastic Extreme - Version 2
- Replaced B with , Replaced S with
- Ability to change Overbought and Oversold Levels
- Clean PineScript
List of All my Indicators - www.tradingview.com

DMI Stochastic ExteremeUSed the DMI Oscillator created by LARK "https://www.tradingview.com/v/T79b6F5n/" to create this DMI Stochastic Extreme. You can also use the DMI Stochastic by Lark
Updated Version -
Stochastic ColorStochastic Color. A momentum indicator that compares a particular closing price of an asset to a range of its prices over a specific period of time. It helps identify overbought and oversold conditions in the market. The indicator ranges from 0 to 100, with readings above 80 typically considered overbought and readings below 20 considered oversold. It is often used to anticipate potential price reversals.
Stochastic Closed PriceStochastic with the price calculated as closed as in MT4 Platform to make better backtesting and analysis.