Cerca negli script per "stoch"


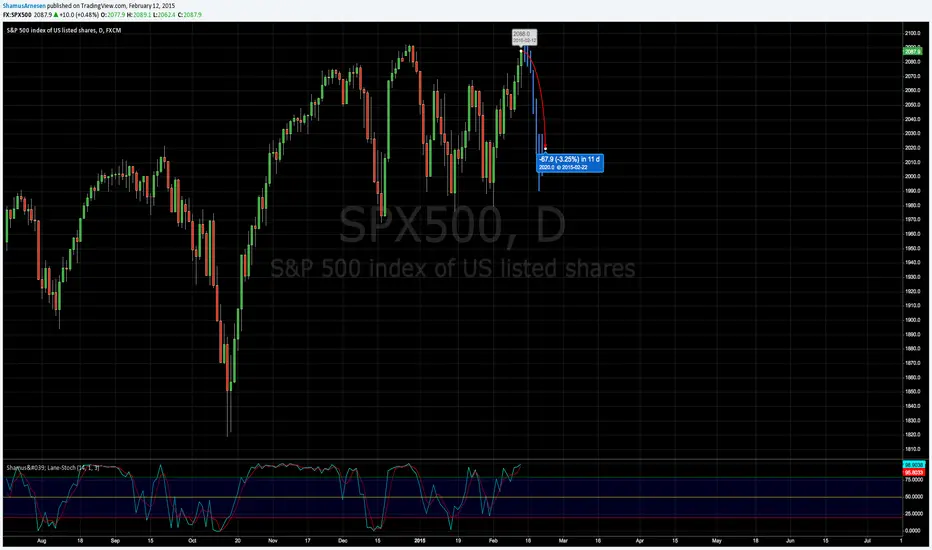
Stochastic Momentum IndexStochastic Momentum Index
William Blau "Momentum, Direction, and Divergence",
John Wiley and Sons, Inc. 1995, ISBN 0-471-02729-4, page 29:
SM(q) = close - 0.5*(HH(q) + LL(q))
SMI(q, r, s) = 100*(EMA(EMA(SM(q), r)), s)/(0.5*EMA(EMA(HH(q)-LL(q)), r), s)


Stochaholic — SharkCIAStochaholic consists of 8 stochastic oscillators with different speeds.
It has less noise and better visualization compared to a simple stochastic.
Created from Stochastic Rainbow by shayankm


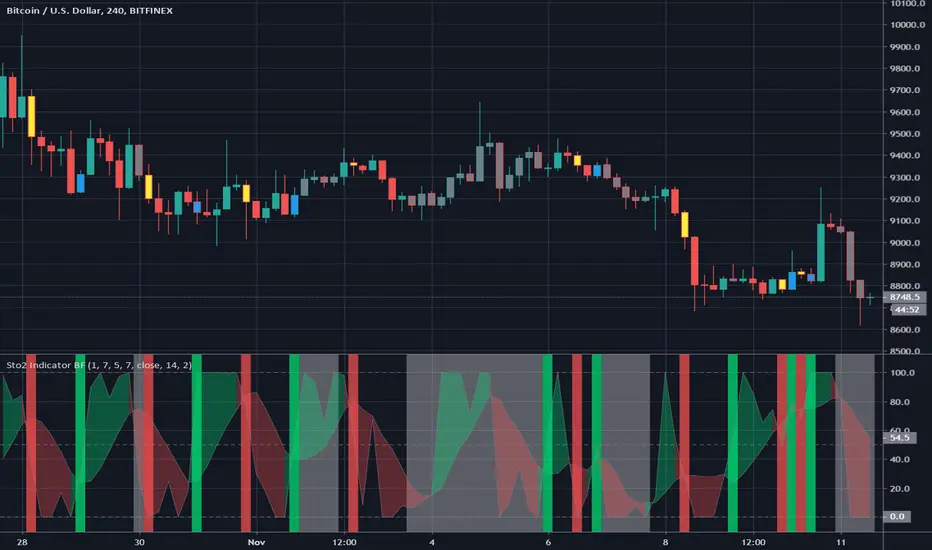
Sto2 Indicator BFThis is an indicator version with alerts for my Sto2 RSI Bitcoin strategy.
There are 2 alerts, one for a long condition and one for a short condition.
CRITERIA FOR ALERTS:
Long condition happens when the k value of the Stochastic RSI crosses above the d value AND the Rate of Change formula shows we are not going sideways
Short condition happens when the k value of the Stochastic RSI crosses below the d value AND the Rate of Change formula shows we are not going sideways
I have altered the plotting slightly to better suit an indicator.
Green background = long signal
Red background = short signal
White background = no trade/sideways zone


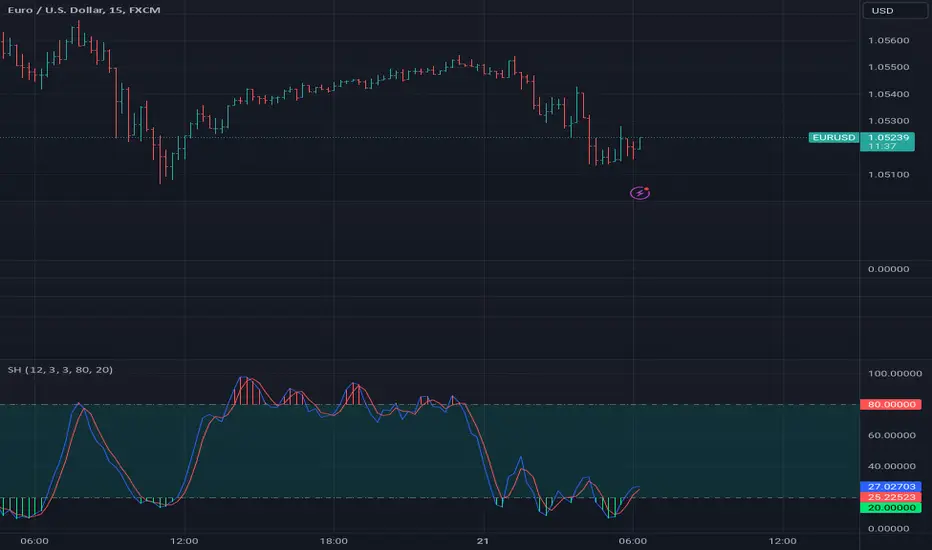
Stoch_VX2Nothing New about a Stochastic but maybe in how you use them ( Other than Over bought / Sold cross over & divergence signals )
Running 3 bands
Standard stoch & tops & bottoms swing band
Optimised variables 12, 5 , 3 or fib 13, 5, 3 / - 12 / 3 / 3 a little bit tighter to combine both smoothness & accuracy. These are my own personal setting inc. Strategy.


DSS Bressert (Double Smoothed Stochastic) Mid point (H+L)/2Changed source to midpoint (High+Low)/2 instead of Close for a cleaner average.

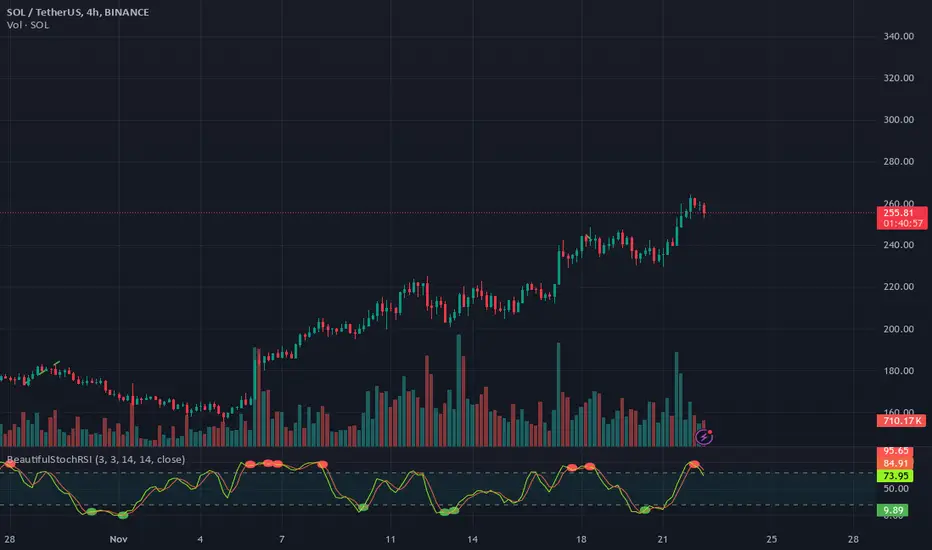
BeautifulStochRSIBeautifulStochRSI: A Unique and Clear Approach to Stochastic RSI
Introducing the BeautifulStochRSI, an colorfull approach to the popular Stochastic RSI indicator. This script goes beyond the standard representation by offering visually distinct and intuitive signals to enhance your trading experience.
The BeautifulStochRSI is ideal for traders who value both precision and simplicity. It combines functional enhancements with a polished design, ensuring that crucial market insights are presented clearly and effectively. Created by rektbyhielke, this script leverages the capabilities of Pine Script™ v5 for optimal performance.
By sharing this script, the aim is not only to provide a practical trading solution but also to inspire others to create indicators that are both beautiful and efficient.
the script includes fully customizable parameters for RSI length, stochastic length, and smoothing factors, allowing traders to tailor the indicator to their specific strategies. Overbought and oversold zones are marked with dots at levels 80 and 20, complemented by a subtle teal background fill to emphasize these areas.
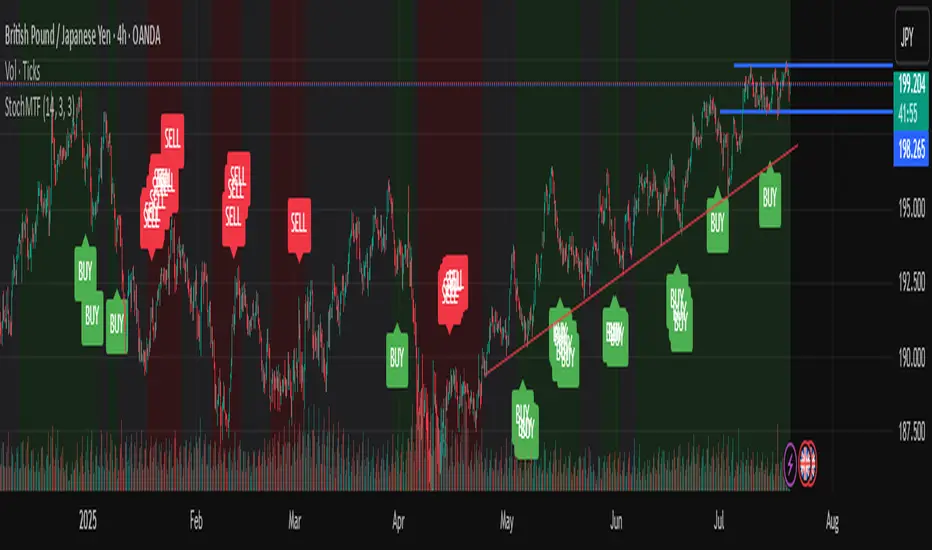
Stochastic Trend Signal with MTF FilterMulti-Timeframe Stochastic Trend Filter – Real Signals with Confirmation Candles
This script is a multi-timeframe Stochastic trend filter designed to help traders identify reliable BUY/SELL signals based on both momentum and higher-timeframe trend context.
It combines three key components:
Entry Signal Logic:
Entry is based on the Stochastic Oscillator (%K, 14,3), where overbought/oversold conditions are detected in the current chart's timeframe.
A green (bullish) candle following a red candle with %K below 20 can trigger a BUY signal.
A red (bearish) candle following a green candle with %K above 80 can trigger a SELL signal.
Trend Confirmation – Daily Filter:
The script uses Stochastic on the 1D (Daily) timeframe to determine whether short-term momentum aligns with a broader daily trend.
BUY signals are only allowed if the Daily %K is above 50.
SELL signals are only allowed if the Daily %K is below 50.
Long-Term Trend Filter – Weekly Stochastic:
A second filter uses Weekly %K:
BUY signals are suppressed if the Weekly trend is bearish (Weekly %K < 50) while Daily %K is bullish (> 50).
SELL signals are suppressed if the Weekly trend is bullish (Weekly %K > 50) while Daily %K is bearish (< 50).
🖼️ The chart background changes color to visually assist users:
Green background: bullish alignment on Daily and Weekly Stochastic.
Red background: bearish alignment.
Gray background: trend conflict (Daily and Weekly disagree).
✅ This script is ideal for swing traders or position traders who want to enter with confirmation while avoiding false signals during trend conflict zones.
🔔 Alerts are provided for BUY and SELL signals once all conditions are met.
How to use:
Apply on timeframe (4H recommended).
Add alerts for "BUY Alert" and "SELL Alert".
Use background color and plotted labels as entry filters.
Disclaimer: This is not financial advice. Always use proper risk management and test on demo accounts first.
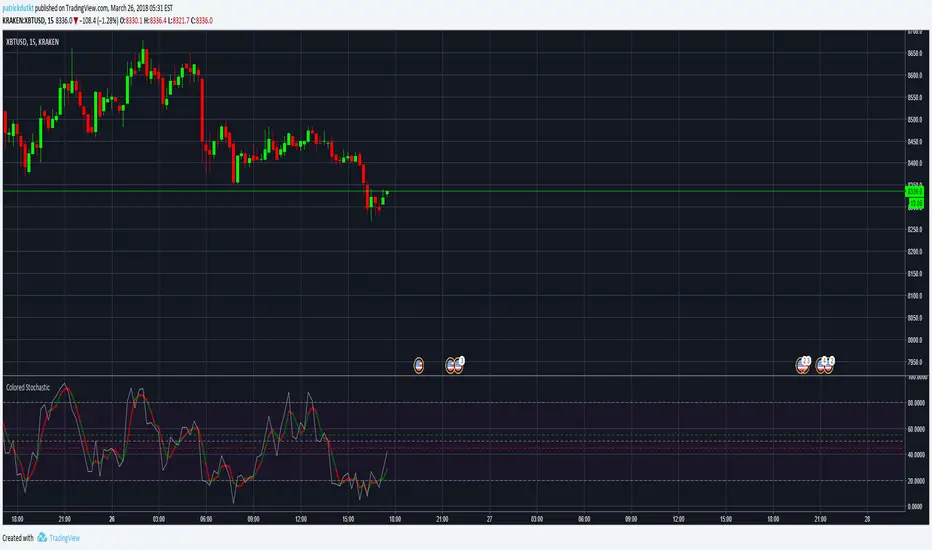
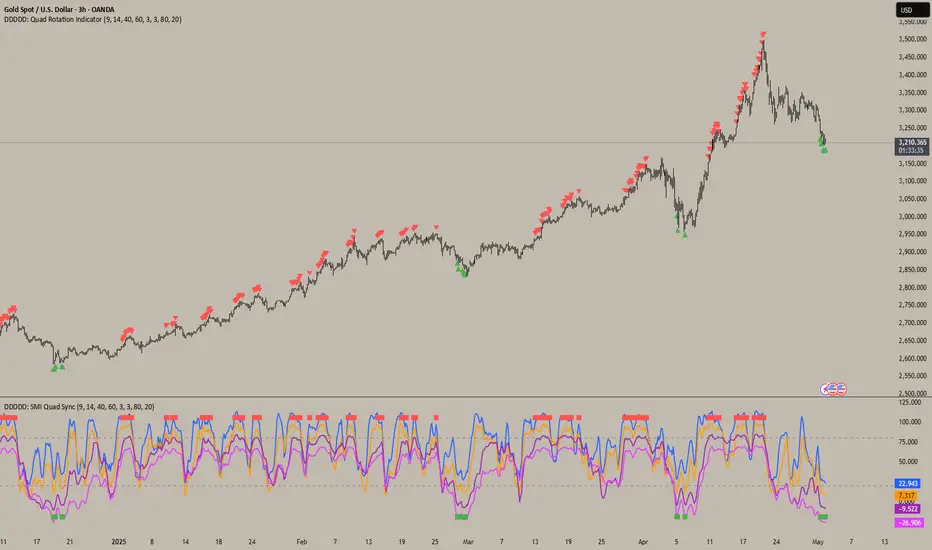
DDDDD: SMI Quad Sync📄DDDDD: SMI Quad Sync
A multi-timeframe momentum synchronization indicator using 4 Stochastic Oscillators with different lengths (9, 14, 40, 60) to detect collective oversold and overbought zones.
✅ Key Features:
Plots 4 stochastic lines with vertical offsets for better visual separation.
Generates a Long Signal (green square) when all 4 stochastics are below the oversold level.
Generates a Short Signal (red square) when all 4 stochastics are above the overbought level.
Use signals to confirm multi-timeframe momentum alignment or exhaustion.
🎯 How to Use:
Look for green square → potential LONG entry: signals multi-timeframe oversold condition.
Look for red square → potential SHORT entry: signals multi-timeframe overbought condition.
Combine with trend analysis, price action, or other confirmation for optimal entries.
📝 Notes:
The plotted stochastic lines are visually shifted (offset) for clarity; signals are computed from raw, unshifted values.
Designed for traders who prefer confluence across different stochastic lookback periods to improve confidence.
👉 Ideal for scalping, swing trading, or as a momentum filter in broader strategies.
Stochastic On Balance Volume(not sure why the text in the image above is messed up; it looked good before publishing. The oscillators above are (from top to bottom) StochOBV, OBVOSC (LazyBear), OBV)
Applies the Stochastic Oscillator to OBV the same way StochRSI applies the Stochastic Oscillator to RSI.
Features:
- Bounded between 0 and 100, so it may be used for overbought/oversold alerts;
- Uses two lines for crossing signals similar to Stoch and StochRSI;
- Only considers recent OBV action, similar to how StochRSI only considers recent RSI action;
It can be used for simple signals, divergence, trend lines, and any other method you'd use StochRSI for.
The OBV calculation is from LazyBear's OBVOSC script here , so thank you for your script.

Stoch_RSI_ChartEnhanced Stochastic RSI Divergence Indicator with VWAP Filter for Charts
This custom indicator builds upon the classic Stochastic RSI to automatically detect both regular and hidden divergences. It’s designed to help traders spot potential market reversals or continuations using two methods for divergence detection (fractal‑ and pivot‑based) while offering optional VWAP filtering for confirmation.
Key Features
Stoch RSI Calculation
The indicator computes a smoothed Stoch RSI using configurable parameters for RSI length, stochastic length, and smoothing periods. An option to average the K and D lines provides a cleaner momentum view.
Divergence Detection via Fractals & Pivots
Fractal-Based Divergences:
Looks for 4-candle patterns to identify higher-highs or lower-lows in the price that are not confirmed by the oscillator, signaling potential reversals.
Pivot-Based Divergences:
Utilizes TradingView’s built-in pivot functions to find divergence conditions over adjustable pivot ranges.
Regular vs. Hidden Divergences:
Regular Divergence: Occurs when price makes a new extreme (higher high or lower low) while the Stoch RSI fails to follow suit.
Hidden Divergence: Indicates potential trend continuations when the oscillator diverges against the established price trend.
Optional VWAP Filtering
The script includes two optional VWAP filters that work as follows:
VWAP Filter on Regular Divergences:
Only confirms regular divergence signals if the current price satisfies the VWAP condition (e.g., price is above VWAP for bullish signals, below VWAP for bearish signals).
VWAP Filter on Hidden Divergences:
Similarly, hidden divergence signals are validated only when the price meets specific VWAP conditions, adding an extra layer of trend confirmation.
Customizable Alerts and Visual Labels
Easily configure divergence labels (“B” for bullish, “S” for bearish) and enable up to four alert conditions for real‑time notifications when a divergence occurs.
Credits & History:
Log RSI by @fskrypt
Divergence Detection originally by @RicardoSantos (with edits from @JustUncleL)
Further Edits by @NeoButane on August 8, 2018
Latest Edits by @FYMD on June 1, 2024
