Cerca negli script per "stoch"
Noro's Stochastic Strategy v1.3in 1.3:
+ profit became more
+ RSI Period
+ SMI+RSI Mode
+ Color filter
+ background
Uses:
1) Stochastic Momentum Index ("Use SMI-Strategy")
2) Fast RSI , period 2 ("Use RSI-Strategy")
3) SMA Body filter ("Use Body-filter")
4) Color filter ("Use Color-filter")

Noro's Stochastic Strategy v1.2in 1.2:
- profit became more
Uses:
1) Stochastic Momentum Index ("Use SMI-Strategy")
2) Fast RSI , period 7 ("Use RSI-Strategy")
3) SMA Body filter ("Use Body-filter")

Noro's Stochastic Strategy v1.1Uses:
1) Stochastic Momentum Index ("Use SMI-Strategy")
2) Fast RSI, period 7 ("Use RSI-Strategy")
3) SMA Body filter ("Use Body-filter")

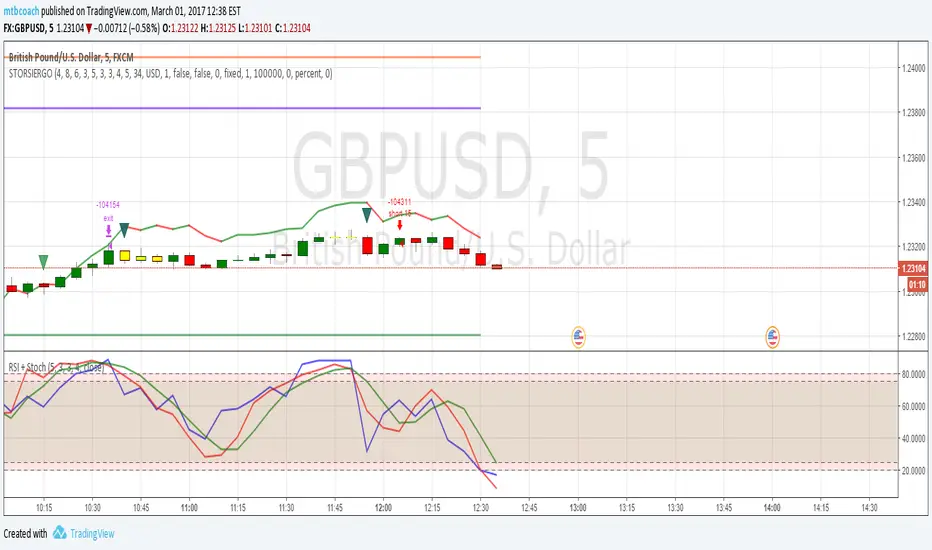
[Study] Pivots EMA Stoch SetupUsing daily pivot, if price is greater or under the four EMAs, and if we have a stoch signal, then we have an entry/exit condition.
Inverse Fisher Transform on SMI (Stochastic Momentum Index)Inverse Fisher Transform on SMI (Stochastic Momentum Index)
About John EHLERS:
From California, USA, John is a veteran trader. With 35 years trading experience he has seen it all. John has an engineering background that led to his technical approach to trading ignoring fundamental analysis (with one important exception).
John strongly believes in cycles. He’d rather exit a trade when the cycle ends or a new one starts. He uses the MESA principle to make predictions about cycles in the market and trades one hundred percent automatically.
In the show John reveals:
• What is more appropriate than trading individual stocks
• The one thing he relies upon in his approach to the market
• The detail surrounding his unique trading style
• What important thing underpins the market and gives every trader an edge
About INVERSE FISHER TRANSFORM:
The purpose of technical indicators is to help with your timing decisions to buy or
sell. Hopefully, the signals are clear and unequivocal. However, more often than
not your decision to pull the trigger is accompanied by crossing your fingers.
Even if you have placed only a few trades you know the drill.
In this article I will show you a way to make your oscillator-type indicators make
clear black-or-white indication of the time to buy or sell. I will do this by using the
Inverse Fisher Transform to alter the Probability Distribution Function (PDF) of
your indicators. In the past12 I have noted that the PDF of price and indicators do
not have a Gaussian, or Normal, probability distribution. A Gaussian PDF is the
familiar bell-shaped curve where the long “tails” mean that wide deviations from
the mean occur with relatively low probability. The Fisher Transform can be
applied to almost any normalized data set to make the resulting PDF nearly
Gaussian, with the result that the turning points are sharply peaked and easy to
identify. The Fisher Transform is defined by the equation
1)
Whereas the Fisher Transform is expansive, the Inverse Fisher Transform is
compressive. The Inverse Fisher Transform is found by solving equation 1 for x
in terms of y. The Inverse Fisher Transform is:
2)
The transfer response of the Inverse Fisher Transform is shown in Figure 1. If
the input falls between –0.5 and +0.5, the output is nearly the same as the input.
For larger absolute values (say, larger than 2), the output is compressed to be no
larger than unity. The result of using the Inverse Fisher Transform is that the
output has a very high probability of being either +1 or –1. This bipolar
probability distribution makes the Inverse Fisher Transform ideal for generating
an indicator that provides clear buy and sell signals.

MayerMultiple StochasticThis is an stochastic chart of Price adjusted Mayer Multiple Average Delta.
Moving Average Function can be selected from a list with standard functions and following experimental extras:
- Volume Weighted Exponential Moving Average
- Volume Weighted Time Decayed Moving Average // similar to vwema, but alpha is calculated from length as half-life decay function (not sure if I got that right...)
Default MA function is sma, to keep it true to the original MM indicator, but I think VWEMA and VWTDMA may perform better with exponential nature of Bitcoin .
See also:
Suggestions and bug reports are welcome =)

Strategy Stochastic Crossover Backtest This back testing strategy generates a long trade at the Open of the following
bar when the %K line crosses below the %D line and both are above the Overbought level.
It generates a short trade at the Open of the following bar when the %K line
crosses above the %D line and both values are below the Oversold level.
You can change long to short in the Input Settings
Please, use it only for learning or paper trading. Do not for real trading.

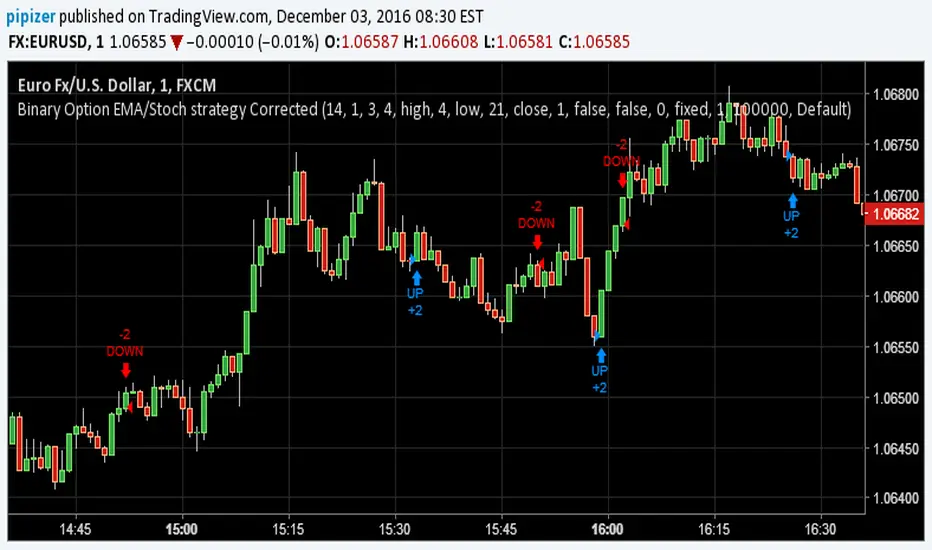
Binary Option EMA/Stoch strategy CorrectedPrevious indicator was flawed I mistakenly misplaced the script which was giving opposite signals. This on is corrected version of previous EMA/Stoch strategy.
Triple StochasticHi Traders,
This indicator triples the Stochastic in a short momentum line and a middle trend / divergence line.
Overall direction is displayed by the histogram which changes color when momentum is high or low.
The length is based on Fibonacci numbers which are multiplied by 2.618 and give in this sequence a great visual perception of price movement.

SMI BarsUses SMI (Stochastic Momentum Index) to set bar colors:
When SMI above overbought, bar color is red.
When SMI is between 0 and overbought, bar color is maroon
When SMI is between oversold and 0, bar color is green
When SMI is below oversold, bar color is lime.
When SMI crosses above or below 0, bar color is orange.

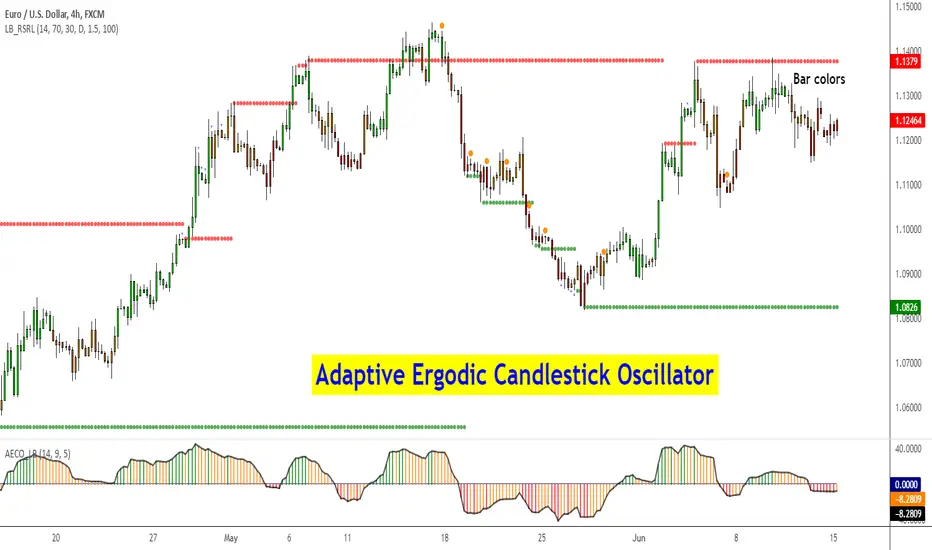
Adaptive Ergodic Candlestick Oscillator [LazyBear]This updates Blau's excellent Candlestick oscillator to be adaptive by using the length of a scaled stochastic indicator and an exponent (for calculating the smoothing coefficient) to obtain the moving average.
Check out the options page for configurable variables.
More info on Ergodic Oscillator:
Book: "Momentum, Direction and Divergence" by William Blau
List of my public indicators: bit.ly
List of my app-store indicators: blog.tradingview.com
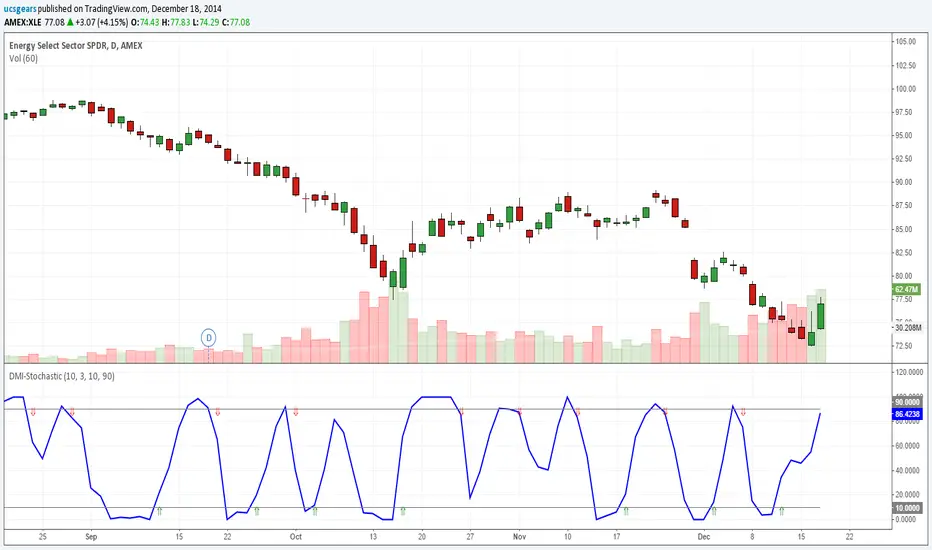
DMI Stochastic Extereme - Version 2Version 2 Includes
Custom setting for the Oversold and Overbought Levels
Replaced B and S with arrows
Cleaned up the code and finalized the indicator.
*Unless there is a real need, this indicator will not be revised further.