StochRSI x RSI x CCI x EMAsWanted to put this out there. Kind of a rough explanation but basically I wanted to build an indicator that takes out emotions and is easy to read. The indicator is basically RSI, stochRSI, CCI, and EMAs into an easy to read package. The traffic lights at the end will tell you if stochRSI/RSI and price action above according to EMA ribbon are in agreement. RSI with a period of 2 also always seemed very useful to me but it was just extremely distracting to look at it. I tried to make many rules in this indicator to find as much confluence between RSI, stochRSI, CCI, and EMAs to help you make better decisions. What is shown on the indicator is not necessarily a buy/sell signal. It should be seen as a way to view strength of price and possible momentum changes.
I find that one of the biggest distractions of indicators is taking your eyes off what is really happening at the chart above. This indicator uses popular and well used tools and helps you to get an easier visual of what is happening.
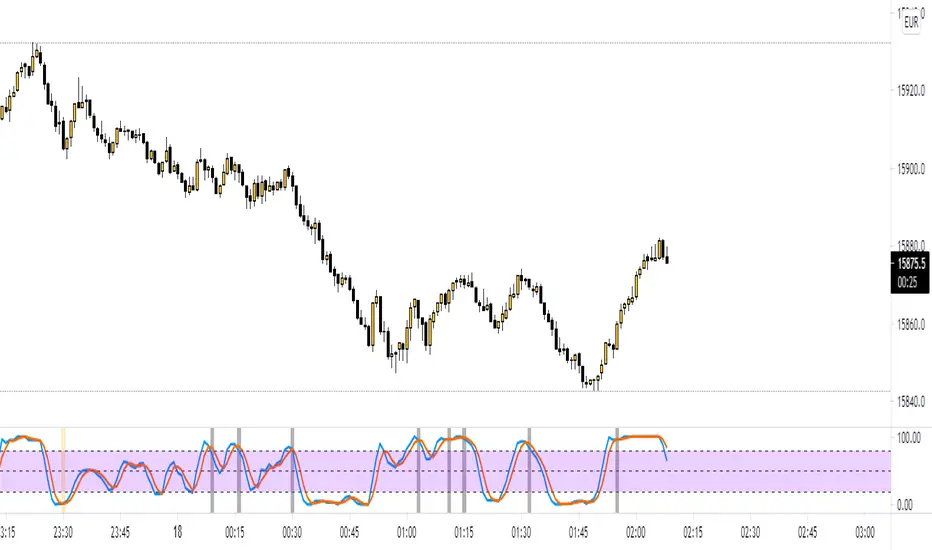
Purple lines at top and bottom: Short RSI ob/os
Red/orange and blue/green lines at top and bottom: When stochRSI kd and CCI also crosses +/- 100 or 200
Blue background: when stochRSI k > d and short RSI crosses above 30
Red background: when stochRSI k < d and short RSI crosses below 70
Green crosses: StochRSI is above 80 and making higher highs
Red X crosses: StochRSI is below 20 and making lower lows
Red/green fill of stochRSI and purple/blue dots on RSI: When short RSI and stochRSI are both ob/os
Red/green fill of RSI: Green when Long rsi > 50, red when Long rsi < 50
60/40 lines: Possible support/resistance for RSI
Traffic lights
1st light: Long RSI > EMA and stoch RSI k>d or vice versa
2nd light: Price above EMA 1 and 2 or vice versa
3rd light: when lights 1 and 2 are in agreement
Hope you enjoy!
Cerca negli script per "stoch"

Super StochSuper Stoch Update
// Short Name Changed To "SS 3.0"
// Added a third StochRSI.
// Default resolutions S1= W, S2= D, S3= 240 (4H)
// Signal function for all StochRSI's.
// Made a Variety of Cosmetic Changes

Stochastic SuperTrend [BigBeluga]🔵 OVERVIEW
A hybrid momentum-trend tool that combines Stochastic RSI with SuperTrend logic to deliver clean directional signals based on momentum turns.
Stochastic SuperTrend is a straightforward yet powerful oscillator overlay designed to highlight turning points in momentum with high clarity. It overlays a SuperTrend-style envelope onto the Stochastic RSI, generating intuitive up/down signals when a momentum shift occurs across the neutral 50 level. Built for traders who appreciate simplicity without sacrificing reliability.
🔵 CONCEPTS
Stochastic RSI: Measures momentum by applying stochastic calculations to the RSI curve instead of raw price.
SuperTrend Bands: Dynamic upper/lower bands are drawn around the smoothed Stoch RSI line using a user-defined multiplier.
Momentum Direction: Trend flips when the smoothed Stoch RSI crosses above/below the calculated bands.
Neutral Bias Filter: Directional arrows only appear when momentum turns above or below the central 50 level—adding confluence.
🔵 FEATURES
Trend Detection on Oscillator: Applies SuperTrend logic directly to the Stoch RSI curve.
Clean Entry Signals:
→ 🢁 arrow printed when trend flips bullish below 50 (bottom reversals).
→ 🢃 arrow printed when trend flips bearish above 50 (top reversals).
Custom Multiplier: Adjust sensitivity of SuperTrend band spacing around the oscillator.
Neutral Zone Highlight: Visual zone between 0–50 (green) and 50–100 (red) for quick momentum polarity reference.
Toggle SuperTrend Line: Option to show/hide the SuperTrend trail on the Stoch RSI.
🔵 HOW TO USE
Use 🢁 signals for potential bottom reversals when momentum flips bullish from oversold regions.
Use 🢃 signals for potential top reversals when momentum flips bearish from overbought areas.
Combine with price-based SuperTrend or support/resistance zones for confluence.
Suitable for scalping, swing trading, or momentum filtering across all timeframes.
🔵 CONCLUSION
Stochastic SuperTrend is a simple yet refined tool that captures clean momentum shifts with directional clarity. Whether you're identifying reversals, filtering entries, or spotting exhaustion in a trend, this oscillator overlay delivers just what you need— no clutter, just clean momentum structure.

Kalman Filtered ROC & Stochastic with MA SmoothingThe "Smooth ROC & Stochastic with Kalman Filter" indicator is a trend following tool designed to identify trends in the price movement. It combines the Rate of Change (ROC) and Stochastic indicators into a single oscillator, the combination of ROC and Stochastic indicators aims to offer complementary information: ROC measures the speed of price change, while Stochastic identifies overbought and oversold conditions, allowing for a more robust assessment of market trends and potential reversals. The indicator plots green "B" labels to indicate buy signals and blue "S" labels to represent sell signals. Additionally, it displays a white line that reflects the overall trend for buy signals and a blue line for sell signals. The aim of the indicator is to incorporate Kalman and Moving Average (MA) smoothing techniques to reduce noise and enhance the clarity of the signals.
Rationale for using Kalman Filter:
The Kalman Filter is chosen as a smoothing tool in the indicator because it effectively reduces noise and fluctuations. The Kalman Filter is a mathematical algorithm used for estimating and predicting the state of a system based on noisy and incomplete measurements. It combines information from previous states and current measurements to generate an optimal estimate of the true state, while simultaneously minimizing the effects of noise and uncertainty. In the context of the indicator, the Kalman Filter is applied to smooth the input data, which is the source for the Rate of Change (ROC) calculation. By considering the previous smoothed state and the difference between the current measurement and the predicted value, the Kalman Filter dynamically adjusts its estimation to reduce the impact of outliers.
Calculation:
The indicator utilizes a combination of the ROC and the Stochastic indicator. The ROC is smoothed using a Kalman Filter (credit to © Loxx: ), which helps eliminate unwanted fluctuations and improve the signal quality. The Stochastic indicator is calculated with customizable parameters for %K length, %K smoothing, and %D smoothing. The smoothed ROC and Stochastic values are then averaged using the formula ((roc + d) / 2) to create the blended oscillator. MA smoothing is applied to the combined oscillator aiming to further reduce fluctuations and enhance trend visibility. Traders are free to choose their own preferred MA type from 'EMA', 'DEMA', 'TEMA', 'WMA', 'VWMA', 'SMA', 'SMMA', 'HMA', 'LSMA', and 'PEMA' (credit to: © traderharikrishna for this code: ).
Application:
The indicator's buy signals (represented by green "B" labels) indicate potential entry points for buying assets, suggesting a bullish trend. The white line visually represents the trend, helping traders identify and follow the upward momentum. Conversely, the sell signals (blue "S" labels) highlight possible exit points or opportunities for short selling, indicating a bearish trend. The blue line illustrates the bearish movement, aiding in the identification of downward momentum.
The "Smoothed ROC & Stochastic" indicator offers traders a comprehensive view of market trends by combining two powerful oscillators. By incorporating the ROC and Stochastic indicators into a single oscillator, it provides a more holistic perspective on the market's momentum. The use of a Kalman Filter for smoothing helps reduce noise and enhance the accuracy of the signals. Additionally, the indicator allows customization of the smoothing technique through various moving average types. Traders can also utilize the overbought and oversold zones for additional analysis, providing insights into potential market reversals or extreme price conditions. Please note that future performance of any trading strategy is fundamentally unknowable, and past results do not guarantee future performance.

Stochastic Oversold / Overbought Multi Time Frame on CandleAt the suggestion of a friend, I prepared this educational indicator to show how to use a Multi time frames on the chart based on the color of The Candle.
This Script calculates the stochastic oscillator for multiple timeframes and displays the overbought/oversold signals on the chart with color coding.
The stochastic oscillator is a momentum indicator that compares a security's closing price to its high-low range over a set number of periods. The indicator oscillates between 0 and 100, with readings above 80 considered overbought and readings below 20 considered oversold.
The indicator has the following input parameters:
%K Length: the number of periods used to calculate the stochastic oscillator (default is 14).
%K Smoothing: the number of periods used to smooth the stochastic oscillator (default is 1).
Three timeframes: The timeframes for which the stochastic oscillator is calculated can be set as 15-minute, 1-hour, or 4-hour intervals. For each timeframe, the user can choose to display the indicator (or not) and set the color of the candle. The user can also set the overbought and oversold levels (default is 80 and 20, respectively).
The indicator calculates the stochastic oscillator using the ta.stoch function from the built-in ta library in PineScript. It then uses the ta.sma function to smooth the stochastic oscillator if specified. Finally, the indicator uses the TimeframFuction to calculate the stochastic oscillator for different timeframes, which is then displayed on the chart using the barcolor function. The color of the candle is set based on whether the stochastic oscillator is overbought or oversold, as determined by the overbought/oversold levels specified by the user.
Note: This code is example for you to use multi timeframe in your indicator or Strategy , also prevent Repainting Calculation

Adaptive Fisherized Stochastic Center of GravityIntroduction
I modified the script "Fisher Stochastic Center of Gravity" of @DasanC for this indicator.
I added inverse Fisher transform, cycle period adaptiveness mode (Ehlers) and smoothing to it.
Moreover, I added buy and sell and beautified some stuff.
Lastly, it is also non-repainting!
Usage
This indicator can be used like a normal stochastic, but I don't recommend divergence analysis on it.
That fisherization stuff seems to make the graphs unuseable for that because it tries.
It works well on every timeframe I would say, but lower timeframes are recommended, because of the fast nature of stochastic.
Usually it does a good job on entry confirmation for reversals and trend continuation trades.
Recommended indicator to combine with this indicator is RSI cyclic smoothed v2 .
This is the best RSI version I know. In trending market it is recommended to look more on the inner bands and in flat market it is recommended to look more on the outer bands.
When RSI shows oversold and this indicator shows a crossover of the Center of Gravity plot through the bottom line -> Long entry is confirmed
When RSI shows overbought and this indicator shows a crossunder of the Center of Gravity plot through the top line -> Short entry is confirmed
Settings
The adaptive mode is enabled by default to give you straight the whole indicator experience.
The default settings are optimized, but should be changed depending on the market.
An example:
Market has a low volatility and a high momentum -> I want a slower/higher length to catch the slower new highs and lows.
Market has higher volatility and a low momentum, -> I want a faster/lower length to catch the faster new highs and lows
Signals
Crossover
Buy -> cog crossover signalLine
Sell -> cog crossunder signalLine
Overbought/Oversold Crossover
Buy -> cog crossover lowerBand
Sell -> cog crossunder lowerBand
I use this indicator a lot, because I don't know a better stochastic on this community here.
@DasanC did an awesome work with his version I used as base for this script.
Enjoy this indicator and let the profit roll! 🔥
Stochastic RSI Heat Bollinger BandsThis indicator is based on a combination of the famous Bollinger Bands and the Stochastic RSI indicator.
Bands are dynamically colored (and filled) with a RGB color composed by red and green values, directly generated from the average Stochastic RSI current value.
By default, colors represent the following status -> green zone is overgought & red zone is oversold.
A screener is also displayed on the chart, representing StochRSI K and D lines values, RSI value, as well as the current status (Overbought/Oversold) of the StochRSI and RSI indicators.
Notes:
The heat color and the screener status are both based on the average value between the K and D lines (for stochastic RSI based heat)
Bands can be disabled in options to use this indicator as a simple moving average colored by the Stochastic RSI heat color.
Options:
Various moving average types (SMA, EMA, SMMA, VWMA...)
Inversion of colors between overbought and oversold status
Enabling/disabling heat color on bands / basis line and bands background color
Show/Hide the screener
Color source can be modified to base the heat on the RSI instead of the Stochastic RSI value
Standards Bollinger bands, Stochastic and RSI parameters
Example
Feel free to suggest any improvements in comment.

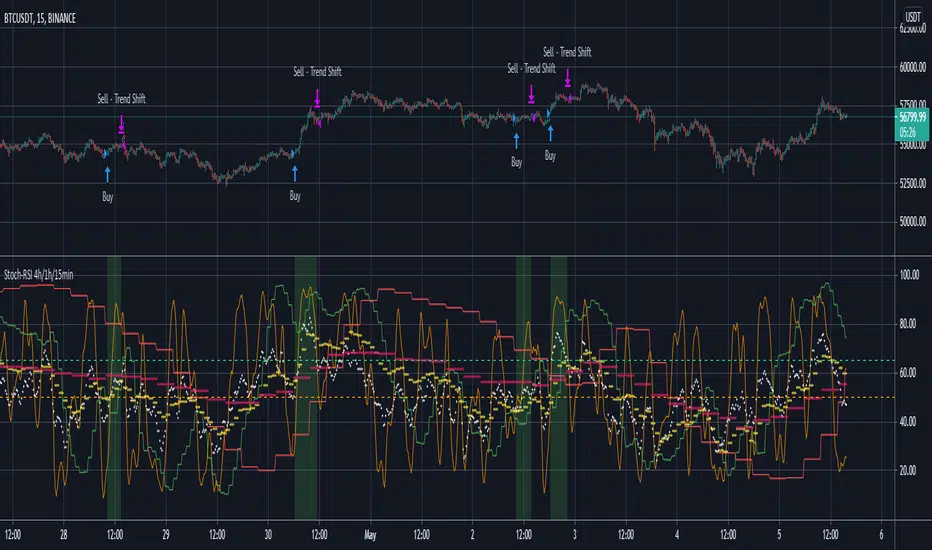
Stoch-RSI 4h/1h/15min!!!! Note: Run this on the 15min timeframe (Important) !!!!
Note the default settings on this indicator are best for BTC/USDT. For other pairs it might take some fiddling with variables to get a useful result (if a useful result is obtainable with the selected pair)
Generally, select between the options (RSI/Stoch) and (15min/1hour) and (1hour/4hours) - to find a strategy backtest result that is worth considering.
Only long positions are considered here (I tried shorts but could not get a credible backtest result with this approach).
This is an indicator which looks at RSI and StochRSI on the 15min, 1hour and 4hour timeframe.
The user can select a 15min/1hour option (RSI/Stoch) and then also a 1hour/4hour option (RSI/Stoch).
So there is one selection from a lower (15min/1hour) timeframe and another selection from a longer (1hour/4hour) timeframe.
The general idea is to, consider buying when, the lower timeframe (RSI/Stoch) is going upwards and also the longer timeframe (RSI/Stoch) is going upwards.
A good backtest result would suggest that the confluence in RSI/Stoch over the shorter and longer timeframes can estimate a good time to buy.
(Careful with a 1hour Stoch for the shorter timeframe variable as its possible to also select a 1hour Stoch for the longer timeframe variable.)
There are user set variables that can be set to avoid a buy signal, if either the lower or high timeframe variables are greater than.
For example, buying when a rsi/stoch is >65% might not be advisable as the rsi/stoch is most probably due for a downswing when above this value.
The strategy closes a position when either the shorter or longer timeframe variables no longer are going up.
There is also a take profit % which can be set to exit trades at a given %.
The default values on this indicator tool are for bitcoin, which shows a reasonable backtest result. - worth sharing on tradingview.
Please do get in touch for any additional information/suggestions.
Sincerely,
MoonFlag
(JS) Triple StochasticSo I ended up adding a ton of stuff to my prior Double Stochastic script which you can see here .
The concept of the Double was to smooth out the existing Stochastic by applying a Stochastic to the existing Stochastic (hence the Double). My concept for the Triple Stochastic is much different. It combines a regular stochastic, stochastic RSI, and the double stochastic to get a smoothed output based on all 3.
Also - since I love being able to see a Squeeze (see my Squeeze Pro indicators - Squeeze Pro 2 & Squeeze Pro Overlays ) I added the Squeeze to the Stochastic (the dots). If you're unfamiliar with how a Squeeze works, or what it is, check out my links for explanation. A quick explanation however is that the Squeeze is an indicator that was invented by John Carter that detects price compression before a big move out of a range. This is done by using Bollinger Bands and Keltner Channels, the BB shrink inside the KC. The color of the dots represent the depth of the BB in the KC, white (or black) being the lightest squeeze, red being the standard squeeze, and yellow being the strongest squeeze. Now on to the indicator:
The first thing you'll notice is the options available for the type of Stochastic you'd like to use:
Standard : This is a regular Stochastic
Stochastic RSI : This is the standard Stochastic RSI
Double : This is the Stochastic on top of a Stochastic from the prior version
Triple : This is simply an average of all 3 of the above combined together
(Top indicator shows the Triple Stochastic)
The options "K", "D", and "Smooth" are the settings from a regular Stochastic used to set up the type of Stochastic you choose to use.
Now let's say you're not sure how one type performs compared to another, or you like the quickest momentum change but also like to see the smoothest trend, or you want to use the same types of Stochastic and watch for them to cross like moving averages - for these reasons I added the ability to add a second Stochastic for comparison.
(2nd indicator shows a fast and slow Triple Stochastic together)
Quite obviously, the "K 2", "D 2", and "Smooth 2" are what is used in order to set the parameters for the second Stochastic.
Now another thing I added was the option to replace the regular Stochastic and instead look at the distance between the K and D. By turning off "Use K% and D%" you get to see this in action. To put it simply, a cross above zero would indicate a positive Stochastic crossover, and a cross below zero would represent the opposite. There's also an option titled "SMA Length using Difference" which, to smooth this out a bit, allows you to apply a moving average to the distance. By setting it at 1 you'd see the actual distance between K and D.
(3rd indicator shows the K and D distance used as a plot)
Another thing I wanted to do was add a different type of background that wasn't based on the indicator itself. I decided to use ADX & DMI which is a great way to determine the trend. When you select "ADX/DMI BG" the BG colors will change from being based on the indicator to being based on ADX and DMI.
(The 3rd indicator also shows the ADX/DMI BG being used).
And now finally the last feature I decided to add takes us back to the Squeeze. Essentially it is just the Stochastic shown through the lens of Squeeze momentum, as I ended up plugging the Stochastic output into the Squeeze momentum formula to create an oscillator. By selecting "Use Oscillator" you will see this in action as well.
(Bottom indicator shows the oscillator addition)

Stochastic RSI Strategy (with SMA and VWAP Filters)The strategy is designed to trade on the Stochastic RSI indicator crossover signals.
Below are all of the trading conditions:
-When the Stochastic RSI crosses above 30, a long position is entered.
-When the Stochastic RSI crosses below 70, a short position is entered.
-The strategy also includes two additional conditions for entry:
-Long entries must have a positive spread value between the 9 period simple moving average and the 21 period simple moving average.
-Short entries must have a negative spread value between the 9 period simple moving average and the 21 period simple moving average.
-Long entries must also be below the volume-weighted average price.
-Short entries must also be above the volume-weighted average price.
-The strategy includes stop loss and take profit orders for risk management:
-A stop loss of 20 ticks is placed for both long and short trades.
-A take profit of 25 ticks is placed for both long and short trades.

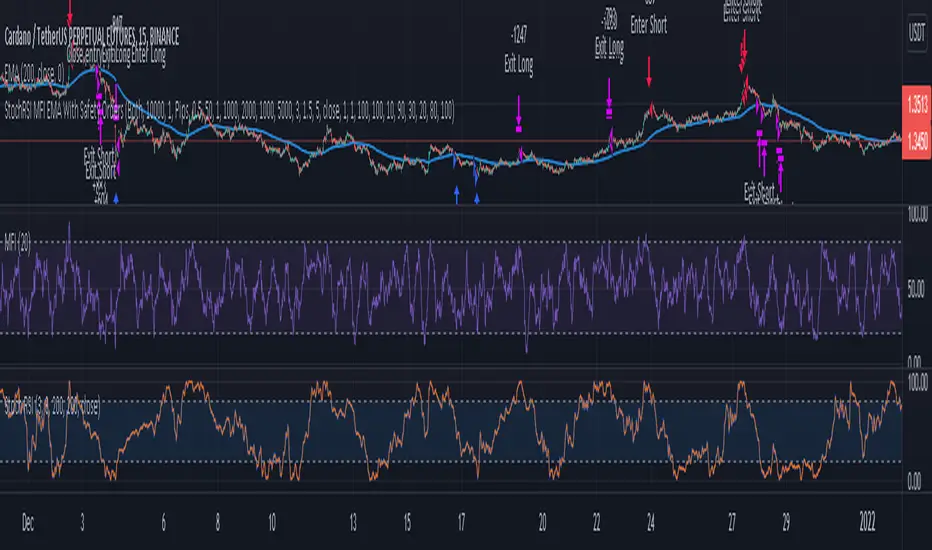
3 Indicator Strategy (StochRSI, MFI & EMA) With Safety OrdersThis strategy uses Stochastic RSI, Money Flow Index and EMA with settings for lower time-frames.
It also features safety orders based on 3 different take profit and stop loss methods.
Recommended Indicator Settings for lower time-frames;
Stoch RSI: 1,1,100,100
MFI: 30
EMA: 100
Take Profit/Stop Loss Settings:
There are 3 TP/SL types available;
- Pips -> based on minticks
- Base Value -> manually entering a value for the actual profit/loss.
- Opposite Signal -> e.g. if the current open order is long, strategy waits for the next short signal.
Stochastic RSI w/ Crossover Alerts (by WJ)NOTE:
// STOCH RSI CODE TAKEN FROM DEFAULT INDICATOR
// I HAVE ONLY MADE SOME ADJUSTMENTS FOR VISUAL AID
// I MADE THIS FOR MY OWN USE BUT HAVE DECIDED TO PUBLISH AND SHARE IN CASE ANYBODY WANTS TO USE IT
This is the normal default built-in Stochastic RSI indicator which I have added some stuff for visual aid:
Added middle line (50)
Stoch RSI background turns green when K line crosses D line UPWARDS, K line is below the 50 level, and price is above 200 EMA
Stoch RSI background turns red when K line crosses D line DOWNWARDS, K line is above the 50 level, and price is below 200 EMA
Alert notification on the crossover candle with background colour change conditions met
Function StochRSI Stochastic Relative Strength Index developed by Tushar Chande and Stanley Kroll.
This script has been written to eliminate the period variable.(Integer)
Thus, it can be used comfortably in adaptive period scripts ! (For example : Adaptive Moving Average , KAMA , FAMA .. etc. )
All efforts goes to ChaosTrader () ,
RicardoSantos () ,
Hpotter for barcolor codes (iff) ()
I hope it will help your new ideas . Best regards ! Noldo .

Stochastics + VixFix Buy/Sell SignalsThis script is designed for long-term investors using ETFs on a weekly timeframe, where catching high-probability bottoms is the goal. It combines the Stochastic Oscillator with the Williams VixFix to identify moments of extreme fear and potential reversals.
A Buy signal is triggered when:
Stochastic %K drops below 20
VixFix forms a green spike (suggesting a panic-driven market flush)
A Sell signal is triggered when:
Stochastic %K rises above 90
VixFix falls below 5 (indicating excessive complacency)
Catching tops is much harder than catching bottoms.
These Sell signals are not designed to fully exit positions. Instead, they suggest trimming a small portion of ETF holdings — simply to free up liquidity for future opportunities.
This strategy is ideal for:
Long-term ETF investors
Weekly charts
Systematic decision-making in volatile markets
Use in conjunction with macro indicators, sector rotation, and valuation frameworks for best results.

Stochastic ChannelsDonchain trend following system with overbought/ oversold areas inspired by stochastic. Multiplier to get non repainting HTF capability. features a smoothed price as well as moving average of the smoothed price, also inspired by the stochastic indicators %K and %D. This and slow stochastics compliment each other nicely.
%D line colored by direction.
Filled color areas represent overbought/oversold.
Shows breakouts as well as giving targets and entries in rangebound markets.

Multi-timeframe MAs + Stoch RSI SignalsHello traders,
I welcome you to my first published script on TradingView: “Multi-timeframe Moving Averages + Stochastic RSI”.
The script is based on a simple formula: Buy signals are generated when a fast moving average is above a slower moving average (uptrend) and the Stochastic RSI K line is crossing above the oversold level (entry).
Sell signals are generated when a fast moving average is below a slower moving average (downtrend) and the Stochastic RSI K line is crossing below the overbought level (entry).
This indicator works best in strong trends!
**Please note the above example has repainting turned on which may produce unrealistic results when viewing historical data. See below for more information regarding this and how you can turn it off.**
The user has the following inputs:
- Option to change the Stochastic RSI settings, including the oversold and overbought levels.
- Option to enter any value for both the Fast Moving Average and the Slow Moving Average.
- Option to change between EMA or SMA for each moving average.
- Multiple time frames to choose from, as well as the ability to selectively turn off individual time frames (both plots and alerts).
(Default time frames are 1 hour, 4 hour, and Daily. You can have a 4th time frame by changing your current time frame to something lower than the other 3 time frames)
- Turn on/off repainting: If repainting is turned on you will get an alert and buy/sell signal on chart immediately when condition is met, however the signal may disappear from chart if the condition reverses during the same candle.
If repainting is turned off, the indicator will wait for the candle to close before issuing the alert and painting the signal on chart.
For higher time frames, the indicator will wait for the candle in the higher time frame to close before issuing a signal if repaint is turned off. Default is set to Repaint on, so please be aware of this if you do not want repainting.
How to use alerts:
- Before you do anything, make sure your current time frame is the lowest time frame you’d like alerts on, as you will still receive alerts for the higher time frames you selected in settings.
- Once you have all the settings changed to how you like, save your chart first. Then right click on any of the indicator’s buy/sell signals on the chart and click “Add Alert on MAs + Stoch RSI”.
- Make sure “Any alert() function call” is selected under the Condition.
- You can delete or change the text in “Alert name” if you want as the alert message is already built into the indicator, and it will tell you in the alert message which asset and time frame to buy or sell.
Other things to note:
- The indicator will not display the buy/sell signals of lower time frames when you are on a higher time frame. This was done purposely to reduce clutter on the chart when you switch to higher time frames.
- While the alert message will tell you which time frame a signal was generated, the plots on the chart will instead show “Buy/Sell TF1, or TF2, or TF3”.
If the signal is from the current time frame that the alert was created on, then it will simply show “Buy” or “Sell”.
Hope you guys enjoy using this one, please drop a like if you found it useful. If anyone wants to modify my script in any way, please just credit me for the original work when you publish the script. Good luck!

Stochastic RSI - DurbtradeDurbtrade Stoch RSI -
1) Stoch RSI
A) The K line can be customized to change color based on vertical direction.
B) The space between K line and D line can be filled with a color depending on whether K line is above or below the D line.
C) There are color-coded, cross-over and cross-under background fills, to signal when the K line crosses the D line.
D) K line is drawn in front of D line (D line is drawn behind K line).
E) Default values : K = 3, D = 4, RSI Length = 14, Stoch Length = 14
2) Horizontal Lines
A) Horizontal lines can be drawn automatically, so you don't have to draw them, and they don't extend past the current bar.
B) There are 11 customizable horizontal lines,
and each line is set to non-customizable increments (zero, 10, 20, 30, 40, fifty, 60, 70, 80, 90, hundred).
C) The 11 lines are divided into 2 groups:
a) 4 PAIRS of lines WITH fill options (10/90, 20/80, 30/70, 40/60... 8 lines total), and
b) 3 INDIVIDUAL lines WITHOUT fill options (zero, fifty, hundred).
D) The 4 fills give you the option to fill the space between each pair with a customizable color and opacity,
regardless of whether the lines themselves are drawn or not.
(all default values are what I feel work best for this indicator...
and initially, only the zero, fifty, and hundred lines are drawn automatically .
You may add the other lines if you choose to, by adjusting the opacity to your liking).
3) Conclusion
A) As with my previous indicators, this one maximizes information, color, discernment, clarity, and customization.
B) It is optimized for your ability to be able to easily customize the indicator according to your preferences...
for use on your own personal television, laptop, or cellular phone screen setup... and on all chart zoom levels and layouts.
C) Please feel free to comment your thoughts, critiques, or suggestions. They are all helpful!
D) Check out my previous pine script indicators if you like this one. They work really well together.
E) I hope that you find this script useful.
F) Enjoy!
//Durbtrade

Stochastic RSI 3in1 & Volatility peaks + ADX by AGUDescription:
3 Lines are Stochastic RSI's, strongest move is when all crosses and moves to one direction (from top or bottom).
Orange is original Stochastic of the timeline. (Live movement of price).
Green is original Stoch x 6. (Short term movement).
Red is original Stoch x27 (Long term price movement).
Transparent columns are ADX signal.
Higher the mountain, stronger the signal. When the mountain tops, trend usually change.
And finally the volatility peaks. Green peak HIGHEST volatility , RED peak LOWEST volatility .
I use it on 1 min BTC chart. But it works on all.
TIPS >> 3HCQ41cRpxcq2MJdRUSYoq9N1RnEy98xD2

Stoch + RSI DashboardIndicator Description
MTF Stochastic + RSI Dashboard FLEX with STRONG Alerts
A compact, multi-timeframe dashboard that shows Stochastic %K/%D, RSI and signal states across user-defined timeframes. Columns can be toggled on/off to keep the panel as small as you need. Signal texts and colors are fully customizable. The table can be placed in any chart corner, and the background color & opacity are adjustable for perfect readability.
What it shows
• For each selected timeframe: %K, %D, a signal cell (Bullish/Bearish/Strong), RSI value, and RSI state (Overbought/Oversold/Neutral).
• Timeframes are displayed as friendly labels (e.g., 60 → 1h, W → 1w, 3D → 3d).
Signals & logic
• Bullish/Bearish when %K and %D show a sufficient gap (or an optional confirmed cross).
• Strong Bullish when both %K and %D are below the “Strong Bullish max” threshold.
• Strong Bearish when both %K and %D are above the “Strong Bearish min” threshold.
• Optional confirmation: RSI < 30 for Strong Bullish, RSI > 70 for Strong Bearish.
Alerts
• Global alerts for any selected timeframes when a STRONG BULLISH or STRONG BEARISH event occurs.
Key options
• Column visibility toggles (TF, %K, %D, Signal, RSI, RSI Status).
• Custom signal texts & colors.
• Dashboard position: top-left / top-right / bottom-left / bottom-right.
• Table background color + opacity (0 = opaque, 100 = fully transparent).
• Sensitivity (minimum %K–%D gap) and optional “cross-only” mode.
• Customizable timeframes for display and for alerts.
Default settings
• Stochastic: K=5, D=3, SmoothK=3
• RSI length: 14
• Decimals: 1
• Strong Bullish max: 20
• Strong Bearish min: 80
• Default TFs & alerts: 3m, 15m, 1h, 3h, 6h, 12h, 1d, 3d, 1w

Stochastic Smooth Relative Strength Index (SSRSI)This is Stochastic RSI but it uses smoothed RSI instead. You use it the same as any other Stochastic RSI :)
The features in this scripts are: RSI Length, Extra Smoothing, Extra Smooth RSI Filter, Stochastic Length, and K and D.
I hope you find this release useful!
The Stochastic RSI indicator ( Stoch RSI ) is essentially an indicator of an indicator. It is used in technical analysis to provide a stochastic calculation to the RSI indicator. This means that it is a measure of RSI relative to its own high/low range over a user defined period of time. The Stochastic RSI is an oscillator that calculates a value between 0 and 1 which is then plotted as a line. This indicator is primarily used for identifying overbought and oversold conditions.

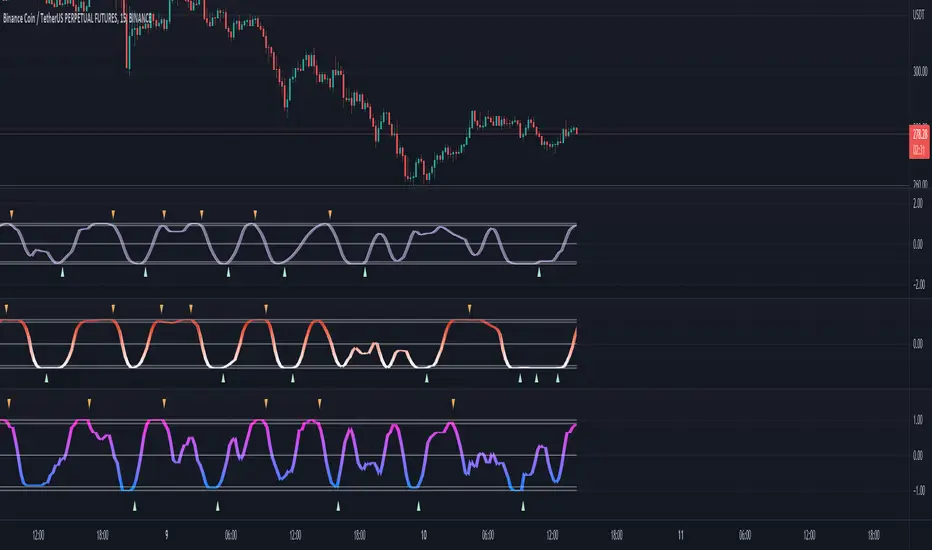
Lysergik's Stochastic SynergyThis indicator shows the average Stochastic RSI output of the 15m, 1h, 2h, 4h, and Daily Stochastic RSI. It will change in its behavior depending on the time-frame you're using, but for many markets it works best on the 30m time-frame and the daily time-frame.
It is best used along with Lysergik's Fib Cross, which will allow you to avoid false signals in the stochastic synergy indicator. If your MA cross (50, 200) indicates a direction change opposite of the stochastic RSI synergy indicator then that is a signal to wait for more price action to determine your entry/exit points.
Using the Lysergik's Fib Cross, the same applies, but remember that a golden cross (white cross symbol) followed directly by a golden ratio cross (gold cross symbol) is even further indication that the stochastic RSI needs more breathing room before reversing.
This indicator is fully adjustable for you to back-test against charts and refine the indicator to your market.
The inputs in respective order are as follows:
RSI Length, Stoch Length, Smooth K, Smooth D, Upper Limit, Lower Limit, Basis
Enjoy and remember only make trades on your own terms.
Happy trading/investing! :)

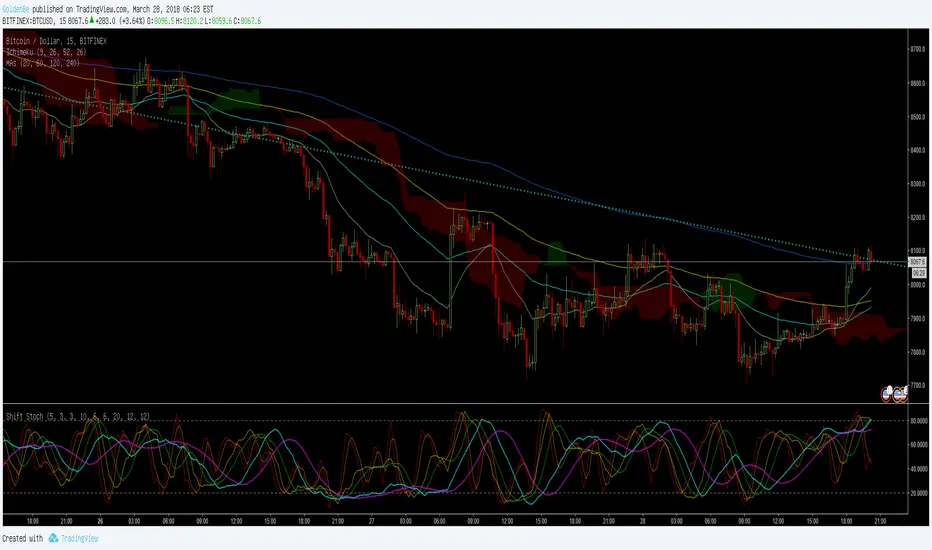
ShiftPower StochasticThis indicator is a combination of the following three slow stochastics commonly used.
ⓐ 5 - 3 - 3
ⓑ 10 - 6 - 6
ⓒ 20 - 12 - 12
( n - %k - %d )
I hope it helps. Thanks.
<한국어>
일반적으로 많이 사용하는 다음 3개의 슬로우 스토케스틱을 하나로 합친 지표입니다.
ⓐ 5 - 3 - 3
ⓑ 10 - 6 - 6
ⓒ 20 - 12 - 12
( n - %k - %d )
도움이 됐으면 좋겠습니다. 감사합니다.