Combo Strategy 123 Reversal & Donchian Channel WidthThis is combo strategies for get a cumulative signal.
First strategy
This System was created from the Book "How I Tripled My Money In The
Futures Market" by Ulf Jensen, Page 183. This is reverse type of strategies.
The strategy buys at market, if close price is higher than the previous close
during 2 days and the meaning of 9-days Stochastic Slow Oscillator is lower than 50.
The strategy sells at market, if close price is lower than the previous close price
during 2 days and the meaning of 9-days Stochastic Fast Oscillator is higher than 50.
Second strategy
The Donchian Channel was developed by Richard Donchian and it could be compared
to the Bollinger Bands. When it comes to volatility analysis, the Donchian Channel
Width was created in the same way as the Bollinger Bandwidth technical indicator was.
As was mentioned above the Donchian Channel Width is used in technical analysis to measure
volatility. Volatility is one of the most important parameters in technical analysis.
A price trend is not just about a price change. It is also about volume traded during this
price change and volatility of a this price change. When a technical analyst focuses his/her
attention solely on price analysis by ignoring volume and volatility, he/she only sees a part
of a complete picture only. This could lead to a situation when a trader may miss something and
lose money. Lets take a look at a simple example how volatility may help a trader:
Most of the price based technical indicators are lagging indicators.
When price moves on low volatility, it takes time for a price trend to change its direction and
it could be ok to have some lag in an indicator.
When price moves on high volatility, a price trend changes its direction faster and stronger.
An indicator's lag acceptable under low volatility could be financially suicidal now - Buy/Sell signals could be generated when it is already too late.
Another use of volatility - very popular one - it is to adapt a stop loss strategy to it:
Smaller stop-loss recommended in low volatility periods. If it is not done, a stop-loss could
be generated when it is too late.
Bigger stop-loss recommended in high volatility periods. If it is not done, a stop-loss could
be triggered too often and you may miss good trades.
WARNING:
- For purpose educate only
- This script to change bars colors.
Cerca negli script per "stop loss"

Adaptive Trailing StopIntroduction
The ability to adapt to possible markets states is important in technical analysis, this is why making adaptive indicator might help get better results. I propose a trailing stop indicator using recursion that can adapt to the efficiency ratio. I have added alerts since it's a often requested feature.
The Indicator
Its quite classical, bands are firstly made then a trailing stop is built around them. The bands are recursive, this allow for faster calculations in general but it also allow for a faster adaptivity. An higher length or factor will make the indicator detect longer term trends, factor determine the raising power of the efficiency ratio.
When smooth is checked the trailing stop will appear smoother.
When adaptive is unchecked the indicator will still act as a trailing stop but might be more affected to ranging markets.
Set a static/trailing stop loss :
You can set your stop loss based on the indicator, a static stop loss can be set at the value of the trailing stop when you enter the market. You can also set it as trailing stop, the indicator will follow the trend thus allowing for potential profits to grow's.
Determine The Trend Direction :
You can generate buy sell signals based on the indicator position relative to the price, when the indicator is lower than the price this indicate a up trending market, when the indicator is higher than the price this indicate a down trending market. If the trailing stop move this indicate a strong current trend.
False signals with trailing stops can happen, the price might go toward the trailing stop making it generate another signal, when market is ranging and exhibiting cyclical behaviour this can affect the indicator and the user might get stuck in a series of false signals, higher length/factor values can fix that at the cost of less early signals.
Identification Of Support And Resistance
Bands during low volatility/ranging markets can return potential reversal points when crossing with the price. The indicator can also do it, even if high/low crosses are better suited to determine support and resistance levels when using a trailing stop. You can use support/resistance identification in conjonction of the current trend detected by the indicator.
Conclusion
The indicator is fully operational in fixed mode while having potential down points in adaptive mode. As you can see the code that return the bands is fully recursive and might provide a great way to create adaptive bands in the future.
I have been asked to give more detail about the indicator uses rather than the construction, i hope the showcased uses are convenient.
Note that the showcased uses can be applied to any trailing stop.
Thanks for reading.

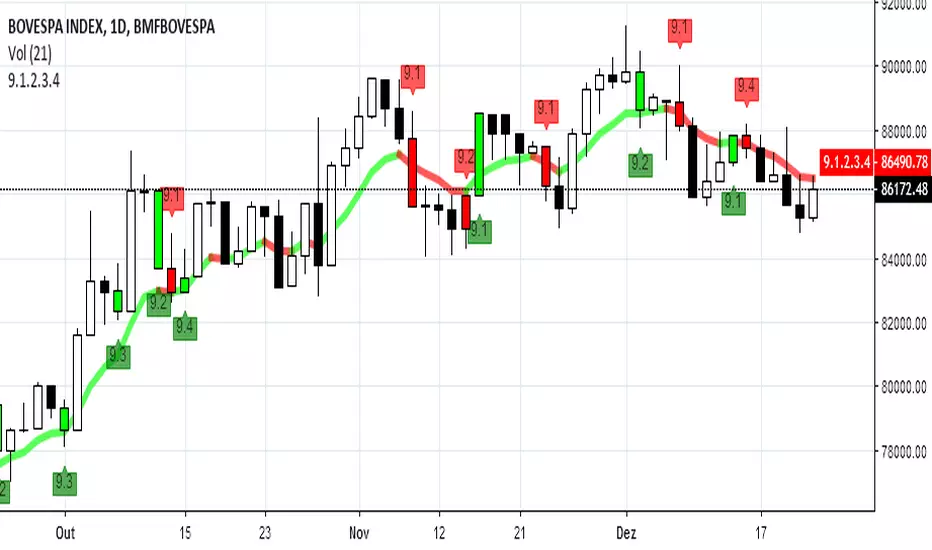
Setup 9.1.2.3.4---IN-US---
Hi traders, created by the professional Trader Larry Willians this trade system is based on 9 EMA, they are called 9.1, 9.2, 9.3 and 9.4.
Setup EMA 9.1
Allowed to buy when EMA 9 period turns to up after a Leg down, and to sell when turns to down after a Leg up.
Setup EMA 9.2
1) Find a stock with 9 EMA uptrend.
2) Wait for a close below the last candle low and mark the high of it candle.
3) If the price doesnt across the high, mark the next high.
4) Buy when the price cross the mark.
5) Stop-loss in the low of the marked candle.
Setup 9.3
1) Find a stock with the 9 period EMA uptrend.
2) Look for a close which is followed by two lower closes,
3) Mark the high of the last candle.
4) Buy when the price cross the mark.
5) Stop-loss in the low of the marked candle.
Setup EMA 9.4
1) Find a stock with 9 EMA uptrend and turns down, but the low of the candle which made turn go down can't be lose, 9 EMA can go down ONLY ONE candle.
2) Wait for 9 EMA go up in the next candle and mark the high.
3) If the price doesnt across the high, mark the next high.
4) Buy when the price cross the mark.
5) Stop-loss in the low of the marked candle.
--PT-BR---
Olá traders, setup universal, criado pelo famoso Trader Larry Williams , e divulgado pelo Trader Palex. Setup baseado na MME de 9 períodos. Temos aqui o conjunto de sinais 9.1, 9.2, 9.3, 9.4.
Setup MME 9.1
Setup MME 9.2
1) Achar ativo com a MME9 subindo;
2) Aguardar fechamento abaixo da mínima do candle anterior e marcar a máxima desse candle;
3) Se a máxima não for rompida, marcar a próxima máxima;
4) Compra no rompimento dessa máxima (qualquer negócio acima dessa máxima);
5) Stop na mínima do candle anterior ao que gerou a entrada;
Setup MME 9.3
1) Achar ativo com a MME9 esteja subindo;
2) Procurar 1 fechamento que seja seguido por dois fechamentos seguidos descendentes (abaixo do "candle referência") e marcar máxima do último candle;
3) Se a máxima não for rompida, marcar a próxima máxima;
4) Compra no rompimento dessa máxima (qualquer negócio acima dessa máxima);
5) Stop na mínima do candle anterior ao que gerou a entrada;
Setup MME 9.4
1) Achar ativo com a MME9 esteja subindo; A MME9 vem subindo e vira para baixo, mas o candle que fez essa virada ocorrer não tem a mínima perdida e a MME9 volta a virar para cima no candle seguinte. Só pode ficar virada pra baixo 1 candle e logo no candle seguinte a média vira pra cima.
2) Marcamos a máxima do candle que fez a MME9 virar para cima e no seu rompimento temos a entrada na
ponta compradora.
3) Se a máxima não for rompida, marcar a próxima máxima;
4) Compra no rompimento dessa máxima (qualquer negócio acima dessa máxima);
5)Stop-loss na mínima do candle que fez a MME9 virar para baixo.
Bons trades a todos.
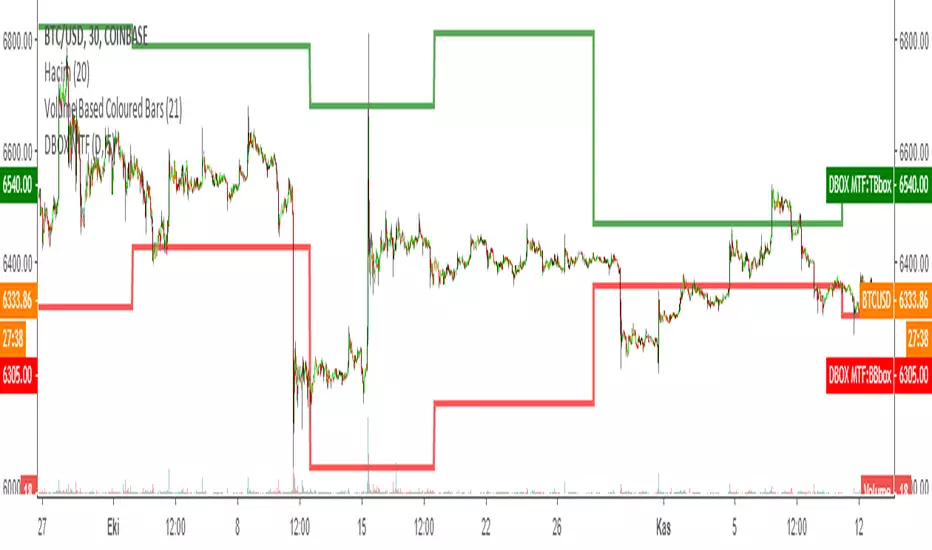
DARVAS BOX MTFMULTIPLE TIME FRAME VERSION OF DARVAS BOX:
You can view different time frame values of Darvas Box levels on any chart
What Is the Darvas Box?
The Darvas Box strategy was developed by Nicholas Darvas. Aside from being a well known dancer, he began trading stock in the 1950s. Based on his success in trading, he was approached to write a book on his strategy. The book, “How I Made $2,000,000 in the Stock Market,” outlines his rather simple approach … simple once you understand the basic concepts and rationale of the strategy.
Darvas Box is an indicator that simply draws lines along highs and lows, and then adjusts them as new highs and lows form. The indicator is available on many trading platforms, such as Thinkorswim. Traders may wish to draw their own boxes though, based on recent highs and lows; Darvas was able to do so (based on telegram quotes) more than half a century ago.
Darvas Box Rules
I shall not follow advisory services.
I shall be cautious of broker advice.
I shall ignore Wall Street sayings or truisms, no matter how ancient or revered.
I shall only trade stocks on major exchanges with adequate volume .
I shall not listen to (or trade off of) rumors or tips, no matter how well researched they may sound.
I will use a sound strategy instead of gamble…I must study this strategy (originally this approach was fundamental analysis , which didn’t work for him, so he developed his Darvas Box trading method).
I will hold one position for longer, as opposed to juggling a bunch of positions for a short period of time.
Darvas looked for increasing volume when selecting stocks to trade; this alerted him to stocks that were being accumulated and were likely to see strong trends.
Darvas believed in buying stocks that presented an upper box limit breakout, but also had an upward Earnings trend. This was especially the case when the major indexes had experienced a decline.
When an upper box limit is broken, buy. From his book, the entry price was usually about 1 to 2% above the upper box limit.
If you enter a trade and the price proceeds to drop out of the new box, and back into the old box, exit the trade.
Entry and stop loss orders should be set in advance, so trades aren’t missed and risk is controlled.
Place, and trail the stop loss order to below the low of the most recent box. This initial stop loss was pretty tight, because Darvas assumed when a price broke out of an old box, it was entering a new box. Therefore, the stop was placed just below the high of old box which was just broken (low of new box).
Record trades, including reasons why you entered and exited.
General conditions of the market must favor buying. Don’t buy stocks when the major indexes are in a bear market, or when volume is flat or declining.
If you are stopped out, but the price moves back into the higher box again providing another buy signal, buy again, using the same stop loss location.
Since the stop is being trailed up, more funds can be added on each consecutive breakout.
The Bottom Line
Nicholas Darvas was a dancer, but committed a great deal of time to developing and then mastering his stock trading method. It’s a trend following method based on breakouts to higher boxes. Risk is controlled by placing a stop below new higher boxes as they form. During choppy conditions the strategy won’t be profitable. This is why Darvas also attempted to only trade stocks with increasing volume and rising Earnings . Trading his method requires a lot of discipline, but can produce big profits when strong trends develop.
source: traderhq.com
Creator: Nicholas DARVAS
Here's the link to a complete list of all my indicators:
tr.tradingview.com
Şimdiye kadar paylaştığım indikatörlerin tam listesi için: tr.tradingview.com
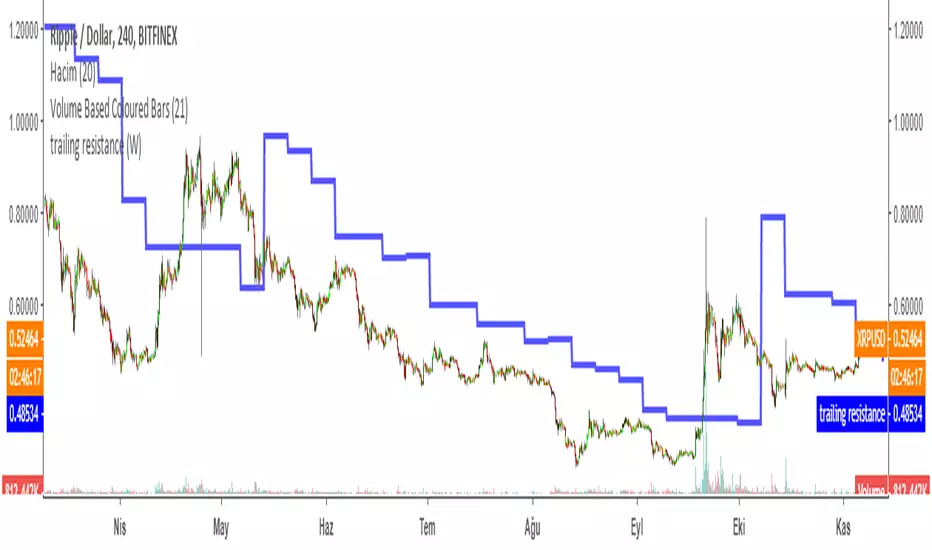
Trailing Resistance MTFTRAILING RESISTANCE INDICATOR is a helpful tool for traders to help one of the common problems that they face: where to buy/sell?
by using trailing resistance you can easily decide and see possible upward movements and understand if you are in a safe zone.
Using Trailing Resistance is just simple:
Go long/ Buy when price crosses above the indicator,
Stay on short position if prices are below the indicator.
The indicator is calculated from previous Lows and doesn't the value won't change until prices makes higher lows.
Multiple Time Frame Version of Trailing Stop Loss Indicator
Trailing Stop Loss Indicator by KıvanÇ fr3762
TRAILING STOP LOSS INDICATOR is a helpful tool for traders to help one of the greatest problems that they face: where to sell?
by using trailing stop loss you can easily decide and see possible downward movements and understand if you are in a safe zone.
Using Trailing Stop Loss is just simple:
Go short/ Sell when price crosses down the indicator,
Stay on long position if prices are above the indicator.
The indicator is calculated from previous Lows and doesn't the value won't change until prices makes higher lows.
DARVAS BOX by KIVANÇ fr3762What Is the Darvas Box?
The Darvas Box strategy was developed by Nicholas Darvas. Aside from being a well known dancer, he began trading stock in the 1950s. Based on his success in trading, he was approached to write a book on his strategy. The book, “How I Made $2,000,000 in the Stock Market,” outlines his rather simple approach … simple once you understand the basic concepts and rationale of the strategy.
Darvas Box is an indicator that simply draws lines along highs and lows, and then adjusts them as new highs and lows form. The indicator is available on many trading platforms, such as Thinkorswim. Traders may wish to draw their own boxes though, based on recent highs and lows; Darvas was able to do so (based on telegram quotes) more than half a century ago.
Darvas Box Rules
I shall not follow advisory services.
I shall be cautious of broker advice.
I shall ignore Wall Street sayings or truisms, no matter how ancient or revered.
I shall only trade stocks on major exchanges with adequate volume .
I shall not listen to (or trade off of) rumors or tips, no matter how well researched they may sound.
I will use a sound strategy instead of gamble…I must study this strategy (originally this approach was fundamental analysis , which didn’t work for him, so he developed his Darvas Box trading method).
I will hold one position for longer, as opposed to juggling a bunch of positions for a short period of time.
Darvas looked for increasing volume when selecting stocks to trade; this alerted him to stocks that were being accumulated and were likely to see strong trends.
Darvas believed in buying stocks that presented an upper box limit breakout, but also had an upward Earnings trend. This was especially the case when the major indexes had experienced a decline.
When an upper box limit is broken, buy. From his book, the entry price was usually about 1 to 2% above the upper box limit.
If you enter a trade and the price proceeds to drop out of the new box, and back into the old box, exit the trade.
Entry and stop loss orders should be set in advance, so trades aren’t missed and risk is controlled.
Place, and trail the stop loss order to below the low of the most recent box. This initial stop loss was pretty tight, because Darvas assumed when a price broke out of an old box, it was entering a new box. Therefore, the stop was placed just below the high of old box which was just broken (low of new box).
Record trades, including reasons why you entered and exited.
General conditions of the market must favor buying. Don’t buy stocks when the major indexes are in a bear market, or when volume is flat or declining.
If you are stopped out, but the price moves back into the higher box again providing another buy signal, buy again, using the same stop loss location.
Since the stop is being trailed up, more funds can be added on each consecutive breakout.
The Bottom Line
Nicholas Darvas was a dancer, but committed a great deal of time to developing and then mastering his stock trading method. It’s a trend following method based on breakouts to higher boxes. Risk is controlled by placing a stop below new higher boxes as they form. During choppy conditions the strategy won’t be profitable. This is why Darvas also attempted to only trade stocks with increasing volume and rising Earnings . Trading his method requires a lot of discipline, but can produce big profits when strong trends develop.
source: traderhq.com
Creator: Nicholas DARVAS

Donchian Channel Width The Donchian Channel was developed by Richard Donchian and it could be compared
to the Bollinger Bands. When it comes to volatility analysis, the Donchian Channel
Width was created in the same way as the Bollinger Bandwidth technical indicator was.
As was mentioned above the Donchian Channel Width is used in technical analysis to measure
volatility. Volatility is one of the most important parameters in technical analysis.
A price trend is not just about a price change. It is also about volume traded during this
price change and volatility of a this price change. When a technical analyst focuses his/her
attention solely on price analysis by ignoring volume and volatility, he/she only sees a part
of a complete picture only. This could lead to a situation when a trader may miss something and
lose money. Lets take a look at a simple example how volatility may help a trader:
Most of the price based technical indicators are lagging indicators.
When price moves on low volatility, it takes time for a price trend to change its direction and
it could be ok to have some lag in an indicator.
When price moves on high volatility, a price trend changes its direction faster and stronger.
An indicator's lag acceptable under low volatility could be financially suicidal now - Buy/Sell signals could be generated when it is already too late.
Another use of volatility - very popular one - it is to adapt a stop loss strategy to it:
Smaller stop-loss recommended in low volatility periods. If it is not done, a stop-loss could
be generated when it is too late.
Bigger stop-loss recommended in high volatility periods. If it is not done, a stop-loss could
be triggered too often and you may miss good trades.

ATR Daily & Weekly With Stop Buffer this script shows Daily & Weekly ATR and also add 10% Stop buffer calculation so you can add stop loss.

ORB Pro - NY Opening Range Breakout by Elev8+ORB Pro - NY Opening Range Breakout | Smart Support & Resistance
ORB Pro is a comprehensive, professional-grade toolkit designed for intraday traders who rely on the Opening Range Breakout (ORB) strategy.
Unlike standard ORB indicators that simply draw lines, this suite offers a complete dashboard-driven system that monitors four distinct sessions simultaneously, providing real-time status updates and precision alerts.
— — —
🎯 What is the Opening Range Breakout (ORB)?
The Opening Range is the price range established during the first period of the trading session (e.g., the first 15 or 30 minutes). This period represents the initial balance between buyers and sellers. A breakout from this range often signals the likely trend direction for the remainder of the session.
— — —
🚀 Key Features
1. Multi-ORB Monitoring
Stop switching settings constantly. This suite monitors four key ranges at once:
Pre-Market 15m (08:00 – 08:15 ET)
Pre-Market 30m (08:00 – 08:30 ET)
NY Cash Open 15m (09:30 – 09:45 ET)
NY Cash Open 30m (09:30 – 10:00 ET)
2. Smart Status Dashboard
A compact panel in the bottom-right corner gives you the live state of every session:
⏳ Waiting: The session has not started yet.
⚡ Forming: The range is currently being built.
↔️ Range: The range has formed, but price is still contained within the range.
🚀 BULL / 📉 BEAR: A confirmed breakout has occurred.
⛔ OFF: The session is disabled in settings.
3. "Dynamic Resolution" Technology
This is a unique pro feature.
Precision: The script always calculates the High/Low levels using 1-minute data , ensuring your support/resistance lines are pixel-perfect regardless of your chart timeframe.
Flexibility: Breakout signals (Alerts/Labels) are triggered based on your current chart timeframe. This allows you to trade a 5m or 15m breakout strategy while keeping 1m-level precision on your levels.
4. Visual Clarity
Breakout Labels: Automatically plots "BULL" or "BEAR" labels on the exact candle that confirms a breakout.
Profit Targets: Optional toggle to show 1x and 2x profit targets projected from the breakout level.
Time-Bound Signals: Signals are strictly time-bound to the active window to prevent late, low-quality alerts.
— — —
🛠️ How to Use
Add to Chart: Works best on intraday timeframes (1m, 5m, 15m).
Configure: Enable the sessions you trade (e.g., NY 15m) in the settings.
Wait for Forming: Watch the box form live. The dashboard will show "⚡ Forming".
Trade the Break: Wait for a candle Close outside the range. The dashboard will flip to "BULL" or "BEAR" and a label will appear.
Manage Risk: Use the opposite side of the range or the midline as your stop loss.
— — —
⚙️ Settings Overview
Global Settings: Toggle forming boxes, dashboard, and label visibility.
Breakout Method: Choose between Close (safer) or Wick (aggressive) for signal triggers.
Session Groups: Individually enable/disable the 4 distinct sessions and customize their colors/styles.
— — —
📝 Update Notes (Recent)
New PDH/PDL Levels: Added the ability to display Previous Day High and Previous Day Low lines on the chart.
Auto-Update & Cleanup: The PDH/PDL lines now automatically update daily and erase historical lines, ensuring only the current day's levels are visible to keep the chart clean.
Dashboard Positioning: Added a new setting to move the Status Dashboard to any corner of the screen.
Enhanced Customization: Added full styling options in settings for PDH/PDL lines and Dashboard positioning.
— — —
Disclaimer: This tool is for educational and analytical purposes only. Past performance of a strategy does not guarantee future results. Always manage your risk.

Fixed $200 Risk Futures Position Sizer (2R Target)This indicator is designed for traders who want to follow a strict, professional-style risk model identical to the rules used in funded futures trading programs. Instead of risking a percentage of the account, the indicator always risks a fixed $200 per trade, regardless of contract or market volatility. This allows traders to simulate evaluation accounts and maintain perfect risk discipline.
The tool works across a wide range of futures markets — including micro, mini, and continuous contracts (MES, MNQ, MNQ1!, MYM, M2K, MCL, MGC, ES1!, NQ1!, GC1!) — and automatically loads the correct tick size and tick value for each contract. This ensures that stop distance and risk calculations are always accurate, even when switching between index futures, metals, or energy markets.
You simply enter your Entry Price and Stop Loss Price, and the indicator calculates:
The stop distance in points and ticks
The exact dollar risk per contract
The maximum number of contracts allowed while staying under a fixed $200 risk
A fully automated 2R take-profit target (equivalent to $400 profit per trade)
Expected profit per contract
Total projected profit based on allowed size
Full long/short direction detection
This makes position sizing effortless and completely rule-based. If the chosen stop-loss distance requires more than $200 of risk per contract, the indicator will automatically show 0 contracts allowed, preventing invalid trades and helping maintain consistency.
For clarity and execution, the indicator also plots:
A green Entry Line
A red Stop-Loss Line
A blue 2R Take-Profit Line
This produces a visual, easy-to-understand risk-to-reward layout directly on the chart.
This tool is ideal for traders preparing for funded account challenges, traders practicing mechanical risk systems, or anyone who wants to enforce a strict, repeatable risk framework. It eliminates guesswork, improves consistency, and helps traders build discipline by sizing every trade according to a fixed dollar risk with a precise 2R reward objective.

Equal Highs & Lows Strategy // ------------------------------------------------------------------------------
// 🧠 THE MARKET PSYCHOLOGY (WHY THIS WORKS):
// ------------------------------------------------------------------------------
// 1. THE MAGNET THEORY:
// "Equal Highs" (EQH) and "Equal Lows" (EQL) are not random. They represent
// Retail Support and Resistance. Retail traders are taught to put Stop Losses
// just above Double Tops or just below Double Bottoms.
// - Therefore, these lines represent massive pools of LIQUIDITY (Money).
// - Price is often engineered to move toward these lines to "unlock" that money.
//
// 2. THE INSTITUTIONAL TRAP (STOP HUNTS):
// Institutions need liquidity to fill large orders without slippage.
// - To Buy massive amounts, they need many Sellers -> They push price BELOW EQL
// to trigger retail Sell Stops.
// - To Sell massive amounts, they need many Buyers -> They push price ABOVE EQH
// to trigger retail Buy Stops.
//
// 3. THE STRATEGY (TURTLE SOUP):
// We do not trade the initial touch. We wait for the "Sweep & Reclaim".
// - Bullish Signal (GRAB ⬆): Price drops below the Green Line (EQL), grabs the
// stops, but buyers step in and force the candle to CLOSE back above the line.
// - Bearish Signal (GRAB ⬇): Price spikes above the Red Line (EQH), grabs the
// stops, but sellers step in and force the candle to CLOSE back below the line.
// ------------------------------------------------------------------------------

Price Volume Heatmap [MHA Finverse]Price Volume Heatmap - Advanced Volume Profile Analysis
Unlock the power of institutional-level volume analysis with the Price Volume Heatmap indicator. This sophisticated tool visualizes market structure through volume distribution across price levels, helping you identify key support/resistance zones, high-probability reversal areas, and optimal entry/exit points.
🎯 What Makes This Indicator Unique?
Unlike traditional volume indicators that only show volume over time, this heatmap displays volume distribution across price levels , revealing where the most significant trading activity occurred. The gradient coloring system instantly highlights high-volume nodes (areas of strong interest) and low-volume nodes (potential breakout zones).
📊 Core Features
1. Dynamic Volume Heatmap
- Visualizes volume concentration across 250 customizable price levels
- Gradient color scheme from high volume (white) to low volume (teal/green)
- Adjustable brightness multiplier for enhanced contrast and clarity
- Real-time updates as market conditions evolve
2. Point of Control (POC)
- Automatically identifies the price level with the highest traded volume
- Acts as a magnetic price level where markets often return
- Critical for identifying fair value areas and potential reversal zones
- Customizable line style, width, and color
3. Flexible Lookback Settings
- Lookback Bars: Set any value from 1-5000 bars to control analysis depth
- Visible Range Mode: Analyze only what's currently visible on your chart
- Timeframe-Specific Settings: Different lookback periods for 1m, 5m, 15m, 30m, 1h, Daily, and Weekly charts
- Adapts to your trading style - scalping to position trading
4. Session Separation Analysis
- Tokyo Session: 00:00-09:00 UTC
- London Session: 07:00-16:00 UTC
- New York Session: 13:00-22:00 UTC
- Sydney Session: 21:00-06:00 UTC
- Daily Reset: Analyze each trading day independently
Session separation allows you to understand volume distribution specific to each major trading session, revealing institutional order flow patterns and session-specific support/resistance levels.
5. Profile Width Options
- Dynamic: Profile width adjusts based on lookback period
- Fixed Bars: Set a specific bar count for consistent profile width
- Extend Forward: Project the profile into future bars for planning trades
6. Smart Alerts
- POC crossover/crossunder alerts
- New session start notifications
- Never miss critical price action at high-volume nodes
📈 How to Use This Indicator Professionally
Understanding Market Structure:
High Volume Nodes (HVN):
- Appear as bright/white areas in the heatmap
- Represent price levels where significant trading occurred
- Act as strong support/resistance zones
- Markets often consolidate or bounce from these levels
- Trading Strategy: Look for entries when price tests HVN areas with confluence from other indicators
Low Volume Nodes (LVN):
- Appear as darker/teal areas in the heatmap
- Represent price levels with minimal trading activity
- Price tends to move quickly through these areas
- Often form "gaps" in the volume profile
- Trading Strategy: Expect rapid price movement through LVN zones; avoid placing stop losses here
Point of Control (POC):
- The single most important price level in your analysis window
- Represents the fairest price where maximum volume traded
- Price gravitates toward POC like a magnet
- Trading Strategy:
* When price is above POC: bullish bias, POC acts as support
* When price is below POC: bearish bias, POC acts as resistance
* POC breaks often lead to significant trend changes
Session-Based Analysis:
Use session separation to understand how different market participants trade:
Asian Session (Tokyo/Sydney):
- Typically lower volatility and range-bound
- Volume profiles often show tight, balanced distribution
- Use for identifying overnight ranges and gap fill zones
London Session:
- Highest volume session for forex pairs
- Often shows strong directional bias
- Look for breakouts from Asian ranges during London open
New York Session:
- Maximum participation when overlapping with London
- Institutional order flow most visible
- POC during NY session often becomes key level for following sessions
🎯 Practical Trading Applications
1. Identifying Support & Resistance:
High volume nodes from the heatmap are far more reliable than traditional swing highs/lows. When price approaches an HVN, expect reaction - either a bounce or a significant breakout if breached.
2. Trend Confirmation:
- Healthy uptrend: POC rising over time, HVN forming at higher levels
- Healthy downtrend: POC falling over time, HVN forming at lower levels
- Consolidation: POC relatively flat, volume balanced across range
3. Breakout Trading:
When price breaks through a Low Volume Node with momentum, it often continues to the next High Volume Node. Use LVN areas as measured move targets.
4. Reversal Zones:
Multiple HVN stacking on top of each other creates a "volume shelf" - an extremely strong support/resistance zone where reversals are highly probable.
5. Risk Management:
- Place stops beyond HVN areas (not within LVN zones)
- Size positions based on distance to nearest HVN
- Use POC as trailing stop level in trending markets
⚙️ Recommended Settings
For Day Trading (Scalping/Intraday):
- Lookback: 200-500 bars
- Rows: 200-250
- Enable session separation for your primary trading session
- Profile Width: Dynamic or Fixed Bars (30-50)
For Swing Trading:
- Lookback: 500-1000 bars
- Rows: 250
- Session separation: Daily Reset
- Profile Width: Dynamic
For Position Trading:
- Lookback: 1000-3000 bars
- Rows: 250
- Use timeframe-specific settings
- Profile Width: Extend Forward (20-50 bars)
💡 Pro Tips
1. Combine this indicator with price action analysis - volume confirms what price is telling you
2. Watch for POC convergence with other technical levels (fibonacci, pivot points, moving averages)
3. Volume at extremes (tops/bottoms of heatmap) often indicates exhaustion
4. Session POC from previous sessions often acts as magnet for current session
5. Increase brightness multiplier (1.5-2.5) for clearer visualization on busy charts
6. Use "Number of Sessions to Display" to analyze consistency of volume levels across multiple sessions
🎨 Customization
Fully customizable visual appearance:
- Gradient colors for volume visualization
- POC line thickness, color, and style
- Session line colors and visibility
- All settings organized in intuitive groups
⚠️ Disclaimer
This indicator is a technical analysis tool and should not be used as the sole basis for trading decisions. Always combine volume analysis with proper risk management, fundamental analysis, and other technical indicators. Past performance does not guarantee future results.
---
Support & Updates
Regular updates and improvements are made to enhance functionality. For questions, suggestions, or bug reports, please use the comments section below.
Happy Trading! 📊💹

IDWM Master StructureExecutive Summary
The IDWM Master Structure is a Multi-Timeframe (MTF) trading tool designed to force discipline by aligning traders with the "Parent" trend. It functions by locking onto the "Completed Auction" of a higher timeframe candle (like a Daily or Weekly bar) and projecting that structure onto your lower timeframe chart. Its primary goal is to define the "Dealing Range"—the hard boundaries where value was previously established—so you don't get lost in the noise of smaller price movements.
1. The Principle of Completed Auctions (Hierarchy)
Most technical indicators curve dynamically with every price tick. This script acts differently because it relies on "Settled Arguments." A closed Daily candle represents a finished battle between buyers and sellers; the High and Low are the historical results of that battle.
To enforce this, the script automatically selects a "Parent" timeframe based on your view:
Scalping (charts below 15 minutes) uses the 4-Hour Auction.
Intraday trading (15 minutes to 4 Hours) uses the Daily Auction.
Swing trading (Daily chart) uses the Weekly Auction.
2. Liquidity Pools & The Sticky Range
The High and Low lines drawn by the indicator are not just support and resistance; they represent Liquidity Pools. In market theory, stop-losses (Sell Stops below Lows, Buy Stops above Highs) accumulate at these edges.
Smart money often pushes price just past these lines to grab this liquidity (a "Stop Hunt") before reversing direction. To account for this, the script uses a "Sticky Range" mechanism. It refuses to redraw the box simply because price touched the line. Instead, it uses an Average True Range (ATR) Buffer. A new structure is only formed if the candle closes decisively outside the range plus this volatility buffer. This ensures you are trading real breakouts, not liquidity sweeps.
3. Internal Range Mechanics (Premium vs. Discount)
Inside the Master Box, the script applies Equilibrium Theory to help with trade location.
The most important internal line is the Equilibrium (EQ), which marks the exact 50% point of the range.
Premium Zone (Above EQ): Price is mathematically "expensive" relative to the recent range. Algorithms generally look to establish Short positions here.
Discount Zone (Below EQ): Price is considered "cheap." Algorithms generally look to establish Long positions here.
It also plots the Master Open, which acts as a "Line in the Sand." If price is currently trading above the Master Open, the higher timeframe candle is Green (Bullish), suggesting longs have a higher probability. If below, the candle is Red (Bearish).
4. Wick Theory (Failed Auctions)
The script places special emphasis on the wicks of the Master Candle because a wick represents a "Failed Auction"—a price level the market tried to explore but ultimately rejected.
The indicator highlights the background of the wick area (from the High to the Body). On a retest, these zones often act as supply or demand blocks because the market remembers the previous failure.
It also calculates the "Consequent Encroachment," which is the 50% midpoint of the wick. The rule of thumb here is that if a candle body can close past 50% of a wick, the rejection is nullified, and price will likely travel to fill the entire wick.
5. Energy Expansion (Breakout Targets)
Market energy transfers from Consolidation (inside the box) to Expansion (the breakout). When the price finally breaks the "Sticky Range" (confirming via the ATR buffer), the script projects where that energy will go.
It uses the height of the previous range to calculate Fibonacci extensions. Specifically, it targets the 1.618 Extension, often called the "Golden Ratio." This is a statistically significant level where expansion moves tend to exhaust themselves and reverse.
6. Safety Protocol: Live Detection
A dashboard monitors the state of the parent candle. If the text turns Magenta with a warning symbol, it means the Higher Timeframe candle is "Live" (still forming).
Trading off a live structure is considered higher risk because the "Auction" isn't finished—the High or Low can still shift. The safest approach is to trade when the dashboard indicates a standard, locked, historical structure.

The Alchemist's Trend [wjdtks255]📊 The Alchemist's Trend - Filtered Trading Guide
This indicator, named The Alchemist's Trend, is a High-Confidence Trend-Following Strategy designed to maximize reliability. It generates a final entry signal only when the QQE (Quantitative Qualitative Estimation) momentum signal is validated by four robust filters: Long-Term Trend (MA200), Mid-Term Trend (HMA), Momentum Strength (CCI), and Higher Timeframe (HTF) Trend.
1. Indicator Mechanism and Core Components
A. Chart Visualization and Trend Identification
Trend Line (HMA): Appears as a Yellow or Purple Thick Line. It represents the direction of the current short/mid-term market trend. Candle colors follow this line.
MA 200: Appears as a Dotted Line (color configurable in settings). It is the Long-Term Trend Line. Price above it suggests a long-term bullish view; below it, a long-term bearish view.
Candle Background: Appears as Light Yellow or Purple. It matches the Trend Line direction, providing a visual cue of the trend's strength.
B. The Four-Filter System
For a confirmed entry signal ('L' or 'S') to fire, the following four conditions must all align in the same direction:
QQE (Momentum Base): Generates the primary Long/Short crossover signal.
MA & HMA (Trend Alignment):
For Long Entries: Price must be above both the MA200 and the HMA Trend Line.
For Short Entries: Price must be below both the MA200 and the HMA Trend Line.
CCI (Momentum Strengthening):
For Long Entries: CCI value must be above +50. (Confirms strong buying momentum)
For Short Entries: CCI value must be below -50. (Confirms strong selling momentum)
HTF (Higher Timeframe Trend): Checks if the price on the set higher timeframe (default 4H) is above its own Trend Line, confirming alignment with the broader market direction.
2. Trading Strategy and Usage Rules
This indicator aims to maximize signal reliability over frequency.
🔔 Entry Rule
Enter a trade only when the 'L' or 'S' label appears on the chart AND the Action panel on the dashboard displays LONG SIGNAL or SHORT SIGNAL.
Long Entry (L):
Condition: 'L' label appears (All Long conditions met).
Verification: Confirm the Trend Line and candle color are in the yellow range.
Short Entry (S):
Condition: 'S' label appears (All Short conditions met).
Verification: Confirm the Trend Line and candle color are in the purple range.
🛡️ Risk and Position Management
Stop-Loss (SL): A common practice is to place the Stop-Loss below the low of the signal candle (for Long) or above the high of the signal candle (for Short), or beyond a recent significant support/resistance level.
Exit Strategy (Three Options):
Opposite Signal: Close the position immediately if the opposite signal ('S' during a Long, or 'L' during a Short) occurs.
RSI Extremes: Consider taking partial profits if the RSI reaches 70 (for Long) or 30 (for Short), indicating potential exhaustion.
Trend Line Crossover: Exit the position if the price breaks or crosses the Trend Line, causing the candle color to change.
🖥️ Dashboard Utilization Tips
The dashboard provides contextual information to validate the signal:
RSI: Signals occurring within the neutral 30-70 zone suggest a stronger developing trend. If near 70/30, consider the risk of reversal.
Vol Status ('High'): If the volume status is 'High' when the signal fires, the signal's power is likely high, indicating a higher probability of significant movement.
Day High/Low: Use these values as a secondary reference for setting initial Stop-Loss or Take-Profit targets.

able zone# able zone
## 📋 Overview
**able zone** is an advanced Support & Resistance zone detection indicator optimized for **15-minute timeframe trading**. It combines Price Action, Volume Profile, and intelligent zone analysis to identify high-probability trading areas with precise entry and exit points.
## 🎯 Core Features
### 1. **Zone Detection Methods**
- **Auto Detect**: Automatically finds the best zones using combined analysis
- **Price Action**: Based on pivot points and price structure
- **Volume Profile**: Identifies High Volume Nodes (HVN) where most trading occurred
- **Combined**: Uses all methods together for comprehensive analysis
### 2. **Zone Types & Colors**
- 🟢 **Support Zones** (Green): Price tends to bounce up from these areas
- 🔴 **Resistance Zones** (Red): Price tends to reverse down from these areas
- 🟣 **HVN Zones** (Purple): High volume areas from Volume Profile
- **Strong Zones**: Darker colors indicate zones with more touches (higher reliability)
### 3. **Zone Strength Indicators**
- **Labels**: "S3" = Support with 3 touches, "R5" = Resistance with 5 touches
- **Touch Count**: More touches = stronger zone
- **Min Touch Count Setting**: Adjust to filter weak zones (default: 3)
## ⚙️ Settings Guide
### **Zone Detection Settings**
- **Detection Method**: Choose your preferred analysis method
- **Lookback Period** (50-500): How many bars to analyze (default: 200)
- For 15min: 200 bars = ~50 hours of data
- Shorter = Recent zones only
- Longer = Historical zones included
- **Min Touch Count** (2-10): Minimum touches to qualify as a zone (default: 3)
- **Zone Thickness %** (0.1-2.0): How thick the zones appear (default: 0.5)
- Based on ATR for dynamic sizing on 15min chart
### **Zone Colors**
Fully customizable colors for:
- Support Zone (default: Green)
- Resistance Zone (default: Red)
- Strong Support/Resistance (darker shades)
- Volume Profile Zone (default: Purple)
### **Zone Touch Detection**
- **Enable Touch Alerts**: Get notifications when price enters zones
- **Touch Distance %** (0.1-1.0): How close to zone counts as "touch" (default: 0.3%)
- On 15min chart, this gives early warning signals
- **Show Touch Markers**: Visual indicators when price touches zones
- 🔺 = Support touch (potential buy)
- 🔻 = Resistance touch (potential sell)
- 💎 = HVN touch (watch for breakout/rejection)
### **Volume Profile Integration**
- **Show VP Zones**: Display high volume node zones
- **VP Resolution** (20-50): Number of price levels analyzed (default: 30)
- **POC Line** (orange): Point of Control - highest volume price level
- **POC Width**: Line thickness (1-3)
- **Show HVN**: Display High Volume Node zones
- **HVN Threshold** (0.5-0.9): Volume % to qualify as HVN (default: 0.7)
### **Display Options**
- **Zone Labels**: Show S/R labels with touch count
- **Zone Border Lines**: Dotted lines at zone boundaries
- **Extend Zones Right**: Project zones into future
- **Max Visible Zones** (5-50): Maximum number of zones displayed (default: 20)
- Adjust based on chart clarity needs
- **Info Table**: Real-time information dashboard
## 📊 Info Table Explained
The info table (top-right corner) provides real-time zone analysis:
### **Row 1: ZONE Header**
- Shows current timeframe (15m)
- Total active zones
- "able" branding
### **Row 2: 🎯 TOUCH Status**
- **RES**: Currently touching resistance (⚠️ potential reversal down)
- **SUP**: Currently touching support (🚀 potential bounce up)
- **HVN**: Currently in high volume area (⚡ watch for direction)
- **FREE**: Not near any zone (⏳ wait for setup)
- Progress bar shows proximity strength
- Arrows indicate zone type
### **Row 3: 🟢 SUP - Support Zones**
- Number of active support zones below current price
- Progress bar shows relative quantity
- More support = stronger floor
### **Row 4: 🔴 RES - Resistance Zones**
- Number of active resistance zones above current price
- Progress bar shows relative quantity
- More resistance = stronger ceiling
### **Row 5: 🟣 HVN - High Volume Nodes**
- Number of HVN zones (from Volume Profile)
- These are areas where most trading activity occurred
- Often act as magnets for price
### **Row 6: 📍 NEAR - Nearest Zone**
- Shows closest zone type (SUP/RES/HVN)
- Distance in % to nearest zone
- Arrow shows if zone is above or below
### **Row 7: POSITION - Price Position**
- **HIGH**: Price near range top (70%+) - watch for resistance
- **MID**: Price in middle range (30-70%) - neutral zone
- **LOW**: Price near range bottom (<30%) - watch for support
- Shows exact position % in lookback range
### **Row 8: ═ SIGNAL ═**
- **🚀 BUY**: Touching support zone (entry opportunity)
- **⚠️ SELL**: Touching resistance zone (exit/short opportunity)
- **⚡ WATCH**: At HVN (prepare for breakout or rejection)
- **⏳ WAIT**: No clear setup (be patient)
## 🎓 Trading Strategy for 15-Minute Timeframe
### **Basic Setup**
1. Set timeframe to **15 minutes**
2. Use **Auto Detect** or **Combined** method
3. Set **Lookback Period**: 200 bars (~50 hours)
4. Set **Min Touch Count**: 3 (proven zones)
### **Entry Signals**
#### **Long Entry (Buy)**
- Price touches green support zone
- Table shows "🚀 BUY" signal
- Look for bullish candle pattern (hammer, engulfing)
- Volume increases on bounce
- **Best Entry**: Bottom of support zone
- **Stop Loss**: Below support zone (1-2 ATR)
- **Target**: Next resistance zone or 2:1 RR
#### **Short Entry (Sell)**
- Price touches red resistance zone
- Table shows "⚠️ SELL" signal
- Look for bearish candle pattern (shooting star, engulfing)
- Volume increases on rejection
- **Best Entry**: Top of resistance zone
- **Stop Loss**: Above resistance zone (1-2 ATR)
- **Target**: Next support zone or 2:1 RR
#### **HVN Breakout Strategy**
- Price approaches purple HVN zone
- Table shows "⚡ WATCH"
- Wait for breakout with strong volume
- **If breaks up**: Go long, target next resistance
- **If breaks down**: Go short, target next support
### **Zone Strength Rules**
- **S5+ or R5+**: Very strong zones (high probability)
- **S3-S4 or R3-R4**: Reliable zones (good setups)
- **S2 or R2**: Weak zones (use caution)
### **Best Trading Times (15min)**
- **London Open**: 08:00-12:00 GMT (high volume)
- **NY Open**: 13:00-17:00 GMT (high volatility)
- **Overlap**: 13:00-16:00 GMT (best setups)
- **Avoid**: Asian session low volatility periods
### **Risk Management**
- Never risk more than 1-2% per trade
- Use stop loss ALWAYS (place outside zones)
- Take partial profits at 1:1, let rest run to 2:1 or 3:1
- If price consolidates in zone > 3 candles, exit
## ⚠️ Important Notes
### **When Zones Work Best**
✅ Clear trending markets
✅ After significant price movements
✅ At session opens (London/NY)
✅ When multiple zones align
✅ Strong zone with 5+ touches
### **When to Be Cautious**
❌ During major news releases (use economic calendar)
❌ Very low volume periods
❌ Price consolidating inside zone
❌ Weak zones with only 2 touches
❌ Conflicting signals from multiple indicators
### **15-Minute Specific Tips**
- **Lookback 200**: Captures 2-3 trading days of zones
- **Touch Distance 0.3%**: Early signals on 15min moves
- **Max Zones 20**: Keeps chart clean but comprehensive
- **Watch POC**: Often acts as pivot on 15min
- **Volume spike + zone touch** = high probability setup
## 🔧 Recommended Settings for 15min
### **Conservative Trader**
- Detection Method: Combined
- Min Touch Count: 4
- Max Zones: 15
- Touch Distance: 0.2%
### **Aggressive Trader**
- Detection Method: Auto Detect
- Min Touch Count: 2
- Max Zones: 25
- Touch Distance: 0.5%
### **Volume Profile Focused**
- Detection Method: Volume Profile
- Show HVN: Yes
- HVN Threshold: 0.6
- Show POC: Yes
## 📈 Example Trade Scenario (15min)
**Setup**: BTC/USD on 15-minute chart
1. Price approaching green support zone at $42,000
2. Zone label shows "S4" (touched 4 times)
3. Table shows "🚀 BUY" signal
4. Volume increasing on approach
5. Bullish hammer candle forms
**Entry**: $42,050 (bottom of zone)
**Stop Loss**: $41,900 (below zone)
**Target 1**: $42,350 (2:1 RR)
**Target 2**: Next resistance at $42,650
**Result**: Price bounces, hits Target 1 in 3 candles (~45min)
## 💡 Pro Tips
1. **Combine with trend**: Trade in direction of higher timeframe trend
2. **Multiple touches**: Zones with 5+ touches are highest probability
3. **Volume confirmation**: Always check volume on zone touch
4. **POC magnet**: Price often returns to POC line
5. **False breakouts**: If price barely breaks zone and returns = strong signal
6. **Zone-to-zone**: Trade from support to resistance, resistance to support
7. **Time of day**: Best setups occur during peak volume hours
8. **Chart timeframe**: Use 1H to confirm trend, 15min for entry
9. **News avoidance**: Close trades before high-impact news
10. **Zone clusters**: Multiple zones together = strong area
---
**Created by able** | Optimized for 15-minute trading
**Version**: 1.0 | Compatible with TradingView Pine Script v5
For support and updates, enable alerts and monitor the info table in real-time!

Futures Dollar Profit Target VisualizerFutures Profit Target Visualizer
A simple visual tool that shows exactly where price needs to go to hit your dollar profit target (and stop loss) — ideal for prop traders managing daily drawdown limits.
━━━━━━━━━━━━━━━━━━━━━━━━━━━━━━━━━━━━━━
HOW IT WORKS
Enter your target profit in dollars, and the indicator draws lines showing:
• Green line — Your take profit level
• Red line — Your stop loss level
• Blue line — Your entry (current price)
It auto-detects the futures contract you're viewing (NQ, ES, MNQ, MES, etc.) and calculates the correct point value automatically.
━━━━━━━━━━━━━━━━━━━━━━━━━━━━━━━━━━━━━━
WHY IT'S USEFUL FOR PROP TRADERS
If your prop firm allows a $500 daily drawdown and you want to risk $100 per trade with a 1:1 R:R, just enter:
• Target Profit: $100
• Risk:Reward: 1
The indicator instantly shows you the exact price levels — no mental math needed.
━━━━━━━━━━━━━━━━━━━━━━━━━━━━━━━━━━━━━━
KEY FEATURES
• Auto-detects contract type (NQ, ES, MNQ, MES, CL, GC, and more)
• Separate inputs for Mini and Micro contract quantities — switch between charts and it automatically uses the right position size
• Supports Long and Short trades
• Adjustable Risk:Reward ratio
• Labels show price, dollar amount, and points to target
• Lines are offset to the right so they don't affect chart auto-scaling
━━━━━━━━━━━━━━━━━━━━━━━━━━━━━━━━━━━━━━
SETTINGS
Profit Settings:
• Target Profit ($) — Your desired profit in dollars
• Risk:Reward Ratio — e.g., 1 = equal risk/reward, 2 = target is 2x your stop
• Mini Contracts — Position size when viewing mini contracts (NQ, ES, etc.)
• Micro Contracts — Position size when viewing micro contracts (MNQ, MES, etc.)
Trade Settings:
• Trade Direction — Long or Short
• Entry Price — Leave at 0 to use current price, or set a specific entry
Display:
• Show Price Labels — Toggle the price/profit labels
• Show Fill — Toggle the shaded zones between entry and target/stop
• Line Offset — Push lines further right (helps avoid auto-scale issues)
• Line Length — How long the lines extend
• Colors — Customize target, stop, and entry line colors
━━━━━━━━━━━━━━━━━━━━━━━━━━━━━━━━━━━━━━
SUPPORTED CONTRACTS
Equity Index: NQ, ES, YM, RTY + Micros (MNQ, MES, MYM, M2K)
Energy: CL, MCL, NG
Metals: GC, MGC, SI, SIL
Treasuries: ZB, ZN, ZF, ZT
Currencies: 6E, 6J, 6B, 6A, 6C
Ags: ZC, ZS, ZW
If your contract isn't listed, use "Custom" and enter the tick value manually.
━━━━━━━━━━━━━━━━━━━━━━━━━━━━━━━━━━━━━━
EXAMPLE
You trade MNQ with 5 contracts and want to make $100:
• Set Micro Contracts: 5
• Set Target Profit: $100
• MNQ = $2/point × 5 contracts = $10/point
• Indicator shows target 10 points above entry
Switch to NQ with 1 contract:
• Set Mini Contracts: 1
• Same $100 target
• NQ = $20/point × 1 contract = $20/point
• Indicator shows target 5 points above entry
No need to change settings when switching charts — it adjusts automatically.

Bull Flag & Flat Top Breakout DetectorBull Flag & Flat Top Detector - Quick Reference Guide
Pattern Overview
🚩 Bull Flag
╱╲
╱ ╲ ← Pullback (2-5 red candles)
╱ ╲
╱ ╲____
╱ ╲
│ │
│ THE POLE │ ← Strong upward move (3+ green candles)
│ │
└──────────────┘
What to look for:
Strong initial move (the "pole") - 3+ green candles, 3%+ move
Brief pullback - 2-5 candles, less than 50% retracement
Pullback should "drift" lower, not crash
Entry on first candle to make new high after pullback
📊 Flat Top Breakout
════════════════ ← Resistance (multiple touches)
↑ ↑ ↑
╱╲ ╱╲ ╱╲
╱ ╲╱ ╲╱ ╲ ← Consolidation
╱ ╲
╱ ╲
What to look for:
Multiple touches of same resistance level (2+)
Tight consolidation range
Each failed breakout builds pressure
Entry on convincing break above resistance with volume
Signal Types
SignalShapeColorMeaningBull Flag Breakout▲ TriangleLimeEntry signal - go longFlat Top Breakout◆ DiamondAquaEntry signal - go longBear Flag Breakout▼ TriangleRedShort entry (if enabled)Pattern Forming🚩 FlagFaded GreenBull flag developingPattern Forming■ SquareFaded BlueFlat top developing
Level Lines Explained
LineColorStyleMeaningEntryLimeSolidBreakout trigger priceStop LossRedDashedExit if price falls hereTarget 1AquaDottedFirst profit target (2R)Target 2YellowDottedSecond profit target (3R)
Info Table Reference
FieldWhat It ShowsBull FlagScanning / Forming 🚩 / Breakout ✓Flat TopScanning / Forming 📊 / Breakout ✓PullbackCandle count + retracement %Rel VolumeCurrent bar vs averageEMA 20Above ✓ or Below ✗VWAPAbove ✓ or Below ✗Green StreakConsecutive green candles (pole)ResistanceTouch count for flat top
Trading Checklist
Before Entry ✅
Pattern status shows "FORMING" or "BREAKOUT"
Price above EMA (table shows ✓)
Price above VWAP (table shows ✓)
Relative volume 1.5x+ (ideally 2x+)
Stock is in play (up 5%+ on day, has catalyst)
Market direction supportive (not fighting trend)
Entry Execution
Wait for breakout candle to form
Confirm volume spike on breakout
Enter as close to entry line as possible
Set stop loss at red dashed line
Know your target levels
Trade Management
If no immediate follow-through → consider exit ("breakout or bailout")
Take 50% off at Target 1
Move stop to breakeven
Let remainder run toward Target 2
Exit fully if price returns below entry
Bull Flag Quality Checklist
Pole Quality:
FactorIdealAcceptableAvoidGreen candles5+3-4Less than 3Move size10%+3-10%Less than 3%VolumeIncreasingSteadyDecliningCandle bodiesLargeMediumSmall/doji
Pullback Quality:
FactorIdealAcceptableAvoidCandle count2-34-56+RetracementUnder 38%38-50%Over 50%VolumeDecliningSteadyIncreasingCharacterOrderly driftChoppySharp drop
Flat Top Quality Checklist
FactorGood SetupWeak SetupTouches3+ at same levelOnly 2, widely spacedToleranceVery tight (0.2%)Loose (1%+)Duration5-15 barsToo short or too longVolumeDrying upErraticPrior trendUpSideways/down
Common Mistakes to Avoid
❌ Entering too early
Wait for actual breakout, not anticipation
"Forming" ≠ "Breakout"
❌ Ignoring volume
No volume = likely false breakout
Require 1.5x+ relative volume minimum
❌ Fighting the trend
Check EMA and VWAP status
Both should be ✓ for high probability
❌ Wide stops
Stop should be below pullback low
If stop is too wide, skip the trade
❌ Holding losers
"Breakout or bailout" - if it doesn't work, exit
Failed breakouts often reverse hard
❌ Chasing extended moves
If you missed entry, wait for next pattern
Don't chase 5+ candles after breakout
Risk Management Rules
Position Sizing
Risk Amount = Account × Risk % (typically 1-2%)
Position Size = Risk Amount ÷ (Entry - Stop)
Example:
Account: $25,000
Risk: 1% = $250
Entry: $5.00
Stop: $4.70
Risk per share: $0.30
Position Size: $250 ÷ $0.30 = 833 shares
Risk-Reward Targets
TargetR MultipleExample (risk $0.30)Target 12:1+$0.60 ($5.60)Target 23:1+$0.90 ($5.90)
Timeframe Guide
TimeframeProsConsBest For1-minMore patterns, precise entryNoisy, false signalsScalping5-minGood balance, cleaner patternsFewer signalsDay trading15-minHigh quality patternsMiss fast movesSwing entries
Settings Quick Reference
Default Settings (Balanced)
Pole: 3 candles, 3% move
Pullback: 2-5 candles, 50% max retrace
Volume: 1.5x required
Filters: EMA + VWAP ON
Aggressive Settings
Pole: 2 candles, 2% move
Pullback: 2-6 candles, 60% max retrace
Volume: 1.2x required
Filters: VWAP OFF
Conservative Settings
Pole: 4 candles, 5% move
Pullback: 2-4 candles, 40% max retrace
Volume: 2.0x required
Filters: Both ON
Alert Setup
Recommended Alerts
"Bull Flag Forming"
Get early warning as pattern develops
Prepare your position size and levels
"Bull Flag Breakout"
Primary entry alert
React quickly when triggered
"Any Bullish Breakout"
Catch both bull flags and flat tops
Good for watchlist scanning
Alert Setup Steps
Right-click chart → Add Alert
Condition: Select "Bull Flag & Flat Top Breakout Detector"
Choose alert type from dropdown
Set expiration and notification method
Troubleshooting
Q: Patterns not detecting?
Lower the Min Pole Move % setting
Reduce Min Pole Candles requirement
Check that price is in acceptable range
Q: Too many false signals?
Increase volume multiplier to 2.0x
Enable both EMA and VWAP filters
Increase Min Pole Move %
Q: Levels not showing?
Enable "Show Entry Line", "Show Stop Loss", "Show Targets"
Check "Max Patterns to Display" setting
Q: Info table not visible?
Enable "Show Info Table" in settings
Try different table position
Pattern Combinations
Best Setups (A+ Quality)
Bull flag on a gap day (Gap & Go → Bull Flag)
Flat top at pre-market high resistance
Pattern forming above VWAP with 5x+ volume
Avoid These
Bull flag below VWAP
Flat top in downtrending stock
Low volume patterns
Patterns late in the day (after 2pm)
Daily Routine
Pre-Market (7-9am)
Build watchlist of gappers (5%+, high volume)
Apply indicator to top 3-5 candidates
Note pre-market levels
Market Open (9:30-10:30am)
Watch for "FORMING" status on watchlist
Prepare entries as patterns develop
Execute on breakout signals
Manage trades according to plan
Midday (10:30am-2pm)
Look for second-wave patterns
Be more selective (less momentum)
Consider tighter stops
Close (2-4pm)
Generally avoid new patterns
Manage existing positions
Review day's trades

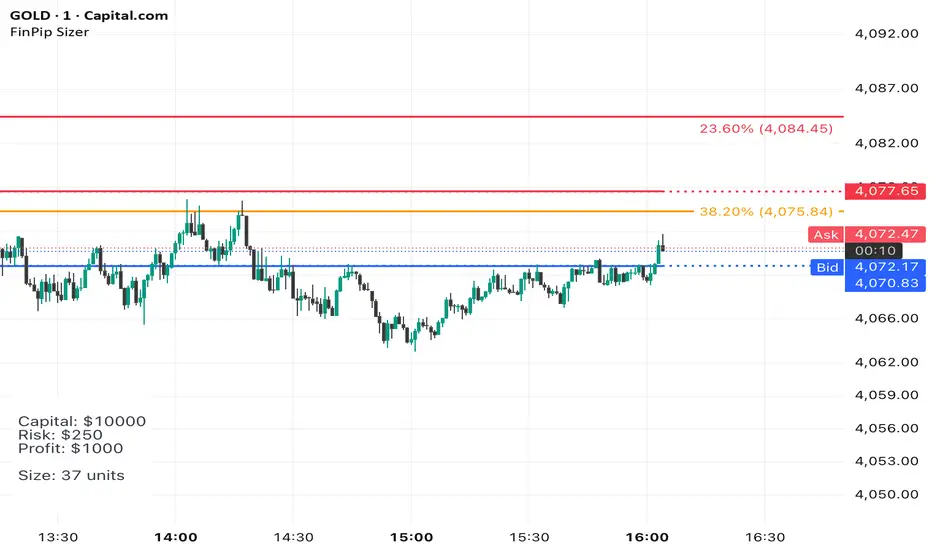
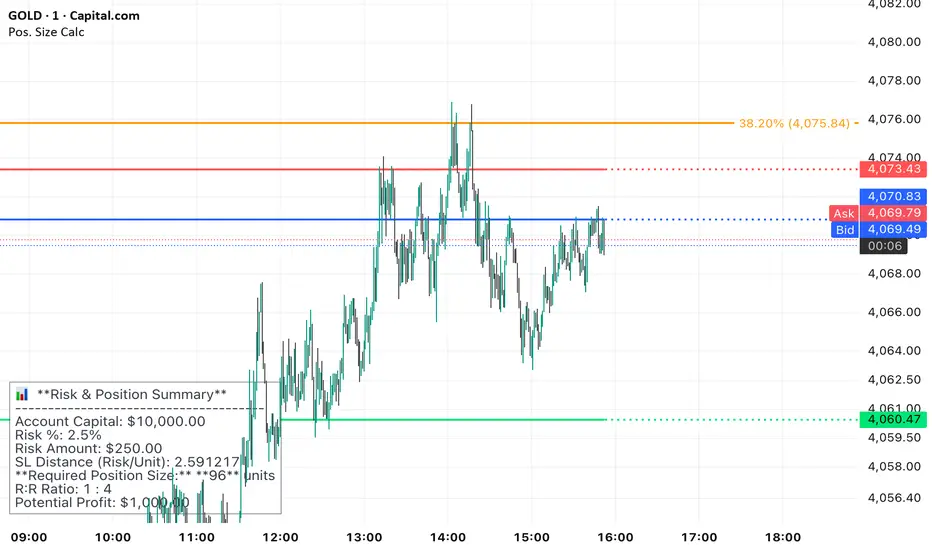
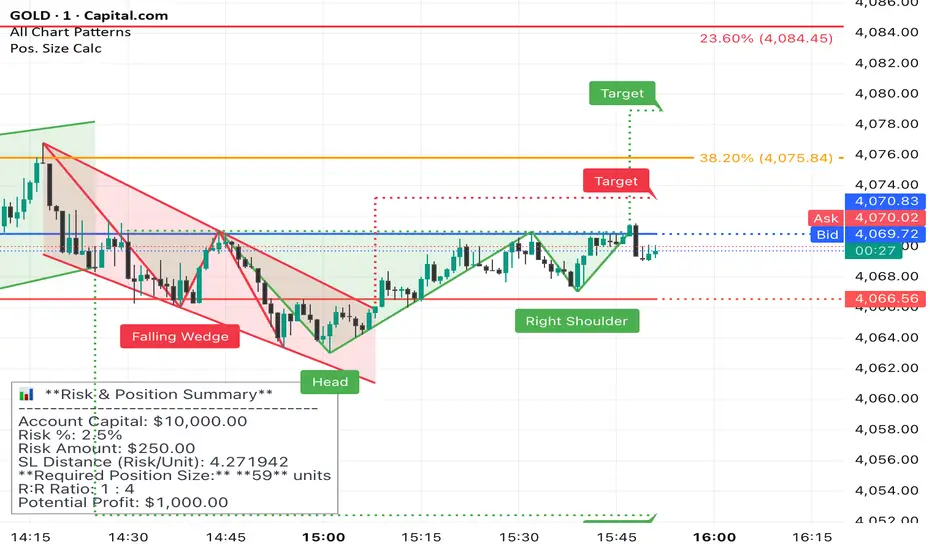
Position Sizer (FinPip)Position Sizer (FinPip)
The Position Sizer (FinPip) indicator is a crucial, all-in-one risk management tool designed to calculate the precise trade size required to limit your risk to a predetermined percentage of your total account capital.
This indicator helps you consistently execute sound risk management, regardless of the instrument's volatility or the trade's price levels.
Key Features:
Calculates Position Size: Based on your configurable Account Capital, desired Risk Percentage (default 2.5%), and the price distance between your Entry and Stop-Loss levels.
Visual Trade Planning: Plots three clear levels directly on the chart for easy visualization:
Entry Price (Blue)
Stop-Loss Price (SL) (Red)
Profit Target (Lime Green, calculated using the Reward:Risk Ratio).
Custom Risk Management: Easily adjust the Risk Percentage and the Reward:Risk Ratio (default 4.0) in the indicator's settings.
Heads-Up Display (HUD): A clean, fixed table in the bottom-left corner of the chart clearly displays all calculated metrics, including your Required Position Size (in units/shares/contracts), Risk Amount, and Potential Profit.
How to Use:
Enter your Account Capital and desired Risk % in the settings panel.
Set your desired Entry Price and Stop-Loss Price.
The indicator immediately calculates and displays the exact number of units you need to trade to maintain your risk limit.
The Position Sizer (FinPip)The Position Sizer (FinPip) indicator is a crucial, all-in-one risk management tool designed to calculate the precise trade size required to limit your risk to a predetermined percentage of your total account capital.
This indicator helps you consistently execute sound risk management, regardless of the instrument's volatility or the trade's price levels.
Key Features:
Calculates Position Size: Based on your configurable Account Capital, desired Risk Percentage (default 2.5%), and the price distance between your Entry and Stop-Loss levels.
Visual Trade Planning: Plots three clear levels directly on the chart for easy visualization:
Entry Price (Blue)
Stop-Loss Price (SL) (Red)
Profit Target (Lime Green, calculated using the Reward:Risk Ratio).
Custom Risk Management: Easily adjust the Risk Percentage and the Reward:Risk Ratio (default 4.0) in the indicator's settings.
Heads-Up Display (HUD): A clean, fixed table in the bottom-left corner of the chart clearly displays all calculated metrics, including your Required Position Size (in units/shares/contracts), Risk Amount, and Potential Profit.
How to Use:
Enter your Account Capital and desired Risk % in the settings panel.
Set your desired Entry Price and Stop-Loss Price.
The indicator immediately calculates and displays the exact number of units you need to trade to maintain your risk limit.
Position Sizer (FinPip)The Position Sizer (FinPip) indicator is a crucial, all-in-one risk management tool designed to calculate the precise trade size required to limit your risk to a predetermined percentage of your total account capital.
This indicator helps you consistently execute sound risk management, regardless of the instrument's volatility or the trade's price levels.
Key Features:
Calculates Position Size: Based on your configurable Account Capital, desired Risk Percentage (default 2.5%), and the price distance between your Entry and Stop-Loss levels.
Visual Trade Planning: Plots three clear levels directly on the chart for easy visualization:
Entry Price (Blue)
Stop-Loss Price (SL) (Red)
Profit Target (Lime Green, calculated using the Reward:Risk Ratio).
Custom Risk Management: Easily adjust the Risk Percentage and the Reward:Risk Ratio (default 4.0) in the indicator's settings.
Heads-Up Display (HUD): A clean, fixed table in the bottom-left corner of the chart clearly displays all calculated metrics, including your Required Position Size (in units/shares/contracts), Risk Amount, and Potential Profit.
How to Use:
Enter your Account Capital and desired Risk % in the settings panel.
Set your desired Entry Price and Stop-Loss Price.
The indicator immediately calculates and displays the exact number of units you need to trade to maintain your risk limit.
EMA Trend Pro v1Here is a clear, professional English description you can copy-paste directly (suitable for sharing with friends, investors, brokers, or posting on TradingView):
EMA Trend Pro v5.0 – Strategy Overview
This is a trend-following strategy designed for 15-minute charts on assets like XAUUSD, NASDAQ, BTC, and ETH.
Entry Rules
Buy when the 7, 14, and 21-period EMAs are aligned upward and the 14-period EMA crosses above the 144-period EMA (with ADX > 20 and volume confirmation).
Sell short when the EMAs are aligned downward and the 14-period EMA crosses below the 144-period EMA.
Risk Management
Initial stop-loss is placed at 1.8 × ATR below (long) or above (short) the entry price.
Position size is calculated to risk a fixed percentage of equity per trade.
Profit-Taking & Trade Management
When price reaches 1:1 reward-to-risk, 30% of the position is closed.
At the same moment, the stop-loss for the remaining 70% is moved to the entry price (breakeven).
The remaining position is split:
50% targets 1:2 reward-to-risk
50% targets 1:3 reward-to-risk (allowing big wins during strong trends)
Visualization
Clean colored bars extend to the right showing entry, stop-loss, and three take-profit levels.
Price labels clearly display "Entry", "SL", "TP1 1:1", "TP2 1:2", and "TP3 1:3".
Only the current trade is displayed for a clean chart.
Key Advantages
High win rate due to breakeven protection after 1R
Excellent reward-to-risk ratio that lets winners run
Fully automated, works on any market with clear trends
Professional look, easy to understand and explain
Perfect for swing traders who want consistent profits with limited downside risk.
Feel free to use this description on TradingView, in your trading journal, or when explaining the strategy to others!
If you want a shorter version (e.g., for TradingView description box) or a Chinese version, just let me know — I’ll give it to you right away! 😊

Screener: Multi-Timeframe CRT / ORB [Yosiet]Are you tired of manually scanning dozens of charts across different timeframes, searching for that perfect reversal setup? What if you could have a system that does the heavy lifting for you, pinpointing high-probability reversal patterns across the entire market in real-time?
Several names for the same candlestick pattern: CRT, ORB, Morning Star, Evening Star, and others, but I'm not going to talk about it.
What is a Candle Retracement (CRT) Pattern?
For those who may be unfamiliar, the Candle Retracement pattern is a robust 3-candle setup that signals the potential exhaustion of a trend and the start of a reversal.
Bullish CRT:
Candle 1 (Signal): A significant bearish candle.
Candle 2 (Retracement): A candle that sweeps the lows of Candle 1 but closes within its body. This shows the sellers are overextended and losing momentum.
Candle 3 (Confirmation): A bullish candle that closes above Candle 2's close, confirming the reversal.
Bearish CRT:
Candle 1 (Signal): A significant bullish candle.
Candle 2 (Retracement): A candle that sweeps the highs of Candle 1 but closes within its body.
Candle 3 (Confirmation): A bearish candle that closes below Candle 2's close.
How This Screener Supercharges Your Trading
Manually finding these setups is time-consuming. This indicator automates the entire process, scanning up to four symbols across nine different timeframes—from the fast-paced 5-minute chart to the strategic weekly view.
Key Features:
Multi-Symbol, Multi-Timeframe Matrix: Get an instant, bird's-eye view of all CRT signals in a clean, easy-to-read table.
Customizable Logic: Fine-tune the pattern detection to your liking:
Lookback Period: How many bars back to search for patterns.
Min Candle %: The minimum body size of Candle 1, ensuring you only get significant signals.
Sweep %: The minimum required wick sweep of Candle 2, filtering for meaningful false breaks.
Visual & Alert System:
Clear Visuals: Green circles (🟢) for Bullish CRT and red circles (🔴) for Bearish CRT.
Proactive Alerts: Receive real-time pop-up and push notifications the moment a new pattern is confirmed on any timeframe.
Final Thoughts & Risk Management
The Multi-Timeframe CRT Screener is designed to be a cornerstone of your trading strategy, helping you find high-quality setups with efficiency. However, no indicator is infallible.
Always use confluence: Use the signals from this screener in conjunction with other factors like key support/resistance levels, volume, or momentum indicators.
Manage your risk: Always use a stop-loss. A good initial stop for a CRT pattern can be placed just beyond the extreme of Candle 1 (the low for bullish, high for bearish).
I hope you find this tool as invaluable in your trading as I have. I'm constantly working on improvements, so please feel free to leave your suggestions, comments, and questions below. If you find it useful, give it a like and share it with your trading community!
Happy Trading,
Yosiet

O'Neil Market TimingBill O'Neil Market Timing Indicator - User Guide
Overview
This Pine Script indicator implements William O'Neil's market timing methodology, which assigns one of four distinct states to a market index (such as SPY or QQQ) to help traders identify optimal market conditions for investing. The indicator is designed to work exclusively on Daily timeframe charts.
The Four Market States
The indicator tracks the market through four distinct states, with specific transition rules between them:
1. Confirmed Uptrend (Green)
- Meaning: The market is in a healthy uptrend with institutional support
- Action: Favorable conditions for building positions in leading stocks
- Can transition to: State 2 (Uptrend Under Pressure)
2. Uptrend Under Pressure (Yellow)
- Meaning: The uptrend is showing signs of weakness with increasing distribution
- Action: Be cautious, tighten stops, reduce position sizes
- Can transition to: State 1 (Confirmed Uptrend) or State 3 (Downtrend)
3. Downtrend (Red)
- Meaning: The market is in a confirmed downtrend
- Action: Stay mostly in cash, avoid new purchases
- Can transition to: State 4 (Rally Attempt)
4. Rally Attempt (Pink/Fuchsia)
- Meaning: The market is attempting to bottom and reverse
- Action: Watch for Follow-Through Day to confirm new uptrend
- Can transition to: State 1 (Confirmed Uptrend) or State 3 (Downtrend)
Key Concepts
Distribution Day
A distribution day occurs when:
1. The index closes down by more than the critical percentage (default 0.2%)
2. Volume is higher than the previous day's volume
Distribution days indicate institutional selling and are marked with red triangles on the indicator.
Follow-Through Day
A follow-through day occurs during a Rally Attempt when:
1. The index closes up by more than the critical percentage (default 1.6%)
2. Volume is higher than the previous day's volume
A Follow-Through Day confirms a new uptrend and triggers the transition from Rally Attempt to Confirmed Uptrend.
State Transition Logic
Valid Transitions
The system only allows specific transitions:
- 1 → 2: When distribution days reach the "pressure number" (default 5) within the lookback period (default 25 bars)
- 2 → 1: When distribution days drop below the pressure number
- 2 → 3: When distribution days reach "downtrend number" (default 7) AND price drops by "downtrend criterion" (default 6%) from the lookback high
- 3 → 4: When the market doesn't make a new low for 3 consecutive days
- 4 → 3: When a new low is made, undercutting the downtrend low
- 4 → 1: When a Follow-Through Day occurs during the Rally Attempt
Input Parameters
Distribution Day Parameters
- Distribution Day % Threshold (default 0.2%, range 0.1-2.0%)
- Minimum percentage decline required to qualify as a distribution day. While 0.2% seems to be the canonical number I see in literature about this, I use a much higher threshold (at least 0.5%)
Follow-Through Day Parameters
- Follow-Through Day % Threshold (default 1.6%, range 1.0-2.0%)
- Minimum percentage gain required to qualify as a follow-through day
### State Transition Parameters
- Pressure Number (default 5, range 3-6)
- Number of distribution days needed to transition from Confirmed Uptrend to Uptrend Under Pressure
- Lookback Period (default 25 bars, range 20-30)
- Number of days to count distribution days
- Downtrend Number (default 7, range 4-10)
- Number of distribution days needed (with price drop) to transition to Downtrend
- Downtrend % Drop from High (default 6%, range 5-10%)
- Percentage drop from lookback high required for downtrend confirmation
Visual Settings
- Color customization for each state
- Table position selection (Top Left, Top Right, Bottom Left, Bottom Right)
## How to Use This Indicator
### Installation
1. Open TradingView and navigate to SPY or QQQ (or another major index)
2. **Important**: Switch to the Daily (1D) timeframe
3. Click on "Indicators" at the top of the chart
4. Click "Pine Editor" at the bottom of the screen
5. Copy and paste the Pine Script code
6. Click "Add to Chart"
### Interpretation
**When the indicator shows:**
- **Green (State 1)**: Market is healthy - consider adding quality positions
- **Yellow (State 2)**: Exercise caution - tighten stops, be selective
- **Red (State 3)**: Defensive mode - preserve capital, avoid new buys
- **Pink (State 4)**: Watch closely - prepare for potential Follow-Through Day
### The Information Table
The table displays:
- **Current State**: The current market condition
- **Distribution Days**: Number of distribution days in the lookback period
- **Lookback Period**: Number of bars being analyzed
- **Rally Attempt Day**: (Only in State 4) Days into the current rally attempt
### Visual Elements
1. **State Line**: A stepped line showing the current state (1-4)
2. **Red Triangles**: Mark each distribution day
3. **Horizontal Reference Lines**: Dotted lines marking each state level
4. **Color-Coded Display**: The state line changes color based on the current market condition
## Trading Strategy Guidelines
### In Confirmed Uptrend (State 1)
- Build positions in stocks breaking out of proper bases
- Use normal position sizing
- Focus on stocks showing institutional accumulation
- Hold winners as long as they act properly
### In Uptrend Under Pressure (State 2)
- Take partial profits in extended positions
- Tighten stop losses
- Be more selective with new entries
- Reduce overall exposure
### In Downtrend (State 3)
- Move to cash or maintain very light exposure
- Avoid new purchases
- Focus on preservation of capital
- Use the time for research and watchlist building
### In Rally Attempt (State 4)
- Stay mostly in cash but prepare
- Build a watchlist of strong stocks
- On Day 4+ of the rally attempt, watch for Follow-Through Day
- If FTD occurs, begin cautiously adding positions
## Best Practices
1. **Use with Major Indices**: This indicator works best with SPY, QQQ, or other broad market indices
2. **Daily Timeframe Only**: The indicator is designed for daily bars - do not use on intraday timeframes
3. **Combine with Stock Analysis**: Use the market state as a filter for individual stock decisions
4. **Respect the Signals**: When the market enters Downtrend, reduce exposure regardless of individual stock setups
5. **Monitor Distribution Days**: Pay attention when distribution days accumulate - it's a warning sign
6. **Wait for Follow-Through**: Don't jump back in too early during Rally Attempt - wait for confirmation
## Alert Conditions
The indicator includes built-in alert conditions for:
- State changes (entering any of the four states)
- Distribution Day detection
- Follow-Through Day detection during Rally Attempt
To set up alerts:
1. Click the "Alert" button while the indicator is on your chart
2. Select "O'Neil Market Timing"
3. Choose your desired alert condition
4. Configure notification preferences
## Customization Tips
### For More Sensitive Detection
- Lower the "Pressure Number" to 3-4
- Lower the "Distribution Day % Threshold" to 0.15%
- Reduce the "Downtrend Number" to 5-6
### For More Conservative Detection
- Raise the "Pressure Number" to 6
- Raise the "Distribution Day % Threshold" to 0.3-0.5%
- Increase the "Downtrend Number" to 8-9
### For Different Market Conditions
- **Bull Market**: Consider slightly higher thresholds
- **Bear Market**: Consider slightly lower thresholds
- **Volatile Market**: May need to increase percentage thresholds
## Limitations and Considerations
1. **Not a Crystal Ball**: The indicator identifies conditions but doesn't predict the future
2. **False Signals**: Follow-Through Days can fail - use proper risk management
3. **Whipsaws Possible**: In choppy markets, the indicator may switch states frequently
4. **Confirmation Lag**: By design, there's a lag as the system waits for confirmation
5. **Works Best with Price Action**: Combine with your analysis of individual stocks
## Historical Context
This methodology is based on William J. O'Neil's decades of market research, documented in books like "How to Make Money in Stocks" and through Investor's Business Daily. O'Neil's research showed that:
- Most major market tops are preceded by accumulation of distribution days
- Most successful rallies begin with a Follow-Through Day on Day 4-7 of a rally attempt
- Identifying market state helps prevent buying during unfavorable conditions
## Troubleshooting
**Problem**: Indicator shows "Initializing"
- **Solution**: Let the chart load at least 5 bars to establish the initial state
**Problem**: No distribution day markers appear
- **Solution**: Verify you're on daily timeframe and check if volume data is available
**Problem**: Table not visible
- **Solution**: Check the table position setting and ensure it's not off-screen
**Problem**: State seems to change too frequently
- **Solution**: Increase the lookback period or adjust threshold parameters
## Support and Further Learning
For deeper understanding of this methodology:
- Read "How to Make Money in Stocks" by William J. O'Neil
- Study Investor's Business Daily's "Market Pulse"
- Review historical market tops and bottoms to see the pattern
- Practice identifying distribution days and follow-through days manually
## Version History
**Version 1.0** (November 2025)
- Initial implementation
- Four-state system with proper transitions
- Distribution day detection and marking
- Follow-through day detection
- Customizable parameters
- Information table display
- Alert conditions
---
## Quick Reference Card
| State | Number | Color | Action |
|-------|--------|-------|--------|
| Confirmed Uptrend | 1 | Green | Buy quality setups |
| Uptrend Under Pressure | 2 | Yellow | Tighten stops, be selective |
| Downtrend | 3 | Red | Cash position, no new buys |
| Rally Attempt | 4 | Pink | Watch for Follow-Through Day |
**Distribution Day**: Down > 0.2% on higher volume (red triangle)
**Follow-Through Day**: Up > 1.6% on higher volume during Rally Attempt (triggers State 4→1)
---
*Remember: This indicator is a tool to help identify market conditions. It should be used as part of a comprehensive trading strategy that includes proper risk management, position sizing, and individual stock analysis.*
Also, I created this with the help of an AI coding framework, and I didn't exhaustively test it. I don't actually use this for my own trading, so it's quite possible that it's materially wrong, and that following this will lead to poor investment decisions.. This is "copy left" software, so feel free to alter this to your own tastes, and claim authorship.
