Cerca negli script per "supertrend"

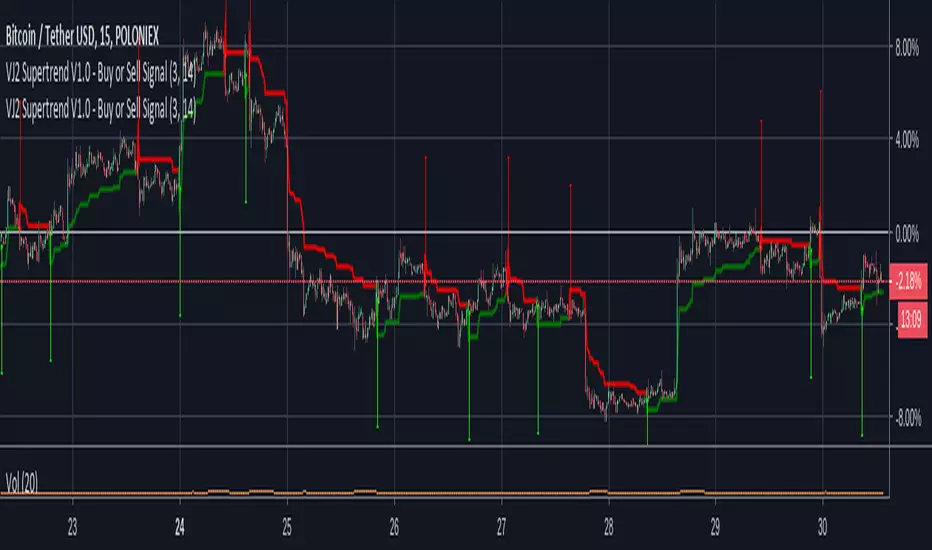
VJ2 Supertrend V1.0 - Buy or Sell Signal with alert supertrend indicator added alert on short and long
Supertrend with 3 parametersthis supertrend has 3 parameter value which is very efectfull.pls apply this and earn together

SuperTrend ATR + RSI with signalThis is an updated version of Crée par J.Dow's very interesting indicator- myself and Squiggles added the alert function in there. The original description and explanation can be seen here.
Some settings work better than others on different timeframes- have a play around, I'd be interested in seeing what optimum settings you might be able to find.


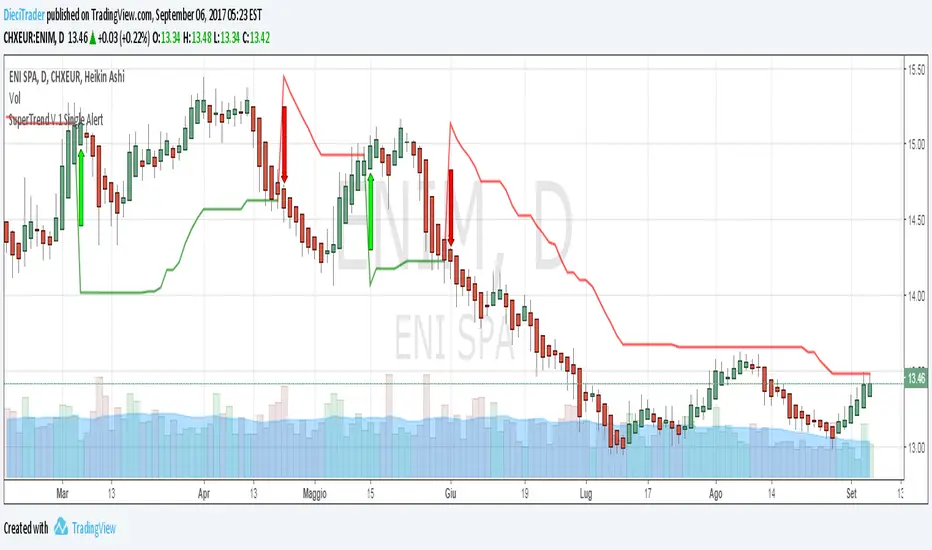
SuperTrend V.1 Single AlertLike SuperTrend V.1 Alert, but no difference for long alert and short alert ...
The Forexation: Super Trend SignalsOverview:
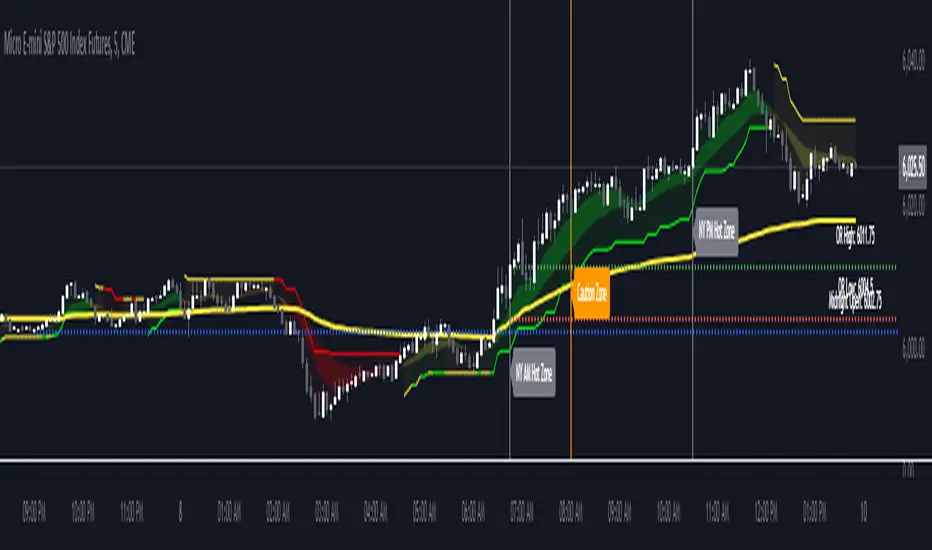
The Forexation: Super Trend Signals (STS) indicator was crafted to enhance visualization of market trends by integrating multiple technical analysis tools and adding logic to them so they color bullish, bearish, counter trends, and cautious trends. By combining standard and higher-timeframe Supertrends with dynamic EMAs and VWAP, STS offers a multi-dimensional view of market dynamics. This synergy allows traders to:
Assess Trend Strength and Alignment
Identify Momentum Shifts and Reversals
Gauge Market Sentiment through Volume-Weighted Pricing
Filter Out Market Noise for Clearer Signals
Key Features and Synergy:
1. Dual Supertrend Analysis:
Standard Supertrend:
Utilizes the Average True Range (ATR) and a multiplier factor to detect immediate market trends.
Customizable ATR Length and Factor to adjust sensitivity to market volatility.
Used as a guide to help follow the trend and identify where if price breaks through we can be reversing trend or entering a counter/cautious trend.
Higher Time Frame (HTF) Supertrend:
Integrates Supertrend data from a higher timeframe for a broader market perspective.
Smoothing applied via an EMA to reduce lag and false signals.
**Synergistic Effect:
Trend Alignment: By analyzing both standard and HTF Supertrends, STS identifies when short-term trends align with long-term trends, increasing the reliability of trend signals.
Dynamic Adjustments: Traders can adjust parameters to fine-tune the balance between responsiveness and stability.
2. Customized EMAs with Contextual Color-Coding:
Fast and Slow EMAs:
Customizable periods to match different trading strategies and timeframes.
EMAs are used to identify momentum shifts and potential reversals through crossovers.
Dynamic Color-Coding:
EMA lines change color based on their relationship with each other, the Supertrends, and VWAP.
Visual Interpretation:
Bullish Alignment: Fast EMA above Slow EMA, both above Supertrend and VWAP, signals strong upward momentum.
Bearish Alignment: Fast EMA below Slow EMA, both below Supertrend and VWAP, signals strong downward momentum.
Caution Zones: Misalignment or crossovers indicate potential reversals or consolidation.
**Synergistic Effect:
Momentum Confirmation: EMA crossovers are validated against Supertrend directions, reducing false signals.
Support and Resistance Zones: The area between EMAs acts as dynamic support/resistance, visualized through an optional fill.
3. VWAP Integration for Volume-Weighted Insights:
VWAP Analysis:
Calculates the average price weighted by volume, providing insights into institutional trading levels and market sentiment.
**Synergistic Effect:
Trend Validation: Confirms trend strength by analyzing whether price and EMAs are above or below VWAP.
Counter-Trend Detection: Identifies potential pullbacks or reversals when price interacts with VWAP against the prevailing trend of the standard and higher time frame SuperTrend.
4. Composite Signal Generation:
Color-Coded Market Conditions:
Bullish Signals (Green): Strong upward trends with alignment across standard + HTF Supertrend, EMAs, and price above VWAP.
Bearish Signals (Red): Strong downward trends with inverse alignment.
Caution State (Orange): Potential market reversals or uncertainty when indicators are misaligned. (Example: price above VWAP but under HTF SuperTrend)
Counter-Trend Conditions (Yellow): Signals possible pullbacks or consolidations when price or EMAs cross VWAP. (Example: Price is above VWAP & HTF SuperTrend but the EMAs and Standard SuperTrend are in a down trend)
**Synergistic Effect:
Enhanced Signal Accuracy: By requiring multiple confirmations across different indicators and timeframes, STS filters out noise and increases the probability of trends in the market.
Timely Alerts: Alerts are generated when critical conditions are met, keeping traders informed of significant market movements.
Underlying Concepts and Calculations:
Supertrend Algorithm:
Calculation:
Supertrend is calculated using ATR to set a dynamic trailing stop that follows price movements.
The indicator switches between bullish and bearish modes when price crosses the Supertrend line.
Customization:
ATR Length and Factor can be adjusted to make the Supertrend more or less sensitive to price changes.
In STS: Both standard and HTF Supertrends are used, with the HTF providing longer-term trend context.
Exponential Moving Averages (EMAs):
Calculation:
EMAs apply more weight to recent prices, making them more responsive than Simple Moving Averages (SMAs).
Crossovers between Fast and Slow EMAs signal potential momentum shifts.
Customization:
Periods for Fast and Slow EMAs are user-defined to suit different trading styles.
In STS: EMA behavior is analyzed in conjunction with Supertrend and VWAP to validate signals.
Volume Weighted Average Price (VWAP):
Calculation:
VWAP accumulates total dollars traded (price times volume) divided by total volume over a specific period.
Reflects the average price at which the instrument has traded throughout the day based on both price and volume.
**In STS:
VWAP serves as a dynamic support/resistance level.
Interaction with VWAP can indicate shifts in market sentiment, especially when combined with other indicators.
Justifying the Value of STS:
Holistic Market Analysis:
STS doesn't just merge indicators; it creates a cohesive system where each component validates and enhances the others.
This integrated approach offers a more reliable analysis than using individual indicators in isolation.
Customizable and Adaptive:
Traders have control over key parameters, allowing STS to be tailored to different markets and trading styles.
The ability to adjust sensitivity helps in adapting to varying market conditions.
Enhanced Decision-Making:
By providing clear visual cues and alerts, STS aids in quick interpretation of complex market data.
The indicator helps in identifying high-probability trend opportunities and managing risk effectively with trailing SuperTrend guidance.
Unique Signal Filtering:
The combination of multiple confirmations reduces the likelihood of false trend signals.
The use of higher timeframe data and volume-weighted analysis adds depth to trend assessment.
How to Use STS Effectively:
1. Configuring Settings:
Supertrend Settings:
Adjust ATR Length and Factor to set the desired sensitivity.
Select the Higher Time Frame for the HTF Supertrend to align with your trading horizon.
Set the Smoothing Period for the EMA applied to the HTF Supertrend.
EMA Settings:
Define periods for Fast and Slow EMAs based on your strategy.
Ensure the Fast EMA period is shorter than the Slow EMA for effective crossovers.
Color and Display Settings:
Customize colors for different market conditions to enhance visual clarity.
Choose whether to display the HTF Supertrend, EMA lines, EMA fill, and VWAP.
2. Interpreting Signals:
Bullish Scenario:
Supertrends indicate an uptrend.
Fast EMA crosses above Slow EMA, both trending upwards.
Price and EMAs are above VWAP.
Action: Consider long positions, using the standard Supertrend as a trailing stop.
Bearish Scenario:
Supertrends indicate a downtrend.
Fast EMA crosses below Slow EMA, both trending downwards.
Price and EMAs are below VWAP.
Action: Consider short positions. using the standard Supertrend as a trailing stop
Caution and Counter-Trend Signals:
Misalignment between indicators or color changes to orange/yellow.
Action: Exercise caution, tighten stops, or wait for clearer signals.
4. Setting Up Alerts:
Access the Alerts menu.
Configure alerts for:
Supertrend Direction Changes
EMA Crossovers
Price Crossing VWAP
Set alert actions and ensure they trigger on confirmed data by selecting "Once Per Bar Close."
Example Trading Strategies:
Trend Following:
Use STS to identify strong trends where all indicators are aligned.
Enter positions in the direction of the trend.
Use Supertrend lines as dynamic stop-loss levels.
Pullback Entries:
Wait for price to pull back to the EMA fill area or VWAP in a prevailing trend.
Look for bounce signals off these levels when supported by Supertrend direction.
Counter-Trend Opportunities:
Identify potential reversals when caution or counter-trend signals appear.
Confirm with additional analysis or indicators before taking positions against the main trend.
Disclaimer:
This indicator is intended to aid in technical analysis and should be used as part of a comprehensive trading strategy. It does not guarantee profits and carries the risk of loss. Trading financial instruments involves significant risk; please consult with a qualified financial advisor before making any investment decisions. Past performance is not indicative of future results.
Final Notes:
The Forexation: Super Trend Signals (STS) indicator represents a thoughtfully engineered tool that brings together multiple technical elements to provide a more nuanced understanding of market behavior. By leveraging the strengths of Supertrend, EMAs, and VWAP in unison, STS aims to enhance trading precision and confidence in the trends the market creates but also guide risk management levels for managing a trade and stop loss areas.
We are committed to continuous improvement and value user feedback. Please share your experiences and suggestions to help us refine the indicator further.
Happy Trading!
Multi-Fibonacci Trend Average[FibonacciFlux]Multi-Fibonacci Trend Average (MFTA): An Institutional-Grade Trend Confluence Indicator for Discerning Market Participants
My original indicator/Strategy:
Engineered for the sophisticated demands of institutional and advanced traders, the Multi-Fibonacci Trend Average (MFTA) indicator represents a paradigm shift in technical analysis. This meticulously crafted tool is designed to furnish high-definition trend signals within the complexities of modern financial markets. Anchored in the rigorous principles of Fibonacci ratios and augmented by advanced averaging methodologies, MFTA delivers a granular perspective on trend dynamics. Its integration of Multi-Timeframe (MTF) filters provides unparalleled signal robustness, empowering strategic decision-making with a heightened degree of confidence.
MFTA indicator on BTCUSDT 15min chart with 1min RSI and MACD filters enabled. Note the refined signal generation with reduced noise.
MFTA indicator on BTCUSDT 15min chart without MTF filters. While capturing more potential trading opportunities, it also generates a higher frequency of signals, including potential false positives.
Core Innovation: Proprietary Fibonacci-Enhanced Supertrend Averaging Engine
The MFTA indicator’s core innovation lies in its proprietary implementation of Supertrend analysis, strategically fortified by Fibonacci ratios to construct a truly dynamic volatility envelope. Departing from conventional Supertrend methodologies, MFTA autonomously computes not one, but three distinct Supertrend lines. Each of these lines is uniquely parameterized by a specific Fibonacci factor: 0.618 (Weak), 1.618 (Medium/Golden Ratio), and 2.618 (Strong/Extended Fibonacci).
// Fibonacci-based factors for multiple Supertrend calculations
factor1 = input.float(0.618, 'Factor 1 (Weak/Fibonacci)', minval=0.01, step=0.01, tooltip='Factor 1 (Weak/Fibonacci)', group="Fibonacci Supertrend")
factor2 = input.float(1.618, 'Factor 2 (Medium/Golden Ratio)', minval=0.01, step=0.01, tooltip='Factor 2 (Medium/Golden Ratio)', group="Fibonacci Supertrend")
factor3 = input.float(2.618, 'Factor 3 (Strong/Extended Fib)', minval=0.01, step=0.01, tooltip='Factor 3 (Strong/Extended Fib)', group="Fibonacci Supertrend")
This multi-faceted architecture adeptly captures a spectrum of market volatility sensitivities, ensuring a comprehensive assessment of prevailing conditions. Subsequently, the indicator algorithmically synthesizes these disparate Supertrend lines through arithmetic averaging. To achieve optimal signal fidelity and mitigate inherent market noise, this composite average is further refined utilizing an Exponential Moving Average (EMA).
// Calculate average of the three supertends and a smoothed version
superlength = input.int(21, 'Smoothing Length', tooltip='Smoothing Length for Average Supertrend', group="Fibonacci Supertrend")
average_trend = (supertrend1 + supertrend2 + supertrend3) / 3
smoothed_trend = ta.ema(average_trend, superlength)
The resultant ‘Smoothed Trend’ line emerges as a remarkably responsive yet stable trend demarcation, offering demonstrably superior clarity and precision compared to singular Supertrend implementations, particularly within the turbulent dynamics of high-volatility markets.
Elevated Signal Confluence: Integrated Multi-Timeframe (MTF) Validation Suite
MFTA transcends the limitations of conventional trend indicators by incorporating an advanced suite of three independent MTF filters: RSI, MACD, and Volume. These filters function as sophisticated validation protocols, rigorously ensuring that only signals exhibiting a confluence of high-probability factors are brought to the forefront.
1. Granular Lower Timeframe RSI Momentum Filter
The Relative Strength Index (RSI) filter, computed from a user-defined lower timeframe, furnishes critical momentum-based signal validation. By meticulously monitoring RSI dynamics on an accelerated timeframe, traders gain the capacity to evaluate underlying momentum strength with precision, prior to committing to signal execution on the primary chart timeframe.
// --- Lower Timeframe RSI Filter ---
ltf_rsi_filter_enable = input.bool(false, title="Enable RSI Filter", group="MTF Filters", tooltip="Use RSI from lower timeframe as a filter")
ltf_rsi_timeframe = input.timeframe("1", title="RSI Timeframe", group="MTF Filters", tooltip="Timeframe for RSI calculation")
ltf_rsi_length = input.int(14, title="RSI Length", minval=1, group="MTF Filters", tooltip="Length for RSI calculation")
ltf_rsi_threshold = input.int(30, title="RSI Threshold", minval=0, maxval=100, group="MTF Filters", tooltip="RSI value threshold for filtering signals")
2. Convergent Lower Timeframe MACD Trend-Momentum Filter
The Moving Average Convergence Divergence (MACD) filter, also calculated on a lower timeframe basis, introduces a critical layer of trend-momentum convergence confirmation. The bullish signal configuration rigorously mandates that the MACD line be definitively positioned above the Signal line on the designated lower timeframe. This stringent condition ensures a robust indication of converging momentum that aligns synergistically with the prevailing trend identified on the primary timeframe.
// --- Lower Timeframe MACD Filter ---
ltf_macd_filter_enable = input.bool(false, title="Enable MACD Filter", group="MTF Filters", tooltip="Use MACD from lower timeframe as a filter")
ltf_macd_timeframe = input.timeframe("1", title="MACD Timeframe", group="MTF Filters", tooltip="Timeframe for MACD calculation")
ltf_macd_fast_length = input.int(12, title="MACD Fast Length", minval=1, group="MTF Filters", tooltip="Fast EMA length for MACD")
ltf_macd_slow_length = input.int(26, title="MACD Slow Length", minval=1, group="MTF Filters", tooltip="Slow EMA length for MACD")
ltf_macd_signal_length = input.int(9, title="MACD Signal Length", minval=1, group="MTF Filters", tooltip="Signal SMA length for MACD")
3. Definitive Volume Confirmation Filter
The Volume Filter functions as an indispensable arbiter of trade conviction. By establishing a dynamic volume threshold, defined as a percentage relative to the average volume over a user-specified lookback period, traders can effectively ensure that all generated signals are rigorously validated by demonstrably increased trading activity. This pivotal validation step signifies robust market participation, substantially diminishing the potential for spurious or false breakout signals.
// --- Volume Filter ---
volume_filter_enable = input.bool(false, title="Enable Volume Filter", group="MTF Filters", tooltip="Use volume level as a filter")
volume_threshold_percent = input.int(title="Volume Threshold (%)", defval=150, minval=100, group="MTF Filters", tooltip="Minimum volume percentage compared to average volume to allow signal (100% = average)")
These meticulously engineered filters operate in synergistic confluence, requiring all enabled filters to definitively satisfy their pre-defined conditions before a Buy or Sell signal is generated. This stringent multi-layered validation process drastically minimizes the incidence of false positive signals, thereby significantly enhancing entry precision and overall signal reliability.
Intuitive Visual Architecture & Actionable Intelligence
MFTA provides a demonstrably intuitive and visually rich charting environment, meticulously delineating trend direction and momentum through precisely color-coded plots:
Average Supertrend: Thin line, green/red for uptrend/downtrend, immediate directional bias.
Smoothed Supertrend: Bold line, teal/purple for uptrend/downtrend, cleaner, institutionally robust trend.
Dynamic Trend Fill: Green/red fill between Supertrends quantifies trend strength and momentum.
Adaptive Background Coloring: Light green/red background mirrors Smoothed Supertrend direction, holistic trend perspective.
Precision Buy/Sell Signals: ‘BUY’/‘SELL’ labels appear on chart when trend touch and MTF filter confluence are satisfied, facilitating high-conviction trade action.
MFTA indicator applied to BTCUSDT 4-hour chart, showcasing its effectiveness on higher timeframes. The Smoothed Length parameter is increased to 200 for enhanced smoothness on this timeframe, coupled with 1min RSI and Volume filters for signal refinement. This illustrates the indicator's adaptability across different timeframes and market conditions.
Strategic Applications for Institutional Mandates
MFTA’s sophisticated design provides distinct advantages for advanced trading operations and institutional investment mandates. Key strategic applications include:
High-Probability Trend Identification: Fibonacci-averaged Supertrend with MTF filters robustly identifies high-probability trend continuations and reversals, enhancing alpha generation.
Precision Entry/Exit Signals: Volume and momentum-filtered signals enable institutional-grade precision for optimized risk-adjusted returns.
Algorithmic Trading Integration: Clear signal logic facilitates seamless integration into automated trading systems for scalable strategy deployment.
Multi-Asset/Timeframe Versatility: Adaptable parameters ensure applicability across diverse asset classes and timeframes, catering to varied trading mandates.
Enhanced Risk Management: Superior signal fidelity from MTF filters inherently reduces false signals, supporting robust risk management protocols.
Granular Customization and Parameterized Control
MFTA offers unparalleled customization, empowering users to fine-tune parameters for precise alignment with specific trading styles and market conditions. Key adjustable parameters include:
Fibonacci Factors: Adjust Supertrend sensitivity to volatility regimes.
ATR Length: Control volatility responsiveness in Supertrend calculations.
Smoothing Length: Refine Smoothed Trend line responsiveness and noise reduction.
MTF Filter Parameters: Independently configure timeframes, lookback periods, and thresholds for RSI, MACD, and Volume filters for optimal signal filtering.
Disclaimer
MFTA is meticulously engineered for high-quality trend signals; however, no indicator guarantees profit. Market conditions are unpredictable, and trading involves substantial risk. Rigorous backtesting and forward testing across diverse datasets, alongside a comprehensive understanding of the indicator's logic, are essential before live deployment. Past performance is not indicative of future results. MFTA is for informational and analytical purposes only and is not financial or investment advice.

Whale Supertrend (V1.2)The script "Whale Supertrend (V1.2)" is an advanced trend indicator that uses multiple Supertrends with different factors to determine entry and exit points in the market. The Supertrend is a popular indicator that combines price and volatility to help identify trend direction. The script displays buy and sell signals based on the confluence of Supertrends.
How the script works
Configuring Supertrends
The script configures six Supertrends with different factors (factor, factor1, factor2, factor3, factor4, factor5) while using the same ATR period (atrPeriod = 10).
Supertrend 1: factor = 3
Supertrend 2: factor1 = 4
Supertrend 3: factor2 = 6
Supertrend 4: factor3 = 9
Supertrend 5: factor4 = 13
Supertrend 6: factor5 = 18
For each Supertrend, the bullish (blue) and bearish (purple) trend conditions are plotted on the chart.
Signal Calculation
The script calculates the number of Supertrends in bullish and bearish trend:
bullishCount: Number of Supertrends indicating a bullish trend.
bearishCount: Number of Supertrends indicating a bearish trend.
Signal Detection
The script triggers a buy or sell signal when at least three of the six Supertrends indicate the same trend:
Buy Signal (buySignal): Triggers when bullishCount is greater than or equal to 3.
Sell Signal (sellSignal): Triggers when bearishCount is greater than or equal to 3.
To avoid repetition, signals are only displayed when the state changes:
triggerBuy: Buy signal only when buySignal becomes true for the first time.
triggerSell: Sell signal only when sellSignal becomes true for the first time.
Candle Coloring:
Candles now change color based on signals:
Green: When a Buy Signal is active.
Red: When a Sell Signal is active.
This provides a clearer visualization of market trends directly on the chart.
Dynamic Settings for Supertrends:
You can customize the ATR Period and Factor for each of the 6 Supertrends via the settings panel.
Each Supertrend has independent parameters:
ATR Period: Controls the ATR calculation period.
Factor: Adjusts the Supertrend sensitivity.
Benefits:
Enhanced Readability: Candle colors help identify buy and sell zones at a glance.
Greater Customization: Tailor Supertrend settings to your trading strategy or market conditions.

TripleTrend with RSI ReversalTripleTrend with RSI Reversal
The TripleTrend with RSI Reversal indicator is a comprehensive trading tool designed to identify trend direction, potential trend reversals, and trade entry/exit signals. It combines three independent SuperTrend indicators with varying sensitivities to provide a multi-layered view of the market trend. Additionally, it incorporates an RSI (Relative Strength Index) module to detect potential price reversals based on overbought/oversold conditions and to filter trend flip signals.
This indicator aims to provide clear visual cues on the chart, including trend lines, trend flip labels, and RSI-based reversal warnings, helping traders make more informed decisions.
Key Features
Triple SuperTrend Analysis
Utilizes three configurable SuperTrend lines, each with its own ATR period and multiplier, allowing for a nuanced view of short, medium, and long-term trends.
RSI Reversal Signals
Identifies potential market turning points when the RSI deeply penetrates overbought or oversold zones, plotting distinct visual cues and labels.
Trend Flip Labels
Displays labels on the chart when one, two, or all three SuperTrends change direction simultaneously, indicating the strength of the new trend. These labels also include the current RSI value.
Customizable RSI Filtering
Offers an option to filter out trend flip labels when the RSI is within a user-defined neutral range, reducing signals in choppy market conditions.
Configurable Alerts
Provides various alert conditions for trend flips and signal confirmations.
How It Works
SuperTrend Calculation:
- The indicator plots three separate SuperTrend lines. Each SuperTrend is calculated using an Average True Range (ATR) period and a multiplier.
- A SuperTrend line below the price indicates an uptrend (typically colored green).
- A SuperTrend line above the price indicates a downtrend (typically colored red).
- The sensitivity of each SuperTrend can be adjusted independently.
RSI Reversal Detection:
- A standard RSI is calculated.
- The indicator monitors if the RSI moves significantly beyond the user-defined Upper Threshold (overbought) or Lower Threshold (oversold).
- The depth of this penetration is measured as a percentage. If this percentage exceeds the Upper reversal range percent trigger (for overbought) or Lower reversal range percent trigger (for oversold), a blue line is plotted above the high (for potential bearish reversal) or below the low (for potential bullish reversal) of the signal candle.
- A "REV" label appears at the start of this blue line, showing the penetration percentage and the current RSI value.
Trend Flip Labels:
- When one or more SuperTrends flip direction, the indicator checks RSI conditions.
- For buy signals (trend flips upwards), labels appear if the RSI is below the RSI Upper threshold (i.e., not extremely overbought).
- For sell signals (trend flips downwards), labels appear if the RSI is above the RSI Lower threshold (i.e., not extremely oversold).
- Labels indicate which SuperTrend(s) flipped ("1", "2", "3", "1 2", etc.) and the current RSI value.
- An optional Custom RSI Filter can be enabled. If active, trend flip labels will not be shown if the RSI value is between the Custom RSI filter high limit and Custom RSI filter low limit, helping to avoid signals during market indecision.
Usage Guide
Interpreting SuperTrend Lines:
- The three SuperTrend lines act as dynamic levels of support (in an uptrend) or resistance (in a downtrend).
- A break of a SuperTrend line by the price suggests a potential change in that specific trend's direction.
- Confluence of trends (e.g., all three lines indicating an uptrend) suggests a stronger overall trend.
Trend Flip Labels:
- Single Trend Flip Labels ("1", "2", or "3"): Indicate an early change in one of the SuperTrends. These can be used for more aggressive entries or to signal a potential shift in momentum. The label includes the RSI value at the time of the flip.
- Double Trend Flip Labels ("1 2", "1 3", "2 3"): Offer stronger confirmation as two SuperTrends align in a new direction.
- Triple Trend Flip Labels ("1 2 3"): Represent the strongest trend confirmation, as all three SuperTrends have flipped simultaneously.
- Green labels suggest buy signals; red labels suggest sell signals.
- Always consider the accompanying RSI value on the label and the overall market context.
RSI Reversal Signals (Blue Lines & "REV" Labels):
- REV is for Reverse
- A blue line appearing above the price with a "REV" label suggests the RSI is deeply overbought, indicating potential uptrend exhaustion or a bearish reversal.
- A blue line appearing below the price with a "REV" label suggests the RSI is deeply oversold, indicating potential downtrend exhaustion or a bullish reversal.
- These are counter-trend signals and should be used with caution, preferably with confirmation from other indicators or price action. They can also serve as warnings to take profit on existing trend-following trades.
- Trend flip labels are suppressed when an RSI Reversal line is active, prioritizing the exhaustion signal.
Combining Signals:
- Look for trend flip labels (especially double or triple) that align with the broader market structure and occur when the RSI is not in extreme territory (as per label logic).
- Use RSI Reversal signals as potential early warnings of a trend ending or for high-probability counter-trend setups if strongly supported by other factors.
- If the Use custom RSI filter is enabled, be aware that trend flip labels will be hidden if the RSI is within the specified neutral zone. This can help avoid weaker signals in range-bound markets.
Settings Customization
Trend 1, 2, 3 Settings:
- ATR Period: Adjusts the lookback period for ATR calculation. Shorter periods make the SuperTrend more sensitive to price changes.
- Source: The price source used for calculations (default is hl2).
- ATR Multiplier: Controls the distance of the SuperTrend line from the price. Smaller multipliers result in tighter stops and more signals; larger multipliers result in wider stops and fewer signals.
- Show single/double/triple trend flip labels: Toggle visibility for these specific label types.
Label settings:
- Label Size: Adjusts the size of all indicator labels.
- Show reversal labels: Toggles visibility for the "REV" labels associated with RSI Reversal signals.
RSI Settings (Change often):
- RSI Length: The lookback period for the RSI calculation.
- RSI Upper threshold: The RSI level considered overbought.
- RSI Lower threshold: The RSI level considered oversold.
RSI Reversal detection settings:
- Upper reversal range percent trigger: Percentage of penetration into the (RSI Upper Threshold to 100) zone required to trigger an upper reversal signal. Higher values mean RSI needs to be deeper into overbought.
- Lower reversal range percent trigger: Percentage of penetration into the (RSI Lower Threshold to 0) zone required to trigger a lower reversal signal. Higher values mean RSI needs to be deeper into oversold.
Custom RSI filter settings:
- Use custom RSI filter: Enable/disable this filter for trend flip labels.
- Custom RSI filter high limit: If the filter is active, no trend flip labels will show if RSI is below this value (and above the low limit).
- Custom RSI filter low limit: If the filter is active, no trend flip labels will show if RSI is above this value (and below the high limit).
Alerts
- Individual trend flips (TripleTrend: Trend 1/2/3 flipped).
- Multiple trend flips (TripleTrend: 2 Trends flipped, TripleTrend: 3 Trends flipped).
- Confirmed buy/sell signals based on label logic (TripleTrend: Early/Double/Triple trend buy/sell signals).
- Configure these alerts in TradingView to receive notifications for specific market events detected by the indicator.
How I use TripleTrend with RSI Reversal
I use it on 5, 10 and 30 minute time frames.
I adjust the settings, especially the RSI thresholds for what I am trading, the day could be in the lower or upper regions of the RSI, I adjust as needed, when needed. I then use the REV (aka REVERSAL) indicators to indicate when to get out or caution me to not enter at that point. Unless I see something else which indicates otherwise.
Disclaimer
Trading involves substantial risk of loss and is not suitable for every investor. The TripleTrend indicator is to be used at your own risk and is only created to help you make decisions, it is not intended to make decisions for you. Past performance is not indicative of future results. Always do your own research and risk assessment before making any trading decisions. By using this indicator you use it at your own risk.

Double Supertrend HTF FilterDouble Supertrend HTF Filter: A Comprehensive Market Direction Tool
The Double Supertrend HTF Filter is an innovative tool designed for traders who seek a more holistic view of market trends. At its core, the indicator combines two Supertrends from different higher timeframes, providing a layered perspective on the market's direction. Instead of juggling between multiple timeframes or charts, traders get a consolidated view with this indicator. One of its standout features is the horizontal line at the bottom of the chart, which visually represents the alignment of the two Supertrends – a simple yet powerful way to gauge the combined sentiment of the two higher timeframes on your chart.
The Supertrend Indicator: Origins and Rationale
The Supertrend indicator, a popular tool among traders, was developed by Olivier Seban. At its essence, the Supertrend is a trend-following indicator, designed to identify and visualize the current market trend. It operates using average true range (ATR) values and price data, effectively smoothing out market noise to present clearer trend directions. When prices move with a consistent momentum upwards or downwards, the Supertrend remains below or above the price respectively, signaling the prevailing trend's direction. The rationale behind the Supertrend is its ability to adapt to price volatility. By factoring in the average true range, it dynamically adjusts itself, ensuring that it's not just based on price but also the inherent volatility of the market. This adaptability makes it a valuable tool for traders, offering insights into potential trend reversals and potential entry or exit points.
Filter Usage
The main idea behind the Double Supertrend HTF is to use the indicator as a filter in addition to a signal indicator to your liking. To illustrate, consider incorporating it with a MACD Oscillator, such as the one detailed in this article: When the solid line at the bottom of the chart turns green, it signals that both supertrends are up and thus allows for long positions, indicating a bullish sentiment across both the chosen higher timeframes. Conversely, a red line permits short positions, hinting at a bearish trend. Should the line turn yellow, it's a sign of caution. The market is indecisive, and it might be prudent to refrain from taking any trades until a clearer direction emerges.
Features of the Indicator
Understanding that traders have different preferences, the Double Supertrend HTF Filter comes with customizable features. With the easy user interface you can change the timeframe, ATR and factor to your preferred trading strategy. The default settings are set for the 30 minutes and 4 hour timeframe, which is my personal preference for scalping trades on lower timeframes (eg. 1min, 5 min, 10 min, 15 min). While the dual Supertrend lines offer valuable insights, a chart can become cluttered when combined with other indicators. Therefore, traders have the option to toggle on or off the display of the Supertrends. This ensures that you have the flexibility to maintain a clean chart view while still benefiting from the insights the tool provides at the bottom of the chart.
A Note on Usage
It's essential to highlight that the Double Supertrend HTF Filter is for educational purposes. While it offers a unique perspective on market trends and can be a valuable addition to a trader's toolkit, it's merely an example of how one can use the Supertrend as a filter. Always conduct thorough research and consider your trading strategy before making any decisions.
If you have any comments or ideas how to combine this filter with other indicators feel free to leave a comment.

Super Momentum Trend IndicatorThis is a trend momentum indicator that uses some of Ichimoku Cloud's core trading concepts and Supertrend, so before using this indicator, you can first understand Ichimoku Cloud, which is very helpful for understanding this indicator.
There are mainly the following ways to identify trends in Ichimoku Cloud.
1. The price is above or below the Tenkan-sen and the Kijun-sen
2. The Tenkan-sen crosses the Kijun-sen
3. The price breaks or falls below Leading Span B
4. Leading Span A crosses Leading Span B
I converted the above signal into the following expression (see chart):
1. Green dot: the price is above the Tenkan-sen and Kijun-sen
2. Red dot: the price is below Tenkan-sen and the Kijun-sen
3. Orange or blue dot: the price is between Tenkan-sen and Kijun-sen
4. Triangular symbol: the Tenkan-sen crosses the Kijun-sen, and the price continues to stand firmly above or below Kijun-sen by 2 candles (prevent fake moves)
5.B1 signal: the price breaks or falls below Leading Span B
6. B2 signal: Leading Span A crosses Leading Span B (this expresses whether the color of the cloud is green or red in Ichimoku cloud)
The default for this indicator is Ichimoku Cloud turned off so that the charts are simpler, but you can turn it on if you want to check Ichimoku Cloud.
When you use this indicator, you can observe the changes of the dots:
1. The upward trend reverses to a downward trend (see chart)
What you will see is: green dots, orange dots, red dots, unless the price suddenly falls below the Tenkan-sen and the Kijun-sen, then you will see red dots directly without orange dots .
2. The downward trend reverses to an upward trend (see chart)
What you will see is: red dots, blue dots, green dots, unless the price suddenly breaks through the Tenkan-sen and Kijun-sen, then you will see the green dots directly without the blue dots.
The dot is usually the signal on the left-hand side, the triangle is between the left-hand side and the right-hand side, and B1/B2 is the signal on the right-hand side.
I recommend entry trades separately , and using Supertrend to judge the trend. This is why this indicator also adds two Supertrends.
Why not just use the Super Trend indicator?
Because SuperTrend only provides a pure uptrend or downtrend, it does not show the upcoming reversal.
And with the momentum dots added, when you see orange or blue dots, the trend may be about to reverse.
Therefore, this indicator can better capture the changing process of the trend.
What if the momentum dots are not trending as indicated by the SuperTrend indicator?
If the Super Trend shows a downward trend, but you frequently see green and blue dots, it means that the trend is likely to reverse upwards.
On the contrary, if the Super Trend shows an upward trend, but you frequently see red or orange dots, it means that it is likely to reverse downward.
Please remember that when you want to open a position, the trend direction of SuperTrend should be consistent with the direction of the dots momentum and signals. If they are inconsistent, you need more patience to judge the trend direction.
Which signal is most important?
When using these signals, you must remember that the dot belongs to the left-hand side signal, the triangle belongs to the half left-hand side and half right-hand side signal, and B1/B2 is the right-hand side signal. So I think the B1/B2 signal is the most important because of the meaning of B1 It means that the price has broken through the support or resistance of the cloud layer, and the meaning of B2 in Ichimoku Cloud is that the cloud (kumo) has reversed.
I backtested COINBASE:BTCUSDT for several signals of this indicator, and the B2 signal has a higher win rate.
Why two SuperTrends are used?
Because I found that there are many fake moves in the market, using two SuperTrends with different ATR multipliers can effectively identify fake moves.
Most Important Reminder:
The dot display, triangle signal, and B1/B2 signals have a sequential relationship with the timing of their appearance. During the process of trend change, you will definitely see the change of the dot first, then the triangle, and finally B1/B2, this is why I suggest that you should add positions separately.
If the signals on the chart are not displayed in sequence, it means that the trend has not reversed. Then adding positions separately at the beginning can just reduce your loss.
In addition, it is strongly recommended that you must understand the formula of Ichimoku Cloud, otherwise you may misuse this indicator.
How do I use this indicator?
1. I will build positions in batches when I see the triangle, B1, and B2 signals.
2. When you see Supertrend changing trend, or reverse triangle, you can consider ending position.
3. Triangle/B1/B2 and other signals should be in the same direction as Supertrend before entering the market.
4. When you see the green dot, you don’t need to rush to get into the market, you can wait for a triangle signal, because the triangle means that the conversion line (Tenkan-sen) crosses the base line (Kijun-sen), and the price stands firm on the base line (Kijun-sen) two candles above or below
5. If you are not sure why there is a triangle/B1/B2 signal in a certain place, you can open Ichimoku Cloud in settings to confirm for yourself.
========== 中文說明 (Chinese Explanation) ==========
這是一隻趨勢動量指標,使用了部分 Ichimoku Cloud 的核心交易理念與Supertrend,所以在使用這支指標之前,您可以先搞懂 Ichimoku Cloud,對於理解這隻指標很有幫助。
在 Ichimoku Cloud 中主要有以下幾種方式來確定趨勢。
1.價格在轉換線(Tenkan-sen)與 基準線(Kijun-sen)上方或下方
2.轉換線(Tenkan-sen)與 基準線(Kijun-sen)交叉
3.價格突破或跌破 Leading Span B
4. Leading Span A 與 Leading Span B 交叉
我將上述訊號轉換成以下表達方式(看圖):
1.綠點:價格在轉換線(Tenkan-sen)與 基準線(Kijun-sen)之上
2.紅點:價格在轉換線(Tenkan-sen)與 基準線(Kijun-sen)之下
3.橘點或藍點:價格在轉換線(Tenkan-sen)與 基準線(Kijun-sen)之間
4.三角形符號:轉換線(Tenkan-sen)與 基準線(Kijun-sen)交叉,並且價格持續站穩 Kijun-sen 兩根K線(防止假突破)
5.B1 訊號:價格突破或跌破 Leading Span B
6.B2 訊號:Leading Span A 與 Leading Span B 交叉(這表達為雲的顏色是綠色還是紅色)
這隻指標的預設 Ichimoku Cloud 是關閉的,這樣圖表會更簡單,但如果你想檢查 Ichimoku Cloud ,可以隨時打開。
在你使用這支指標時,可以觀察圓點的變化:
1、向上趨勢反轉成向下趨勢(看圖)
你會看到的點順序是:綠點、橘點、紅點,除非價格突然跌破轉換線(Tenkan-sen)與 基準線(Kijun-sen),這時會直接看到紅點而沒有橘點。
2、向下趨勢反轉成向上趨勢(看圖)
你會看到的點順序是:紅點、藍點、綠點,除非價格突然突破轉換線(Tenkan-sen)與 基準線(Kijun-sen),這時會直接看到綠點而沒有藍點。
圓點通常是左側訊號,三角形介於左側與右側之間,而B1/B2則是右側訊號,我建議將倉位根據訊號顯示的前後順序分批下單,並且搭配 Supertrend來判斷趨勢,這也是為什麼這隻指標還加上了兩條 Supertrend 的原因。
為什麼不單純使用 Super Trend 指標?
因為 SuperTrend 只提供了單純的向上趨勢或向下趨勢,而不會顯示即將到來的反轉。
而加上動量圓點之後,當你看見橘點或藍點時,代表趨勢可能即將反轉。
因此這隻指標更能捕捉到趨勢的變化過程。
如果動量圓點跟 SuperTrend 指標顯示的趨勢不一樣怎麼辦?
如果 Super Trend 顯示向下趨勢,而你卻頻繁看到綠點跟藍點,代表趨勢很可能會向上反轉。
相反的,如果 Super Trend 顯示向上趨勢,而你卻頻繁看到紅點或橘點,代表很可能要向下反轉。
請記得,當你要建立倉位時,SuperTrend 的趨勢方向應該跟原點動量的方向是一致的,如果這兩個方向不一致,你需要更多的耐心來判別趨勢方向。
哪個訊號最重要?
使用這些訊號時必須記得,圓點屬於左側訊號,三角形屬於半左側半右側訊號,而B1/B2則是右側訊號,真的要我說的話,我認為B1/B2訊號最重要,因為B1的意義代表價格突破了雲層支撐或阻力,而B2在 Ichimoku Cloud 裡面的意義是雲朵(kumo)發生了反轉。
我針對這隻指標的幾個訊號對COINBASE:BTCUSDT進行了回測,B2訊號有較高的勝率。
為什麼使用了兩條 SuperTrend ?
因為我發現在市場經常會產生假突破,使用兩條 SuperTrend 並設置不同的 ATR 乘數,可以有效識別假突破。
最重要的提醒:
圓點的顯示、三角形訊號、B1/B2 這幾種訊號,它們出現的時間點是有順序關係的,趨勢轉變的過程,你一定會先看見圓點的變化,然後是出現三角形,最後出現B1/B2,這也是為什麼我建議你應該分批下單,如果圖表上的訊號沒有按照順序先後顯示,表示趨勢並沒有反轉,那麼一開始的分批下單,剛好可以降低你的虧損。
另外強烈建議,務必搞懂 Ichimoku Cloud 的公式,否則你可能會誤用這個指標。
我是如何使用這隻指標?
1.我會在看見三角形、B1、B2訊號時,分批建倉。
2.當你看到Supertrend改變趨勢,或是反向三角形時,可以考慮賣出。
3.三角形/B1/B2等訊號應該跟Supertrend是同一個方向時才可以進場。
4.當你看見綠點時,可以不用著急做多,可以再等一個三角形的訊號,因為三角形表示轉換線(Tenkan-sen)與 基準線(Kijun-sen)交叉,並且價格站穩在基準線(Kijun-sen)之上或之下兩天
5.如果你不確定某個地方為什麼會有三角形/B1/B2訊號,可以打在設定中打開Ichimoku Cloud自行確認。

EasyTrade - Trend CloudsHello Traders!
Starting from an idea of youtube channel "Daily Investments", we have developed this interesting indicator and prepared to be used with the EasyTrade software.
The idea behind this indicator is a combination of 3 SuperTrend suitably configured to overcome the classic problem of SuperTrends, false positives.
In addition to SuperTrends, we have added the ability to "filter trends" using a freely configurable moving average.
Good results are obtained with 15-minute timeframe (see video on credits).
Settings
Reaction : This value is used to adjust the classic "ATR Length" proportionally between the 3 SuperTrends.
Sensibility : This value is used to adjust the classic "Factor" proportionally between the 3 SuperTrends.
Use MA filter and Value : This options Enable/Disable the MA filter. You can change the period of the MA
R/R ratio : You can set your Risk/Reward ratio according to your trading rules.
Show Clouds : Show or hide the indicator cloud
Show Signals : Show or hide the dots on the bottom of the graphs that represents the BUY (Green Point), SELL (Red Point) signals.
Show Clouds : Show or hide Take profits (Purple line) and Stop Loss (Orange Line) value
Alerts
The alert signal generated by the indicator can be directly used by the EasyTrade software to directly execute trades on your preferred Broker.
Conclusion
We hope it will be useful, as it is for us, to simplify and automate your trading, but remember; always do your back-tests with your trading rules.
Suggestions or improvements are always welcome, if they make sense.
Credits
Daily Investments Video
EasyTrade Free Indicators and Software
Tri-State SupertrendTri-State Supertrend: Buy, Sell, Range
( Credits: Based on "Pivot Point Supertrend" by LonesomeTheBlue.)
Tri-State Supertrend incorporates a range filter into a supertrend algorithm.
So in addition to the Buy and Sell states, we now also have a Range state.
This avoids the typical "whipsaw" problem: During a range, a standard supertrend algorithm will fire Buy and Sell signals in rapid succession. These signals are all false signals as they lead to losing positions when acted on.
In this case, a tri-state supertrend will go into Range mode and stay in this mode until price exits the range and a new trend begins.
I used Pivot Point Supertrend by LonesomeTheBlue as a starting point for this script because I believe LonesomeTheBlue's version is superior to the classic Supertrend algorithm.
This indicator has two additional parameters over Pivot Point Supertrend:
A flag to turn the range filter on or off
A range size threshold in percent
With that last parameter, you can define what a range is. The best value will depend on the asset you are trading.
Also, there are two new display options.
"Show (non-) trendline for ranges" - determines whether to draw the "trendline" inside of a range. Seeing as there is no trend in a range, this is usually just visual noise.
"Show suppressed signals" - allows you to see the Buy/Sell signals that were skipped by the range filter.
How to use Tri-State Supertrend in a strategy
You can use the Buy and Sell signals to enter positions as you would with a normal supertrend. Adding stop loss, trailing stop etc. is of course encouraged and very helpful. But what to do when the Range signal appears?
I currently run a strategy on LDO based on Tri-State Supertrend which appears to be profitable. (It will quite likely be open sourced at some point, but it is not released yet.)
In that strategy, I experimented with different actions being taken when the Range state is entered:
Continue: Just keep last position open during the range
Close: Close the last position when entering range
Reversal: During the range, execute the OPPOSITE of each signal (sell on "buy", buy on "sell")
In the backtest, it transpired that "Continue" was the most profitable option for this strategy.
How ranges are detected
The mechanism is pretty simple: During each Buy or Sell trend, we record price movement, specifically, the furthest move in the trend direction that was encountered (expressed as a percentage).
When a new signal is issued, the algorithm checks whether this value (for the last trend) is below the range size set by the user. If yes, we enter Range mode.
The same logic is used to exit Range mode. This check is performed on every bar in a range, so we can enter a buy or sell as early as possible.
I found that this simple logic works astonishingly well in practice.
Pros/cons of the range filter
A range filter is an incredibly useful addition to a supertrend and will most likely boost your profits.
You will see at most one false signal at the beginning of each range (because it takes a bit of time to detect the range); after that, no more false signals will appear over the range's entire duration. So this is a huge advantage.
There is essentially only one small price you have to pay:
When a range ends, the first Buy/Sell signal you get will be delayed over the regular supertrend's signal. This is, again, because the algorithm needs some time to detect that the range has ended. If you select a range size of, say, 1%, you will essentially lose 1% of profit in each range because of this delay.
In practice, it is very likely that the benefits of a range filter outweigh its cost. Ranges can last quite some time, equating to many false signals that the range filter will completely eliminate (all except for the first one, as explained above).
You have to do your own tests though :)

Bollinger Bands & SuperTrend Strategy by Tradinggg HubThis TradingView Pinescript combines Bollinger Bands and a custom SuperTrend indicator to generate trading signals.
Bollinger Bands:
Bollinger Bands are a popular volatility indicator that consists of three lines:
* Basis: A simple moving average (SMA) of the price (default length is 20 periods).
* Upper Band: The basis plus a standard deviation multiplier (default is 2).
* Lower Band: The basis minus a standard deviation multiplier (default is 2).
These bands expand and contract as volatility increases or decreases, helping traders identify potential overbought and oversold conditions.
SuperTrend:
The SuperTrend indicator is a trend-following tool that aims to identify the direction of the price trend. It uses the Average True Range (ATR) to determine the volatility of the market and sets levels above and below the price to indicate potential trend reversals.
How the Strategy Works:
1. Bollinger Bands: The script plots Bollinger Bands around the price, providing insight into the current volatility and potential overbought or oversold conditions.
2. SuperTrend: The script calculates and plots a custom SuperTrend indicator based on user-defined ATR period and factor. It helps visualize the current trend direction and potential trend reversals.
3. Buy Signals: A buy signal is generated when the following conditions are met:
- The price crosses above the SuperTrend line.
- The price is above the Bollinger Bands basis line.
4. Sell Signals: A sell signal is generated when one of the following conditions is met:
- The price crosses below the SuperTrend line.
- The price is below the Bollinger Bands basis line.
Key Parameters:
* Bollinger Bands Length: The number of periods used to calculate the basis (SMA) of the Bollinger Bands.
* Bollinger Bands Multiplier: The factor used to calculate the standard deviation for the upper and lower bands.
* SuperTrend ATR Period: The number of periods used to calculate the Average True Range (ATR) for the SuperTrend.
* SuperTrend Factor: The factor used to determine the distance of the SuperTrend levels from the price.
Customization:
Feel free to experiment with different parameter values to optimize the strategy for your preferred asset and time frame.
Disclaimer:
This script is intended for educational and informational purposes only. It should not be considered as financial advice. Always conduct thorough research and consider your own risk tolerance before making any trading decisions.
Papercuts Super Trend MTF v02All my scripts are part of a suite called Papercuts .
This one uses one current timeframe supertrend and adds Four Automatic Higher Timeframe Supertrends based on those same parameters to help you determine larger trends while only needing a single chart. This works quite well on 5 and 15 minute charts and will look up in time. Confident trends can be identified by having two or more lines in the same direction.
When unified, the intensity of the glow should increase a trends confidence. Unify collapses the 3 highest timeframe supertrends into the first higher timeframe supertrend. Without Unify on, the overall trends are usually easier to see at just a glance. Higher timeframe supertrends can show support or resistance and act as stop loss limit ranges if you choose. Unify keeps things a bit cleaner and more compact.
V02 updated to fsecurity for no repainting and added a 3MA trend option as well.
Thanks to @Pinecoders for helping me better understand the security function!
Here is a view with Unify on....
Here is a view with Unify off...

RSI adjusted SuperTrendThis script is a variation on the SuperTrend.
The original function is from Tradingview, the difference is that I added a calculation with RSI
First 50 is subtracted from the RSI.
The absolute value of this number is on its turn divided with 100 or 50 (settings: 'Divide RSI value by')
-> this gives the 'aRSI', which is similar to a percentage
Finally a last calculation is made:
- lower * 'aRSI' is subtracted from the lower band
- upper * 'aRSI' is added to the upper band
If you want to see the Regular ST -> Toggle 'Show Regular ST'
Settings:
- factor (for both SuperTrends)
- ATR length (for SuperTrends)
- RSI length (for 'RSI adjusted SuperTrend')
Cheers!

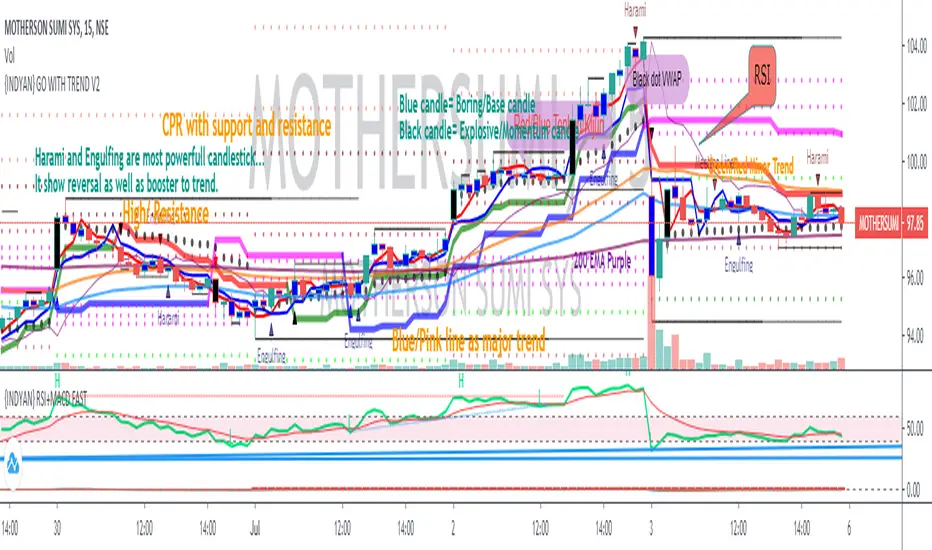
{INDYAN} GO WITH TREND V2This indicator has almost everything for intraday trading . There are two supertrends one with higher time frame and one at lower time frame, Due to which we can recognize reversal. If higher time frame supertrend is showing uptrend and minor is showing downtrend then better to avoid taking any trade in between. Both trend should be in same direction.
Tenkan and kijun is there to verify the trend authencity, check where the tenkan and kijun crossover is there or not at the time of reversal signal given by supertrends. It will boost trading chances.
Also VWAP is placed to know the current situation, If price is below VWAP go for sort if all other things match as above said.
HEMA LEMA is a EMA band and i found that it act as support and resistance, If price breaks channel with volume and sustain above/below for 2 candle close (TIMEFRAME AS SYMBOL).
Also placed FAST EMA to recognize the fast moving trend.
Pivot with CPR is there to trade on basis of CPR and Pivot.
For demand and supply traders, they can use blue and black candle for marking up zones. Blue is boring/base candle and Black is explosive candle.
I hope it will help my trader friends to recognize the trend and reversal.
Let me know if anything more we need to include or remove to make it better for everyone.
Happy Trading... Love INDYAN
#intraday
#hema-lema
#pivot
#cpr
#supertrend_reversal
#demandzone
#supplyzone
#tenkansen
#kijunsen
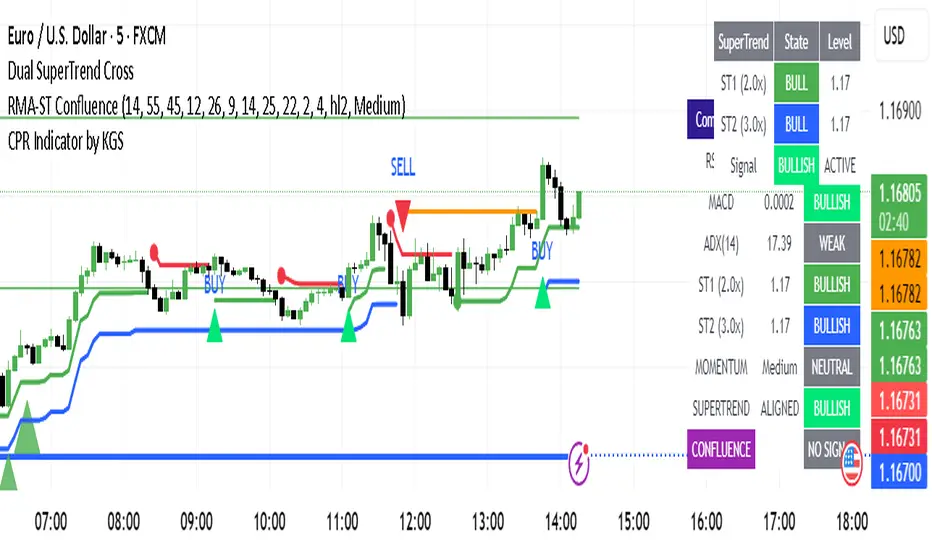
RSI-MACD-ADX + Dual SuperTrend ConfluenceKey Features:
Confluence Logic:
Buy signals only trigger when BOTH momentum AND SuperTrend are bullish
Sell signals only trigger when BOTH momentum AND SuperTrend are bearish
No conflicting signals - eliminates false entries when systems disagree
Signal Types:
STRONG BUY/SELL: Fresh momentum signal + Fresh SuperTrend alignment (maximum confidence)
Regular BUY/SELL: Momentum bullish + Both SuperTrends bullish (high confidence)
Customizable Settings:
RSI Momentum Zones: Bullish (>55), Bearish (<45), Neutral (45-55)
MACD Parameters: Fast (12), Slow (26), Signal (9)
ADX Trend Filter: Threshold (25) for trend strength
Dual SuperTrend: Two multipliers (2.0x and 3.0x) for confluence
Signal Strength: Choose between Weak/Medium/Strong momentum requirements
Visual Elements:
SuperTrend Lines: Both multipliers displayed with different colors
Background Highlighting: Green for bullish confluence, red for bearish
Signal Arrows: Large arrows for strong signals, smaller for regular
Comprehensive Table: Shows all component states and final confluence signal
Multi-Chart Widget [LuxAlgo]The Multi-Chart Widget tool is a comprehensive solution crafted for traders and investors looking to analyze multiple financial instruments simultaneously. With the capability to showcase up to three additional charts, users can customize each chart by selecting different financial instruments, and timeframes.
Users can add various widely used technical indicators to the charts such as the relative strength index, Supertrend, moving averages, Bollinger Bands...etc.
🔶 USAGE
The tool offers traders and investors a comprehensive view of multiple charts simultaneously. By displaying up to three additional charts alongside the primary chart, users can analyze assets across different timeframes, compare their performance, and make informed decisions.
Users have the flexibility to choose from various customizable chart types, including the recently added "Volume Candles" option.
This tool allows adding to the chart some of the most widely used technical indicators, such as the Supertrend, Bollinger Bands, and various moving averages.
In addition to the charting capabilities, the tool also features a dynamic statistic panel that provides essential metrics and key insights into the selected assets. Users can track performance indicators such as relative strength, trend, and volatility, enabling them to identify trends, patterns, and trading opportunities efficiently.
🔶 DETAILS
A brief overview of the indicators featured in the statistic panel is given in the sub-section below:
🔹Dual Supertrend
The Dual Supertrend is a modified version of the Supertrend indicator, which is based on the concept of trend following. It generates buy or sell signals by analyzing the asset's price movement. The Dual Supertrend incorporates two Supertrend indicators with different parameters to provide potentially more accurate signals. It helps traders identify trend reversals and establish trend direction in a more responsive manner compared to a single Supertrend.
🔹Relative Strength Index
The Relative Strength Index is a momentum oscillator that measures the speed and change of price movements. RSI oscillates between 0 and 100 and is typically used to identify overbought or oversold conditions in a market. Traditionally, RSI values above 70 are considered overbought, suggesting that the asset may be due for a reversal or correction, while RSI values below 30 are considered oversold, indicating potential buying opportunities.
🔹Volatility
Volatility in trading refers to the degree of variation or fluctuation in the price of a financial instrument, such as a stock, currency pair, or commodity, over a certain period of time. It is a measure of the speed and magnitude of price changes and reflects the level of uncertainty or risk in the market. High volatility implies that prices are experiencing rapid and significant movements, while low volatility suggests that prices are relatively stable and are not changing much. Traders often use volatility as an indicator to assess the potential risk and return of an investment and to make informed decisions about when to enter or exit trades.
🔹R-Squared (R²)
R-squared, also known as the coefficient of determination, is a statistical measure that indicates the proportion of the variance in the dependent variable that is predictable from the independent variable(s). In other words, it quantifies the goodness of fit of a regression model to the observed data. R-squared values range from %0 to %100, with higher values indicating a better fit of the model to the data. An R-squared of 100% means that all movements of a security are completely explained by movements in the index, while an R-squared value of %0 indicates that the model does not explain any of the variability in the dependent variable.
In simpler terms, in investing, a high R-squared, from 85% to 100%, indicates that the stock’s or fund’s performance moves relatively in line with the index. Conversely, a low R-squared (around 70% or less) indicates that the fund's performance tends to deviate significantly from the movements of the index.
🔶 SETTINGS
🔹Mini Chart(s) Generic Settings
Mini Charts Separator: This option toggles the visibility of the separator lines.
Number Of Bars: Specifies the number of bars to be displayed for each mini chart.
Horizontal Offset: Determines the distance at which the mini charts will be displayed from the primary chart.
🔹Mini Chart Settings: Top - Middle - Bottom
Mini Chart Top/Middle/Bottom: Toggle the visibility of the selected mini chart.
Symbol: Choose the financial instrument to be displayed in the mini chart. If left as an empty string, it will default to the current chart instrument.
Timeframe: This option determines the timeframe used for calculating the mini charts. If a timeframe lower than the chart's timeframe is selected, the calculations will be based on the chart's timeframe.
Chart Type: Selection from various chart types for the mini charts, including candles, volume candles, line, area, columns, high-low, and Heikin Ashi.
Chart Size: Determines the size of the mini chart.
Technical Indicator: Selection from various technical indicators to be displayed on top of the mini charts.
Note : Chart sizing is relative to other mini charts. For example, If all the mini charts are sized to x5 relative to each other, the result will be the same as if they were all sized as x1. This is because the relative proportions between the mini charts remain consistent regardless of their absolute sizes. Therefore, their positions and sizes relative to each other remain unchanged, resulting in the same visual representation despite the differences in absolute scale.
🔹Supertrend Settings
ATR Length: is the lookback length for the ATR calculation.
Factor: is what the ATR is multiplied by to offset the bands from price.
Color: color customization option.
🔹Moving Average Settings
Type: is the type of the moving average, available types of moving averages include SMA (Simple Moving Average), EMA (Exponential Moving Average), RMA (Root Mean Square Moving Average), HMA (Hull Moving Average), WMA (Weighted Moving Average), and VWMA (Volume Weighted Moving Average).
Source: Determines what data from each bar will be used in calculations.
Length: The time period to be used in calculating the Moving Average.
Color: Color customization option.
🔹Bollinger Bands Settings
Basis Type: Determines the type of Moving Average that is applied to the basis plot line.
Source: Determines what data from each bar will be used in calculations.
Length: The time period to be used in calculating the Moving Average which creates the base for the Upper and Lower Bands.
StdDev: The number of Standard Deviations away from the Moving Average that the Upper and Lower Bands should be.
Color: Color customization options for basis, upper and lower bands.
🔹Mini Chart(s) Panel Settings
Mini Chart(s) Panel: Controls the visibility of the panel containing the mini charts.
Dual Supertrend: Toggles the display of the evaluated dual super trend, based on the super trend settings provided below the option. The definitions for the options are the same as stated above for the super trend.
Relative Strength Index: Toggles the display of the evaluated RSI, based on the source and length settings provided below the option.
Volatility: Toggles the display of the calculated Volatility, based on the length settings provided below the option.
R-Squared: Toggles the display of the calculated R-Squared (R²), based on the length settings provided below the option.
🔶 LIMITATIONS
The tool allows users to display mini charts featuring various types of instruments alongside the primary chart instrument. However, there's a limitation: the selected primary chart instrument must have an ACTIVE market status. Alternatively, if the primary chart instrument is not active, the mini chart instruments must belong to the same exchange and have the same type as the primary chart instrument.
