Crypto Noodles ema S/R bands + supertrendSpecial combination of bands/lines for support and resistance in bear and bull market, also for catch spike , when price go out of them. Also integrated a supertrend indicator with green and red smoothed heikin ashi candles.
Cerca negli script per "supertrend"

Ultimate Algorithm Builder (Single Trend)Hello traders
This is a fantastic tool to detect convergence between the following indicators :
Overlay - meaning if the price close above/below the SMA 50
Trend Signal - to detect if the the DOW law is broken and predict a possible reversal - en.wikipedia.org/wiki/Dow_theory
In other words, it detects if the higher highs or lower lows sequence is broken
MACD or MACD Zero Lag
MM Cross - Cross of moving averages
Ichimoku - if the price closes below/above the cloud
Supertrend - used to detect polarity zones
TSI Shadow - propieraty indicator - URL :
It's ultra flexible as you check which indicator you need in your own strategy. That's why I called it the Ultimate Algorithm Builder
Enjoy
Dave

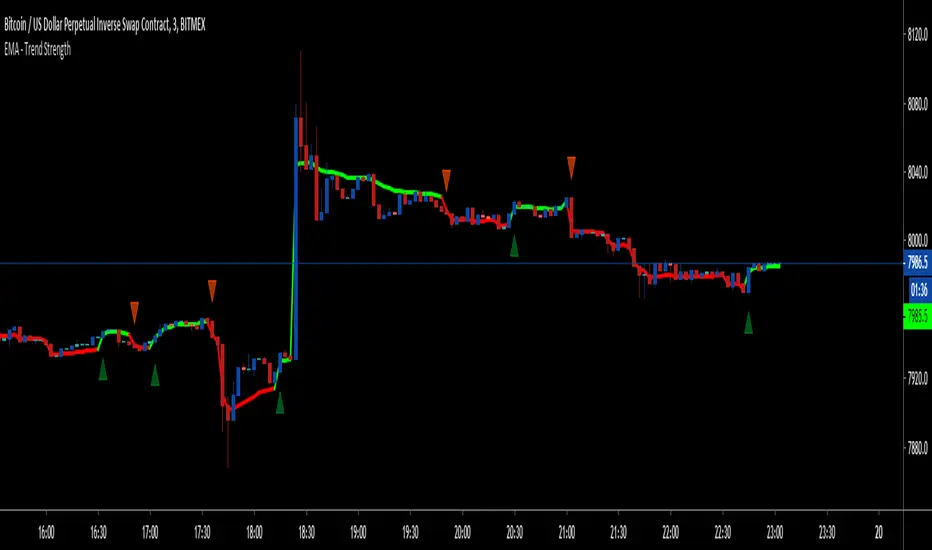
EMA - Trend Strength - 1m ScalperThis is a very special script based on volume, supertrend and ATR which works successfully on a 1m chart for bitmex.
ETH/USD
LTCM19
XRPM19
EOSM19
ADAM19
BCHM19
*private use only
Doji's/Engulfing Candles/Supertrend v1.0The Script locates Bearish/Bullish Engulfing Candlesticks and Dojis in combination with Supertrend v1.0.
Original Authors: HPotter + Rajandran R

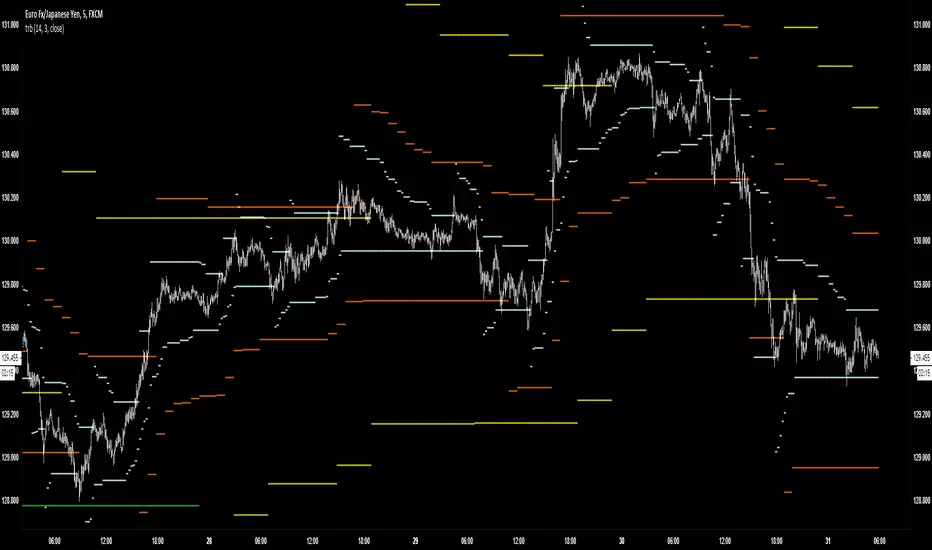
Improved Multi-Timeframe (MTF) TRL - plots same as live dataThese multi-timeframe True Range Levels use an improved calculation to accurately calculate the indicator's value with every new bar on the time frame your chart is set to. Previously the indicator only recalculated with every new update on the timeframe used in its security function. This means that this improved script plots the real, current value of your indicator across your chosen timeframes on your chart's resolution and no longer only plots only the indicator's monthly/weekly/daily/4 hour/ect closing value on the your chart.
This indicator was previously published as "True Range Bands" and uses a similar calculation the "SuperTrend" and "Volatility Stop" indicators.
Input values are fixed to their default (close,14,3) configuration to make this indicator's improved calculation possible.
When using "Plot Higher Timeframe?" the script will set the indicator to only plot its value in closest larger timeframe. This option overrides the two following options. For example, when using the daily resolution , only the weekly value will plot, or when using the one hour (60m) resolution, only the 4 hour (240m) value will plot.
The "Omit Higher Timeframes?" option will set the indicator to only plot starting from the 1/2/3/4/5/6/7th closest larger timeframe. For example, when using the daily resolution and this option set to 0, all values from the weekly resolution and up will plot, but if set to 1, all values from the monthly resolution and up will plot instead.
The "Plot Yearly/Quarterly/Monthly/Weekly/Daily/4 Hour/1 Hour/15 Minute/5 Minute?" options allow enabling/disabling a specific timeframe. All are enabled by default. For example, if you do not want the yearly value of the indicator to ever plot, you can disable the "Plot Yearly?" option.

PpSignal SuperTrendPpSignal supertrend channel is calculated with eldher super smooth system.
we added PpSignal CFB move average
RSI ST MTFUsing this script with some changes
I try to build the RSI SUPERTREND model with MTF function
I think its need more work to refine it but as idea its nice

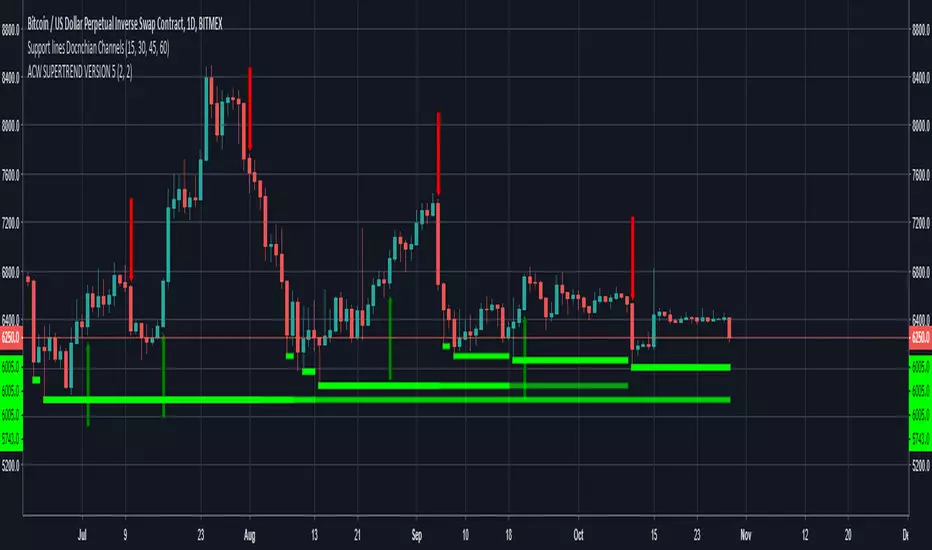
ACW SUPERTREND VERSION 5 Updated 29 October 2018//Author - PRINZ MASTER TRADER
//ACW SUPERTREND VERSION 5
numerous code changes that enable more accurate signal delivery and accuracy
removed false signals
enabled higher roe targets on higher time frames
works best on H2 with ethusd bitmex and all time frames on xbtusd bitmex
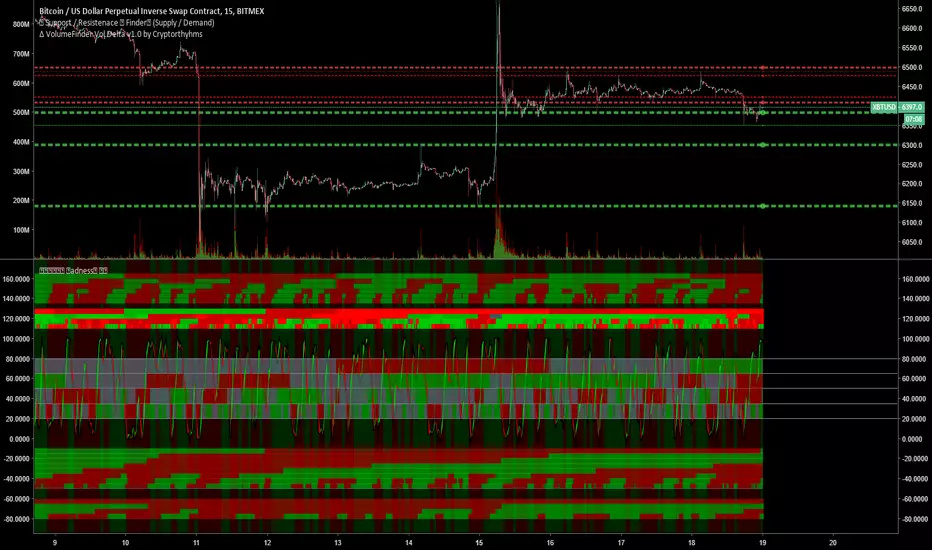
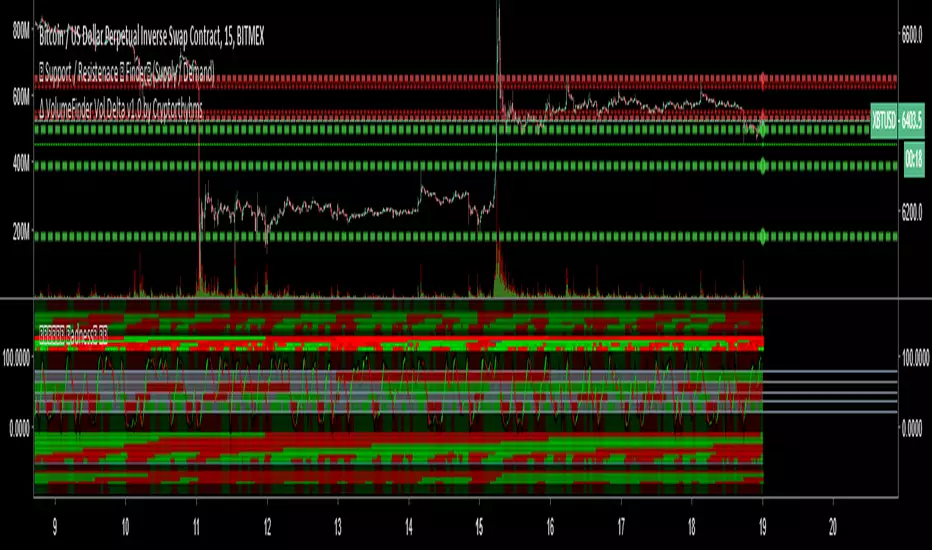
🕟𝕄🕗𝕋🕛𝔽 Madness MTF Grid by 🇨🇷🇾🇵🇹🇴🇷🇹🇭🇾🇭🇲🇸Here is a short description. This indicator being free will not have documentation for ALL things. Just the basics. There are 5 indicators included in it which I will not go into how each one works. There is ALOT of info on all the indicators included in here, just use google for that.
📊For each "row" of colored bands this represents one indicator. This is meant to be used on the 15m (or less) timeframe, and it looks up into higher TF's. It is meant to be maximized, so have this open in one tab and the chart on another. Dual Monitors are best. All options and Time frames are fully configurable inputs.
📈Indicators from top to bottom are:
1.)Polarity Filtration - 6 Timeframes
2.) Price Volume Trend - 4 Timeframes
3.) Stochastic RSI - 4 Timeframe Grid, and Current Timeframe in lines/ribbons
4.) MACD Crossovers - 8 Timeframes
5.)SuperTrend - 4 Timeframes
⏲Inside each larger "band" there are smaller rows. Each of these small rows represents one timeframe (30m, 60, 2h, 4h, etc) What timeframes you choose for them is completely configurable althought the current setup is already ideal to trade on 15m
⏲For these smaller rows the ones on top are highest timeframe(i.e. 4h) and the bottom small rows are lowest timeframe
⏲So each small row is like being able to check that indicator many timeframes at once. This will help you determine overall trends without switching to different timeframes on your chart all the time
📈The last piece of the puzzle is the background color. This background color is whether the chart is going up or down on the 1 hour heiken Ashi candle chart. Heiken ashi always shows up or down based on how they draw the candles, so its another useful trend indicator
👍If you enjoy MTF Madness all I ask in return is that you like the indicator and follow me on tradingview (profile here: www.tradingview.com)
❓If you have any questions, join us in the telegram chat in my signature!
Alpha Capital Wealth - Supertrend Any Crypto Any TimeframeAlpha Capital Wealth - Supertrend Any Crypto Any Timeframe

ACW SUPERTREND v3 as per testing
xbtusd works fine on 5,15,30 and above
100% accuracy on 30mins
ethusd works on any time frame
100% accuracy on 30mins
updated the code script to provide go long , go short 2/3 candles as compared to acw supertrend v2
script is still being updated

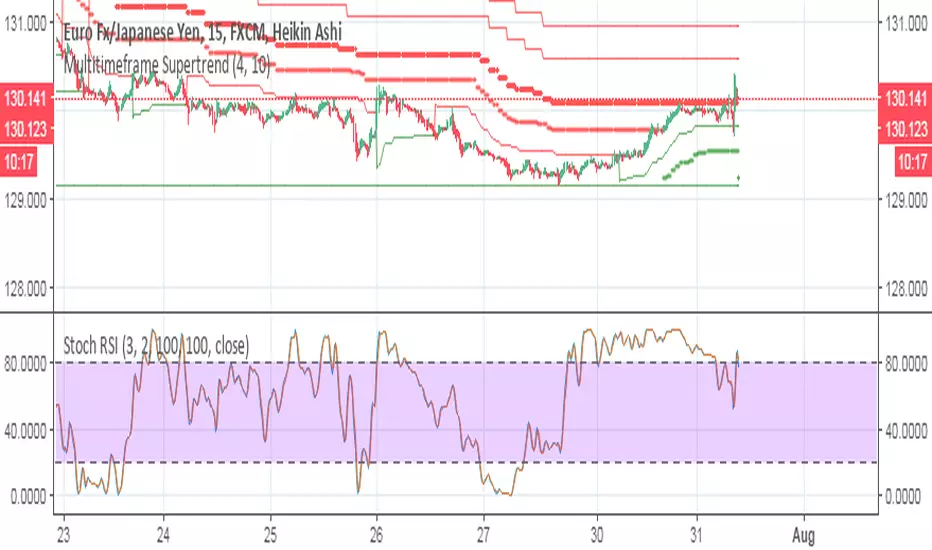
TRBTrue Range Bands; the 'Supertrend', also known as a volatility stop, using a 14 period length and 3x multiplier.
andrei_SHAB B/SAbility to add alert on the 'andrei_SHAB strategy' ...
Supertrend strategy with Atr modified to the Bollinger Bands and base on the Heikin Ashi candles ... It is not repaint

BottomFinder MTF Madness - 5x MTF Grid IndicatorsHello Again Trading View!
Bottom Finder Team here bringing another delicious indicator, this time to help spot those trends! This version is closed for Beta Testing with our subscribers only for the next few weeks. After beta improvements it will be released free to anyone who signs up as a free member on our site.
This is meant to be used on the 15m timeframe, and it looks up into higher TF's. It is meant to be maximized, so have this open in one tab and the chart on another. Dual Monitors are best. All options and Time frames are fully configurable inputs.
Indicators from top to bottom are:
1.)Polarity Filtration - 6 Timeframes
2.)Price Volume Trend - 4 Timeframes
3.)Stochastic RSI - 4 Timeframe Grid, and Current Timeframe in lines/ribbons
4.)MACD Crossovers - 8 Timeframes
5.)SuperTrend - 4 Timeframes
And last...
6.)Background Color indicator is up/down (green/red) price on 1 Hour Heiken Ashi candle chart.
No more swapping back and forth between timeframes!
For access to this and many other exclusive indicators - you can visit our telegram and ask about becoming a subscriber. All our paid indicators have a reasonable lifetime cap price. Once you reach it, indicator is yours for life - no more subscription.

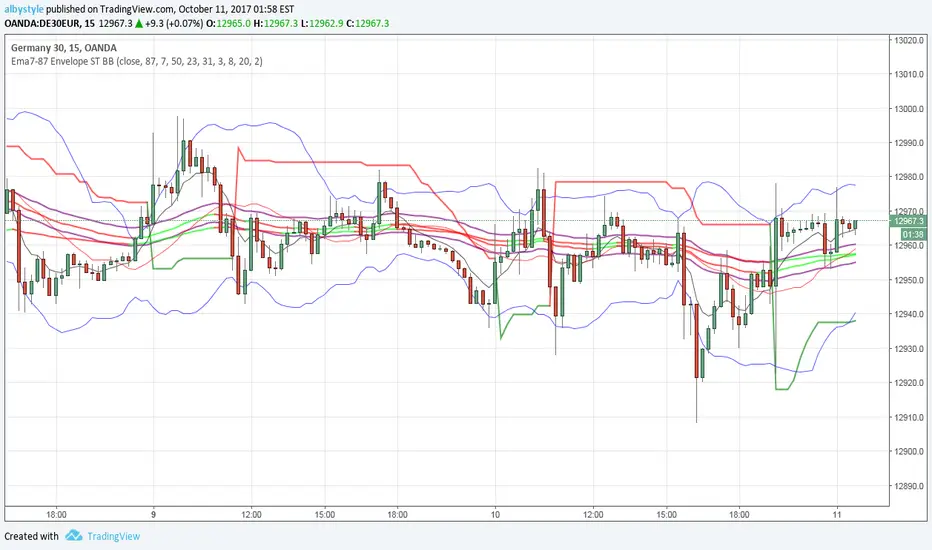
Ema7-87 Envelope Supertrend BBMulti-indicatore
Tecnica Media 87 (da abbinare ai Repulse)
Tecnica Canale di Medie
Ema 7, SuperTrend, Bande Bollinger (indicatori aggiuntivi)
Selezionare solo quello che serve per una maggiore pulizia del grafico

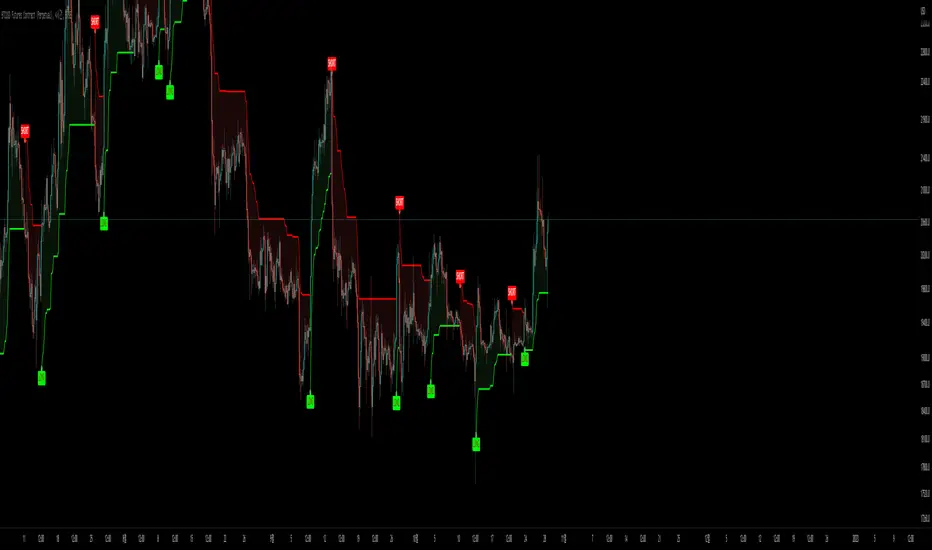
Makumup X Tesseract 2.2SuperTrend is one of the most common ATR based trailing stop indicators.
In this version you can change the ATR calculation method from the settings. Default method is RMA, when the alternative method is SMA .
The indicator is easy to use and gives an accurate reading about an ongoing trend. It is constructed with two parameters, namely period and multiplier. The default values used while constructing a superindicator are 10 for average true range or trading period and three for its multiplier.
The average true range (ATR) plays an important role in 'Supertrend' as the indicator uses ATR to calculate its value. The ATR indicator signals the degree of price volatility .
The buy and sell signals are generated when the indicator starts plotting either on top of the closing price or below the closing price. A buy signal is generated when the ‘Supertrend’ closes above the price and a sell signal is generated when it closes below the closing price.
It also suggests that the trend is shifting from descending mode to ascending mode. Contrary to this, when a ‘Supertrend’ closes above the price, it generates a sell signal as the colour of the indicator changes into red.
A ‘Supertrend’ indicator can be used on equities, futures or forex, or even crypto markets and also on daily, weekly and hourly charts as well, but generally, it fails in a sideways-moving market.
Trendz EMA VersionSupertrend + double EMA Indicator that calls out high quality trade ideas. This is the Logic:
✅ Buy only when SuperTrend turns bullish and 21 EMA > 50 EMA.
✅ Sell only when SuperTrend turns bearish and 21 EMA < 50 EMA.


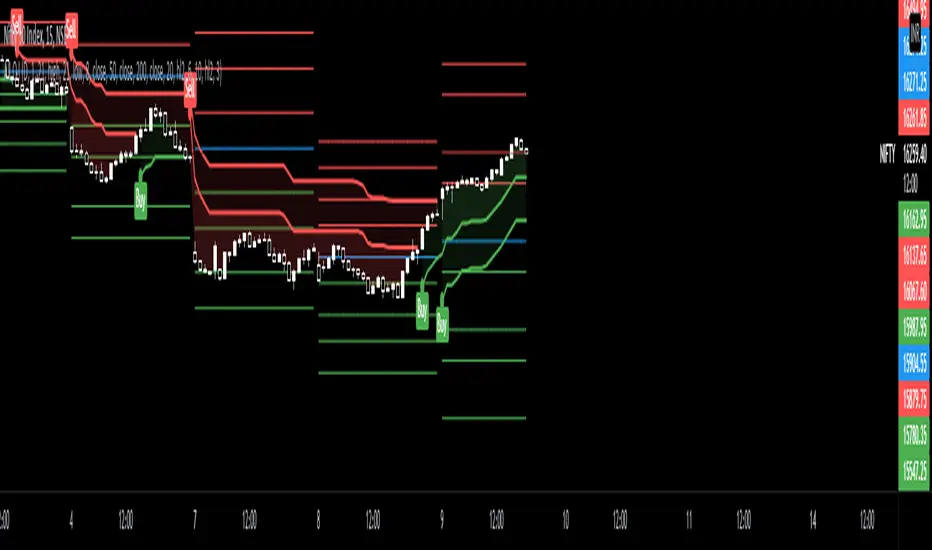
CPR PIVOT, 2ST, 5MA, VWAPSUPERTREND
2 supertrend with diffrent patameters.
MOVING AVERAGE RIBBON
5 differenT EMA
VWAP
Simple vwap with bands nothing special
every parameters and looks can be change
AND CPR