Strategy Builder With IndicatorsThis strategy script is designed for traders who enjoy building systems using multiple indicators.
Please note: This script does not include any built-in indicators. Instead, it works by referencing the plot outputs of the indicators you’ve already added to your chart.
For example, if you add a MACD and an ATR indicator to your chart, you can assign their plot values as inputs in the settings panel of this strategy.
• MACD as a trigger
• ATR as a filter
How Filters Work
Filters check whether certain conditions are met before a trade can be opened. For instance, if you set a filter like ATR > 30, then no trade will be executed unless that condition is true — even if the trigger fires.
All filters are linked, meaning every active filter must be satisfied for a trade to occur.
How Triggers Work
Triggers are what actually fire a trade signal — such as a moving average crossover or RSI breaking above a specific level. Unlike filters, triggers are independent. Only one active trigger needs to be true for the trade to execute.
Thanks to its modular structure, this strategy can be used with any indicator of your choice.
⸻
Risk Management Features
In the settings, you’ll find flexible options for:
• Stop Loss (SL)
• Trailing Stop Loss (TSL)
• Multi Take-Profit (TP)
These features enhance trade safety and let you tailor your risk management.
SL types available:
• Tick-based SL
• Percent-based SL
• ATR-based SL
Once you select your preferred SL type, you can fine-tune its distance using the offset field.
Trailing SL allows your stop to follow price as it moves in your favor — helping to lock in profits.
Multi-TP lets you take profits at two different levels, helping you secure gains while leaving room for extended moves.
Breakeven option is also available to automatically move your SL to entry after reaching a profit threshold.
⸻
How to Build a Solid Strategy
Let’s break down a good setup into three key components:
1. Trend Filter
Avoid trading against the trend — that’s like swimming against the current.
Use a filter like:
• Supertrend
• Momentum indicators
• Candlestick bias, etc.
Example: In this case, I used Supertrend and filtered for trades only if the price is above the uptrend line.
2. Trigger Condition
Once we confirm the trend is on our side, we need a trigger to execute at the right moment. This can be:
• RSI cross
• Candlestick patterns
• Trendline breaks
• Moving average crossovers, etc.
Example: I used RSI crossing above 50 as the entry trigger.
3. Risk Management
Even in the right trend at the right time — anything can happen. That’s why you should always define Stop Loss and Take Profit levels.
⸻
And there you have it! Your strategy is ready to backtest, refine, and deploy with alerts for live trading.
Questions or suggestions? Feel free to reach out
Cerca negli script per "supertrend"

KTUtilsLibrary "KTUtils"
Utility functions for technical analysis indicators, trend detection, and volatility confirmation.
MGz(close, length)
MGz
@description Moving average smoother used for signal processing
Parameters:
close (float) : float Price input (typically close)
length (int) : int Length of smoothing period
Returns: float Smoothed value
atrConf(length)
atrConf
@description Calculates Average True Range (ATR) for volatility confirmation
Parameters:
length (simple int) : int Length for ATR calculation
Returns: float ATR value
f(input)
f
@description Simple Moving Average with fixed length
Parameters:
input (float) : float Input value
Returns: float Smoothed average
bcwSMA(s, l, m)
bcwSMA
@description Custom smoothing function with weight multiplier
Parameters:
s (float) : float Signal value
l (int) : int Length of smoothing
m (int) : int Weighting multiplier
Returns: float Smoothed output
MGxx(close, length)
MGxx
@description Custom Weighted Moving Average (WMA) variant
Parameters:
close (float) : float Price input
length (int) : int Period length
Returns: float MGxx smoothed output
_PerChange(lengthTime)
_PerChange
@description Measures percentage price change over a period and range deviation
Parameters:
lengthTime (int) : int Period for change measurement
Returns: tuple Measured change, high deviation, low deviation
dirmov(len)
dirmov
@description Calculates directional movement components
Parameters:
len (simple int) : int Lookback period
Returns: tuple Plus and Minus DI values
adx(dilen, adxlen)
adx
@description Calculates Average Directional Index (ADX)
Parameters:
dilen (simple int) : int Length for DI calculation
adxlen (simple int) : int Length for ADX smoothing
Returns: float ADX value
trChopAnalysis()
trChopAnalysis
@description Identifies chop and trend phases based on True Range Bollinger Bands
Returns: tuple TR SMA, chop state, trending state
wtiAnalysis(haclose, close, filterValue)
wtiAnalysis
@description Wave Trend Indicator (WTI) with signal crossover logic
Parameters:
haclose (float) : float Heikin-Ashi close
close (float) : float Standard close
filterValue (simple int) : int Smoothing length
Returns: tuple WTI lines and direction states
basicTrend(hahigh, halow, close, open, filterValue)
basicTrend
@description Determines trend direction based on HA high/low and close
Parameters:
hahigh (float) : float Heikin-Ashi high
halow (float) : float Heikin-Ashi low
close (float) : float Standard close
open (float) : float Standard open
filterValue (simple int) : int Smoothing period
Returns: tuple Uptrend, downtrend flags
metrics(close, filterValue)
metrics
@description Common market metrics
Parameters:
close (float) : float Price input
filterValue (int) : int RSI smoothing length
Returns: tuple VWMA, SMA10, RSI, smoothed RSI
piff(close, trend_change)
piff
@description Price-Informed Forward Forecasting (PIFF) model for trend strength
Parameters:
close (float) : float Price input
trend_change (float) : float Change in trend
Returns: tuple Percent change, flags for trend direction
getMACD()
getMACD
@description Returns MACD, signal line, and histogram
Returns: tuple MACD line, Signal line, Histogram
getStoch()
getStoch
@description Returns K and D lines of Stochastic Oscillator
Returns: tuple K and D lines
getKDJ()
getKDJ
@description KDJ momentum oscillator
Returns: tuple K, D, J, Average
getBBRatio()
getBBRatio
@description Bollinger Band Ratio (BBR) and signal flags
Returns: tuple Basis, Upper, Lower, BBR, BBR Up, BBR Down
getSupertrend()
getSupertrend
@description Supertrend values and direction flags
Returns: tuple Supertrend, Direction, Up, Down

Exponential Trend [AlgoAlpha]OVERVIEW
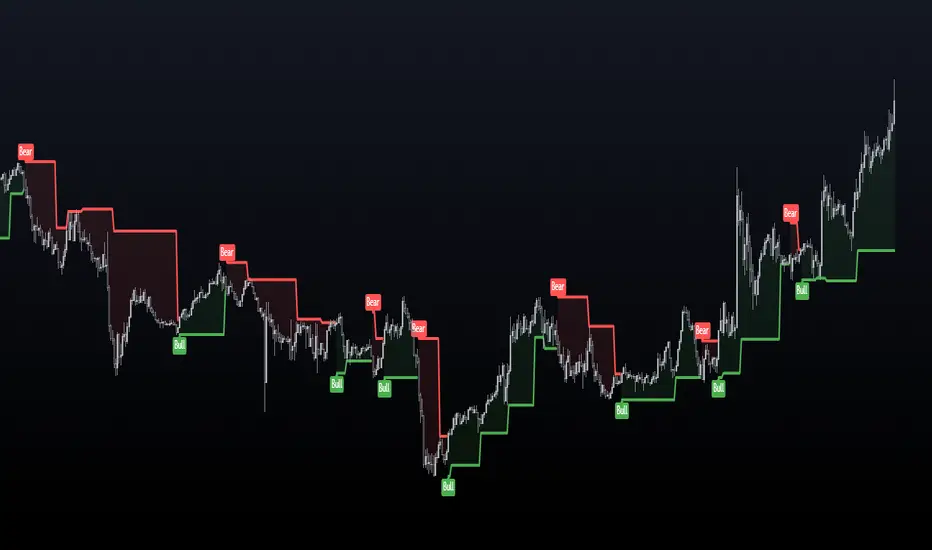
This script plots an adaptive exponential trend system that initiates from a dynamic anchor and accelerates based on time and direction. Unlike standard moving averages or trailing stops, the trend line here doesn't follow price directly—it expands exponentially from a pivot determined by a modified Supertrend logic. The result is a non-linear trend curve that starts at a specific price level and accelerates outward, allowing traders to visually assess trend strength, persistence, and early-stage reversal points through both base and volatility-adjusted extensions.
CONCEPTS
This indicator builds on the idea that trend-following tools often need dynamic, non-static expansion to reflect real market behavior. It uses a simplified Supertrend mechanism to define directional context and anchor levels, then applies an exponential growth function to simulate trend acceleration over time. The exponential growth is unidirectional and resets only when the direction flips, preserving trend memory. This method helps avoid whipsaws and adds time-weighted confirmation to trends. A volatility buffer—derived from ATR and modifiable by a width multiplier—adds a second layer to indicate zones of risk around the main trend path.
FEATURES
Exponential Trend Logic : Once a directional anchor is set, the base trend line accelerates using an exponential formula tied to elapsed bars, making the trend stronger the longer it persists.
Volatility-Adjusted Extension : A secondary band is plotted above or below the base trend line, widened by ATR to visualize volatility zones, act as soft stop regions or as a better entry point (Dynamic Support/Resistance).
Color-Coded Visualization : Clear green/red base and extension lines with shaded fills indicate trend direction and confidence levels.
Signal Markers & Alerts : Triangle markers indicate confirmed trend reversals. Built-in alerts notify users of bullish or bearish direction changes in real-time.
USAGE
Use this script to identify strong trends early, visually measure their momentum over time, and determine safe areas for entries or exits. Start by adjusting the *Exponential Rate* to control how quickly the trend expands—the higher the rate, the more aggressive the curve. The *Initial Distance* sets how far the anchor band is placed from price initially, helping filter out noise. Increase the *Width Multiplier* to widen the volatility zone for more conservative entries or exits. When the price crosses above or below the base line, a new trend is assumed and the exponential projection restarts from the new anchor. The base trend and its extension both shift over time, but only reset on a confirmed reversal. This makes the tool especially useful for momentum continuation setups or trailing stop logic in trending markets.

Strategy Stats [presentTrading]Hello! it's another weekend. This tool is a strategy performance analysis tool. Looking at the TradingView community, it seems few creators focus on this aspect. I've intentionally created a shared version. Welcome to share your idea or question on this.
█ Introduction and How it is Different
Strategy Stats is a comprehensive performance analytics framework designed specifically for trading strategies. Unlike standard strategy backtesting tools that simply show cumulative profits, this analytics suite provides real-time, multi-timeframe statistical analysis of your trading performance.
Multi-timeframe analysis: Automatically tracks performance metrics across the most recent time periods (last 7 days, 30 days, 90 days, 1 year, and 4 years)
Advanced statistical measures: Goes beyond basic metrics to include Information Coefficient (IC) and Sortino Ratio
Real-time feedback: Updates performance statistics with each new trade
Visual analytics: Color-coded performance table provides instant visual feedback on strategy health
Integrated risk management: Implements sophisticated take profit mechanisms with 3-step ATR and percentage-based exits
BTCUSD Performance
The table in the upper right corner is a comprehensive performance dashboard showing trading strategy statistics.
Note: While this presentation uses Vegas SuperTrend as the underlying strategy, this is merely an example. The Stats framework can be applied to any trading strategy. The Vegas SuperTrend implementation is included solely to demonstrate how the analytics module integrates with a trading strategy.
⚠️ Timeframe Limitations
Important: TradingView's backtesting engine has a maximum storage limit of 10,000 bars. When using this strategy stats framework on smaller timeframes such as 1-hour or 2-hour charts, you may encounter errors if your backtesting period is too long.
Recommended Timeframe Usage:
Ideal for: 4H, 6H, 8H, Daily charts and above
May cause errors on: 1H, 2H charts spanning multiple years
Not recommended for: Timeframes below 1H with long history
█ Strategy, How it Works: Detailed Explanation
The Strategy Stats framework consists of three primary components: statistical data collection, performance analysis, and visualization.
🔶 Statistical Data Collection
The system maintains several critical data arrays:
equityHistory: Tracks equity curve over time
tradeHistory: Records profit/loss of each trade
predictionSignals: Stores trade direction signals (1 for long, -1 for short)
actualReturns: Records corresponding actual returns from each trade
For each closed trade, the system captures:
float tradePnL = strategy.closedtrades.profit(tradeIndex)
float tradeReturn = strategy.closedtrades.profit_percent(tradeIndex)
int tradeType = entryPrice < exitPrice ? 1 : -1 // Direction
🔶 Performance Metrics Calculation
The framework calculates several key performance metrics:
Information Coefficient (IC):
The correlation between prediction signals and actual returns, measuring forecast skill.
IC = Correlation(predictionSignals, actualReturns)
Where Correlation is the Pearson correlation coefficient:
Correlation(X,Y) = (nΣXY - ΣXY) / √
Sortino Ratio:
Measures risk-adjusted return focusing only on downside risk:
Sortino = (Avg_Return - Risk_Free_Rate) / Downside_Deviation
Where Downside Deviation is:
Downside_Deviation = √
R_i represents individual returns, T is the target return (typically the risk-free rate), and n is the number of observations.
Maximum Drawdown:
Tracks the largest percentage drop from peak to trough:
DD = (Peak_Equity - Trough_Equity) / Peak_Equity * 100
🔶 Time Period Calculation
The system automatically determines the appropriate number of bars to analyze for each timeframe based on the current chart timeframe:
bars_7d = math.max(1, math.round(7 * barsPerDay))
bars_30d = math.max(1, math.round(30 * barsPerDay))
bars_90d = math.max(1, math.round(90 * barsPerDay))
bars_365d = math.max(1, math.round(365 * barsPerDay))
bars_4y = math.max(1, math.round(365 * 4 * barsPerDay))
Where barsPerDay is calculated based on the chart timeframe:
barsPerDay = timeframe.isintraday ?
24 * 60 / math.max(1, (timeframe.in_seconds() / 60)) :
timeframe.isdaily ? 1 :
timeframe.isweekly ? 1/7 :
timeframe.ismonthly ? 1/30 : 0.01
🔶 Visual Representation
The system presents performance data in a color-coded table with intuitive visual indicators:
Green: Excellent performance
Lime: Good performance
Gray: Neutral performance
Orange: Mediocre performance
Red: Poor performance
█ Trade Direction
The Strategy Stats framework supports three trading directions:
Long Only: Only takes long positions when entry conditions are met
Short Only: Only takes short positions when entry conditions are met
Both: Takes both long and short positions depending on market conditions
█ Usage
To effectively use the Strategy Stats framework:
Apply to existing strategies: Add the performance tracking code to any strategy to gain advanced analytics
Monitor multiple timeframes: Use the multi-timeframe analysis to identify performance trends
Evaluate strategy health: Review IC and Sortino ratios to assess predictive power and risk-adjusted returns
Optimize parameters: Use performance data to refine strategy parameters
Compare strategies: Apply the framework to multiple strategies to identify the most effective approach
For best results, allow the strategy to generate sufficient trade history for meaningful statistical analysis (at least 20-30 trades).
█ Default Settings
The default settings have been carefully calibrated for cryptocurrency markets:
Performance Tracking:
Time periods: 7D, 30D, 90D, 1Y, 4Y
Statistical measures: Return, Win%, MaxDD, IC, Sortino Ratio
IC color thresholds: >0.3 (green), >0.1 (lime), <-0.1 (orange), <-0.3 (red)
Sortino color thresholds: >1.0 (green), >0.5 (lime), <0 (red)
Multi-Step Take Profit:
ATR multipliers: 2.618, 5.0, 10.0
Percentage levels: 3%, 8%, 17%
Short multiplier: 1.5x (makes short take profits more aggressive)
Stop loss: 20%

AI Trend Momentum SniperThe AI Trend Momentum Sniper is a powerful technical analysis tool designed for day trading. This strategy combines multiple momentum and trend indicators to identify high-probability entry and exit points. The indicator utilizes a combination of Supertrend, MACD, RSI, ATR (Average True Range), and On-Balance Volume (OBV) to generate real-time signals for buy and sell opportunities.
Key Features:
Supertrend for detecting market direction (bullish or bearish).
MACD for momentum confirmation, highlighting changes in market momentum.
RSI to filter out overbought/oversold conditions and ensure high-quality trades.
ATR as a volatility filter to adjust for changing market conditions.
OBV (On-Balance Volume) to confirm volume strength and trend validity.
Dynamic Stop-Loss & Take-Profit based on ATR to manage risk and lock profits.
This indicator is tailored for intraday traders looking for quick market moves, especially in volatile and high liquidity assets like Bitcoin (BTC) and Ethereum (ETH). It helps traders capture short-term trends with efficient risk management tools.
How to Apply:
Set Your Chart: Apply the AI Trend Momentum Sniper to a 5-minute (M5) or 15-minute (M15) chart for optimal performance.
Buy Signal: When the indicator generates a green arrow below the bar, it indicates a buy signal based on positive trend and momentum alignment.
Sell Signal: A red arrow above the bar signals a sell condition when the trend and momentum shift bearish.
Stop-Loss and Take-Profit: The indicator automatically calculates dynamic stop-loss and take-profit levels based on the ATR value for each trade, ensuring proper risk management.
Alerts: Set up custom alerts for buy or sell signals, and get notified instantly when opportunities arise.
Best Markets for Use:
BTC/USDT, ETH/USDT – High liquidity and volatility.
Major altcoins with sufficient volume.
Avoid using it on low-liquidity assets where price action may become erratic.
Timeframes:
This indicator is best suited for lower timeframes (5-minute to 15-minute charts) to capture quick price movements in trending markets.

Machine Learning Moving Average [LuxAlgo]The Machine Learning Moving Average (MLMA) is a responsive moving average making use of the weighting function obtained Gaussian Process Regression method. Characteristic such as responsiveness and smoothness can be adjusted by the user from the settings.
The moving average also includes bands, used to highlight possible reversals.
🔶 USAGE
The Machine Learning Moving Average smooths out noisy variations from the price, directly estimating the underlying trend in the price.
A higher "Window" setting will return a longer-term moving average while increasing the "Forecast" setting will affect the responsiveness and smoothness of the moving average, with higher positive values returning a more responsive moving average and negative values returning a smoother but less responsive moving average.
Do note that an excessively high "Forecast" setting will result in overshoots, with the moving average having a poor fit with the price.
The moving average color is determined according to the estimated trend direction based on the bands described below, shifting to blue (default) in an uptrend and fushia (default) in downtrends.
The upper and lower extremities represent the range within which price movements likely fluctuate.
Signals are generated when the price crosses above or below the band extremities, with turning points being highlighted by colored circles on the chart.
🔶 SETTINGS
Window: Calculation period of the moving average. Higher values yield a smoother average, emphasizing long-term trends and filtering out short-term fluctuations.
Forecast: Sets the projection horizon for Gaussian Process Regression. Higher values create a more responsive moving average but will result in more overshoots, potentially worsening the fit with the price. Negative values will result in a smoother moving average.
Sigma: Controls the standard deviation of the Gaussian kernel, influencing weight distribution. Higher Sigma values return a longer-term moving average.
Multiplicative Factor: Adjusts the upper and lower extremity bounds, with higher values widening the bands and lowering the amount of returned turning points.
🔶 RELATED SCRIPTS
Machine-Learning-Gaussian-Process-Regression
SuperTrend-AI-Clustering

AadTrend [InvestorUnknown]The AadTrend indicator is an experimental trading tool that combines a user-selected moving average with the Average Absolute Deviation (AAD) from this moving average. This combination works similarly to the Supertrend indicator but offers additional flexibility and insights. In addition to generating Long and Short signals, the AadTrend indicator identifies RISK-ON and RISK-OFF states for each trade direction, highlighting areas where taking on more risk may be considered.
Core Concepts and Features
Moving Average (User-Selected Type)
The indicator allows users to select from various types of moving averages to suit different trading styles and market conditions:
Simple Moving Average (SMA)
Exponential Moving Average (EMA)
Hull Moving Average (HMA)
Double Exponential Moving Average (DEMA)
Triple Exponential Moving Average (TEMA)
Relative Moving Average (RMA)
Fractal Adaptive Moving Average (FRAMA)
Average Absolute Deviation (AAD)
The Average Absolute Deviation measures the average distance between each data point and the mean, providing a robust estimation of volatility.
aad(series float src, simple int length, simple string avg_type) =>
avg = // Moving average as selected by the user
abs_deviations = math.abs(src - avg)
ta.sma(abs_deviations, length)
This provides a volatility measure that adapts to recent market conditions.
Combining Moving Average and AAD
The indicator creates upper and lower bands around the moving average using the AAD, similar to how the Supertrend indicator uses Average True Range (ATR) for its bands.
AadTrend(series float src, simple int length, simple float aad_mult, simple string avg_type) =>
// Calculate AAD (volatility measure)
aad_value = aad(src, length, avg_type)
// Calculate the AAD-based moving average by scaling the price data with AAD
avg = switch avg_type
"SMA" => ta.sma(src, length)
"EMA" => ta.ema(src, length)
"HMA" => ta.hma(src, length)
"DEMA" => ta.dema(src, length)
"TEMA" => ta.tema(src, length)
"RMA" => ta.rma(src, length)
"FRAMA" => ta.frama(src, length)
avg_p = avg + (aad_value * aad_mult)
avg_m = avg - (aad_value * aad_mult)
var direction = 0
if ta.crossover(src, avg_p)
direction := 1
else if ta.crossunder(src, avg_m)
direction := -1
A chart displaying the moving average with upper and lower AAD bands enveloping the price action.
Signals and Trade States
1. Long and Short Signals
Long Signal: Generated when the price crosses above the upper AAD band,
Short Signal: Generated when the price crosses below the lower AAD band.
2. RISK-ON and RISK-OFF States
These states provide additional insight into the strength of the current trend and potential opportunities for taking on more risk.
RISK-ON Long: When the price moves significantly above the upper AAD band after a Long signal.
RISK-OFF Long: When the price moves back below the upper AAD band, suggesting caution.
RISK-ON Short: When the price moves significantly below the lower AAD band after a Short signal.
RISK-OFF Short: When the price moves back above the lower AAD band.
Highlighted areas on the chart representing RISK-ON and RISK-OFF zones for both Long and Short positions.
A chart showing the filled areas corresponding to trend directions and RISK-ON zones
Backtesting and Performance Metrics
While the AadTrend indicator focuses on generating signals and highlighting risk areas, it can be integrated with backtesting frameworks to evaluate performance over historical data.
Integration with Backtest Library:
import InvestorUnknown/BacktestLibrary/1 as backtestlib
Customization and Calibration
1. Importance of Calibration
Default Settings Are Experimental: The default parameters are not optimized for any specific market condition or asset.
User Calibration: Traders should adjust the length, aad_mult, and avg_type parameters to align the indicator with their trading strategy and the characteristics of the asset being analyzed.
2. Factors to Consider
Market Volatility: Higher volatility may require adjustments to the aad_mult to avoid false signals.
Trading Style: Short-term traders might prefer faster-moving averages like EMA or HMA, while long-term traders might opt for SMA or FRAMA.
Alerts and Notifications
The AadTrend indicator includes built-in alert conditions to notify traders of significant market events:
Long and Short Alerts:
alertcondition(long_alert, "LONG (AadTrend)", "AadTrend flipped ⬆LONG⬆")
alertcondition(short_alert, "SHORT (AadTrend)", "AadTrend flipped ⬇Short⬇")
RISK-ON and RISK-OFF Alerts:
alertcondition(risk_on_long, "RISK-ON LONG (AadTrend)", "RISK-ON LONG (AadTrend)")
alertcondition(risk_off_long, "RISK-OFF LONG (AadTrend)", "RISK-OFF LONG (AadTrend)")
alertcondition(risk_on_short, "RISK-ON SHORT (AadTrend)", "RISK-ON SHORT (AadTrend)")
alertcondition(risk_off_short, "RISK-OFF SHORT (AadTrend)", "RISK-OFF SHORT (AadTrend)")
Important Notes and Disclaimer
Experimental Nature: The AadTrend indicator is experimental and should be used with caution.
No Guaranteed Performance: Past performance is not indicative of future results. Backtesting results may not reflect real trading conditions.
User Responsibility: Traders and investors should thoroughly test and calibrate the indicator settings before applying it to live trading.
Risk Management: Always use proper risk management techniques, including stop-loss orders and position sizing.

FMS Suite [KFB Quant]FMS Suite
Overview
The FMS Suite is a powerful and adaptive trend and momentum analysis tool that leverages multiple technical indicators to deliver a comprehensive signal for market direction. This suite combines the strengths of the Aroon, DMI, RSI, Supertrend, and Trix indicators, offering traders a well-rounded perspective on market trends.
How It Works
The FMS Suite integrates five essential components to assess market behavior:
Aroon Indicator : Detects trend strength and direction by analyzing the frequency of recent highs and lows over multiple timeframes. Directional Movement Index (DMI) : Measures the direction and strength of trends, with an ADX component for better trend assessment. Relative Strength Index (RSI) : Evaluates market momentum by indicating overbought or oversold conditions, with signals derived from the 50-line. Supertrend : Utilizes ATR-based volatility measures to establish dynamic support and resistance levels, signaling potential trend changes. Trix : A triple-smoothed EMA oscillator that highlights trend reversals using rate-of-change dynamics.
Each component is calculated across three separate timeframes (fast, medium, and slow), which are then averaged to produce a final FMS Signal . Users can also apply signal smoothing to reduce noise and enhance clarity.
Key Features
Customizable Parameters : Adjust the lengths for each component (fast, medium, slow) to optimize the indicator's responsiveness to different markets. Signal Smoothing Options : Select from various smoothing methods, including SMA, EMA, DEMA, and WMA, to fine-tune the FMS signal. Visual Representation : The FMS Suite plots a histogram representing the raw signal and a smoother line for clearer trend visualization. The background color shifts dynamically to indicate long, short, or neutral conditions. Threshold-Based Alerts : Set your own long and short thresholds, tailoring the indicator to your trading strategy and market outlook. Informative Table Display : An integrated table provides an at-a-glance summary of the current FMS and smoothed FMS signals, along with their respective scores and market state.
How to Use
Trend Confirmation : Utilize the FMS histogram and smoothed signal to validate or challenge existing trend assumptions. Trade Entries and Exits : Identify potential buy (long) or sell (short) signals based on the relationship between the FMS signal and predefined thresholds. Strategy Customization : Fine-tune the indicator settings to align with your trading style, whether it’s short-term scalping or long-term trend following.
Important Considerations
Not Predictive : The FMS Suite does not predict future price movements and should be used in conjunction with other analysis methods. It is based on historical price data, and past performance is not indicative of future results. Settings and Backtesting : Experiment with different lengths and smoothing techniques to optimize performance for specific instruments and market conditions. Always backtest thoroughly.
Disclaimer: This tool is provided for informational and educational purposes only and should not be considered as financial advice. Always conduct your own research and consult with a licensed financial advisor before making any investment decisions.

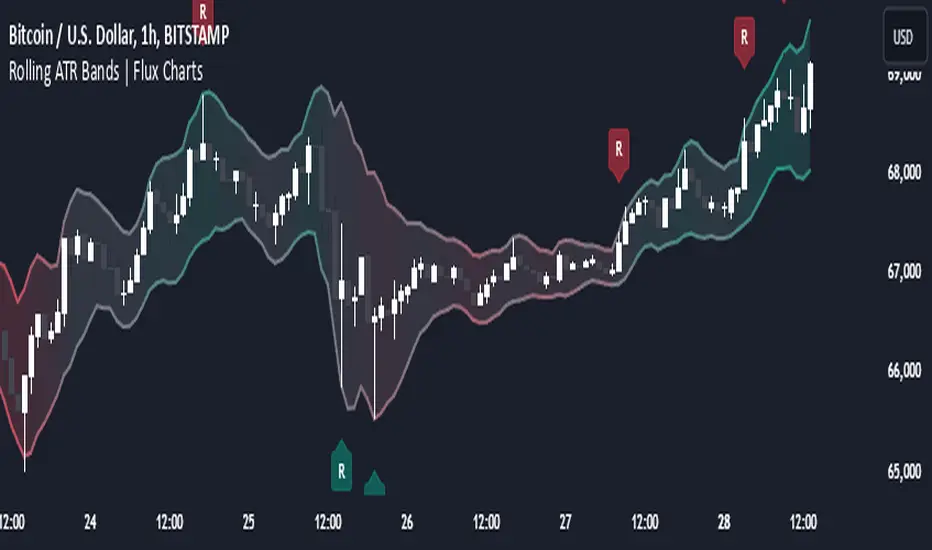
Rolling ATR Bands | Flux Charts💎 GENERAL OVERVIEW
Introducing the Rolling ATR Bands indicator! This indicator overlays adaptive bands around the price, using the Average True Range (ATR) to define dynamic support and resistance levels. The Rolling ATR Bands are color-coded to visually indicate potential trend strength, shifting between bearish, neutral, and bullish colors. This tool can help traders interpret price volatility, as well as identify probable trend changes, continuations, or reversals. For more information about the process, check the "HOW DOES IT WORK ?" section.
Features of the new Rolling ATR Bands:
ATR Bands With Customizable ATR Length & Multiplier
Smooth Trend Strength With Adjustable Smoothing Options
Color-coded bands Representing Bearish, Neutral, or Bullish Trends
Alerts for Retests & Breaks
Customizable Visuals
📌 HOW DOES IT WORK?
The Rolling ATR Bands indicator calculates the ATR based on the specified length and multiplier to form upper and lower bands around the price. These bands adapt with market volatility, widening during high volatility and contracting during lower volatility periods.
In addition, the indicator calculates a "trend strength" score by combining an interpolated RSI, Supertrend, and EMA crossover. This score is smoothed with a customizable length, and a color gradient is applied to visually denote the strength of bearish, neutral, or bullish conditions.
Here's how to interpret the bands:
Upper Band: Acts as dynamic resistance; when price approaches or touches it, this often suggests potential overbought conditions.
Lower Band: Acts as dynamic support; touching or nearing this band might indicate potential oversold conditions.
Color Shifts: Color changes indicate shifts in trend direction. For example, a green color suggests a bullish trend, while red hints at bearish tendencies.
🚩 UNIQUENESS
What sets the Rolling ATR Bands apart is the combined use of interpolated RSI, Supertrend, and EMA cross values, creating a weighted trend strength score. This integration allows for nuanced, color-coded visual cues that respond quickly to trend changes without excessive noise, offering traders an intuitive view of both trend direction and potential momentum. You can also set up alerts for retest & alerts for upper and lower bands to get informed of potential movements.
⚙️ SETTINGS
1. General Configuration
ATR Length : Controls the ATR calculation length for the bands.
Smoothing: Adjusts the trend strength smoothing to control sensitivity to trend changes.
ATR Multiplier : Sets the width of the bands by multiplying the ATR value.
Trend Smoothing : Higher settings will result in longer periods of time required for trend to change direction from bullish to bearish and vice versa.
CSVParser█ OVERVIEW
The library contains functions for parsing and importing complex CSV configurations (with a special simple syntax) into a special hierarchical object (of type objProps ) as follows:
Functions:
parseConfig() - reads CSV text into an objProps object.
toT() - displays the contents of an objProps object in a table form, which allows to check the CSV text for syntax errors.
getPropAr() - returns objProps.arS array for child object with `prop` key in mpObj map (or na if not found)
This library is handy in allowing users to store presets for the scripts and switch between them (see, e.g., my HTF moving averages script where users can switch between several preset configuations of 24 MA's across 5 timeframes).
█ HOW THE SCRIPT WORKS.
The script works as follows:
all values read from config text are stored as strings
Nested brackets in config text create a named nested objects of objProps0, ... , objProps9 types.
objProps objects of each level have the following fields:
- array arS for storing values without names (e.g. "12, 23" will be imported into a string array arS as )
- map mpS for storing items with names (e.g. "tf = 60, length = 21" will be imported as <"tf", "60"> and <"length", "21"> pairs into mpS )
- map mpObj for storing nested objects (e.g. "TF1(tf=60, length(21,50,100))" creates a <"TF1, objProps0 object> pair in mpObj map property of the top level object (objProps) , "tf=60" is stored as <"tf", "60"> key-value pair in mpS map property of a next level object (objProps0) and "length (...)" creates a <"length", objProps1> pair in objProps0.mpObj map while length values are stored in objProps1.arS array as strings. Every opening bracket creates a next level objProps object.
If objects or properties with duplicate names are encountered only the latest is imported
(e.g. for "TF1(length(12,22)), TF1(tf=240)" only "TF1(tf=240)" will be imported
Line breaks are not regarded as part of syntax (i.e. values are imported with line breaks, you can supply
symbols "(" , ")" , "," and "=" are special characters and cannot be used within property values (with the exception of a quoted text as a value of a property as explained below)
named properties can have quoted text as their value. In that case special characters within quotation marks are regarded as normal characters. Text between "=" and opening quotation mark as well as text following the closing quotation mark and until next property value is ignored. E.g. "quote = ignored "The quote" also ignored" will be imported as <"quote", "The quote">. Quotation marks within quotes must be excaped with "\" .
if a key names happens to be a multi-line then only first line containing non-space characters (trimmed from spaces) is taken as a key.
")," or ") ," and similar do not create an empty ("") array item while ",," does. (",)" creates an "" array item)
█ CSV CONFIGURATION SYNTAX
Unnamed values: just list them comma separated and they will be imported into arS of the object of the current level.
Named values: use "=" sign as follows: "property1=value1, property2 = value2"
Value of several objects: Use brackets after the name of the object ant list all object properties within the brackets (including its child objects if necessary). E.g. "TF1(tf =60, length(21,200), TF2(tf=240, length(50,200)"
Named and unnamed values as well as objects can go in any order. E.g. "12, tf=60, 21" will be imported as follows: "12", "21" will go to arS array and <"tf", "60"> will go to mpS maP of objProps (the top level object).
You can play around and test your config text using demo in this library, just edit your text in script settings and see how it is parsed into objProps objects.
█ USAGE RECOMMENDATIONS AND SAMPLE USE
I suggest the following approach:
- create functions for your UDT which can set properties by name.
- create enumerator functions which iterates through all the property names (supplied as a const string array) and imports their values into the object
█ SAMPLE USE
A sample use of this library can be seen in my Multi-timeframe 24 moving averages + BB+SAR+Supertrend+VWAP script where settings for the MAs across many timeframes are imported from CSV configurations (presets).
█ FULL LIST OF FUNCTIONS AND PROPERTIES
nzs(_s, nz)
Like nz() but for strings. Returns `nz` arg (default = "") if _s is na.
Parameters:
_s (string)
nz (string)
method init(this)
Initializes objProps obj (creates child maps and arrays)
Namespace types: objProps
Parameters:
this (objProps)
method toT(this, nz)
Outputs objProps to string matrices for further display using autotable().
Namespace types: objProps, objProps1, ..., objProps9
Parameters:
this (objProps/objProps1/..../objProps9)
nz (string)
Returns: A tuple - value, merge and color matrix (autotable() parameters)
method parseConfig(this, s)
Reads config text into objProps (unnamed values into arS, named into mpS, sub-levels into mpObj)
Namespace types: objProps
Parameters:
this (objProps)
s (string)
method getPropArS(this, prop)
Returns a string array of values for a given property name `prop`. Looks for a key `prop` in objProps.mpObj
if finds pair returns obj.arS, otherwise returns na. Returns a reference to the original, not a copy.
Namespace types: objProps, objProps1, ..., objProps8
Parameters:
this (objProps/objProps1/..../objProps8)
prop (string)
method getPropVal(this, prop, id)
Checks if there is an array of values for property `prop` and returns its `id`'s element or na if not found
Namespace types: objProps, objProps1, ..., objProps8
Parameters:
this (objProps/objProps1/..../objProps8) : objProps object containing array of property values in a child objProp object corresponding to propertty name.
prop (string) : (string) Name of the property
id (int) : (int) Id of the element to be returned from the array pf property values
objProps9 type
Object for storing values read from CSV relating to a particular object or property name.
Fields:
mpS (map) : (map() Stores property values as pairs
arS (array) : (string ) Array of values
objProps, objProps0, ... objProps8 types
Object for storing values read from CSV relating to a particular object or property name.
Fields:
mpS (map) : (map() Stores property values as pairs
arS (array) : (string ) Array of values
mpObj (map) : (map() Stores objProps objects containing properties's data as pairs

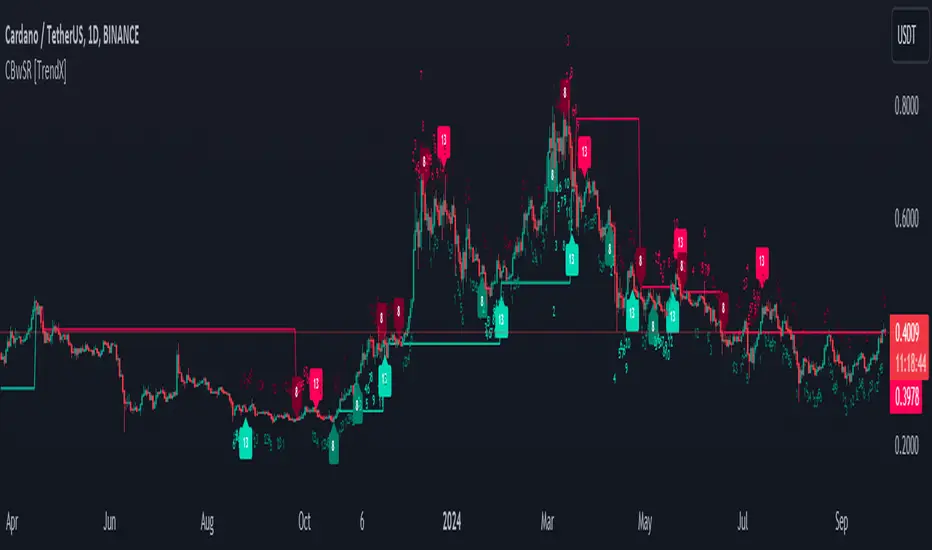
Consecutive Beta with Dynamic Support Resistance [TrendX_]The Consecutive Beta with Dynamic Support Resistance indicator is tailored to harness trend momentum, recognize top & bottom reversals, and leverage dynamic support and resistance levels. This indicator introduces a new approach by combining the concepts of beta, consecutive counting mechanisms, and the supertrend structure, making it a fresh tool for understanding market trends and patterns.
💎 KEY FEATURES
Candle’s Relative Valuation Using Beta: The core of the TrendX indicator lies in using beta to gauge volatility. Beta serves as a measure of how an asset moves relative to the broader market, helping traders understand whether the asset is more or less volatile in different market conditions.
Counting Techniques for Momentum & Reversals: By employing counting techniques to reach a significant threshold, the indicator can measure trend momentum and spot top/bottom reversals.
Dynamic Support & Resistance: This feature relies on consecutive beta counting to dynamically adapt support and resistance levels. These levels are key in predicting potential entry and exit points following the general trend direction.
⚙️ USAGES
Initial Start and Distance: Customize the initial start point and distance for better control over trading strategies. For instance, starting at 1 and using an even distance of 2 will yield odd consecutive counting series;
Phase 1 Completion for Reversal Strategies: This initial phase focuses on identifying short-term reversals;
Phase 2 Completion for Support/Resistance: A support level forms after completing two bullish phases, while a resistance level forms after completing two bearish phases. This structure helps in clarifying trend directions when breakout these key levels.
🔎 BREAKDOWN
Phase 1:
The indicator counts consecutive candles that show a higher Beta than in previous periods over a given length. The completion of countings only succeed when the whole series is uninterruptedly counted, or else countings will be canceled. This strict adherence to consecutive counts serves to ensure that only strong, sustained momentum is recognized and also helps filter out noise, weak signals and establish the initial direction catalyst, setting up for further trend analysis.
Phase 2:
After Phase 1 ends, the Phase 2 counting mechanism begins. This phase focuses on bottom reversals through consecutive higher beta candles, and top reversals by counting lower beta candles. At this stage, interuptions will not cancel the counting process. The ability to continue counting in Phase 2 allows for a broader perspective on market behavior. Even if individual candles do not consistently meet the criteria for consecutive counts, the cumulative effect of higher or lower beta readings over time provides valuable insights into market sentiment and trend direction.
Dynamic Support & Resistance:
After Phase 2 completion, if the average of high, low, and close surpasses both recent support and resistance levels from Phase 2, an uptrend is confirmed, which the support level is displayed. If it drops below these levels, a downtrend is indicated, where resistance is displayed instead of support. The result is displayed through a colored supertrend-line (teal for uptrend, red for downtrend).
DISCLAIMER
This indicator is not financial advice, it can only help traders make better decisions. There are many factors and uncertainties that can affect the outcome of any endeavor, and no one can guarantee or predict with certainty what will occur. Therefore, one should always exercise caution and judgment when making decisions based on past performance.
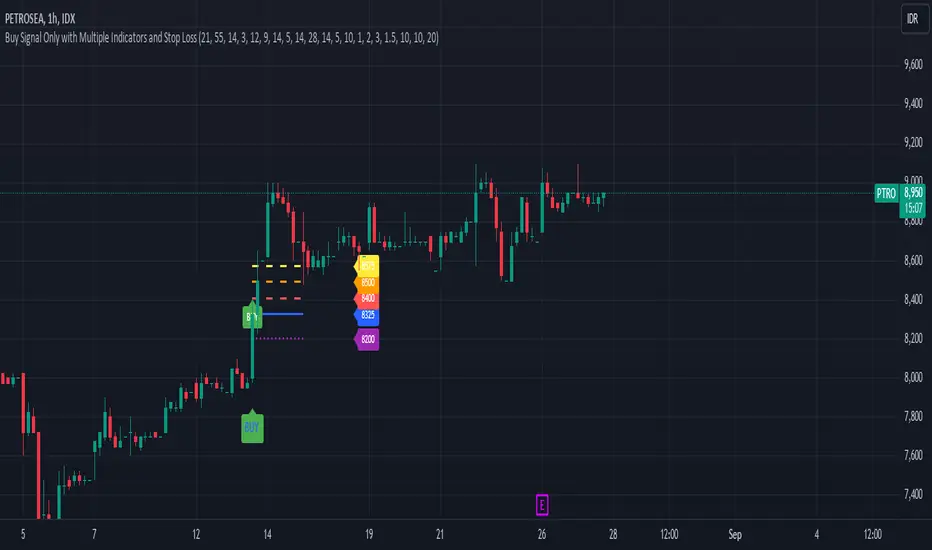
Buy Signal Only with Multiple Indicators and Stop LossDescription: This custom Pine Script indicator is designed to help traders identify optimal buy signals using a combination of multiple technical indicators. It provides visual markers for entry points, take profit levels, and stop loss, offering a comprehensive tool for decision-making.
Features:
Buy Signal: Generates a buy signal based on a combination of EMA Cloud, SuperTrend, Zero Lag MACD, QQE, Volume Oscillator, and ATR Bands.
Entry Point: Displays a horizontal line at the entry price with a price label, extended to the right for visibility.
Take Profit Levels:
1% Take Profit: A dashed red line with a price label for the first take profit level.
2% Take Profit: A dashed orange line with a price label for the second take profit level.
Stop Loss: A dotted purple line with a price label to indicate the stop loss level set at 3%.
Parameters:
EMA Short Length: Adjust the period for the short EMA.
EMA Long Length: Adjust the period for the long EMA.
ATR Length: Set the length for ATR calculation.
Multiplier: Define the factor for the SuperTrend calculation.
MACD Length and Signal Length: Configure lengths for MACD and its signal line.
RSI Length and Smooth Length: Set parameters for RSI and its smoothing.
Volume Lengths: Customize lengths for the volume oscillator.
ATR Band Length and Multiplier: Set parameters for ATR Bands.
Delay Bars: Specify the number of bars to wait before showing another buy signal.
Take Profit Percentages: Adjust percentages for the 1% and 2% take profit levels.
Stop Loss Percentage: Set the stop loss percentage.
Line Extension Length: Define the number of bars to extend lines.
Right Offset Bars: Configure how many bars to offset labels and lines to the right.
Usage:
Identify Buy Opportunities: The indicator helps identify potential buy signals using multiple indicators.
Manage Trades: Visualize entry points, take profit targets, and stop loss levels to manage trades effectively.
Customization: Tailor the indicator to fit your trading strategy by adjusting the parameters.
Notes:
This is what we call version 1.
Ensure that the indicator's settings align with your trading strategy and market conditions.Use in conjunction with other analysis tools for a comprehensive trading approach.
NSE Option Straddle Candle Chart
'NSE Option Straddle Candle Chart' plot a straddle chart of the mentioned strike.
Straddle means combine price of a call price and a put price.
User has 4 inputs :
1 : Spot Symbol
2 : Expiry date
3 : Straddle Strikes
4 : Ema Length
5 : Supertrend Inputs
How to use :
1 : Trade need to know first what is a straddle. If ATM straddle price is 405, than it means market is likely to close within 405 points up or down at the expiry.
2 : Straddle is traded on pairs only
3 : If trader sells a straddle than , straddle price should move down. For there reference supertrend and moving average is plotted on chart
4 : Both this indicators helps trade to identify the trend , hence predict market.
5 : Options are dying assite , so is straddle , so prefer selling straddle instead of buying.

Machine Learning: Multiple Logistic Regression
Multiple Logistic Regression Indicator
The Logistic Regression Indicator for TradingView is a versatile tool that employs multiple logistic regression based on various technical indicators to generate potential buy and sell signals. By utilizing key indicators such as RSI, CCI, DMI, Aroon, EMA, and SuperTrend, the indicator aims to provide a systematic approach to decision-making in financial markets.
How It Works:
Technical Indicators:
The script uses multiple technical indicators such as RSI, CCI, DMI, Aroon, EMA, and SuperTrend as input variables for the logistic regression model.
These indicators are normalized to create categorical variables, providing a consistent scale for the model.
Logistic Regression:
The logistic regression function is applied to the normalized input variables (x1 to x6) with user-defined coefficients (b0 to b6).
The logistic regression model predicts the probability of a binary outcome, with values closer to 1 indicating a bullish signal and values closer to 0 indicating a bearish signal.
Loss Function (Cross-Entropy Loss):
The cross-entropy loss function is calculated to quantify the difference between the predicted probability and the actual outcome.
The goal is to minimize this loss, which essentially measures the model's accuracy.
// Error Function (cross-entropy loss)
loss(y, p) =>
-y * math.log(p) - (1 - y) * math.log(1 - p)
// y - depended variable
// p - multiple logistic regression
Gradient Descent:
Gradient descent is an optimization algorithm used to minimize the loss function by adjusting the weights of the logistic regression model.
The script iteratively updates the weights (b1 to b6) based on the negative gradient of the loss function with respect to each weight.
// Adjusting model weights using gradient descent
b1 -= lr * (p + loss) * x1
b2 -= lr * (p + loss) * x2
b3 -= lr * (p + loss) * x3
b4 -= lr * (p + loss) * x4
b5 -= lr * (p + loss) * x5
b6 -= lr * (p + loss) * x6
// lr - learning rate or step of learning
// p - multiple logistic regression
// x_n - variables
Learning Rate:
The learning rate (lr) determines the step size in the weight adjustment process. It prevents the algorithm from overshooting the minimum of the loss function.
Users can set the learning rate to control the speed and stability of the optimization process.
Visualization:
The script visualizes the output of the logistic regression model by coloring the SMA.
Arrows are plotted at crossover and crossunder points, indicating potential buy and sell signals.
Lables are showing logistic regression values from 1 to 0 above and below bars
Table Display:
A table is displayed on the chart, providing real-time information about the input variables, their values, and the learned coefficients.
This allows traders to monitor the model's interpretation of the technical indicators and observe how the coefficients change over time.
How to Use:
Parameter Adjustment:
Users can adjust the length of technical indicators (rsi_length, cci_length, etc.) and the Z score length based on their preference and market characteristics.
Set the initial values for the regression coefficients (b0 to b6) and the learning rate (lr) according to your trading strategy.
Signal Interpretation:
Buy signals are indicated by an upward arrow (▲), and sell signals are indicated by a downward arrow (▼).
The color-coded SMA provides a visual representation of the logistic regression output by color.
Table Information:
Monitor the table for real-time information on the input variables, their values, and the learned coefficients.
Keep an eye on the learning rate to ensure a balance between model adjustment speed and stability.
Backtesting and Validation:
Before using the script in live trading, conduct thorough backtesting to evaluate its performance under different market conditions.
Validate the model against historical data to ensure its reliability.

Kshitij Malve - Relative Strength CustomPurpose: This indicator attempts to gauge the relative strength of a stock compared to a broader index (like the Nifty 50) and provide actionable buy, sell, or hold signals. It is designed to be used for shorter-term, intraday trading.
Key Features
Signal Focus: Generates color-coded visual cues to aid in decision-making:
Green: Indicates a potential buy signal
Red: Indicates a potential sell signal
Blue: Suggests maintaining the current position
Trend and Volatility: Combines:
The SuperTrend indicator to determine the underlying price trend (uptrend vs. downtrend).
Average True Range (ATR) to assess recent market volatility.
Strength Check: Incorporates the Relative Strength Index (RSI) to measure if the stock is overbought or oversold relative to the broader index.
Logic: (Note: This description assumes the logic you implemented – adapt if your conditions differ)
The indicator's core logic suggests:
Buy Signal: RSI oversold, market in an uptrend, increased volatility, and price above a short-term moving average.
Sell Signal: RSI overbought, market in a downtrend, increased volatility, and price below a short-term moving average.
How to Use
Add the indicator to a chart of the stock you want to analyze. It will appear in a separate pane below the price chart.
Customize input settings if desired (lengths of RSI, SuperTrend, etc.). Consider aligning these with your timeframe and the characteristics of the specific stock and index.
Observation: Look for green (buy), red (sell), and blue (hold) signals.
Important Notes
Confirmation Tool: This indicator works best in conjunction with other forms of technical and fundamental analysis for a comprehensive trading strategy.
Market-Specific: The underlying logic may need to be tailored further for specific stock and index combinations to provide the most reliable signals.
Disclaimer: Financial markets are risky. Thoroughly backtest and understand the risk profile of any strategy relying on this indicator before using real capital.

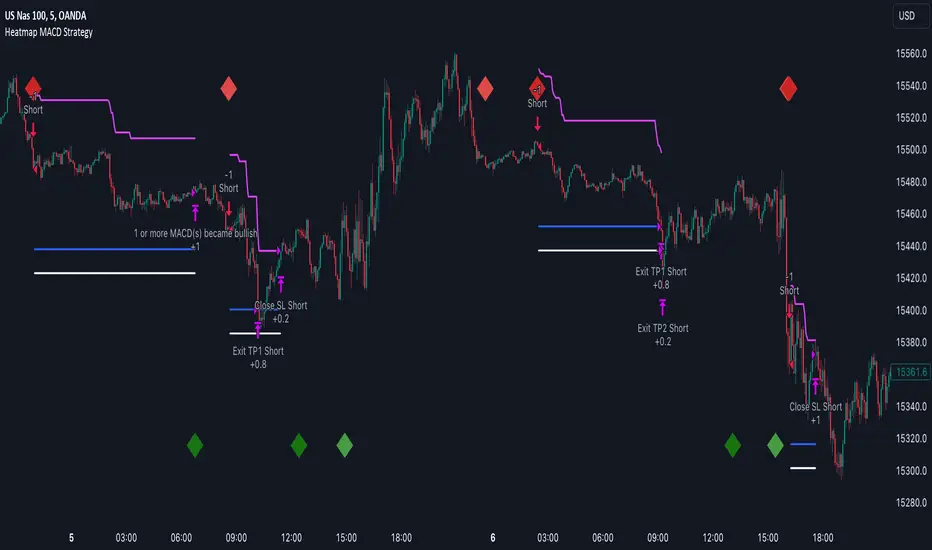
Heatmap MACD StrategyHello traders
A customer gave me the idea indirectly after I made an update to that script:
Supertrend MTF Heatmap
Important Notes
The backtest results aren't relevant for this educational script publication.
I used realistic backtesting data but didn't look too much into optimizing the results, as this isn't the point of why I'm publishing this script.
I wanted to showcase that any Heatmap script can be converted into a strategy.
The strategy default settings are:
Initial Capital: 100000 USD
Position Size: 1 contract
Commission Percent: 0.075%
Slippage: 1 tick
No margin/leverage used
For example, those are realistic settings for trading CFD indices with low timeframes, but not the best possible settings for all assets/timeframes.
Concept
The Heatmap MACD Strategy allows selecting one MACD in five different timeframes.
You'll get an exit signal whenever one of the 5 MACDs changes direction.
Then, the strategy re-enters whenever all the MACDs are in the same direction again.
It takes:
long trades when all the 5 MACD histograms are bullish
short trades when all the 5 MACD histograms are bearish
You can select the same timeframe multiple times if you don't need five timeframes.
For example, if you only need the 30min, the 1H, and 2H, you can set your timeframes as follow:
30m
30m
30m
1H
2H
Risk Management Features
Nothing too fancy
All the features below are pips-based
Stop-Loss
Trailing Stop-Loss
Stop-Loss to Breakeven after a certain amount of pips has been reached
Take Profit 1st level and closing X% of the trade
Take Profit 2nd level and close the remaining of the trade
What's next?
I'll publish this script's open-source Pineconnector, ProfitView, and AutoView versions for educational purposes.
Thank you
Dave
Lower timeframe chartHi all!
I've made this script to help with my laziness (and to help me (and now you) with efficiency). It's purpose is to, without having to change the chart timeframe, being able to view the lower timeframe bars (and trend) within the last chart bar. The defaults are just my settings (It's based on daily bars), so feel free to change them and maybe share yours! It's also based on stocks, which have limited trading hours, but if you want to view this for forex trading I suggest changing the 'lower time frame' to a higher value since it has more trading hours.
The script prints a label chart (ASCII) based on your chosen timeframe and the trend, based on @KivancOzbilgic script SuperTrend The printed ASCII chart has rows (slots) that are based on ATR (14 bars) and empty gaps are removed. The current trend is decided by a percentage of bars (user defined but defaults to 80%, which is really big but let's you be very conservative in defining a trend to be bullish. Set to 50% to have the trend being decided equally or lower to be more conservative in defining a trend to be bearish) that must have a bullish SuperTrend, it's considered to be bearish otherwise. Big price range (based on the ATR for 14 bars) and big volume (true if the volume is bigger than a user defined simple moving average (defaults to 20 bars)) can be disabled for faster execution.
The chart displayed will consist of bars and thicker bars that has a higher volume than the defined simple moving average. The bars that has a 'big range' (user defined value of ATR (14 days) factor that defaults to 0.5) will also have a wick. The characters used are the following:
Green bar = ┼
Green bar with large volume = ╪
Green bar wick = │
Red bar = ╋
Red bar with large volume = ╬
Red bar wick = ┃
Bar with no range = ─
Bar with no range and high volume = ═
Best of trading!

Bull Bear Correlation Tracker PaneThe Bull Bear Correlation Tracker is a versatile indicator designed to help traders identify the direction and strength of market trends by comparing the price action of multiple assets. It is particularly useful for those who are familiar with the carry trade principle, as it can detect when positively or negatively correlated assets move in favor or against the asset being traded. This indicator can be used for various markets, including crypto and forex, by simply adjusting the default options.
Key features of the Bull Bear Correlation Tracker include:
Multiple methods for determining trend direction: Supertrend, Pivot Point SuperTrend by LonesomeTheBlue, MACD - Zero Cross, and MACD - Grow/Shrink. These methods help traders identify the primary trend direction and potential trade opportunities.
Optional slow trend display for additional insights into market trends, allowing traders to analyze both short-term and long-term trends simultaneously.
Supports up to three symbols, enabling traders to analyze multiple assets simultaneously and better understand their correlation.
Assumed correlation settings to test traders' hypotheses about asset relationships, allowing traders to make informed decisions about potential correlations between different assets.
Customizable correlation period and smoothing settings to fine-tune the indicator's performance, providing traders with the ability to optimize the indicator based on their preferred trading style and market conditions.
Market hours filter to focus on specific trading hours, ensuring that the indicator only displays data during the hours specified.
Customizable color settings for easy visualization of trends, helping traders quickly identify the direction and strength of market trends.
Correlation histogram display to visualize asset relationships, providing traders with a clear visual representation of how different assets are correlated.
This indicator can be used to either force the correlation to be assumed positive or negative if the trader knows the correlation, or to use the actual data calculated between the traded asset and other assets if the correlation is broken often. This flexibility makes the Bull Bear Correlation Tracker suitable for trading various assets, including cryptocurrencies and forex, as well as for traders with different levels of experience.
By utilizing the Bull Bear Correlation Tracker, traders can gain valuable insights into market trends and correlations between different assets, helping them make more informed decisions and improve their trading strategies.
Note: I used back-testing for fine tuning do not base your trades on signals from the testing framework.

Multi-Timeframe Trend TableThis is the first publication of an indicator to show trend on the higher timeframes and is an English version of the "Mtf Supertrend Table" coded by FxTraderProAsistan. Credit goes to him for the genesis of this work. I updated the original code to Pinescript V.5 and modified it to suit my needs. Please enjoy.
This trend table indicator has the following features:
1. Trend Mode : Option to select the method of determining trend, using the Pinescript built-in ta.supertrend function or finding trend based on the cross of 20 and 50 EMA
2. 6 trend timeframes of your choosing, with show/hide
3. Optional feature to include the DXY (US dollar) trends, for the timeframes chosen. Useful for instruments that react to changes in the US dollar
4. ATR settings to adjust the Supertrend parameters. Default values are an ATR length of 10 and a Factor of 3

Sushi Trend [HG]🍣 The Sushi Roll, a trading concept conceived at a restaurant by Mark Fisher.
While the indicator itself goes by Sushi Trend, it is completely backed by the idea of Mark Fisher's Sushi Roll Reversal Pattern. No, it has nothing to do with raw fish, it just so happens that somebody was ordering sushi during the discussion of the idea, and that's how it got its name.
📝 Origin
First mentioned in his book, The Logical Trader --- the idea of the Sushi Roll is to serve as an early warning system to identify reversals in the market. Fisher defines the pattern as a series of 10 bars, split into two different sections, seen as 5 and 5. In order for the pattern to be emitted, the 5 bars to the right must completely engulf the 5 bars to the left. It's not a super complex system and is in fact extremely simple to grasp.
📈 Supertrend Similarities
Instead of displaying the pattern in the way Fisher meant for it to be portrayed (as seen in the photo above), I instead turned it into an indicator similar to that of Supertrend while also inheriting the same concepts from the pattern. I did this because the pattern itself has inconsistencies which can be quite noticeable when trading with it after a while. For example, these patterns can occur even during consolidating periods, and even though the pattern is meant to be recognized during trending markets, the engulfing bars can sometimes be left with indecisive directions.
➡️ The Result
Here is the result, visualized to be better in a trending format. (The indicator will not contain the boxes.)
While Fisher does mention the pattern to include 10 bars, you can actually use this pattern with any number of bars. At the end of the day, it's a concept derived from a discussion at a Japanese restaurant, and a pattern that has been around for years that has seen results. Due to this, I added an input option to control the series of bars for right-bar engulf detection.
To reassure the meaning of the pattern --> "A series of 10 bars" means 5 left bars and 5 right bars. So if you want to check if 5 right bars are engulfing the previous 5 bars (as seen in the photo above), you would want to select 5 in the input settings.
You can learn more about it from the following links
Market Reversals and the Sushi Roll Technique
The Logical Trader
Intrabar Analyzer [Kioseff Trading]Hello!
This indicator (Intrabar Analyzer) presents intrabar data in various derivative forms.
On-Chart Features
Traditional price data down to 1 min.
Heikin-Ashi price data down to 1 min.
Kagi price data down to 1 min.
Point & Figure price data down to 1 min.
Renko price data down to 1 min.
Linebreak price data down to 1 min.
LinReg channel
SMA
EMA
ALMA
Echomorphic Average (A @kaigouthro special!)
HMA
RMA
WMA
VWMA
VWAP
SWMA
SAR
Supertrend
On-Chart Features
Price x Volume graph
Intrabar technical rating
Positive volume index
Negative volume index
Price volume trend
RSI
%k
ROC
MFI
MFC
OBV
CCI
BBW
CMO
COG
KCW
MOM
RANGE
%r
Let's look at the objects populated by the indicator!
The image above shows what data correlates to the populated graphs!
Let's dial in on the price x volume graph.
The image above provides an example/explanation of the price x volume graph. All data is sourced from a lower timeframe (configurable - default = 1 minute).
Colors are configurable; the plot characters are configurable.
The numbers above show an alternative view of the price x volume graph!
Price graph
The price graph can populate 6 variations of price data: traditional, heikin-ashi, renko, point & figure, line break, and kagi.
The subsequent images will show all available forms of price data, in addition to a randomly selected, on-chart technical indicator!
Kagi + LinReg
Traditional + EMA
Renko + SAR
Point & Figure + ALMA
Heikin-Ashi + Supertrend
Line Break + VWAP
You can display up to three indicators concomitantly - all calculated using intrabar data!
Lastly, the indicator displays the TradingView calculated technical rating for the intrabar.
The technical ratings are multiplied by x100 and oriented left & right of the price box. Left values are negative; right values are positive. The "0" value is not shown; therefore, if the technical rating isn't highlighted then the rating is "0".
The image above shows the technical rating system in action (:
That's it!
This was a fun project and I'm certainly willing to add more - let me know if there's anything you'd like included.
Additionally, a future feature involves compatibility with any custom indicator! Stay tuned; thank you for checking this out (:
Thank you to @kaigouthro, TradingView and @PineCoders for providing some cool libraries to play with!

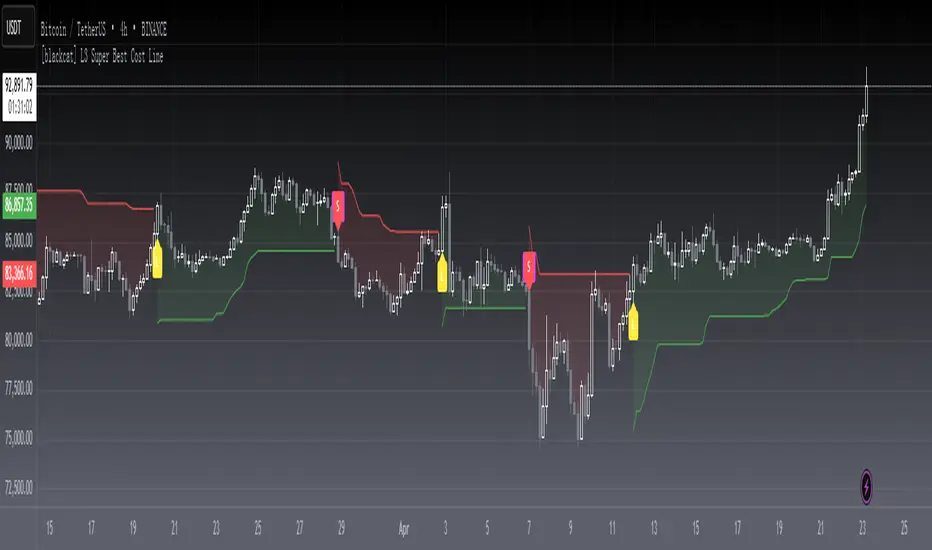
[blackcat] L3 Super Best Cost LineLevel: 3
Background
As suggested by @hedan1, he made a suggestion: this indicator can be further optimized to develop a dull line to filter the overall direction, and then use the sensitive line as a confirmation signal to enter.
One of my favourite tool to see fast trends which is simple but powerful. It runs under below market logic.
Function
With @hedan1's idea, the 1st thing i come up with is a two-layer structure: the inner sensitive part is the best cost line indicator, the outer layer is a supertrend indicator to control the overall trend direction.
Best cost line is a tool to model the people's mood and preference in the market. I define a typical price as wcx, when wcx is above the best cost line, which means traders are willing to use higher price to buy, then if you long, you are following the trend and make profit. On the other hand, if wcx is below the best cost line, which means traders are NOT willing to pursue higher price (maybe due to continous stop loss or sth other), then you should at least not long or if you are agressive in style, you may consider short.
That is it. Do you think it is simple and powerful enough?
Remarks
L: long entry, yellow
XL: close long, fuchsia
S: short entry, green
XS: close short, red
inner bullish: yellow color
inner bearish: fuchsia color
outer bullish: green color
outer bearish: red color
inner indicator : the best cost line
outer indicator : supertrend
also, i improved the display fucntinon remove some blur lines with linebr feature.
Feedbacks are appreciated.
Ranged Volume DCA Strategy - R3c0nTraderUpdate: Republishing this as Public Open-Source script.
Credits:
Thank you "EvoCrypto" for granting me permission to use "Ranged Volume" to create this strategy.
Thank you "junyou0424" for granting me permission to use "DCA Bot with SuperTrend Emulator" which I used for adding bot inputs, calculations, and strategy
What does this do?
This script is mainly used for backtesting a Ranged Volume strategy to see how a 3Commas bot would perform.
I created this script out of necessity and I wanted a way to test a 3Commas DCA bot with a strategy based on “Volume.”
I came across "EvoCrypto’s" "Ranged Volume" study and strategy in TradingView and I liked it. I wanted to configure it so it can be used for DCA bot backtesting. I used parts from "junyou0424’s" "DCA Bot with SuperTrend Emulator" to add the following:
1. The Start Time and End Time
2. Price deviation to open safety orders (%)
3. Target Take Profit (%)
4. Trailing deviation
5. Base Order and Safety Order
6. Safety order volume scale
7. Safety order step scale
8. Max safety orders
In addition to the above, I also added chart indicators for "Take Profit" as well as "Safety Order"
Pre-requisites:
You can use this script without a 3Commas account and see how 3Commas DCA Bot and Ranged Volume strategy would perform vs. a non-DCA strategy. However, I highly recommend signing up for their free account and going through their training. This would give you a base understanding on the settings you will see in this strategy and why you will need to know them.
That said these are the pre-requisites I suggest you have:
1. Base Knowledge of 3Commas DCA bots
2. Base knowledge of settings such as “Max safety trades count”, “safety order volume scale” and “safety order step scale”. If these are alien to you, I suggest you read up on these.
3. Knowledge of setting up a Single-pair 3Commas bot for receiving custom TradingView signal.
4. A paper-bot to test your ideas. (Do not use a real money bot until you have tested it sufficiently with a paper-bot. You alone are responsible for your results!)
5. Add the study I created called "R3c0nTrader’s Ranged Volume Study” which adds a separate chart in its own pane showing the volume spikes. It will also generate the “buy” signals for your bot. NOTE: The study also has the same color scheme as this strategy and having the colors in both the strategy and the study will make things easier to see. If you use EvoCrypto’s Ranged Volume Study instead, just keep in mind that the colors won’t match, and you will have to manually match them.
6. Make your buy signals from your strategy are the same as in your study! To do this, use the same “Volume Range Length” you entered in the STRATEGY and enter that value for the “Volume Range Length” in the STUDY. Also ensure you have the same settings for “Heikin Ashi” (On or Off).
Comparisons of Ranged Volume Strategy vs Ranged Volume DCA Strategy
BTCUSD
Beware of Strategies that claim super high profits. This can easily be done by lowering the initial capital to something unrealistic. If I did that with this strategy and set the initial capital $100 and base order size to $100, I get a net profit of 2,864% which is not realistic.
How to Use
1. On the “Inputs” tab:
a. Set your Start and End Time to backtest against.
b. Set your “Volume Range Length” (number of bars to look back)
c. “Heikin Ashi Colors” – Usually I leave this enabled
d. “Show Bar Colors” – Leave enabled
e. “Show Break-Out” – Leave enabled
f. “Show Range” – Leave enabled
g. Set your other inputs which are those settings you would find in your 3Commas bot that you want to test (e.g., Price deviation to open safety orders, Target Take Profit, Base order, Safety order, etc.).
h. Quick Example for BTCUSD on 2hr chart:
i. Price deviation to open safety orders (%) = 6
ii. Target Take Profit (%) = 14
iii. Trailing deviation = 0
iv. Base order = 100
v. Safety order = 200
vi. Safety order volume scale = 2
vii. Safety order step scale = 1.4
viii. Max safety order = 5
2. On the “Properties” tab, set your initial capital, base currency, etc.
a. Initial capital – Default is 10,000 (Please use realistic values here. The amount here should be able to cover ALL your safety orders if they were triggered. Ideally, you should have funds left over and not use all trade capital.)
b. Base currency – Select your currency
c. Order Size - Not used. Use the “Inputs” tab to change your base order size.
d. Leave “Pyramiding” set to 999. This acts as a ceiling to the “Max safety orders” on the “Inputs” tab. It must always be higher than your “Max safety orders.” For example, if you set your “Max safety orders” to “4” and “Pyramiding” to “4” then it effectively means you have “3” “Max safety orders” and not “4” because it is counting each successive entry including the initial order.
e. “Commission” - Optional
f. “Verify price for limit orders” – Leave at zero. This does not change anything that I can tell.
g. Optional - Enter a value for “Commission”
h. Slippage – Optional. Slippage does not occur in backtesting but does occur in real trading but it can be simulated. Example use case for tracking performance of a real money bot: You enter the start date and time of your bot’s trade into this strategy and you notice some values are a little off due to slippage (average price, take profit, safety orders are not lining up) then you would go back here and increase the slippage until those lines up close enough with your actuals.
i. Margin for long positions – I don’t use this honestly.
j. Margin for short positions – I don’t use this honestly.
k. Recalculate “After order is filled” and “On every tick” – I don’t use this honestly.
3. “Style” tab
a. Ranged Volume Bar Coloring - You must disable bar coloring in any studies you added or this may not work properly
i. Color 0 – Default Yellow; appears when a volume breakout occurs
ii. Color 1 – Default Red; appears when a volume breakdown occurs
iii. Color 2 – Light Blue; appears when Close is higher than the Open
iv. Color 3 – Dark Blue; appears when the Close is lower than the Open
b. Take profit – Default Green; take profit line
c. Safety order – Default Light Blue; safety order line
d. No Safety Orders left – Default Red; when a trade runs out of safety orders, the line turns red and there is no safety orders left underneath to catch any further falling price movements.
e. Avg Position Price – Default Orange; your average position price for any given trade.
f. Take Profit Plot Area – Default Green; creates a highlighted area for your take profit
g. SO Plot Area – Default Light Blue; creates a highlighted area for your safety orders
h. Trades on chart – Show or hide your trades on the chart
i. Signal labels – Show or hide the trade signal labels on the chart
j. Quantity – Show or hide the trade quantity on the chart
Explanation of Chart lines and colors on chart
