HiLo IndicatorNYSE:SPCE
This is an old and simple concept of mine that I am revisiting. It looks similar to the Vortex Indicator but the formulation is different. I was sick and tired of buying late at the top of the peaks, so I wanted to relate the current price to historic highs and lows (you can change how far you want to go back Time Length = tl). The functions are incredible simple:
lo = close -lowest(close,tl)
hi = highest(close,tl) -close
This generates a weaving pattern that shows bullish (lo>hi) and bearish (lo
Cerca negli script per "supertrend"

Niki Super1.2This is a completely super trend indicator. Changed only the ATR period and the multifactor default values. This setup shows more profit on the 5 minute chart, making it ideal for scalping and day trading. This indicator is suitable for any type of stock. The 'Buy' symbol represents the long entry and the 'Sell' symbol represents the short entry. Modified the bar color based on the SuperTrend. Signals or highlighted colors can be omitted from the Signal Settings window
Contact us using the links below to get access to this indicator

Bot Study v7 OverlayShowing the direction of price, based on candlestick patterns. Working similarly as PSAR or Supertrend.


Mixed TrendsTwo green dots in a row means it's good time to start long position.
Likewise, two red dots in a row means to start short.
Better performance used together with SuperTrend.

50EMA + 52RSI Day TradeBased on the great day trading video by @TrueCrypto28 ( www.youtube.com ), this indicator is perfect for trading on Binance. Have tweaked it so it is based on the 50EMA instead of SuperTrend.
Default settings
Long signal will be given when RSI is above 52 on the hourly chart to confirm a higher timeframe bullish bias as well as price closing above the 50EMA on the 5 minute chart. High + Low + Close / 3 has been used to smooth signals.
Trade will be closed when price either closes below the 50EMA on the 5 minute or RSI drops above 52 on the hourly.
Colour coded candles included for ease of trading. Green = all signals met to buy. Red = sell.
Can change inputs to suite your style.

複合ガチイカ🦑🦑🦑 日本語説明は英文の後ーーーーーーーーーーーーーーー
🦑 Composite Gachi Squid Indicator – A fun and intuitive trading overlay combining SuperTrend, ATR, and RSI.
Body color shows trend direction and strength.
Tentacles visualize volatility.
Eyes indicate overbought/oversold conditions.
🦑↑ / 🦑↓ marks provide clear entry signals.
Perfect for visual traders who want both style and actionable insights.
日本語説明-------------------------------------------------------------
🦑 複合ガチイカ・インジケーター – SuperTrend、ATR、RSI を組み合わせた遊び心と実用性を両立したチャートオーバーレイ。
イカの体の色でトレンドの方向と強さを表示
触手でボラティリティを可視化
目で買われすぎ・売られすぎを表示
🦑↑ / 🦑↓ が分かりやすいエントリーシグナル
見た目も楽しく、トレード判断にも使えるインジケーターです。

Crypto Grail Crypto Grail — Advanced Multi-Factor Market Intelligence System
Crypto Grail is an institutional-grade multi-factor trading system designed to identify high-probability market conditions through structured trend analysis, volatility modeling, volume diagnostics and candle-level momentum evaluation. The tool operates as an adaptive decision framework that highlights only the most meaningful market alignments while filtering out low-quality noise.
Core Trend Architecture
Crypto Grail builds directional bias using a layered trend framework that integrates:
• EMA21, EMA50 and EMA200 structural mapping
• SuperTrend confirmation
• ADX trend-strength assessment
• EMA-spread evaluation for macro bias
This architecture allows Crypto Grail to distinguish impulsive directional movement from non-directional consolidation phases with high precision.
Quality Scoring Engine
Every potential long or short setup is processed through a quantitative scoring model that evaluates:
• Trend alignment across EMA structure
• SuperTrend directional confirmation
• ADX intensity
• RSI zone positioning
• Candle delta (close-location value)
• Volume deviation relative to baseline
• Volatility state (compressed / normal / explosive)
• Movement percentage vs recent history
• Impulse strength within the current bar
Only setups that satisfy the required quality threshold are eligible for display.
Volatility Regime Modeling
The system dynamically identifies volatility regimes by analyzing:
• ATR-based volatility gradient
• Recent movement amplitude
• Candle impulse relative to volatility envelope
• Expansion and compression cycles
• Chaotic transitions and unstable bursts
This allows the script to identify when the market environment supports sustained follow-through versus when conditions are structurally noisy.
Volume Deviation Framework
Crypto Grail evaluates volume behavior using a rolling baseline to detect:
• Genuine volume expansion
• Volume contraction
• Spike clusters
• Impulse confirmation with volume alignment
Volume states are incorporated directly into the quality-scoring engine, ensuring signals appear only when supported by underlying market participation.
Early & Hybrid Entry Logic
Two optional entry modes expand the system’s capability during dynamic phases:
• Early Mode: identifies strong impulse shifts confirmed by volume + delta
• Hybrid Mode: merges early detection with trend-filtered confirmation
These modes enable more aggressive entries without compromising structural integrity.
Sideways Market Filter
The system includes a consolidation-detection layer that restricts signal generation during:
• Flat ranges
• Low-energy volatility clusters
• ADX-weak trend environments
• EMA compression zones
This significantly increases average signal reliability.
Integrated Trade Simulation Engine
Crypto Grail includes a full visual trade-simulation module featuring:
• ATR-based dynamic stop loss
• Risk-to-reward take profit engine
• Optional ATR trailing stop
• Trade cooldown control
• Complete entry/exit marking
• SL/TP visualization
• Automatic exit-reason tagging
This makes each signal structurally transparent and easy to analyze.
Market Condition Panel
A real-time performance and condition dashboard displays:
• Total trades
• Wins and losses
• Long/short distribution
• Early-entry analytics
• Volume regime
• Volatility regime
• Trend condition
• Current directional bias
This provides ongoing contextual insight during live market conditions.
System Purpose
Crypto Grail is designed as a professional decision-support system that isolates high-probability market structures through multi-layer technical validation. The tool does not guarantee results and should be used with proper risk management.

Superior-Range Bound Renko - Alerts - 11-29-25 - Signal LynxSuperior-Range Bound Renko – Alerts Edition with Advanced Risk Management Template
Signal Lynx | Free Scripts supporting Automation for the Night-Shift Nation 🌙
1. Overview
This is the Alerts & Indicator Edition of Superior-Range Bound Renko (RBR).
The Strategy version is built for backtesting inside TradingView.
This Alerts version is built for automation: it emits clean, discrete alert events that you can route into webhooks, bots, or relay engines (including your own Signal Lynx-style infrastructure).
Under the hood, this script contains the same core engine as the strategy:
Adaptive Range Bounding based on volatility
Renko Brick Emulation on standard candles
A stack of Laguerre Filters for impulse detection
K-Means-style Adaptive SuperTrend for trend confirmation
The full Signal Lynx Risk Management Engine (state machine, layered exits, AATS, RSIS, etc.)
The difference is in what we output:
Instead of placing historical trades, this version:
Plots the entry and RM signals in a separate pane (overlay = false)
Exposes alertconditions for:
Long Entry
Short Entry
Close Long
Close Short
TP1, TP2, TP3 hits (Staged Take Profit)
This makes it ideal as the signal source for automated execution via TradingView Alerts + Webhooks.
2. Quick Action Guide (TL;DR)
Best Timeframe:
4H and above. This is a swing-trading / position-trading style engine, not a micro-scalper.
Best Assets:
Volatile but structured markets, e.g.:
BTC, ETH, XAUUSD (Gold), GBPJPY, and similar high-volatility majors or indices.
Script Type:
indicator() – Alerts & Visualization Only
No built-in order placement
All “orders” are emitted as alerts for your external bot or manual handling
Strategy Type:
Volatility-Adaptive Trend Following + Impulse Detection
using Renko-like structure and multi-layer Laguerre filters.
Repainting:
Designed to be non-repainting on closed candles.
The underlying Risk Management engine is built around previous-bar data (close , high , low ) for execution-critical logic.
Intrabar values can move while the bar is forming (normal for any advanced signal), but once a bar closes, the alert logic is stable.
Recommended Alert Settings:
Condition: one of the built-in signals (see section 3.B)
Options: “Once Per Bar Close” is strongly recommended for automation
Message: JSON, CSV, or simple tokens – whatever your webhook / relay expects
3. Detailed Report: How the Alerts Edition Works
A. Relationship to the Strategy Version
The Alerts Edition shares the same internal logic as the strategy version:
Same Adaptive Lookback and volatility normalization
Same Range and Close Range construction
Same Renko Brick Emulator and directional memory (renkoDir)
Same Fib structures, Laguerre stack, K-Means SuperTrend, and Baseline signals (B1, B2)
Same Risk Management Engine and layered exits
In the strategy script, these signals are wired into strategy.entry, strategy.exit, and strategy.close.
In the alerts script:
We still compute the final entry/exit signals (Fin, CloseEmAll, TakeProfit1Plot, etc.)
Instead of placing trades, we:
Plot them for visual inspection
Expose them via alertcondition(...) so that TradingView can fire alerts.
This ensures that:
If you use the same settings on the same symbol/timeframe, the Alerts Edition and Strategy Edition agree on where entries and exits occur.
(Subject only to normal intrabar vs. bar-close differences.)
B. Signals & Alert Conditions
The alerts script focuses on discrete, automation-friendly events.
Internally, the main signals are:
Fin – Final entry decision from the RM engine
CloseEmAll – RM-driven “hard close” signal (for full-position exits)
TakeProfit1Plot / 2Plot / 3Plot – One-time event markers when each TP stage is hit
On the chart (in the separate indicator pane), you get:
plot(Fin) – where:
+2 = Long Entry event
-2 = Short Entry event
plot(CloseEmAll) – where:
+1 = “Close Long” event
-1 = “Close Short” event
plot(TP1/TP2/TP3) (if Staged TP is enabled) – integer tags for TP hits:
+1 / +2 / +3 = TP1 / TP2 / TP3 for Longs
-1 / -2 / -3 = TP1 / TP2 / TP3 for Shorts
The corresponding alertconditions are:
Long Entry
alertcondition(Fin == 2, title="Long Entry", message="Long Entry Triggered")
Fire this to open/scale a long position in your bot.
Short Entry
alertcondition(Fin == -2, title="Short Entry", message="Short Entry Triggered")
Fire this to open/scale a short position.
Close Long
alertcondition(CloseEmAll == 1, title="Close Long", message="Close Long Triggered")
Fire this to fully exit a long position.
Close Short
alertcondition(CloseEmAll == -1, title="Close Short", message="Close Short Triggered")
Fire this to fully exit a short position.
TP 1 Hit
alertcondition(TakeProfit1Plot != 0, title="TP 1 Hit", message="TP 1 Level Reached")
First staged take profit hit (either long or short). Your bot can interpret the direction based on position state or message tags.
TP 2 Hit
alertcondition(TakeProfit2Plot != 0, title="TP 2 Hit", message="TP 2 Level Reached")
TP 3 Hit
alertcondition(TakeProfit3Plot != 0, title="TP 3 Hit", message="TP 3 Level Reached")
Together, these give you a complete trade lifecycle:
Open Long / Short
Optionally scale out via TP1/TP2/TP3
Close remaining via Close Long / Close Short
All while the Risk Management Engine enforces the same logic as the strategy version.
C. Using This Script for Automation
This Alerts Edition is designed for:
Webhook-based bots
Execution relays (e.g., your own Lynx-Relay-style engine)
Dedicated external trade managers
Typical setup flow:
Add the script to your chart
Same symbol, timeframe, and settings you use in the Strategy Edition backtests.
Configure Inputs:
Longs / Shorts enabled
Risk Management toggles (SL, TS, Staged TP, AATS, RSIS)
Weekend filter (if you do not want weekend trades)
RBR-specific knobs (Adaptive Lookback, Brick type, ATR vs Standard Brick, etc.)
Create Alerts for Each Event Type You Need:
Long Entry
Short Entry
Close Long
Close Short
TP1 / TP2 / TP3 (optional, if your bot handles partial closes)
For each:
Condition: the corresponding alertcondition
Option: “Once Per Bar Close” is strongly recommended
Message:
You can use structured JSON or a simple token set like:
{"side":"long","event":"entry","symbol":"{{ticker}}","time":"{{timenow}}"}
or a simpler text for manual trading like:
LONG ENTRY | {{ticker}} | {{interval}}
Wire Up Your Bot / Relay:
Point TradingView’s webhook URL to your execution engine
Parse the messages and map them into:
Exchange
Symbol
Side (long/short)
Action (open/close/partial)
Size and risk model (this script does not position-size for you; it only signals when, not how much.)
Because the alerts come from a non-repainting, RM-backed engine that you’ve already validated via the Strategy Edition, you get a much cleaner automation pipeline.
D. Repainting Protection (Alerts Edition)
The same protections as the Strategy Edition apply here:
Execution-critical logic (trailing stop, TP triggers, SL, RM state changes) uses previous bar OHLC:
open , high , low , close
No security() with lookahead or future-bar dependencies.
This means:
Alerts are designed to fire on states that would have been visible at bar close, not on hypothetical “future history.”
Important practical note:
Intrabar: While a bar is forming, internal conditions can oscillate.
Bar Close: With “Once Per Bar Close” alerts, the fired signal corresponds to the final state of the engine for that candle, matching your Strategy Edition expectations.
4. For Developers & Modders
You can treat this Alerts script as an ”RM + Alert Framework” and inject any signal logic you want.
Where to plug in:
Find the section:
// BASELINE & SIGNAL GENERATION
You’ll see how B1 and B2 are built from the RBR stack and then combined:
baseSig = B2
altSig = B1
finalSig = sigSwap ? baseSig : altSig
To use your own logic:
Replace or wrap the code that sets baseSig / altSig with your own conditions:
e.g., RSI, MACD, Heikin Ashi filters, candle patterns, volume filters, etc.
Make sure your final decision is still:
2 → Long / Buy signal
-2 → Short / Sell signal
0 → No trade
finalSig is then passed into the RM engine and eventually becomes Fin, which:
Drives the Long/Short Entry alerts
Interacts with the RM state machine to integrate properly with AATS, SL, TS, TP, etc.
Because this script already exposes alertconditions for key lifecycle events, you don’t need to re-wire alerts each time — just ensure your logic feeds into finalSig correctly.
This lets you use the Signal Lynx Risk Management Engine + Alerts wrapper as a drop-in chassis for your own strategies.
5. About Signal Lynx
Automation for the Night-Shift Nation 🌙
Signal Lynx builds tools and templates that help traders move from:
“I have an indicator” → “I have a structured, automatable strategy with real risk management.”
This Superior-Range Bound Renko – Alerts Edition is the automation-focused companion to the Strategy Edition. It’s designed for:
Traders who backtest with the Strategy version
Then deploy live signals with this Alerts version via webhooks or bots
While relying on the same non-repainting, RM-driven logic
We release this code under the Mozilla Public License 2.0 (MPL-2.0) to support the Pine community with:
Transparent, inspectable logic
A reusable Risk Management template
A reference implementation of advanced adaptive logic + alerts
If you are exploring full-stack automation (TradingView → Webhooks → Exchange / VPS), keep Signal Lynx in your search.
License: Mozilla Public License 2.0 (Open Source).
If you build improvements or helpful variants, please consider sharing them back with the community.

ORION Fusion Engine by Ali_KamberogluORION Fusion Engine by Ali_Kamberoglu | The Ultimate All-in-One Trading Command Center
Developer: Ali Kamberoğlu
Overview: One Indicator, A Complete Strategy
The ORION Fusion Engine (FE) transcends the limits of a single indicator, merging multiple ORION engines into one intelligent system—an all-in-one trading command center. This is not just an indicator; it is a complete strategy system that analyzes the market across three key dimensions: Trend, Energy (Volatility), and Confirmation (Divergence). It then fuses this data to provide you with filtered, high-probability trading signals.
ORION FE transforms your chart into an aircraft's cockpit; each "crew member" provides critical information about the market's condition, and most importantly, fires "Grand Prix" signals when all conditions are perfect.
The Cockpit Crew: The Power Behind ORION FE
The strength of ORION FE comes from four main components, each specializing in its field and operating far more intelligently than standard indicators:
1. THE CAPTAIN (Core Trend Engine): The Ship's Smart Route
Mission: To determine the market's primary trend direction.
How is it different from a standard SuperTrend? A standard SuperTrend uses a fixed ATR multiplier in all market conditions, leading to numerous false signals (whipsaws) in choppy markets or late signals in slow-starting trends.
The ORION Advantage (Adaptive Multiplier): The Captain revolutionizes this by using an adaptive ATR multiplier. The engine compares short-term volatility to long-term volatility.
In Choppy & Noisy Markets: The multiplier automatically increases, moving the trend line away from the price to protect you from false signals and keep the ship's course steady.
In Calm & Consolidating Markets: The multiplier automatically decreases, bringing the trend line closer to the price to give you a much earlier entry signal on a potential breakout. In short, the Captain stays on deck in a storm and is the first to leave the harbor in calm seas.
2. THE WEATHER STATION (Energy Engine): Measures the Storm's Intensity
Mission: To measure the market's potential energy (Squeeze).
How is it different from a standard Squeeze? Standard squeeze indicators only tell you if the market is consolidating (a simple yes/no).
The ORION Advantage (Hierarchical Energy Detection): The Weather Station reports the quality and potential intensity of the squeeze at three different levels:
Purple Cross (Standard Squeeze): Energy is accumulating.
White Cross (Volume-Confirmed Squeeze): More reliable. Not only is there a squeeze, but there is also significant volume interest, indicating that storm clouds are gathering.
Yellow Cross (Super Squeeze): The highest potential. This signals that volatility is at historically low levels, maximizing the probability that the upcoming move will be a "perfect storm."
3. THE STRATEGIC FILTER (FUSION): The Intelligent Decision-Maker
Mission: To maximize signal quality.
How is it different from the standard approach? Most traders try to interpret ADX and DMI separately, which leads to confusion and subjective decisions.
The ORION Advantage (Automated Confirmation): The Fusion filter automates the confirmation process a professional analyst would perform. To approve a signal, it asks two critical questions simultaneously: 1) Is there enough Trend Strength behind this signal (with Adaptive ADX-K)? 2) Is the Directional Bias on the correct side (with the DI Oscillator)? A signal is only given the green light if the answer to both is "yes." This eliminates all weak signals that have direction but no strength, or strength but no clear direction.
4. THE ENGINEERS (Divergence Detectors): The Secret Signal Spotters
Mission: To detect the hidden strength or weakness behind price action (divergences).
How is it different from the standard approach? Searching for divergences manually is both time-consuming and highly subjective.
The ORION Advantage (Multi-Source Automated Scanning): The Engineers scan the market for you 24/7, using two different sources:
The Volume Engineer: Finds divergences between price and "smart money" flow (OBV-based).
The Momentum Officer: Finds divergences between price and market momentum (RSI/Stochastic-based).
A trend reversal confirmed by both volume and momentum simultaneously constitutes one of the system's most powerful confirmations and lays the groundwork for Grand Prix signals.
Signal Hierarchy: From Standard to Grand Prix
ORION FE combines all this data to present you with three distinct quality levels of signals:
🏁 GRAND PRIX SIGNAL (Label: GP-BUY / GP-SELL): "The Perfect Storm"
This is the highest-quality signal the system can produce. It appears only when all of the following conditions are met simultaneously:
The Captain signals a trend reversal.
The Weather Station reports a strong energy accumulation (Squeeze) in the recent past.
The Engineers detect a divergence that supports this reversal.
The Strategic Filter confirms the signal has sufficient trend strength.
🔼 STRONG SIGNAL (Triangle): A high-probability confirmation. The Captain's reversal signal is confirmed by either a Divergence OR an Energy Breakout and has passed the filter.
⚫ STANDARD SIGNAL (Circle): The most basic confirmation level. Only the Captain's reversal signal has passed the filter. Use with caution.
Disclaimer
This indicator is a professional analysis tool developed to assist in your trading decisions. No signal or analysis constitutes investment advice. Trading in financial markets involves high risk, and past performance is not a guarantee of future results. Please always apply your own risk management strategies.

Trade Orbit — Trend ScalperTrade Orbit — Trend Scalper (Supertrend + Money Flow Zones + Strength Panel)
Trade Orbit — Trend Scalper is a multi-confirmation trading tool designed for high-accuracy trend entries and dynamic support-resistance zone tracking. It combines price-action, momentum, and trend-filtering to provide cleaner signals with minimal noise.
🧠 Core Logic
✔ Supertrend Trend Direction
✔ Money Flow Indicator for momentum strength
✔ Dynamic Support-Resistance Zones created from pivot highs/lows
✔ Price breaks + retests show high-probability continuation zones
✔ Focuses on clean trends & avoids choppy markets
🎯 Signal System
🔹 Buy Signal — Bullish trend + strong money inflow + price holding support zone
🔹 Sell Signal — Bearish trend + money outflow + price rejecting resistance zone
🔹 Automatic background coloring for market phases:
Trend Background
Bullish Green
Bearish Red
Neutral No color
🛡 Support-Resistance Zones
• Zones are created from confirmed pivots
• Zones remain on chart for historical confluence
• Helps identify break + retest entries
📊 Strength Panel (Side HUD)
Real-time visual trend status showing if buyers or sellers are dominating the market.
⏱ Works Best On
• Intraday: 5-min | 15-min
• Swing: 1-hr | 4-hr | Daily
Works on all markets — Stocks, Crypto, Forex, Indices & Commodities.
📌 Disclaimer
This indicator does not guarantee profits. Use proper risk management and additional confirmations before trading.

Filter Trend1. Indicator Name
Premium EMA Ribbon Filter (Pro Version)
(Advanced Trend & Momentum Filtering System Based on EMA Ribbons)
2. One-Line Introduction
A professional trend-analysis indicator that blends an advanced noise-filtering algorithm with an EMA ribbon system to extract only the pure bullish/bearish trend while smoothing out market noise.
3. Overall Description (7+ lines)
The Premium EMA Ribbon Filter is more than just a set of EMAs.
It analyzes the structure of a fast, medium, and slow EMA ribbon—along with the spacing and alignment between them—to determine whether the market is in a bullish trend, bearish trend, or a neutral/noise-heavy zone.
The core of this indicator is its noise-reduction algorithm and trend-strength calculation system.
Instead of relying on simple EMA cross signals, it evaluates how consistently the ribbon maintains bullish/bearish alignment over a specified period and highlights only strong trends with color coding, while weak or noisy areas are displayed in gray.
This helps traders avoid confusing or false signals and clearly focus only on the “meaningful zones.”
A Triple-Smoothing System is applied to create smoother, more refined ribbon movements, forming a stable “premium trend curve” that is less affected by short-term volatility.
As a result, this indicator works effectively for scalping, swing trading, and long-term trend following—staying true to the principle of removing noise and highlighting only the core market flow.
4. Short Advantages (6 items)
① Complete Noise Filtering
Using EMA ribbon comparison + tolerance logic, false reversals are largely eliminated, leaving only stable trend phases.
② Highly Readable Color System
Bullish trends are mint, bearish trends are red, and neutral/noise zones are gray—instantly visualizing market conditions.
③ Trend Strength Visualization
Not only trend direction but also trend strength is displayed via dynamic color transparency.
④ Smooth, Premium-Style Ribbon Design
Triple-smoothing creates a refined, luxury-level smoothness in movement.
⑤ Works Across All Timeframes
From 1-minute scalping to daily/weekly macro trend analysis.
⑥ Excellent Real-Trading Compatibility
Works extremely well when combined with ATR, SuperTrend, and volume-based indicators.
Indicator Manual (Required Section)
📌 Understanding the Core Concept
The indicator uses three EMAs (e.g., 20/50/100) arranged as a ribbon to analyze the structural alignment of the trend.
When the EMAs are cleanly aligned Top → Middle → Bottom, the market is in a bullish trend.
When aligned Bottom → Middle → Top, the market is in a bearish trend.
The indicator further evaluates the ribbon spread (gap) and the consistency of alignment to compute trend strength.
Noisy market conditions are shaded gray to clearly indicate “uncertain/indecisive” zones.
⚙️ Settings Description
Option Description
Fast EMA Most sensitive EMA; detects early trend signals
Mid EMA Stabilizes the primary trend direction
Slow EMA Defines the broader, long-term trend flow
Trend Lookback The period used to analyze trend strength
Noise Tolerance (%) Higher values = stronger noise removal
Smoothing Steps Controls how smooth the ribbon becomes
📈 Example Recognition
A bullish continuation/entry scenario forms when:
EMAs align in the order Fast → Mid → Slow (top side)
Ribbon color shifts into mint (strong bullish trend)
The ribbon begins to expand while price stays above the ribbon
📉 Example Recognition
A bearish continuation/entry occurs when:
EMAs align Fast → Mid → Slow (bottom side)
Ribbon color remains red
After contracting, the ribbon expands again during renewed downside strength
🧪 Recommended Usage
Combine with volume-based indicators (OBV, Volume Profile) → enhanced strong-trend detection
Use with SuperTrend or ATR Stop → clearer stop-loss placement
Combine with RSI/Stoch → avoid counter-trend entries in overheated conditions
Higher leverage traders should use higher tolerance settings
🔒 Cautions
EMA ribbons are trend-following tools; signals may weaken in ranging/sideways markets.
Never rely solely on this indicator—always confirm with volume, price patterns, or structure.
Very low Lookback values may cause excessive re-entry signals.
In high-volatility environments, ribbon spacing can contract/expand rapidly—use with caution.

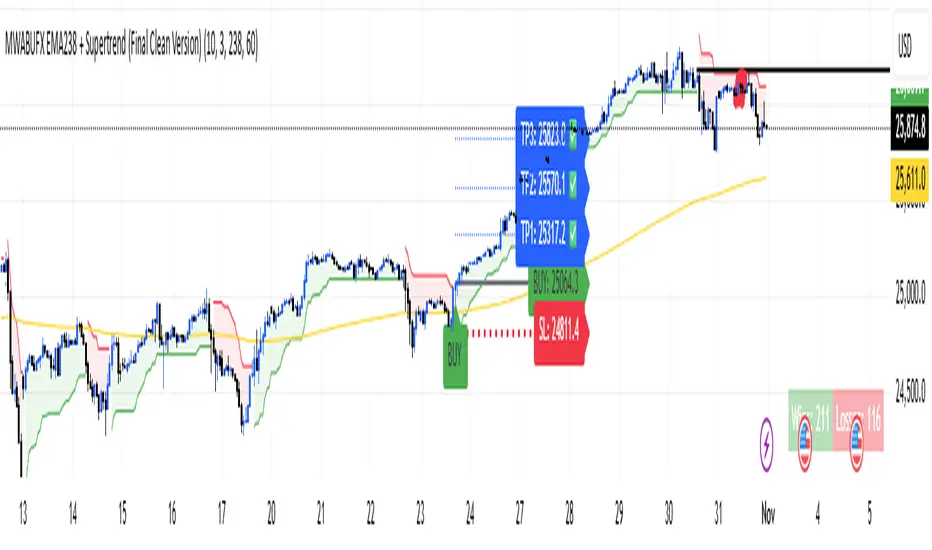
(Final Clean Version) V2 Optimized Trading Guide — MWABUFX 15-Minute Intraday Setup
🕒 Recommended Timeframe
✅ 15-Minute Chart (M15) — the most balanced and accurate for MWABUFX.
Why M15 Works Best:
Filters out small, noisy market movements found on 1m–5m charts.
Responds faster than 1H or 4H, perfect for daily profits.
Aligns well with market session volatility (London & New York).
Gives 2–5 high-probability trades per day depending on the pair.
Ideal for traders using PineConnector automation or manual execution.
🧭 How to Trade on 15-Minute
🟢 Buy Setup
EMA 238 is sloping upward and price is above it.
Supertrend flips green — wait for candle to close above the line.
Confirm trend direction on 1H timeframe (optional filter).
Enter trade at the close of the signal candle.
Stop-Loss: below recent swing low.
Take Profits:
TP1 → 1:1
TP2 → 1:2
TP3 → 1:3
Move SL to breakeven after TP1 is hit.
🔴 Sell Setup
EMA 238 is sloping downward and price is below it.
Supertrend flips red — wait for candle to close below the line.
Confirm 1H trend also bearish (optional).
Enter trade at the candle close.
Stop-Loss: above recent swing high.
Take Profits: TP1, TP2, TP3 as above.
🕐 Best Trading Hours (Kenya Time / GMT+3)
Session Time Ideal Pairs Notes
London Session 10:00 AM – 2:00 PM GBPUSD, EURUSD, Gold Cleanest 15-min trends
New York Session 3:30 PM – 7:00 PM US30, NAS100, XAUUSD, GBPUSD Strong volatility, high RR trades
Avoid After 8:30 PM — Market slows down, spreads widen
📌 If you must choose one — trade 15-minute charts during London–New York overlap (3:30 PM – 6:30 PM).
⚖️ Risk & Profit Strategy
Risk only 1–2% of balance per trade.
Focus on 1–3 solid setups per session — no overtrading.
Aim for minimum 1:2 reward-to-risk ratio.
Avoid entries when EMA 238 is flat (ranging market).
💡 Pro Tips
Use “Close of Candle” confirmation — avoid jumping in mid-bar.
Combine with session bias (e.g. buy Gold during bullish NY momentum).
Use alerts through PineConnector to catch trades instantly.
Don’t trade during major red news (NFP, CPI, FOMC).
Journal every trade — review TP/SL behavior to improve timing.

Nifty SMC S&R MA and All Indicator[SumitQuants]🇮🇳🔥 **Nifty SMC S&R + MA + VWAP + Order Flow Suite
**
Built for Indian Markets • Tuned for NIFTY, BANKNIFTY & NSE Stocks
A complete institutional-grade trading system crafted for Indian traders who want a serious edge using Smart Money Concepts, Market Structure, Support–Resistance Strength, VWAP, Breakout Logic & Trend Tools — all combined into ONE ultra-optimized indicator.
🧠 Why This Indicator Stands Out
Most indicators only show price.
This one shows intent — clear, confident, and easy to read.
It reveals:
➡ where institutions are active
➡ where liquidity is sitting
➡ where real strength is building
➡ and who is actually in control — buyers or sellers
This is how professional desks read the markets — and now you can too.
🔥 What’s Inside (Complete Feature Stack)
🟧 1. Support–Resistance Strength Engine (Buyer/Seller Strength %)
Your built-in market power meter:
🟦 Auto S/R zones
🟩 Buyer vs Seller Strength %
🟨 Strength boxes with clean visuals
🔁 Live reactions when price taps strong or weak zones
Perfect for timing entries, reversals, retests and trap-detections in NIFTY & BANKNIFTY.
🟩 2. Smart Money Concepts (Full SMC Suite)
A complete institutional SMC system:
✔ BOS / CHoCH (Internal + Swing)
✔ Market Structure in real time
✔ Internal & Swing Order Blocks
✔ Strong / Weak Highs & Lows
✔ Equal High / Equal Low (EQH/EQL)
✔ Fair Value Gaps (FVG)
✔ Trend Bias Coloring
✔ Premium / Discount Zones
Every element is built for clarity — high-quality visuals without chart clutter.
📈 3. Moving Average Suite (5 Fully Custom MAs)
Elegant MA system for trend confirmation:
✨ EMA
✨ SMA
✨ SMMA
✨ WMA
✨ VWMA
Beautiful colors, clean visibility, and completely optional — enable only what you need.
⚡ 4. Enhanced Supertrend System
A modern Supertrend built for actual usability:
🎨 3 display styles (Line / Histogram / Ghost Mode)
🔄 Clear trend-change signals
🌗 Background trend zones
⚡ No repaint
⏰ Alerts for every reversal
Ideal for intraday momentum and bias confirmation.
📉 5. Breakouts with Volume Confirmation
Stops you from getting trapped in fakeouts:
🔥 Support Break
🔥 Resistance Break
🟦 Bullish Rejection
🟥 Bearish Rejection
📈 Volume-validated breakouts
📊 Smooth visual labels for clean execution
Ultra useful for NIFTY/BANKNIFTY’s typical stophunt → reversal patterns.
🎯 6. VWAP System with Multi-Band Zones
Professional VWAP for Indian markets:
✔ Session VWAP
✔ Weekly VWAP
✔ Monthly VWAP
✔ Premium–Discount Zones
✔ Expansion vs Mean-Reversion levels
✔ Clean visual bands
Perfect for intraday scalping & morning session planning.
🔔 7. Full Alerts Framework Included
Get notified for all key institutional events:
🚨 BOS / CHoCH
🚨 Order Block Breakouts
🚨 Equal High/Low
🚨 Fair Value Gaps
🚨 Trend Changes
🚨 Breakouts
🚨 Swing / Internal Structure Events
Never miss a major shift again — even when away from charts.
🧽 8. Clean UI + Auto Watermark
🖤 Dark/Light mode optimized
🧊 Smooth spacing
✨ Minimalistic visuals
🔍 Zero chart clutter
⚡ High-performance
A premium interface built for Indian index trading.
🧪 Who Is This Built For?
✔ Intraday F&O Traders
✔ NIFTY & BANKNIFTY Scalpers
✔ Swing Traders
✔ Price Action + SMC Traders
✔ VWAP-Based Scalpers
✔ Anyone wanting a complete premium system in a single indicator
⚡ Why Indian Traders Love It
⚡ Captures Nifty morning trap zones
⚡ Predicts London session expansions
⚡ Warns about NY reversal pressure
⚡ Identifies true institutional footprints
⚡ Shows real strength behind S/R zones
⚡ Eliminates false breakouts
⚡ Gives bias, structure & context instantly
This is not just an indicator —
It’s a full institutional trading framework.
🛒 Get Full Access
This indicator is available exclusively inside the Courses section on the official website.
👉 Purchase & Access:
www.ironmindtrader.com
Inside the course:
🔧 Installation Steps
⚙️ Recommended Settings
📘 Trading Logic
🔄 Lifetime Updates Included

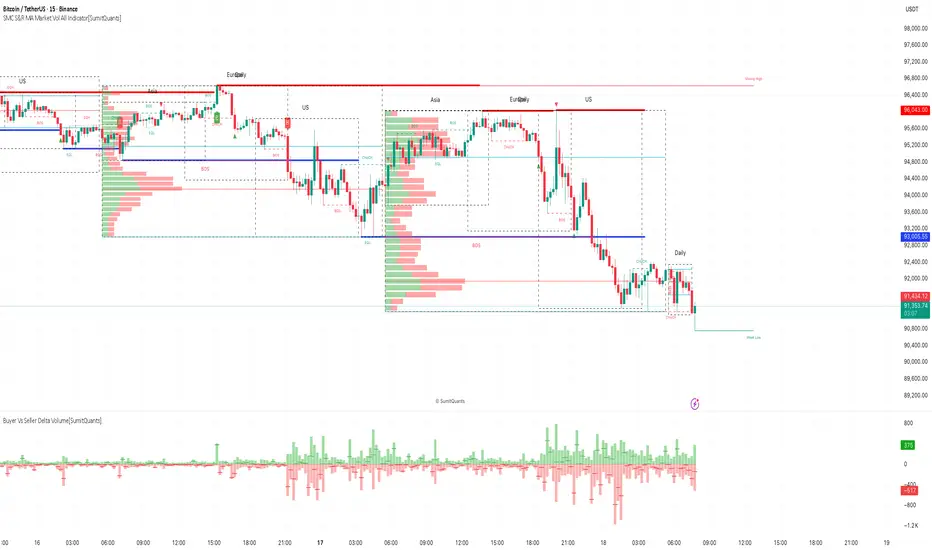
SMC S&R MA Market Vol All Indicator[SumitQuants]🚀 SMC S&R + Market Sessions + Volume Profile + Order Flow Suite
The Only All-In-One Institutional Trading System You’ll Ever Need.
Looking for an indicator that actually brings clarity to chaotic markets?
Meet the SMC S&R MA Market Volume & Sessions Order Flow System — a powerhouse that fuses Smart Money Concepts, Session Profiles, and Dynamic Volume Flow into one ultra-optimized institutional toolkit.
This is not “just another SMC indicator.”
This is your complete trading ecosystem.
💠 What This Indicator Does (In Simple Terms)
It automatically reads the market the way institutions do — and displays it cleanly on your chart with zero clutter.
Below is everything packed inside 👇
🔥 1. Market Sessions + Volume Profile (Real Institutional Map)
✔ Tokyo- Asia | London- Europe | New York- US sessions auto-detected ⏱️
✔ Each session gets its own Volume Profile 📊
✔ See POC, VAH, VAL, Value Area Box for each session
✔ Live Developing Profile in real-time
✔ Wick-based and body-volume distribution for ultra-accurate auctions
✔ Session Boxes that highlight imbalance zones
✔ Perfect for:
High-volume Asia breaks
London volatility expansion
NY reversal traps
👉 Think of it as having pro-level TPO/Volume Profile inside TradingView.
🎯 2. Advanced S&R Strength Engine (Buyer vs Seller Power Meter)
✔ Detects strongest Support & Resistance zones
✔ Measures Buyer Strength & Seller Strength (% based)
✔ Auto-plots S/R Lines + S/R Zones
✔ Detects Bounce signals, Rejection points, Pressure shifts
✔ Zero repaint logic
You get institutional footprints directly on your chart.
📈 3. Smart Money Concepts (Full Automation)
✔ BOS / CHoCH detection
✔ Internal + Swing Structure
✔ Order Blocks (Internal + Swing)
✔ Equal Highs & Equal Lows
✔ Fair Value Gaps (FVG)
✔ Strong/Weak Highs + Lows labeling
✔ Trend coloring (optional)
✔ Premium / Discount Zones
All plotted with precision.
All customizable.
All built to remove guesswork.
💹 4. Multi-MA Engine (5 Fully Configurable MAs)
✔ EMA, SMA, WMA, VWMA, SMMA
✔ Choose length, color, and source
✔ Ideal for trend confirmation + dynamic S/R
Smooth. Clean. Non-laggy.
📊 5. Enhanced Supertrend (Toggles + Filters)
✔ Switch between Line / Histogram / Hidden
✔ Optional background trend coloring
✔ Buy/Sell signals with trend-change alerts
✔ No repaint
Perfect for directional bias.
⚡ 6. Breakout Detection + Volume Confirmation
✔ Auto-detects Support/Resistance Breaks
✔ Confirms breaks through Volume Surge % Oscillator
✔ Detects:
Bullish Breaks
Bearish Breaks
Bullish Rejections
Bearish Rejections
You instantly know when a breakout is real or fake.
📍 7. VWAP System with Multi-Band Zones
✔ Session-based VWAP
✔ Bands via Std Deviation or %
✔ Clean pullback zones
✔ Perfect for intraday institutions-style precision
🧠 8. Fully Integrated Alerts
Alerts for:
✔ BOS / CHoCH (Internal + Swing)
✔ Order Block Breakouts
✔ Equal Highs / Equal Lows
✔ Fair Value Gaps
✔ S/R Zone Interactions
✔ Trend Shifts
✔ Breakouts with Volume Confirmation
✔ Supertrend Reversals
And more.
Never miss major price shifts again.
🎨 9. Clean UI + Auto-Adaptive Watermark
✔ Auto-contrast watermark
✔ Minimalistic but premium
✔ Chart-friendly colors
✔ Built to match dark or light themes
🌍 Who This Indicator Is For?
✔ Intraday traders
✔ Swing traders
✔ SMC traders
✔ Volume/Order Flow traders
✔ Forex, Crypto, Index & Stocks
✔ Anyone wanting a single all-in-one trading system
🔥 Why 90% Traders Love This System
Because it gives you:
🔥 Session Bias
🔥 Volume-backed Zones
🔥 Clean Market Structure
🔥 Trend Bias + Liquidity Areas
🔥 Institutional S/R with Strength Meter
🔥 Accurate Order Flow Reactions
Everything you need to trade like top-tier professionals — without needing 10 indicators.
🛒 Get Full Access
This premium institutional system is available as part of the Courses Section on the official website.
👉 Purchase the indicator as a Course at:
www.ironmindtrader.com
Inside the course, you'll get:
✔ Access instructions
✔ Setup guide
✔ Trading rules
✔ Updates included
BMM V2.1 FINAL VERSION ⚙️ Optimized Trading Guide — MWABUFX 15-Minute Intraday Setup
🕒 Recommended Timeframe
✅ 15-Minute Chart (M15) — the most balanced and accurate for MWABUFX.
Why M15 Works Best:
Filters out small, noisy market movements found on 1m–5m charts.
Responds faster than 1H or 4H, perfect for daily profits.
Aligns well with market session volatility (London & New York).
Gives 2–5 high-probability trades per day depending on the pair.
Ideal for traders using PineConnector automation or manual execution.
🧭 How to Trade on 15-Minute
🟢 Buy Setup
EMA 238 is sloping upward and price is above it.
Supertrend flips green — wait for candle to close above the line.
Confirm trend direction on 1H timeframe (optional filter).
Enter trade at the close of the signal candle.
Stop-Loss: below recent swing low.
Take Profits:
TP1 → 1:1
TP2 → 1:2
TP3 → 1:3
Move SL to breakeven after TP1 is hit.
🔴 Sell Setup
EMA 238 is sloping downward and price is below it.
Supertrend flips red — wait for candle to close below the line.
Confirm 1H trend also bearish (optional).
Enter trade at the candle close.
Stop-Loss: above recent swing high.
Take Profits: TP1, TP2, TP3 as above.
🕐 Best Trading Hours (Kenya Time / GMT+3)
Session Time Ideal Pairs Notes
London Session 10:00 AM – 2:00 PM GBPUSD, EURUSD, Gold Cleanest 15-min trends
New York Session 3:30 PM – 7:00 PM US30, NAS100, XAUUSD, GBPUSD Strong volatility, high RR trades
Avoid After 8:30 PM — Market slows down, spreads widen
📌 If you must choose one — trade 15-minute charts during London–New York overlap (3:30 PM – 6:30 PM).
⚖️ Risk & Profit Strategy
Risk only 1–2% of balance per trade.
Focus on 1–3 solid setups per session — no overtrading.
Aim for minimum 1:2 reward-to-risk ratio.
Avoid entries when EMA 238 is flat (ranging market).
💡 Pro Tips
Use “Close of Candle” confirmation — avoid jumping in mid-bar.
Combine with session bias (e.g. buy Gold during bullish NY momentum).
Use alerts through PineConnector to catch trades instantly.
Don’t trade during major red news (NFP, CPI, FOMC).
Journal every trade — review TP/SL behavior to improve timing.
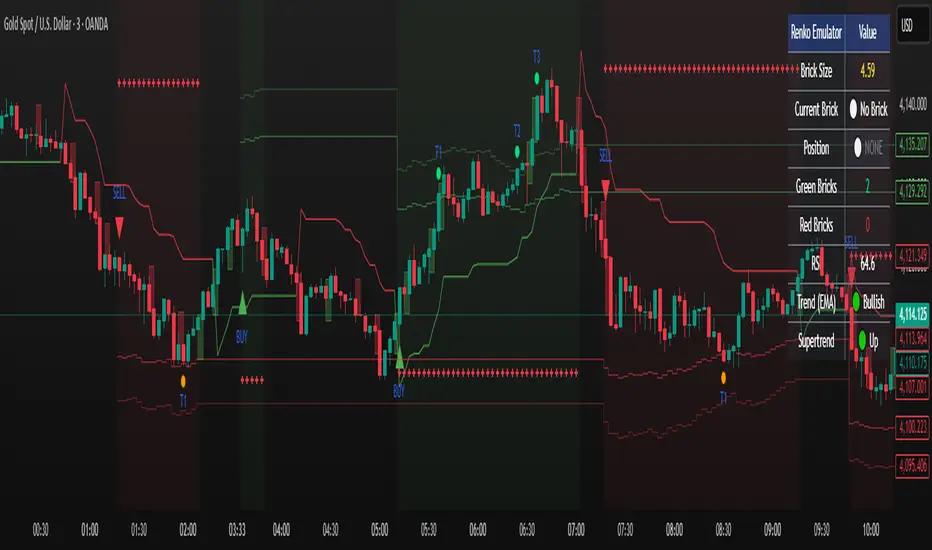
Renko Emulator Strategy # 🚀 Renko Emulator Strategy for Normal Candlestick Charts
Transform your trading with this advanced Renko-based strategy that works seamlessly on normal candlestick charts!
## ✨ What Makes This Special?
### 🎯 Smart Signal System
- **One Signal at a Time**: No confusing duplicate signals
- **Position State Tracking**: Always know your current position
- **Automatic Target Detection**: T1, T2, T3 calculated automatically
- **10 Comprehensive Alerts**: Never miss an opportunity
### 🔧 Technical Excellence
- **Renko Logic**: Filters market noise using brick formations
- **ATR-Based Sizing**: Adapts to market volatility
- **Multi-Indicator Confirmation**: EMA, RSI, MACD, Supertrend
- **Volume Validation**: Only high-probability setups
## 📊 How It Works
### Entry Signals
🟢 **LONG (BUY)**
- Reversal: Red bricks → First green brick
- Trend: 3+ consecutive green bricks
- With full technical confirmation
🔴 **SHORT (SELL)**
- Reversal: Green bricks → First red brick
- Trend: 3+ consecutive red bricks
- With full technical confirmation
### Position Management
📍 **Stop Loss**: Last opposite brick ± buffer
🎯 **Target 1**: 2× Brick size → Book 50%
🎯 **Target 2**: 3× Brick size → Book 30%
🎯 **Target 3**: 4× Brick size → Book 20%
### Exit Rules
⚠️ Opposite brick formation
⚠️ RSI extremes (>80 or <20)
⚠️ Manual exit as needed
## 🎨 Visual Features
### On Your Chart
- 📊 Renko brick overlays
- 🟢 Green triangles = BUY signals
- 🔴 Red triangles = SELL signals
- ⚪ Target hit markers (T1, T2, T3)
- 📈 Trend indicators overlay
- 🎨 Position background color
### Info Panel
Real-time dashboard showing:
- Current brick size & color
- Position status (LONG/SHORT/NONE)
- Consecutive brick count
- RSI level
- Trend direction
- Market conditions
## 🔔 Complete Alert System
**10 Alerts Available:**
✅ Long & Short Entry
✅ All 6 Target Hits (T1, T2, T3 each)
✅ Long & Short Exit
**Alert Messages Include:**
- Entry price & direction
- Profit booking instructions
- Risk management tips
- Next action guidance
## 💰 Best Instruments
### Highly Effective On:
- **Indian Markets**: Nifty 50, Bank Nifty
- **Stocks**: HDFC, Reliance, TCS, Infosys
- **Forex**: EUR/USD, GBP/USD, USD/JPY
- **Crypto**: BTC, ETH, major altcoins
- **Commodities**: Gold, Silver, Crude Oil
### Recommended Timeframes:
- **Day Trading**: 5-min, 15-min
- **Swing Trading**: 1-hour, 4-hour
- **Position Trading**: Daily
## ⚙️ Customizable Settings
### Brick Configuration
- ATR-based (automatic) or Fixed points
- Adjustable ATR period & multiplier
- Visual brick display on/off
### Indicator Parameters
- EMA length (default: 20)
- RSI period (default: 14)
- MACD settings (12, 26, 9)
- Supertrend (10, 3)
- Volume filter toggle
### Display Options
- Show/hide entry signals
- Show/hide target levels
- Show/hide info table
- Brick overlay transparency
## 📈 Usage Strategy
### For Beginners:
1. Add to chart with default settings
2. Wait for clear BUY/SELL arrows
3. Follow position management rules
4. Use recommended stop losses
5. Book profits at targets
### For Advanced Traders:
1. Optimize brick size per instrument
2. Fine-tune indicator parameters
3. Combine with your strategy
4. Backtest thoroughly
5. Scale position sizes
## ⚠️ Risk Management
### Built-in Protection:
- Maximum 2% risk per trade
- Clear stop loss levels
- Defined profit targets
- Position size calculator
- Daily loss limits
### Best Practices:
✅ Test on demo first
✅ Use proper position sizing
✅ Follow stop losses strictly
✅ Don't over-trade
✅ Maintain trading journal
## 🎓 What You Get
### Immediate Benefits:
- Clear entry/exit signals
- No analysis paralysis
- Reduced emotional trading
- Systematic approach
- Professional risk management
### Learning Opportunities:
- Understand Renko concepts
- Master position management
- Learn risk control
- Develop discipline
- Build consistent strategy
## 🐛 Troubleshooting
### No Signals?
- Check indicator settings
- Verify brick size not too large
- Ensure volume filter appropriate
- Try different timeframe
### Too Many Signals?
- Increase brick size
- Use higher timeframe
- Enable stricter filters
- Check signal filtering active
## 📊 Performance Notes
### Works Best In:
✅ Trending markets
✅ Clear directional moves
✅ Good liquidity
✅ Normal volatility
### Avoid Trading:
❌ Major news events
❌ Low volume periods
❌ Extreme volatility
❌ Choppy/sideways markets
## 🔄 Updates & Support
**Current Version**: 2.0
**Recent Updates:**
- ✅ Fixed duplicate signals
- ✅ Added position tracking
- ✅ Enhanced alert system
- ✅ Improved visual feedback
- ✅ Better target detection
**Future Plans:**
- Additional customization
- More alert options
- Advanced features
- Performance improvements
## 📜 Important Disclaimer
⚠️ **Please Read Carefully:**
This indicator is for **educational purposes only**. Trading involves substantial risk of loss. Past performance does not guarantee future results.
**You Must:**
- Use proper risk management
- Test strategies before live trading
- Never risk more than you can afford to lose
- Consult financial advisor if needed
- Understand your trading instrument
**The creator assumes no responsibility for trading losses incurred using this indicator.**
## 🙏 Credits
- Renko Concept: Traditional Japanese charting
- ATR Calculation: J. Welles Wilder
- Community Feedback: Beta testers & users
---
## 💬 Feedback Welcome!
If you find this helpful:
- ⭐ Like the indicator
- 💬 Share your feedback
- 🐛 Report bugs
- 💡 Suggest improvements
- 🔄 Share with traders
## 📞 Getting Started
1. **Add to Chart**: Click "Add to Chart"
2. **Configure Settings**: Adjust as needed
3. **Set Alerts**: Enable notifications
4. **Test First**: Use demo account
5. **Go Live**: Start small, scale up
---
**Happy Trading! 📈🚀**
**Trade Smart. Trade Safe. Trade Profitable.**
---
*Remember: Discipline + Risk Management + Good Strategy = Success*
*No indicator is perfect. Use as part of complete trading plan.*
DAMMU AUTOMATICAL AI ENRTY AND TARGET AND EXITMain Components
Supertrend System –
Detects market trend direction (Buy/Sell zones).
→ Green = Uptrend (Buy)
→ Red = Downtrend (Sell)
SMA Filter –
Uses 50 & 200 moving averages to confirm overall trend.
→ Price above both → Bullish
→ Price below both → Bearish
Buy/Sell Signals –
Generated when Supertrend flips direction and SMA confirms.
→ Triangle up = Buy
→ Triangle down = Sell
Take Profit / Stop Loss Levels –
Automatically calculated after Buy/Sell entry.
→ TP1, TP2, SL shown on chart
ADX (Sideways Zone Filter) –
If ADX < 25 → Market sideways → Avoid trades
Shows “No Trade Zone” area
Smart Money Concepts (SMC) Tools –
🔹 Market structure (HH, HL, LH, LL)
🔹 Order blocks (OB)
🔹 Equal highs/lows
🔹 Fair Value Gaps (FVG)
🔹 Premium & Discount zones
Helps find institutional entry points
Visual Display –
Color-coded background (trend zones)
Labels for buy/sell/structure
Optional FVG and order block boxes
Risk Management –
Input-based position sizing, SL & TP management
(to calculate profit levels and minimize loss)

MTF Intraday v2.0📊 Description
MTF Intraday v2.0 is an informative indicator for analyzing trend strength across multiple timeframes simultaneously. Designed specifically for intraday (session) trading during European and US market hours.
The indicator shows the real market picture without lagging signals - you see the trend strength right now for each timeframe.
🎯 Key Features
1. Multi-Timeframe Analysis (D1, H4, H1, M30, M15)
Analyzes 4 indicators on each TF: SuperTrend, RSI, EMA crossover, EMA200
Shows strength for each timeframe: STRONG / MED / WEAK
Color indication: 🟢 green (LONG strong), 🔴 red (SHORT strong), 🟡 yellow (medium), ⚪ gray (weak)
2. Intraday Trading Hierarchy
D1 - global context (affects quality assessment)
H4 - general (sets the main trend)
H1 - reference point for intraday
M30/M15 - finding entry points during sessions
3. Market Pulse
🔥 HOT - when both H4 and H1 are STRONG (best time to enter!)
✓ GOOD - when H4 or H1 is STRONG
L:45 S:20 - balance of power between LONG and SHORT (statistics instead of "wait")
4. Volume Indicator (24 hours)
Shows volume change over the last 24 hours
SPIKE! - when volume increased by the set % (default 50%)
Considers candle color: 🟢 LONG spike (rise + green candle), 🔴 SHORT spike (rise + red candle)
Works on any timeframe (automatically recalculates)
5. Compact Mode
OFF - shows all details: every indicator for each TF
ON - only strength per timeframe (for clean chart)
⚙️ Settings
Main:
SuperTrend Period (21) / Multiplier (6.3)
RSI Length (14)
EMA Short (50) / Long (100) / 200
Compact Mode - hide detailed indicators
Volume:
Show Volume - show/hide volume indicator
Volume Alerts ON/OFF - enable/disable volume alerts
Volume Spike (%) - spike threshold (30% / 50% / 100%)
🔔 Alerts
The indicator has 5 types of alerts:
Market HOT - H4 and H1 simultaneously became STRONG
VOL LONG - volume spike on bullish candle
VOL SHORT - volume spike on bearish candle
EMA200 UP - price crossed EMA200 upward
EMA200 DN - price crossed EMA200 downward
Set up in TradingView: Create Alert → Select desired alert from the list
📈 How to Use
For finding entry points:
Check H4 - should be at least MED (better STRONG)
Verify H1 - main filter for intraday
Wait for pulse "🔥 HOT" or at least "✓ GOOD"
Look at M30/M15 - seek confirmation
Check 24h VOL - if SPIKE, momentum has started
Quality Assessment:
EXCELLENT ⭐ - all stars aligned (D1 with us, high score)
GOOD - good setup
WARNING ⚠️ - D1 against trend (counter-trend, be careful!)
Color Indication:
🟢 Green cells - bullish signal
🔴 Red cells - bearish signal
🟡 Yellow cells - neutral/waiting
🟠 Orange TF labels - for readability
⚠️ Important
This is an informative indicator, not a trading system
Does not give "entry/exit" signals - shows trend strength in the moment
Use together with Price Action and your trading strategy
RSI on M15 is displayed but not counted (too much noise)
💡 Who is it for
✅ Intraday traders (Europe/US sessions)
✅ Scalpers on crypto and forex
✅ Swing traders for trend confirmation
✅ Those who trade on multiple timeframes simultaneously

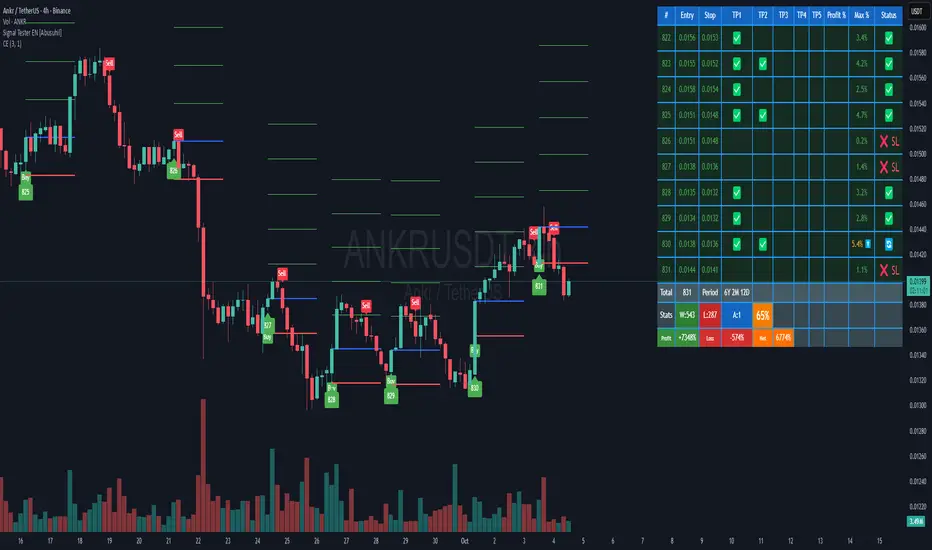
Signal Tester EN [Abusuhil]Signal Tester - Complete Description
Overview
Signal Tester is a comprehensive trading tool designed to backtest and analyze external trading signals with advanced risk management capabilities. The indicator provides seven different calculation methods for stop-loss and take-profit levels, along with detailed performance statistics and real-time tracking of active trades.
Important Disclaimer: This indicator is a tool for analysis and education purposes only. Past performance does not guarantee future results. Trading involves substantial risk of loss and is not suitable for all investors. Always conduct your own research and consider seeking advice from a qualified financial advisor before making trading decisions.
Key Features
7 Calculation Methods for customizable risk management
External Signal Integration via any oscillator or indicator
Real-time Trade Tracking with visual entry/exit points
Comprehensive Statistics Table showing win rate, profit/loss, and active trades
Date Filtering for focused backtesting periods
Custom Alerts for new buy signals
Multi-Target System with up to 5 take-profit levels
How to Use
Step 1: Connect External Signal
The indicator requires an external signal source to generate buy signals.
Add your preferred indicator to the chart (RSI, MACD, Stochastic, custom indicator, etc.)
In Signal Tester settings, locate "External Indicator" input
Click the input and select your indicator's plot line
Buy signals are generated when the external source crosses above zero
Example: If using RSI, connect the RSI line. A buy signal triggers when RSI crosses above the zero reference (if plotted as oscillator).
Step 2: Choose Your Calculation Method
Select one of seven methods under "Calculation Method":
1. Percentage %
The simplest method using fixed percentage values.
Settings:
Stop Loss %: Distance from entry to stop-loss (default: 2%)
Target 1-5 %: Distance from entry to each take-profit level
Example: Entry at $100
Stop Loss (2%): $98
Target 1 (2%): $102
Target 2 (4%): $104
Best For: Beginners, markets with consistent volatility
2. ATR Multiplier
Uses Average True Range for dynamic levels based on market volatility.
Settings:
ATR Period: Calculation period (default: 14)
Stop Multiplier: ATR multiplier for stop-loss (default: 1.5)
Target Multipliers: ATR multipliers for each take-profit
Example: Entry at $100, ATR = $2
Stop Loss (1.5x ATR): $100 - $3 = $97
Target 1 (2x ATR): $100 + $4 = $104
Best For: Volatile markets, adapting to changing conditions
3. Risk:Reward Ratio
Calculates targets based on risk-to-reward ratios.
Settings:
Stop Loss %: Initial risk percentage
Target Ratios: R:R ratio for each target (1:1.5, 1:2, 1:3, etc.)
Example: Entry at $100, Stop at $98 (2% risk = $2)
Target 1 (1:1.5): $100 + ($2 × 1.5) = $103
Target 2 (1:2): $100 + ($2 × 2) = $104
Target 3 (1:3): $100 + ($2 × 3) = $106
Best For: Traders focused on risk management and position sizing
4. Swing High/Low
Places stop-loss at recent swing low with targets as multiples of the risk.
Settings:
Swing Lookback Candles: Number of bars to find swing low (default: 5)
Stop Safety Distance %: Buffer below swing low
Target Multipliers: Risk multiples for each target
Example: Entry at $105, Swing Low at $100
Stop Loss: $100 - 0.1% = $99.90 (risk = $5.10)
Target 1 (1.5x): $105 + ($5.10 × 1.5) = $112.65
Best For: Swing traders, respecting market structure
5. Partial Take Profit
Sells portions of the position at each target level, moving stop to entry after first target.
Settings:
Stop Loss %: Initial stop distance
Target 1-5 %: Price levels for partial exits
Sell % at TP1-4: Percentage of position to close at each level
Example: 100% position, 50% sell at each target
TP1 hit: Sell 50%, remaining 50%, stop moves to entry
TP2 hit: Sell 25% (50% of remaining), remaining 25%
TP3 hit: Sell 12.5%, remaining 12.5%
Best For: Conservative traders, locking in profits gradually
6. Trailing Stop
Similar to Partial Take Profit but trails the stop-loss to each achieved target.
Settings:
Stop Loss %: Initial stop distance
Target 1-5 %: Price levels for trailing stops
Sell % at TP1-4: Percentage to close at each level
Example:
TP1 ($102) hit: Sell 50%, stop trails to $102
TP2 ($104) hit: Sell 25%, stop trails to $104
Price retraces to $104: Exit with locked profits
Best For: Trend followers, maximizing profit in strong moves
7. Smart Exit
Advanced method that moves stop to entry after first target, then exits based on technical conditions.
Settings:
Stop Loss %: Initial stop distance
First Target %: When hit, stop moves to breakeven
Exit Method: Choose from 8 exit strategies
Exit Methods:
Close < EMA 21: Exits when price closes below 21-period EMA
Close < MA 20: Exits when price closes below 20-period Moving Average
Supertrend Flip: Exits when Supertrend indicator flips bearish
ATR Trailing Stop: Dynamic trailing stop based on ATR
MACD Crossover: Exits on MACD bearish crossover
RSI < 50: Exits when RSI drops below specified level
Parabolic SAR Flip: Exits when SAR flips above price
Bollinger Bands: Exits when price closes below middle or lower band
Best For: Advanced traders, letting winners run with protection
Date Filtering
Control which trades are included in backtesting.
Filter Types:
Specific Date: Only trades after selected date
Number of Weeks: Last X weeks (default: 12)
Number of Months: Last X months (default: 3)
How to Enable:
Check "Enable Date Filter"
Select filter type
Set the date or number of weeks/months
Use Case: Test strategy performance in recent market conditions or specific periods
Understanding the Statistics Table
The table displays the last 10 trades plus comprehensive statistics:
Trade Columns:
#: Trade number
Entry: Entry price
Stop: Current stop-loss level
TP1-TP5: Checkmarks (✅) when targets are hit
Profit %: Realized profit for the trade
Max %: Maximum unrealized profit reached (⬆️ indicates active trade)
Status:
🔄 Active trade
✅ Closed winner
❌ SL - Stopped out
Summary Row:
Total: Number of trades executed
Period: Duration of trading period (Years, Months, Days)
Statistics Row:
W: Number of winning trades
L: Number of losing trades
A: Number of active (open) trades
Win Rate %: (Wins / Total Trades) × 100
Performance Row:
Profit: Total profit from all winning trades
Loss: Total loss from all losing trades
Net: Net profit/loss (Profit - Loss)
Visual Elements
When a buy signal triggers, the indicator draws:
Blue Line: Entry price
Red Line: Stop-loss level
Green Lines: Take-profit levels (up to 5)
Green Label: Trade number below the entry bar
Green Triangle: Buy signal marker
Alerts
The indicator includes customizable alerts for new buy signals.
Setting Up Alerts:
Click the "⏰" icon in TradingView
Select "Signal Tester "
Choose condition: "Buy"
Configure notification preferences (popup, email, webhook)
Click "Create"
Alert Message Format:
🚀 New Buy Signal!
Price:
Trade #:
Best Practices
Backtest First: Test each calculation method on historical data before live trading
Match Timeframe: Use the indicator on the timeframe you plan to trade
Combine with Analysis: Use alongside support/resistance, trend analysis, and other tools
Risk Management: Never risk more than 1-2% of capital per trade
Review Statistics: Regularly check win rate and profit/loss metrics
Adjust Settings: Optimize parameters based on the asset's volatility and your risk tolerance
Limitations
Requires external signal source (does not generate signals independently)
Backtesting assumes perfect entry/exit execution (real trading includes slippage)
Past performance does not guarantee future results
Should be used as one component of a complete trading strategy
Version Information
Version: 1.0
Pine Script Version: v5
Type: Overlay Indicator
Author: Abusuhil
Support and Updates
This indicator is provided as-is for educational and analytical purposes. Users are responsible for their own trading decisions and should thoroughly test any strategy before implementing it with real capital.
Risk Warning: Trading financial instruments carries a high level of risk and may not be suitable for all investors. The high degree of leverage can work against you as well as for you. Before deciding to trade, you should carefully consider your investment objectives, level of experience, and risk appetite. Only trade with money you can afford to lose.