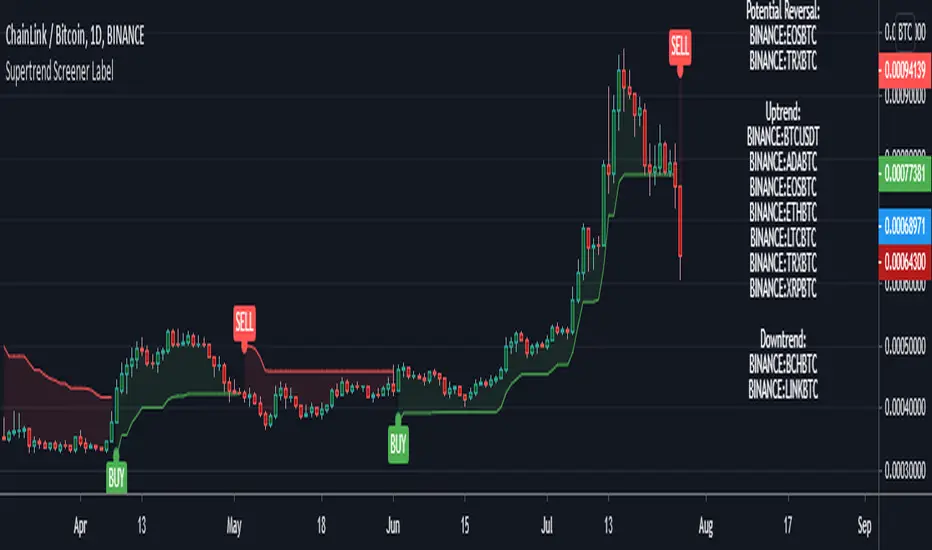
Supertrend Screener LABELThis screens for Supertrend reversal's in 10 different securities. The main logic for the screener is taken from "Simple Custom Screener in Pinescript" by QuantNomad with his permission. If the label color is not visible due to the text in it being white colored, then choose a different color from settings. Also added a simple supertrend to it.
Terminology explanation:
Confirmed Reversal: Supertrend reversal that happened in the last bar and cannot be repainted.
Potential Reversal: Supertrend reversal that might happen in the current bar but can also not happen depending upon the timeframe closing price.
Uptrend/Downtrend : Shows all the tickers that are either currently in uptrend or downtrend.
Cerca negli script per "supertrend"
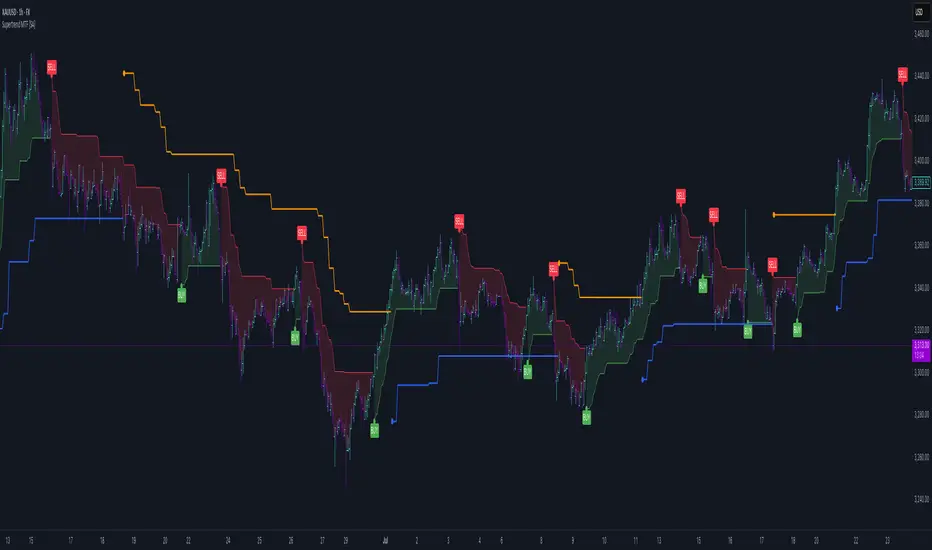
Supertrend BUY Only - Optimized for Gold M15 TimeframeOverview
The Supertrend BUY Only - Production Optimized is a high-performance trend-following indicator specifically tuned for XAUUSD (Gold) on the 15-minute timeframe. Unlike standard Supertrend scripts, this version focuses exclusively on bullish cycles to align with long-term upward bias and uses parameters discovered through deep data analysis of over 20,000 bars of historical market data.
Key Features
Data-Optimized Parameters: Defaults are set to ATR Period 7 and Multiplier 2.1, which backtesting has shown to provide a superior balance between sensitivity and noise reduction for Gold.
Production-Ready Alerts: Includes built-in alertcondition triggers for both BUY (Trend Flip) and STOP BUY (Trend Exit), complete with dynamic messages that include price and interval.
Trailing Support Band: Uses a trailing logic that locks in support levels during upward moves, preventing the band from dropping until the trend officially reverses.
Clean Visuals: Focuses on chart clarity by only plotting the support line during active uptrends and utilizing clean shape labels for entries and exits.
How to Use
Entry (BUY): When the Supertrend line flips from Red to Green and a "BUY" label appears. This indicates bullish momentum has overcome recent volatility.
Exit (STOP BUY): When the price closes below the Green support line. The indicator will plot a red "X" and clear the green background.
Setting Alerts: * Click the Alerts icon in TradingView.
Select this indicator under "Condition."
Choose "BUY Signal" for entries and "STOP BUY / EXIT" for managing your trade or taking profit.
Technical Details
The script allows users to toggle between the TradingView (RMA) ATR calculation and the Standard (SMA) method. For production and live trading, the RMA method is recommended as it provides a smoother response to volatility spikes common in the Gold market.

SuperTrend ZoneThe SuperTrend Zone indicator is a tool designed to help traders identify the best zone to enter in a position revisiting the usage of the standard SuperTrend indicator.
In the settings you can chose the ATR length and the Factor of the indicator, and in addition to that you can also change the multiplier for the zone width.
This indicator provide two different SuperTrend indicator, the first one has the settings that you chose and display the zone, meanwhile the second one has double the parameters you have chosen and can be used to determine the long term trend direction.

supertrend advanceHELLO FRIENDS ...............THIS IS SUPERTREND ADVANCE WITH HENKIASHI CANDLE ...I got so many request on supertrend with henkiashi. This is for all of them ..I am making it open for all so you can change its coding according to your need
SOME IMPONTENT UPDATE IN THIS SUPERTRNED
1) You Can Use It for option trading ...you can do algo option trading using this strategy
2) YOU CAN USE CUSTOME SYNTAX TO ALGO TRADE IN STOCK,FOREX,COMMODITY AND CRYPTO
3) YO CAN USE IT IN INTRADAY TIME PERIOD ALSO U CAN SET ITS ENTRY AND EXIT TIME
4) YOU CAN USE HENKIASHI SUPERTREND ON NORMAL CANDLE STICK CHART
5) YOU CAN USE ITS QUNTITY FEATURE .BY THIS WAY U CAN DOUBLE YOUR QUNTITY SIZE ON LOSSING TRADE AND WHEN PROIFT TRADE OCCUR ITS QUNTITY AGAIN AUTOMATICALLY SHIFTED TO NORMAL QUNTITY ....THIS FEATURE ONLY HELP TRADER WITH MORE MARGIN....USE THIS FEATURE PROPERLY.THIS FEATURE BEST WORK ON ONE SIDE MEANS ONLY BUY SIDE TRADE OR SELL SIDE TRADE
6)YOU CAN SET YOUR TARGET AND STOPLOSS IN POINTS AND IN PERCENTAGE
7) YOU CAN CHOSE ONE SIDE TO TRADE ONLY BUY SIDE OR SELL SIDE
HOPE THIS FEARTURES HELPS EVERY ONE
ALL THE BEST FOR SUCESSFULL TRADING

SuperTrend+ DuoUses two SuperTrend+ indicators to signal when a change in trend is confirmed.
By using a minor trend within the major, a pullback after a turning point can signal a more optimal entry.
See SuperTrend+ for more details.

Supertrend (MTF) & Parabolic SAROne of my mixed approach strategy indicators which includes:
- Parabolic SAR
- 1 Hour Supertrend
- 4 Hour Supertrend
Whilst this script may appear slow due to the 4hr Supertrend, it does a great job of managing breakouts.
Using this indicator is simple, if the line labeled Lifetime is green then buy, if red then sell OR don't trade. So...
Green Line - This strategy is in a buy position
Red Line - This strategy is in a sell position
Any other Color - DON'T TRADE
The traders approach is simple, when all indicators are green or red, then take the trade. As soon as one indicator changes, then re-evaluate using your normal process, such as price action, to determine whether to close the trade or continue.
If you require any further information or script modifications, please message me.
PLEASE CHECK OUT MY OTHER SCRIPTS

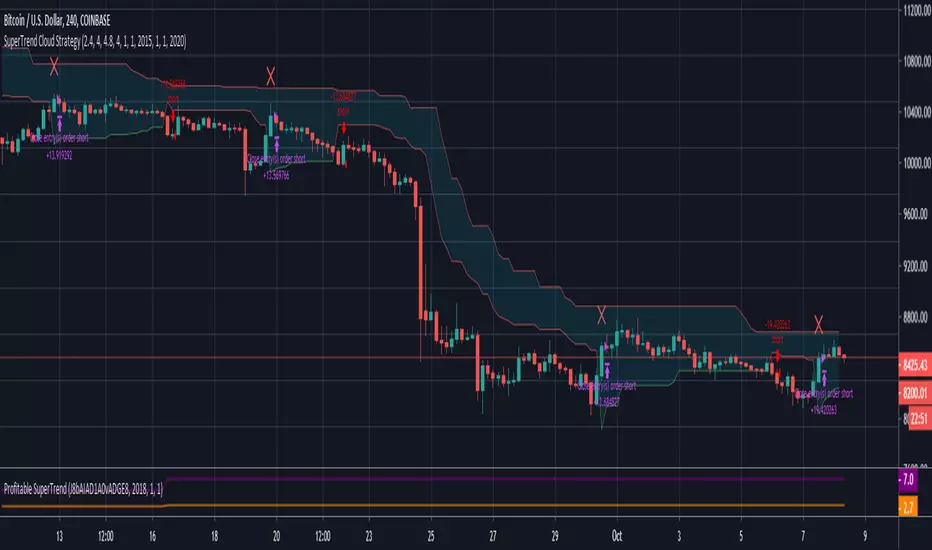
SuperTrend Cloud StrategyExperimental strategy to improve accuracy of SuperTrend Cloud. I am attempting to use STD deviation to manipulate the multiplier of the SuperTrend cloud. Greater STD Deviation = Oscillation in price action which can be applied to multiplier of SuperTrend to filter out bad trades and improve accuracy.
Supertrend Multi Time Frame - Auto HTF calculationThere is already SuperTrend indicator and thanks to its developer.
This script draws supertrend for current and higher time frame, it automatically calculates higher time frame and you don't need to adjust it when you change the period.
it also change the color of bars according to current and HTF supertrend, so you can see the trend by looking at bars color.
Bar color is lime if trend is up and red if trend is down. but if you see white bars then there is movement opposite the main trend.
if you like it please comment.

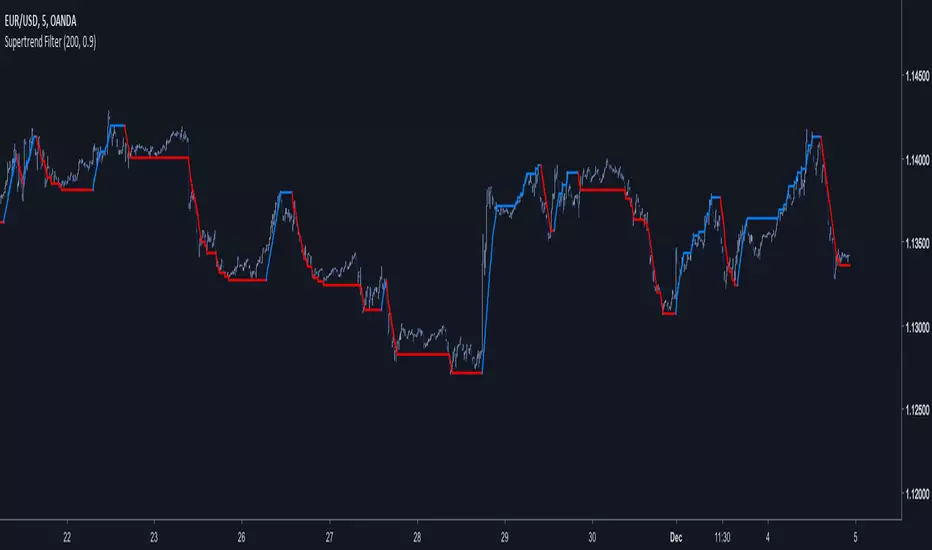
Supertrend FilterA derivation of the famous SuperTrend indicator.
My motivation for such indicator was to use more recursion in the original SuperTrend code, this work was made quite fast but feel free to modify it, as always my work is more for inspirational use than anything else so i hope it will inspire you to get more involved with the SuperTrend code or to start coding with Pine.
The indicator no longer act as a trailing-stop but more like a filter, this is due to the fact that the indicator conditions are swapped and that the output is reused many times in the calculation.
Parameters change as well and involve particular gestion. The Factor Parameter is no longer an integer but decimals such that 0 < Factor < 1 .
When the Period is high the indicator tend to become less linear/static and look more like a classic moving average.So it is important to have higher Factor values when the Period is high and reciprocally.Here a table to help you with parameters settings :
for Period = 1 to 50 Factor = 0.5
for Period = 50 to 100 Factor = 0.6
for Period = 100 to 150 Factor = 0.7
for Period = 150 to 200 Factor = 0.8
for Period = 200 to 300 Factor = 0.9
There could be a formula to scale the Factor depending on the Period but there would be no proof that the scaling method used is optimal.
Hope you enjoy
For any questions/demands feel free to pm me, i would be happy to help you
SuperTrend Oscillator v3Version 3: Improved aesthetically, complete turnaround for the strategy with which to use this indicator.
Once again, thanks to BlindFreddy and ChrisMoody for the bits of code that were assembled into this indicator.
Make the chart yours using the share button for the indicator with barcolors functionality.
Changes from v2 and looking forward: Indicator now uses a 14 length SuperTrend with no ATR multiplier. This my preferred use and I'd be grateful to hear your case for a different length/multiplier. Removed the Bollinger Bands and retracement dots due to these being gimmicky and marginally useful. There may be a version 4 should a similar concept using a rate of change analysis turn out to be useful. I have also tried -in vain- to plot internal trend peaks as horizontal S/R levels. Please pm if you are willing to help in that respect.
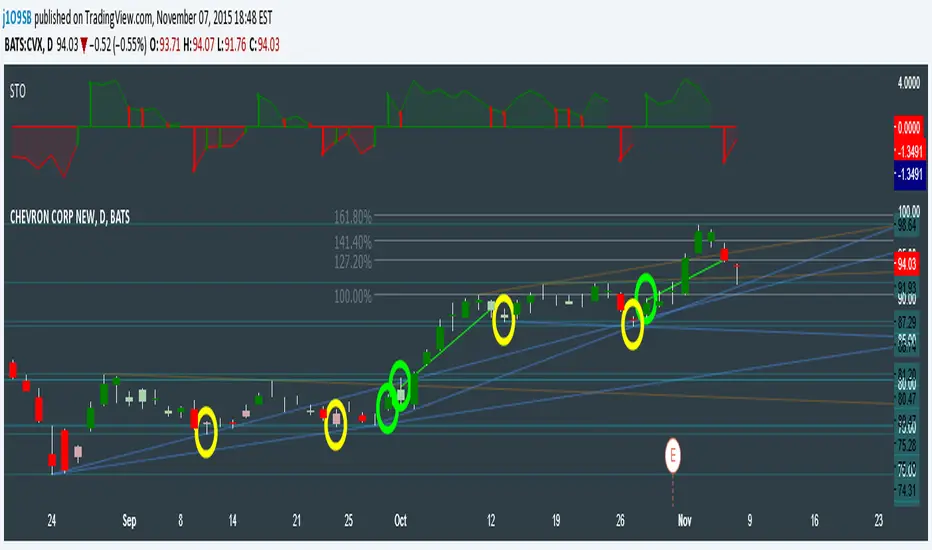
Strategy: The indicator will display the trend as a red/green area. It measures the spread between the closing price and the SuperTrend line, much like a CCI (close and ma). When the area contracts warning bars of the opposite trend color will warn of a reversal. When this happens, these areas will either be defended, reviving the trend, or will break, causing a trend flip. SuperTrend is unique in that breaks are typically large candles, and that its levels, especially on Weekly, Daily, Hourly, Minute timeframes, these levels will be defended (think similar to a 200sma or a 21ema). The STO making new highs within (internal) a trend is an overextension sign.
CVX Example: This is not a full analysis of CVX's stock , just an example potential trades. On the posted chart I used a weekly and a daily STO.
Long 1:The weekly showed warnings and then flipped. The daily made a double bottom, showed warnings and then flipped the daily STO at trendline support.
Long 2:The weekly still shows an uptrend, the daily made a weak break to downtrend and reversed back upwards at trendline support, forming a double bottom. Note the conservative exit when the STO made an internal new high.
Long 3: looking forward on CVX stock , the current downtrend made a weak break and is showing sings of reversal (pin bar) at horizontal support. Go long on flip of the daily (conservative) or flip of the hourly (aggressive).
SuperTrend OscillatorVersion 3: Improved aesthetically, complete turnaround for the strategy with which to use this indicator.
Once again, thanks to BlindFreddy and ChrisMoody for the bits of code that were assembled into this indicator.
Make the chart yours using the share button for the indicator with barcolors functionality.
Changes from v2 and looking forward: Indicator now uses a 14 length SuperTrend with no ATR multiplier. This my preferred use and I'd be grateful to hear your case for a different length/multiplier. Removed the Bollinger Bands and retracement dots due to these being gimmicky and marginally useful. There may be a version 4 should a similar concept using a rate of change analysis turn out to be useful. I have also tried -in vain- to plot internal trend peaks as horizontal S/R levels. Please pm if you are willing to help in that respect.
Strategy: The indicator will display the trend as a red/green area. It measures the spread between the closing price and the SuperTrend line, much like a CCI (close and ma). When the area contracts warning bars of the opposite trend color will warn of a reversal. When this happens, these areas will either be defended, reviving the trend, or will break, causing a trend flip. SuperTrend is unique in that breaks are typically large candles, and that its levels, especially on Weekly, Daily, Hourly, Minute timeframes, these levels will be defended (think similar to a 200sma or a 21ema). The STO making new highs within (internal) a trend is an overextension sign.
CVX Example: This is not a full analysis of CVX's stock, just an example potential trades. On the posted chart I used a weekly and a daily STO.
Long 1:The weekly showed warnings and then flipped. The daily made a double bottom, showed warnings and then flipped the daily STO at trendline support.
Long 2:The weekly still shows an uptrend, the daily made a weak break to downtrend and reversed back upwards at trendline support, forming a double bottom. Note the conservative exit when the STO made an internal new high.
Long 3: looking forward on CVX stock, the current downtrend made a weak break and is showing sings of reversal (pin bar) at horizontal support. Go long on flip of the daily (conservative) or flip of the hourly (aggressive).

AIR Supertrend (Average Interpercentile Range)Supertrend (ST) is a popular stop loss and trend identification script. The simplicity of seeing a clean trend on a chart makes it attractive, yet it is restricted by only allowing the source, length and multiplier to be adjusted, & these tend to have a limited effect on the properties of the identified trend.
There is a wide variety of interesting ST scripts on TradingView that give the user more control, but none to my knowledge, based on measuring the statistical dispersion of Average Interpercentile Range (AIR).
Two more levels of control:
Normally, ATR Average True Range is used to calculate the range in ST. ATR is initially calculated using RMA to smooth out True Range. This script gives the user the option of changing the MA to some more interesting varieties & modifying their parameters.
The default range setting when you load the indicator on a chart will be AIR.
The real strength of the indicator, however, and the reason I am publishing it, is to release AIR. Play round with the percentile range setting. Lowering it will allow you to stay longer in a trade in a volatile market. Raising it will make it tighter.
For comparison, you can switch back the range setting to ATR and load up RMA to see how the original, classic ST plots.
Alerts are included in this version. Alway use a stop loss.
DISCLAIMER: None of this is financial advice.
Credits to these authors, whose hard work inspired parts of this script:
@ KivancOzbilgic - SuperTrend
@ KioseffTrading - Tillson T3 MA
@ cheatcountry - Hann Window Smoothing
@ mutantdog - Interquartile Range function in his 'Blaze' script

SuperTrend+ CleanedSimilar to SuperTrend+ which allows for confirmation bars.
Differences:
Limited to SMA calculation of average true range.
Can filter outlier volatility.
Can apply a standard deviation to the ATR value.

Supertrend + Stoch StrategyA strategy using ema , supertrend and stochastic .
Long entry conditions:
1. EMA 25 > EMA 50 and EMA 100 > EMA 100.
2. Supertrend indicator is green.
3. Stochastic k line cross over d line.
Long stop: the lowest price of the last k

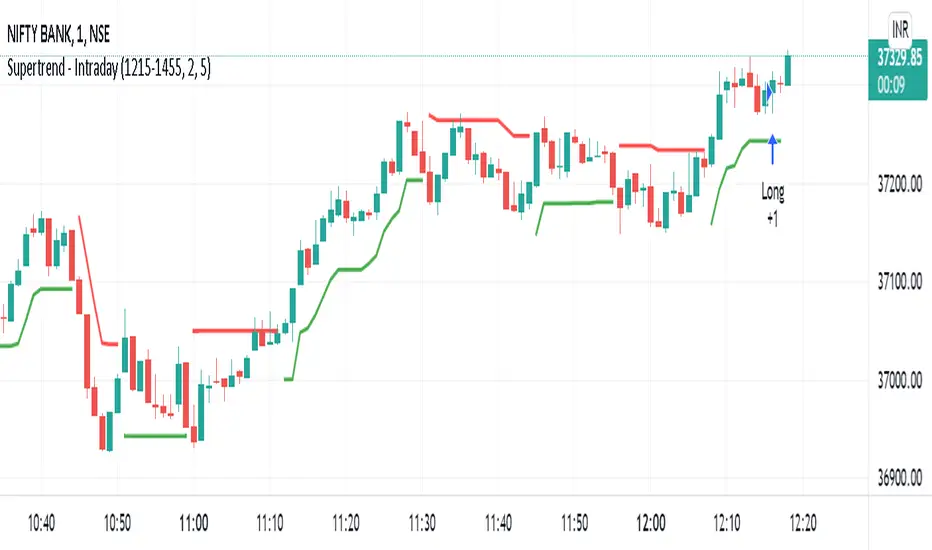
Supertrend - IntradaySupertrend Intraday Strategy
Basic supertrend strategy purpose built for intraday trading. Users can define intraday session during which the strategy will run.
Position is reversed when signal changes by using double quantity. Once the intraday session is over & if the position is open; it is squared off.
Parameters:
Intraday Session - Defines the duration for which the strategy should execute.
Multiplier
ATR Period
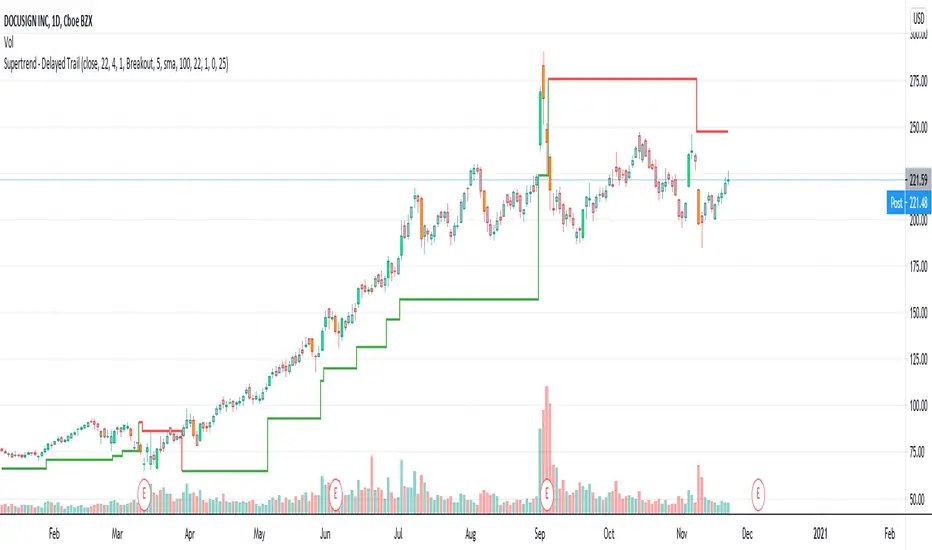
Supertrend - Delayed TrailI use supertrend for for trailing stops. One of the problem of trailing stops in long term trend trading is we get stopped too early and then trend continues. To avoid this problem, we can limit or delay our trailing.
In this modified version of supertrend, we can delay trailing by two methods:
Bars : Trail after certain bars. Input DelayBars says after how many bars it should trail.
Steps : Trail after reaching equivalent stop on the other side.
ConsiderWicks option reverse direction upon high reaching trailing Sell stop or low reaching trailing buy stop (instead of close)
ConsiderWicksForDelayByStep does the same thing for calculating if the steps have reached.
Supertrend MTF Heatmap V2Hello traders and aspiring Pinescripters
You might remember this script Supertrend-Heatmap-Multi-timeframes/ ?
A follower, asked me in a comment to do a version where YOU guys can select the timeframes
Well... what follower asks, follower (sometimes) gets. I'm not Santa Claus but this is Christmas with a few months in advance (#oh #oh #oh)

Supertrend MTF LAG ISSUEThis script based on
we all use Super trend but it main issue is the lag as it buy too late or sell too late
using Deavaet study of Heat map MTF we can do a little trick
if you look on his study you can see that major signal for example will happen in the time frame before it happen at larger time frame
so in this example if signal at MTF 30 min and signal at MTF 60 min happen at the same time at 2 hours or 4 hours candles then this signal are more likely to be true then random signal at each time frame specific.
since we use shorter time frame on larger time frame we can remove the lag issue that make supertrend not so effective
In this example I set the signal to be MTF 30 +60 om 2 hour TF , can be good also for 4 hour candles..
So you get the signal to close inside the larger candle
now if you want to make on even shorter TF then change the code to 15 and 30 MTF on candles on 1 hour
or 1 and 5 min on 30 min or 15 min

Supertrend - 3 signal settings - (Long/Short entry tool)Using SuperTrend lines to indicate a good time for entering on long or short; 3 supertrend settings together. All 3 lines must agree in order to confirm entry. Works like magic!
Feel free to combine with any other of your trusted tools in making decisions.
--------------
Disclaimer:
Above stated is only my personal method, and should not be seen or used as trading advise. Be sure to do further analysis in order to make your decisions in trading. Your trading decisions and methods of are at your own risk.
Supertrend+4moving by pejmantak123for free users:
stop loss trailing and moving average can be use together for best entering and exit position
Supertrend+4moving by pejmantak123

Supertrend + Stoch Strategy Multi-pair Signal AlarmBITSTAMP:BTCUSD
An entry alarm on Supertrend Stoch Strategy . It can monitor 10 trading pairs in one alarm.
Use this script on any trading pair and deploy the alarm. The alert comment shows the pair name, direction, entry point, sl/tp, and percentage of your position you should cost.
I currently use it as a signal for my grid trading.

Supertrend Screener PanelScript to display Supertrend trend state of 8 different securities in a panel. Timeframe & Tickers which are to be displayed can be configured from settings.
Part of code is from the ADX DI Monitoring Panel script by u/wugamlo with his permission. Thanks to him for that and do please check out his work also.

Supertrend MTF [SystemAlpha]This is Supertrend Multi-time Frame script.
There is an option for Higher Tİme Frame Period. if you choose "Auto" then Higher Time Frame calculation would be made by script.
Or you can choose "User Defined" and then you must choose the period for Higher Time Frame.