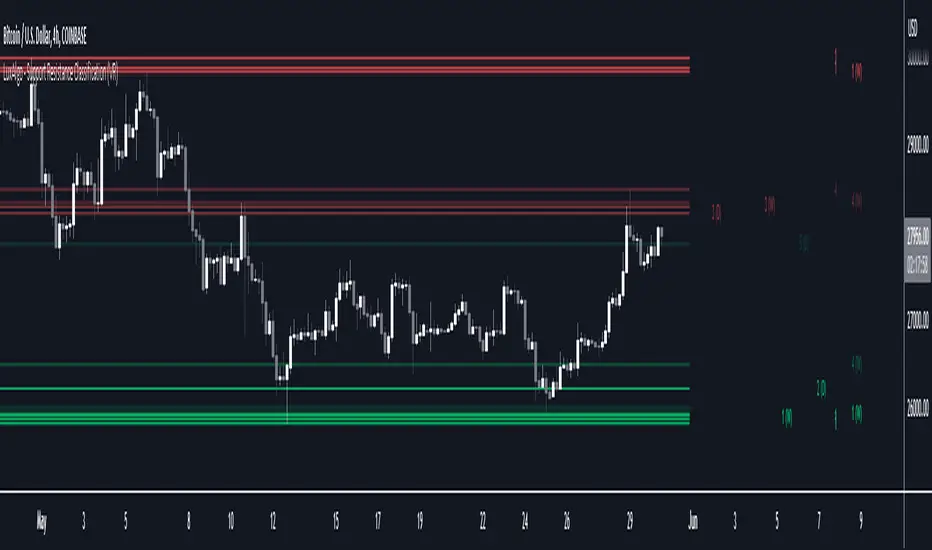
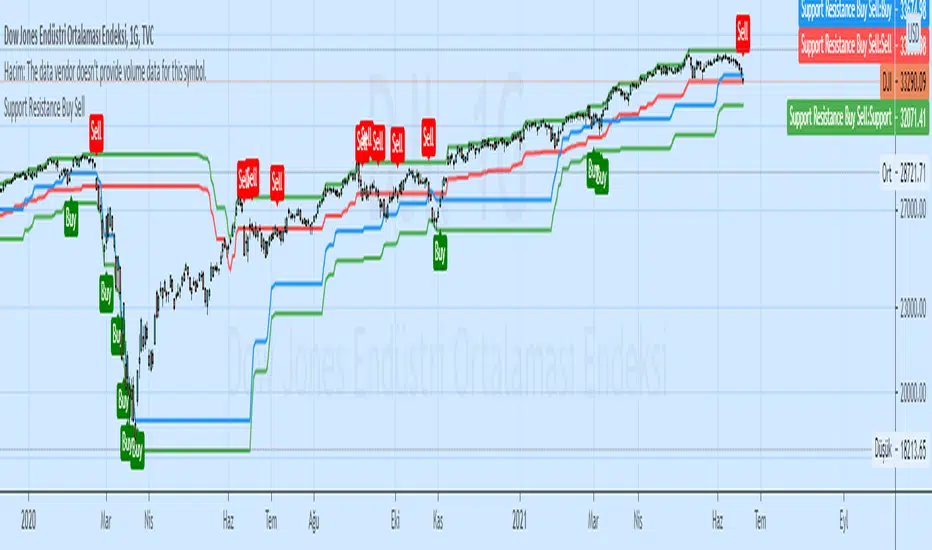
Support Resistance Classification (VR) [LuxAlgo]The Support Resistance Classification (VR) indicator shows SR levels on any chart's visible range using higher time-frame data (HTF). Levels are classified 1 through 10 based on their strength, with lower values indicating stronger support/resistance levels.
This indicator uses visible range functionality, whereas if you adjust your chart to show previous price data, the indicator may show new levels.
🔶 USAGE
Certain indicators on higher timeframes can provide longer term support/resistance levels on lower timeframes. Users can use the provided levels on a chart visible range and use them as reference for future support/resistance levels.
The classification algorithm measures the strength of a support/resistance level using the entire chart visible range and is in a range of 1 to 10, with higher values indicating a weaker support/resistance.
Supports/resistances highlighted by the indicator can be used for future applications by marking them on the chart (quickly done with alt + h).
🔶 DETAILS
All calculations are based on what you see on the Visible Chart, as such changing the chart will recalculate the indicator.
Since only Swings which are not broken are included, every break would exclude that swing. Therefore, even when 'value' is chosen at Settings ('Value'), breaks are always calculated on the entire line.
🔶 SETTINGS
Fade: After x breaks the line becomes invisible
Value:
value:
• SMA, upper/lower: the breaks are triggered on the moving average itself
• Fibonacci Pivot Point levels, Previous High, Previous Low: only last HTF values can be used for breaks
• Swings (see SWING SETTINGS)
line:
• SMA, upper/lower: the breaks are triggered on the entire line, based on its latest value
• Fibonacci Pivot Point Levels, Previous High, Previous Low: breaks are triggered on the entire line, based on its latest value
• Swings (see SWING SETTINGS)
🔹 Swing Settings
Swings are always calculated at current timeframe, setting a HTF is not applicable on Swings.
Left/Right: for Swing calculation ( pivothigh , pivotlow )
Show: enables you to see the pivot points
🔹 Set
N°: The concerning number
TYPE:
• SMA (Simple Moving Average)
• Previous High/Low
• Upper/Lower ( Bollinger Bands )
• Pivot Point levels : "Fibonacci"
LENGTH: sets the 'Number of bars', needed for calculations (applicable for SMA, upper/lower)
MULT: sets the 'Standard deviation factor' (only applicable for upper/lower - BB)
HTF: sets 'Higher Time Frame' (applicable for SMA, upper/lower, Previous High/Low, Fibonacci)
🔹 Show Values
You can make up to 5 values visible (if you want to check/verify), except for Swings (see SWING SETTINGS)
To do so, enable (A -> E), and choose the N° you want to see.
This also is a useful tool if you're not sure which value you want to set.
Cerca negli script per "support resistance"
Support Resistance - DynamicThis is Dynamic Support / Resistance script.
How it Works?
It finds Pivot Points and creates channels for each Pivot Point. Channel size is calculated by (Highest - Lowest) * %Channel_size in Loopback Period. After creating channels it calculates that how many Pivot Points in the channels. more Pivot Points in channel means stronger Support/Resistance. in the option menu there is S/R Strength, this is the minimum number of Pivot Points that each channel must contain to be S/R. calculation starts from last pivot point and go back for "loopback period" which is 300 by default. so last Pivot Points have more priority. Finally after calculating Support/Resistance it draws lines.
Number of Support/Resistance line is Dynamic and up to 20 lines, that means number of lines changes dynamically. you can see how the script puts Suppport/Resistance lines dynamically by "Replay" button. (if I have time I will try to put a video)
Currently the scripts checks up to 40 pivot points in loopback period. it shows up to 20 S/Rs only for visible area in the chart.
There is option to Show S/R lines as Solid, Dotted or Dashed.
Enjoy!

Support/ResistanceUse this code to stop support and resistance
This can be used with the momentum indicators that I have to see if we are likely to breakout or get rejected
Indicator Settings:
The indicator is titled "Support/Resistance | Breaks & Bounces" and is set to overlay on the price chart.
max_lines_count is set to 500, indicating the maximum number of support/resistance lines that can be plotted.
User Input:
The script allows users to customize the pivot method, sensitivity, and line width through input variables.
point_method determines whether the pivot calculation is based on "Candle Wicks" or "Candle Body".
left_bars represents the number of bars to the left used to identify pivot highs/lows.
right_bars is set equal to left_bars.
line_width controls the width of the support/resistance lines.
Global Variables and Arrays:
The script declares several variables and arrays to store information related to support and resistance levels, breakouts, and bounces.
high_source and low_source are calculated based on the selected pivot method.
fixed_pivot_high and fixed_pivot_low store the pivot highs and lows using the chosen sensitivity.
Variables and arrays are initialized for tracking support/resistance lines, breakout triggers, and bounce triggers.
Main Operation:
The main operation occurs when barstate.isconfirmed is true, indicating that a new bar has formed and its data is final.
The script iterates through the support/resistance lines to update their end points (x2) to the current bar.
For each support/resistance line, it checks if a breakout or bounce event has occurred based on the current and previous bar's price levels.
If a breakout or bounce event is detected, the corresponding trigger variables (red_breakout_trigger, red_rejection_trigger, green_breakout_trigger, green_rejection_trigger) are set to true.
The script also checks for changes in the pivot highs and lows and updates the support/resistance lines accordingly.
If a change is detected, it clears the existing lines, breakout, and bounce arrays and adds new lines for the updated pivot levels.

Support Resistance Zones using confluence & Std. DeviationOverview:
This indicator takes (interactive) input from the user for support and resistance levels and plots important zones considering the other confluence levels in the indicator.
Working of indicator:
This indicator takes six input of Support/resistance level form the user
It has following 32 confluence levels
a.4 Recent positive Divergence levels (DN1, DN2, DN3, DN4)
b.4 recent negative divergence levels (DP1, DP2, DP3, DP4)
d.5 Fibonacci levels (Fib0, Fib236, Fib5, Fib618, Fib786)
e. 7 Pivot levels (P, PR1, PR2, PR3, PS1, PS2, PS3)
f.4 EMAs (E20, E200, E100, E50)
g. ATH, ATL, Weekly High, Weekly Low, two days ago high, two days ago low, previous day high , previous day low
The code checks nearest ‘n’ CONFLUENCE for each level (“Number of confluences to check”) in the indicator, after getting the nearest confluence it calculates the standard deviation of those levels WITH RESPECT TO THE MANUAL INPUT LEVELS.
If the Std. Deviation is less than the input value (“Minimum standard deviation” option) then the zone is displayed on the chart.
How to use:
Add the indicator on the chart select your important support and resistance levels.
Set standard deviation, if the confluence is less than the input standard deviation then you will see those zones on the chart.
You can display all divergence levels; you can display all fib levels. All confluences can be displayed by using the setting of the indicator
How to read the indicator values:
The zone will show all the confluence it has in its zone,
Example:
Table details:
The table shows the maximum and minimum deviation out of all six levels .To see at least one zone you have to make sure that Input value Std. Deviation must be greater than Min Std. Deviation of the table
Sources & refences :
Big thank to www.pinecoders.com and kodify.net
Standard deviation :
www.investopedia.com
function to find 'k' closest elements :
www.techiedelight.com
Interactive support resistance :
Divergence for many indicators:
Auto fib level by DGT:
www.tradingview.com

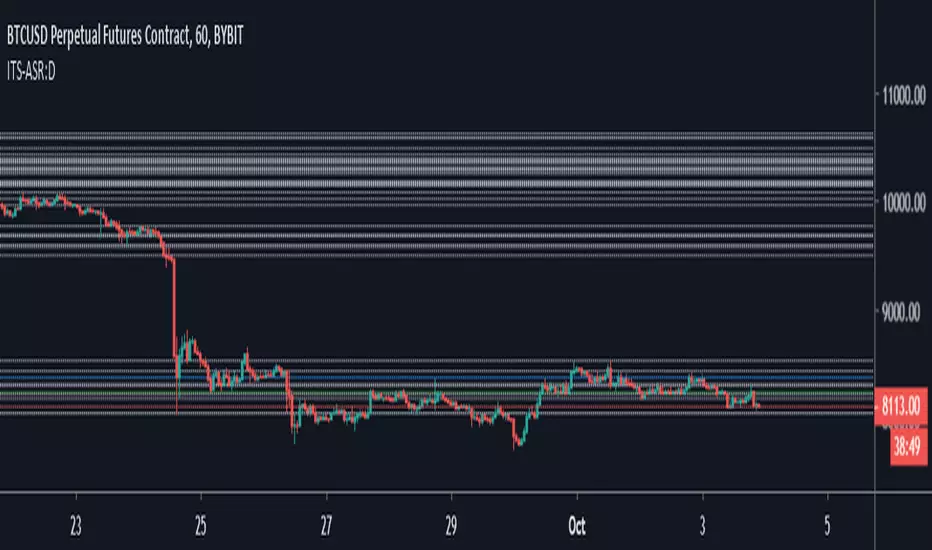
Iconik Trading Suite: Auto Support/Resistance - DailyAutogeneration of support and resistance lines. Posts a horizontal line of the open/close for the past 40 daily candles.
DM for a PowerPoint describing this indicator and the rest of Iconik in detail.
Iconik Trading Suite Indicator List:
ITS-OSC: Oscillators (v2)
ITS-PAA: Price Action Alerts (v2)
ITS-ASR: Auto Support/Resistance
-> Daily (v2)
-> 3 Day (v2)
-> Weekly (v2)
ITS-4TFC: 4 Time Frame Confirmation (v1)
ITS-DIV: Divergence Seeker (v1)


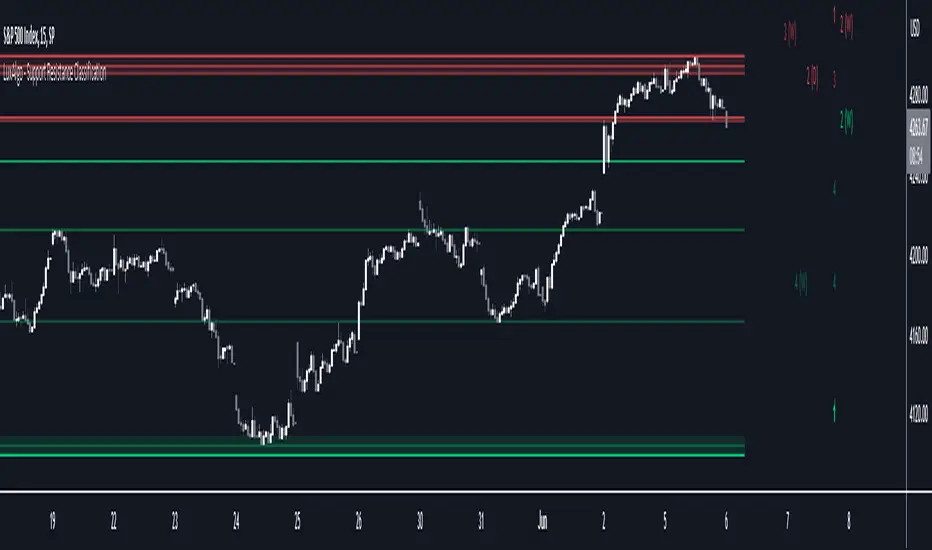
Support Resistance Classification [LuxAlgo]The Support Resistance Classification indicator shows SR levels from a user-defined range using higher time-frame data (HTF). Levels are classified 1 through 10 based on their strength, with lower values indicating stronger support/resistance levels.
This indicator doesn't use visible range functionality, in contrast to our Support Resistance Classification (VR) indicator, it uses a set lookback period to find support/resistance levels.
Since both techniques cannot be used together in 1 script, we developed a separate, NON-VR version.
🔶 USAGE
Certain indicators on higher timeframes can provide longer-term support/resistance levels on lower timeframes. Users can use the provided levels and use them as references for future support/resistance levels.
The classification algorithm measures the strength of a support/resistance level using the set range and is in a range of 1 to 10, with higher values indicating a weaker support/resistance.
Supports/resistances highlighted by the indicator can be used for future applications by marking them on the chart (quickly done with alt + h).
🔶 DETAILS
All calculations are based on what is seen in the last amount of bars, which is the period between the blue vertical line and the last candle:
Since only Swings which are not broken are included, every break would exclude that swing. Therefore, even when 'value' is chosen at Settings ('Value'), breaks are always calculated on the entire line.
🔶 SETTINGS
Lookback: Amount of bars from current bar to x bars back , this is the period where support/resistance levels are calculated.
Fade: After x breaks the line becomes invisible
Value:
value:
• SMA, upper/lower: the breaks are triggered on the moving average itself
• Fibonacci Pivot Point levels, Previous High, Previous Low: only last HTF values can be used for breaks
• Swings (see SWING SETTINGS)
line:
• SMA, upper/lower: the breaks are triggered on the entire line, based on its latest value
• Fibonacci Pivot Point Levels, Previous High, Previous Low: breaks are triggered on the entire line, based on its latest value
• Swings (see SWING SETTINGS)
🔹 Swing Settings
Swings are always calculated at the current timeframe, setting an HTF is not applicable to Swings.
Left/Right: for Swing calculation ( pivothigh , pivotlow )
Show: enables you to see the pivot points
🔹 Set
N°: The concerning number
TYPE:
• SMA (Simple Moving Average)
• Previous High/Low
• Upper/Lower ( Bollinger Bands )
• Pivot Point levels : "Fibonacci"
LENGTH: sets the 'Number of bars', needed for calculations (applicable for SMA, upper/lower)
MULT: sets the 'Standard deviation factor' (only applicable for upper/lower - BB)
HTF: sets 'Higher Time Frame' (applicable for SMA, upper/lower, Previous High/Low, Fibonacci)
🔹 Show Values
You can make up to 5 values visible (if you want to check/verify), except for Swings (see SWING SETTINGS)
To do so, enable (A -> E), and choose the N° you want to see.
This also is a useful tool if you're not sure which value you want to set.
Support, Resistance & OHLCUPDATE:
This Pine Script code is an indicator for TradingView that displays support, resistance, and OHLC (Open, High, Low, Close) data across various timeframes. The code is divided into two main sections: Support/Resistance and OHLC Data.
Support and Resistance:
Logic for Support and Resistance: The indicator draws support and resistance lines after 4 consecutive candles without forming new lows (for support) or new highs (for resistance). This means that a support or resistance level is created after 4 candles that don't set new extremes.
Support: When the last 3 candles have lower lows, and the current candle forms a higher low, the support level is set.
Resistance: When the last 3 candles have higher highs, and the current candle forms a lower high, the resistance level is set.
Drawing the Lines and Labels:
Once the support or resistance level is determined, a horizontal line is drawn that extends left and right from the candle.
Additionally, labels for support and resistance are shown if the corresponding settings are enabled. These labels appear at a distance from the line and display the current support or resistance value.
Deleting the Lines:
If the price falls below the support level or rises above the resistance level, the respective line is deleted. This means that the market has breached the support or resistance level, making the line invalid.
When the support or resistance line is breached, alerts can be triggered to notify the trader.
Alerts:
The script provides options to set alerts when a support or resistance line is created or broken. These alerts notify the trader when the price reaches an important level.
OHLC Data:
The code allows the display of the high, low, close, and open values of the last candles across different timeframes (hourly, daily, weekly, monthly).
Settings:
Options are available to show these values for the respective timeframes.
The user can also adjust the size of the labels.
Visualization: The indicator plots lines for the high, low, and close values for each timeframe and places labels showing the respective values.
In summary, the indicator provides a detailed view of support and resistance levels, which are based on a 4-candle logic, and displays important OHLC values across different timeframes. The indicator also allows setting alerts for specific price levels, so traders can quickly react to market movements.

Support Resistance & Ema
The "Support Resistance & Ema" indicator combines various strategies to assist traders in identifying significant support and resistance levels on the chart and in following trends through exponential moving averages (EMA). This script is designed to be versatile and useful in different trading strategies.
Key Features:
Support and Resistance: It utilizes pivot highs and lows to pinpoint support and resistance levels. These levels are plotted on the chart with lines that change color based on trend reversals.
Trend Identification: The indicator follows trends using four conditions:
_hh: Higher highs and higher lows, indicating an uptrend.
_ll: Lower highs and lower lows, indicating a downtrend.
_hl: Higher highs and lower lows, indicating weakening uptrend or an impending reversal.
_lh: Lower highs and higher lows, indicating weakening downtrend or an impending reversal.
Exponential Moving Averages (EMA): It also displays various EMAs (9, 21, 50, 100, 200) on the chart to provide further insights into the trend direction.
Usage:
Support and Resistance: Support and resistance lines are automatically plotted on the chart. Trend reversals are highlighted by changing the color of the lines.
Trend Identification: The _hh, _ll, _hl, _lh conditions help identify trend changes. When one of these conditions is met, it indicates a particular configuration of highs and lows that might suggest a trading opportunity.
Exponential Moving Averages (EMA): The EMAs are plotted on the chart and can be used to confirm trends identified by the main indicator.
To use this script, you need to add it as an indicator to your trading chart. Once applied, the support, resistance lines, and EMAs will be visible on the chart, providing traders with valuable information to make informed trading decisions.
In summary, this script offers a comprehensive way to identify significant support and resistance levels, spot market trends, and confirm those trends through the use of exponential moving averages.

Support Resistance with Order BlocksIndicator Description
Professional Price Level Detection for Smart Trading. Master the Markets with Precision Support/Resistance and Order Block Analysis . It provides traders with clear visual cues for potential reversal and breakout areas, combining both retail and institutional trading concepts into one powerful tool.
The Support & Resistance with Order Blocks indicator is a versatile Pine Script tool designed to empower traders with clear, actionable insights into key market levels. By combining advanced pivot-based support and resistance (S/R) detection with order block (OB) filtering, this indicator delivers clean, high-probability zones for entries, exits, and reversals. With customizable display options (boxes or lines) and intuitive settings, it’s perfect for traders of all styles—whether you’re scalping, swing trading, or investing long-term. Overlay it on your TradingView chart and elevate your trading strategy today!
________________________________________
Key Features
✅ Dynamic Support/Resistance - Auto-adjusting levels based on price action
✅ Smart Order Block Detection - Identifies institutional buying/selling zones
✅ Dual Display Modes - Choose between Boxes or Clean Lines for different chart styles
✅ Customizable Sensitivity - Adjust detection parameters for different markets
✅ Broken Level Markers - Clearly shows when key levels are breached
✅ Timeframe-Adaptive - Automatically adjusts for daily/weekly charts
1. Dynamic Support & Resistance Detection
Identifies critical S/R zones using pivot high/low calculations with adjustable look back periods.
Visualizes active S/R zones with distinct colors and labels ("Support" or "Resistance" for boxes, lines for cleaner charts).
Marks broken S/R levels as "Br S" (broken support) or "Br R" (broken resistance) when historical display is enabled, aiding in breakout and reversal analysis.
2. Smart Order Block Identification
Detects bullish and bearish order blocks based on significant price movements (default: ±0.3% over 5 candles).
Highlights institutional buying/selling zones with customizable colors, displayed as boxes or lines.
Filters out overlapping OB zones to keep your chart clutter-free.
3. Dual Display Options
Boxes or Lines: Choose to display S/R and OB as boxes for detailed zones or lines for a minimalist view.
Line Width Customization: Adjust line widths for S/R and OB (1–5 pixels) for optimal visibility.
Color Customization: Tailor colors for active/broken S/R and bullish/bearish OB zones.
4. Advanced Overlap Filtering
Ensures S/R zones don’t overlap with OB zones or other S/R levels, providing only the most relevant levels.
Limits the number of active zones (default: 10) to maintain chart clarity.
5. Historical S/R Visualization
Optionally display broken S/R levels with distinct colors and labels ("Br S" or "Br R") to track historical price reactions.
Broken levels are dynamically updated and removed (or retained) based on user settings.
6. Timeframe Adaptability
Automatically adjusts pivot detection for daily/weekly timeframes (40-candle look back) versus shorter timeframes (20-candle look back).
Works seamlessly across all asset classes (stocks, forex, crypto, etc.) and timeframes.
________________________________________
How It Works
• Support & Resistance:
Uses ta.pivothigh and ta.pivotlow to detect significant price pivots, with a user-defined look back (default: 5 candles post-pivot).
Plots S/R as boxes (with labels "Support" or "Resistance") or lines, extending to the current bar for real-time relevance.
Broken S/R levels are marked with adjusted colors and labels ("S" or "R" for boxes, "Br S" or "Br R" for lines when historical display is enabled).
• Order Blocks:
Identifies OB based on strong price movements over 4 candles, plotted as boxes or lines at the candle’s midpoint.
Validates OB to prevent overlap, ensuring only significant zones are displayed.
Removes OB zones when price breaks through, keeping the chart focused on active levels.
• Customization:
Toggle S/R and OB visibility, adjust detection sensitivity, and set maximum active zones (4–50).
Fine-tune line widths and colors for a personalized chart experience.
________________________________________
Why Use This Indicator?
• Precision Trading: Pinpoint high-probability entry/exit zones with filtered S/R and OB levels.
• Clean Charts: Overlap filtering and zone limits reduce clutter, focusing on key levels.
• Versatile Display: Switch between boxes for detailed zones or lines for simplicity, with adjustable line widths.
• Institutional Edge: Leverage OB detection to align with institutional activity for smarter trades.
• User-Friendly: Intuitive settings and clear visuals make it accessible for beginners and pros alike.
________________________________________
Settings Overview________________________________________
⚙ Input Parameters
Settings Overview
Display Options:
Display Type: Choose "Boxes" or "Lines" for S/R and OB visualization.
S/R Line Width: Set line thickness for S/R lines (1–5 pixels, default: 2).
OB Line Width: Set line thickness for OB lines (1–5 pixels, default: 2).
Order Block Options:
Show Order Block: Enable/disable OB display.
Bull/Bear OB Colors: Customise border and fill colors for bullish and bearish OB zones.
Support/Resistance Options:
Show S/R: Toggle active S/R zones.
Show Historical S/R: Display broken S/R levels, marked as "Br S" or "Br R" for lines.
Detection Period: Set candle lookback for pivot detection (4–50, default: 5).
Max Active Zones: Limit active S/R and OB zones (4–50, default: 10).
Colors: Customise active and broken S/R colors for clear differentiation.
________________________________________
How to Use
1. Add to Chart: Apply the indicator to your TradingView chart.
2. Customize Settings:
o Select "Boxes" or "Lines" for your preferred display style.
o Adjust line widths, colors, and detection parameters to suit your trading style.
o Enable "Show Historical S/R" to track broken levels with "Br S" and "Br R" labels.
3. Analyze Levels:
o Use support zones (green) for buy entries and resistance zones (red) for sell entries.
o Monitor OB zones for institutional activity, signaling potential reversals or continuations.
o Watch for "Br S" or "Br R" labels to identify breakout opportunities.
4. Combine with Other Tools: Pair with trend indicators, volume analysis, or price action for a robust strategy.
5. Monitor Breakouts: Trade breakouts when price breaches S/R or OB zones, with historical labels providing context.
________________________________________
Example Use Cases
• Swing Trading: Use S/R and OB zones to identify entry/exit points, with historical broken levels for context.
• Breakout Trading: Trade price breaks through S/R or OB, using "Br S" and "Br R" labels to confirm reversals.
• Scalping: Adjust detection period for faster S/R and OB identification on lower timeframes.
________________________________________
• Performance: Optimized for all timeframes, with best results on 5M, 15M, 30M, 1H, 4H, or daily charts for swing trading.
• Compatibility: Works with any asset class and TradingView chart.
________________________________________
Get Started
Transform your trading with Support & Resistance with Order Blocks! Add it to your chart, customize it to your style, and trade with confidence. For questions or feedback, drop a comment on TradingView or message the author. Happy trading! 🚀
________________________________________
Disclaimer: This indicator is for educational and informational purposes only. Always conduct your own analysis and practice proper risk management before trading.

Support/Resistance Strength [UAlgo]The Support/Resistance Strength indicator is a tool designed for traders seeking a precise understanding of key support and resistance levels in the market. This tool dynamically identifies and visualizes support and resistance zones based on pivot points and strength criteria, providing traders with actionable insights for better decision-making.
By incorporating features such as ATR-based or percentage-based channel calculations, customizable strength thresholds, and intuitive visualization of key levels, the indicator caters to traders of various skill levels and strategies. It also adapts dynamically to market conditions, allowing users to identify frequently tested zones with minimal manual input.
🔶 Key Features
Dynamic Support and Resistance Zones
Automatically detects significant support and resistance levels using pivot high and low calculations.
Offers ATR-based or percentage-based channel customization to cater to diverse trading styles.
Customizable Parameters
Lookback period for pivot calculations, strength threshold, and maximum stored pivots are fully adjustable.
Display options for showing specific numbers of recent support/resistance lines.
Intuitive Visualization
Highlights key support and resistance levels with color-coded lines and labels.
Includes percentage deviation from the current price for quick assessment.
Interactive Updates
Continuously updates support and resistance levels to reflect changing market dynamics.
Displays pivot points visually for enhanced clarity.
Can be used effectively on various timeframes, from intraday to daily and weekly charts.
🔶 Interpreting the Indicator
Identifying Key Levels
Support levels are indicated by green (lime) lines and resistance levels by red lines. The transparency of colors is adjustable for visual preference.
Labels display the exact price level and the percentage difference from the current price.
Strength Threshold
The "Minimum S/R Strength" parameter defines how frequently a level must be tested to be considered significant.
Higher strength values indicate zones that have been tested more frequently, suggesting stronger support or resistance.
Pivot Points
The indicator marks pivot high and low points on the chart to provide a visual representation of the calculated levels.
Dynamic Updates
The indicator adapts to the most recent price action. If the price moves above a resistance level or below a support level, the color of the lines and labels will dynamically change to reflect the current price positioning.
🔶 Disclaimer
Use with Caution: This indicator is provided for educational and informational purposes only and should not be considered as financial advice. Users should exercise caution and perform their own analysis before making trading decisions based on the indicator's signals.
Not Financial Advice: The information provided by this indicator does not constitute financial advice, and the creator (UAlgo) shall not be held responsible for any trading losses incurred as a result of using this indicator.
Backtesting Recommended: Traders are encouraged to backtest the indicator thoroughly on historical data before using it in live trading to assess its performance and suitability for their trading strategies.
Risk Management: Trading involves inherent risks, and users should implement proper risk management strategies, including but not limited to stop-loss orders and position sizing, to mitigate potential losses.
No Guarantees: The accuracy and reliability of the indicator's signals cannot be guaranteed, as they are based on historical price data and past performance may not be indicative of future results.

Support, Resistance & Liquidity Pool ZonesSupport, Resistance & Liquidity Pool Zones
This indicator automatically detects and plots support and resistance levels based on pivot points and highlights liquidity pool zones, areas where the trading volume exceeds the average over a set number of bars. It is designed to help traders identify key price levels and liquidity traps that can trigger significant market reactions.
Key Features:
Support & Resistance Levels:
The indicator identifies pivot highs and pivot lows as potential resistance and support levels, respectively.
You can customize the number of levels shown on the chart, making it easier to focus on the most recent and relevant price levels.
Liquidity Pool Zones:
The script detects liquidity pool zones, which are areas with above-average trading volume. These zones often act as regions of interest where price accumulation or distribution occurs, potentially leading to significant price moves.
Liquidity zones are shaded to help traders visually identify areas of high interest in the market.
Customizable Settings:
You can adjust the pivot period to fine-tune how the indicator calculates support and resistance.
Control the number of support/resistance levels displayed on the chart and the period used to detect liquidity pools.
Customize the colors for support, resistance, and liquidity zones to match your charting preferences.
Alerts:
The script includes built-in alerts for when the price breaks above resistance or falls below support, helping traders catch key breakout opportunities.
How It Works:
The script calculates support and resistance levels using pivot highs and lows based on the user-defined pivot period.
It monitors liquidity pool zones by comparing the current trading volume with the average volume over a customizable period. When the volume exceeds the set threshold, a liquidity pool zone is highlighted, providing insight into where the market may accumulate or distribute.
Alerts are triggered when the price breaks above the first resistance level or falls below the first support level, giving traders immediate notification of key market events.
How to Use:
Tune the Pivot Period: Adjust the pivot period to your preferred time horizon (default: 10 bars).
Set Liquidity Pool Parameters: Customize the number of bars considered for liquidity pool detection and the volume multiplier to detect high-volume zones.
Monitor Breakouts: Use the built-in alerts to catch potential breakout or breakdown opportunities near support and resistance levels.
This script is ideal for traders looking for an easy-to-use tool to visualize support and resistance levels and liquidity pools, aiding in decision-making and trade management.

Support/Resistance Zones x3Support and Resistance Levels + Zones for 3 time frames, based on volume at fractal levels with Zones based on wick size which is a true reflection of a Zone when compared to other S/R Zone scripts which only use a thick line not based on anything.
Original script is thanks to synapticex I have just migrated to version 3, heavily modified it and added Support and Resistance Zones.

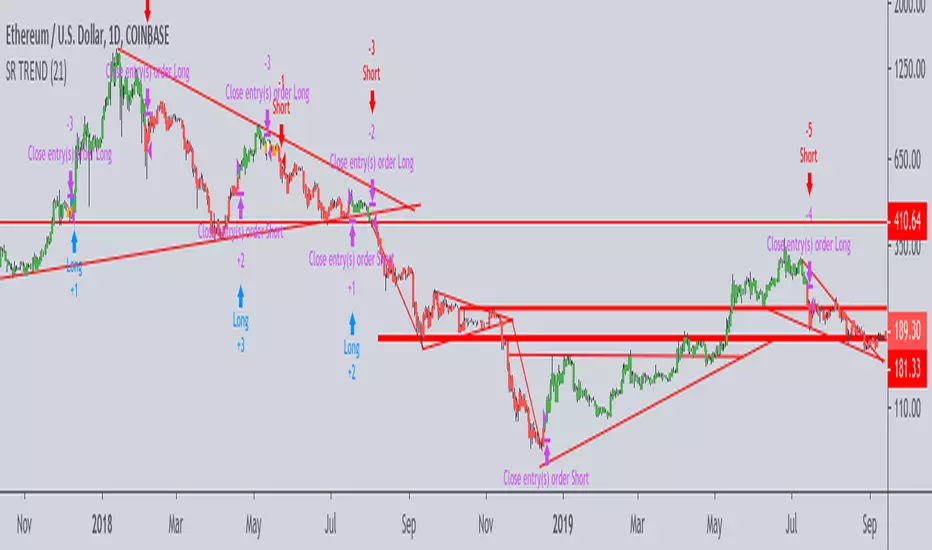
Support-Resistance breakoutStrategy based on longing resistance breakout and shorting support breakout.
It defines highs and lows using fractal with 2 bars for confirming high/lows. So it has 2 bars lag.
It calculates the difference between sma with defined length (21 by default) of highs and of lows and uses it as alt SR level. This idea I took from synapticEx's indicator Nebula-Advanced-Dynamic-Support-Resistance.
Position enter is the breakout of SR, defined by fractals.
Position exit is: bar change in opposite to position direction > difference is sma of highs and of lows.
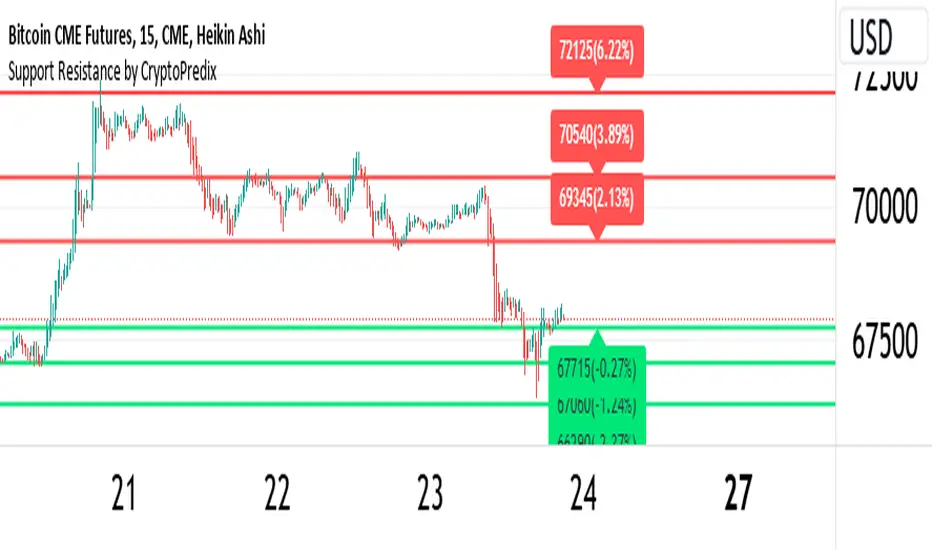
Support Resistance - CryptoPredixHow this indicator works :
1. Setup and Inputs: The script sets up user inputs for various parameters such as pivot period (prd), pivot source (ppsrc), maximum channel width (ChannelW), maximum number of support/resistance levels (maxnumsr), minimum strength (min_strength), label location (labelloc), line style (linestyle), and line width (linewidth).Colors for support and resistance lines are also defined (supportcolor, resistancecolor).
2. Pivot Point Calculation: The script calculates pivot high and pivot low values based on the selected source (either High/Low or Close/Open).It uses the ta.pivothigh and ta.pivotlow functions to identify these pivot points over the specified period (prd).
3. Plotting Pivot Points: If the showpp option is enabled, the script plots pivot high and pivot low points on the chart using plotshape.
4. Managing Pivot Values: The script maintains an array (pivotvals) to store recent pivot values, ensuring the number of stored values does not exceed the maximum specified (maxnumpp).
5. Support and Resistance Zone Calculation: It calculates support and resistance zones by finding ranges of pivot values that fall within a specified channel width (cwidth).The function get_sr_vals returns the highest, lowest values, and the number of pivot points within the channel width.
6. Storing Support and Resistance Levels: The script manages arrays for support and resistance levels (sr_up_level, sr_dn_level) and their strength (sr_strength).It uses the check_sr function to ensure that new support/resistance levels are valid and don't overlap with existing ones unless they have higher strength.
7. Label and Line Management: The script dynamically updates labels and lines for the support and resistance levels, adjusting their positions, colors, and styles based on the latest data.It ensures the labels and lines are in sync with the current bar index and close price.
8. Identifying Crossings: Functions f_crossed_over and f_crossed_under check if the close price has crossed above or below the identified support or resistance levels.These functions iterate through the support/resistance arrays and check the conditions for crossing.
9. Alerts: The script sets up alert conditions to notify when the price crosses above a resistance level or below a support level.Alerts are configured with titles and messages ('Resistance Broken' and 'Support Broken').
10. Visualization: The script provides visual cues on the chart by plotting support and resistance lines with different styles and colors.It also dynamically updates labels to display the level values and their percentage distance from the current close price.
This script helps traders identify key support and resistance levels on a chart, providing both visual cues and alerts for significant price movements relative to these levels.
Support Resistance with Touch HighlightDescription:
Support Resistance with Touch Highlight is a powerful technical analysis tool designed to help traders identify key support and resistance levels in the market. Unlike traditional support and resistance indicators, this indicator utilizes a unique approach by considering multiple periods simultaneously, enhancing its accuracy and reliability.
Key Features:
- **Multi-Period Analysis:** The indicator analyzes multiple user-defined periods, allowing for a comprehensive view of support and resistance levels.
- **Average Calculation:** It calculates the average of the highest and lowest prices within the specified periods, providing a balanced representation of support and resistance zones.
- **Dynamic Highlighting:** Bars touching the support or resistance lines are highlighted, aiding traders in spotting potential reversal points.
- **Alert System:** Set custom alerts to be notified when the price touches the support or resistance lines, enabling timely decision-making.
Why It's Superior:
1. **Accuracy Through Multiple Periods:** By considering multiple periods, the indicator provides a more accurate depiction of support and resistance levels, minimizing false signals.
2. **Dynamic Highlighting:** The indicator dynamically highlights relevant bars, making it easy for traders to identify significant price interactions with support and resistance zones.
3. **Customizable Alerts:** Tailor alerts to your trading strategy, ensuring you never miss crucial market movements.
How to Use:
- **Support Zones:** Prices often bounce off the support line. Look for buying opportunities when the price touches or approaches the green support line.
- **Resistance Zones:** Prices tend to reverse near the resistance line. Consider selling or tightening stops when the price touches or nears the red resistance line.
Disclaimer:
Trading involves risk, and past performance is not indicative of future results. Always perform your analysis and consider risk management strategies before making trading decisions.

Support Resistance📌 1. Indicator Name
Premium Auto Support & Resistance
📌 2. One-Line Description
An automated S/R system that generates support and resistance zones based on swing highs and lows, displaying them in a premium visual style directly on the chart.
📌 3. Overall Summary (7+ lines)
This indicator automatically detects price levels where the market has repeatedly reacted and generates support and resistance zones.
Instead of simple horizontal lines, it visualizes reaction ranges as zones, helping traders clearly understand the actual price areas where activity occurs.
It uses swing points (high/low pivots) as the fundamental basis and continuously updates only the most meaningful recent S/R levels.
A smoothing process is applied, reducing noise and creating more natural, reliable S/R zones.
Support and resistance are displayed as filled transparency-based zones, enabling intuitive identification of zone strength and market position.
When price touches one of these zones, a small signal appears to highlight potential reversal points.
All elements are plotted directly over the candles with overlay=true, making it an instantly usable and visually premium tool.
📌 4. Advantages (6 items)
① Automatic Swing-Based S/R Detection
Automatically analyzes key pivot points and extracts only the most meaningful support and resistance levels.
② Support/Resistance Zone Structure
Provides intuitive reaction ranges instead of single lines, making it far more practical for real trading.
③ Smooth Premium-Style Lines
S/R lines are smoothed to remove noise, maintaining a natural and refined premium visual appearance.
④ Automatic Candle-Touch Alerts
Displays signals whenever price touches support or resistance, helping you quickly identify potential reversal areas.
⑤ Overlay-Based Immediate Clarity
Drawn directly onto the chart without occupying indicator windows, keeping visual focus on price action.
⑥ Simple Yet Powerful Framework
A pivot + smoothing + zone combination that strengthens automatic S/R detection while remaining easy for beginners to use.

Support/Resistance MTF Merge ZonesIndicator Introduction
Support/Resistance MTF Merge Zones is an advanced technical analysis tool that automatically identifies and merges key support/resistance zones by analyzing highs and lows from multiple timeframes (15M, 1H, 4H, Daily).
Key Features
Multi-Timeframe Analysis: Integrates data from 15M, 1H, 4H, and Daily charts
Smart Zone Merging: Automatically consolidates levels within a specified percentage range into unified zones
Dynamic Color System: Distinguishes support/resistance zones based on position relative to current price
Strength Indication: Highlights zones where multiple levels converge as strong zones
Usage Guide
Configuration Parameters
Lookback Period (10): Period for calculating highs/lows
Adjustable range: 5-30
Higher values detect more long-term levels
Zone Merge % (0.5): Percentage threshold for zone merging
Range: 0.1-2.0%
Higher values merge levels across wider price ranges
Min Levels for Zone (2): Minimum number of levels required to form a zone
Range: 2-5 levels
Higher values display only more confirmed zones
Box Opacity (7): Transparency level of zone boxes
Range: 0-100%
Color Scheme
Red: Resistance zones above current price
Blue: Support zones below current price
Orange: Strong zones (3+ merged levels)
Support Resistance ImportanceThe Support Resistance Importance indicator is designed to highlight key price levels based on the relationship between fractal occurrences and volume distribution within a given price range. By dividing the range into bins, the indicator calculates the total volume traded at each fractal level and normalizes the values for easy visualization. The normalized values represent an "importance score" for each price range, helping traders identify critical support and resistance levels where price action might react.
Key Features:
Fractal Detection:
The indicator detects Williams Fractals, which are specific price patterns representing potential market reversals. It identifies both upward fractals (potential resistance) and downward fractals (potential support).
Price Range Binning:
The price range is divided into a user-defined number of bins (default is 20). Each bin represents a segment of the total price range, allowing the indicator to bucket price action and track fractal volumes in each bin.
Volume-Based Importance Calculation:
For each bin, the indicator sums up the volume traded at the time a fractal occurred. The volumes are then normalized to reflect their relative importance.
The importance score is calculated as the relative volume in each bin, representing the potential influence of that price range. Higher scores indicate stronger support or resistance levels.
Normalization:
The volume data is normalized to allow for better comparison across bins. This normalization ensures that the highest and lowest volumes are scaled between 0 and 1 for visualization purposes. The smallest volume value is used to scale the rest, ensuring meaningful comparisons.
Visualization:
The indicator provides a table-based visualization showing the price range and the corresponding importance score for each bin.
Each bin is color-coded based on the normalized importance score, with blue or greenish shades indicating higher importance levels. The current price range is highlighted to help traders quickly identify relevant areas of interest.
Trading Utility:
Traders can use the importance scores to identify price levels where significant volume has accumulated at fractals. A higher importance score suggests a stronger likelihood of the price reacting to that level.
If a price moves towards a bin with a high score and the bins above it have much smaller values, it suggests that the price may "pump" up to the next high-scored range, similar to how price drops can occur.
Example Use Case:
Suppose the price approaches a bin with an importance score of 25, and the bins above have much smaller values. This suggests that price may break higher towards the next significant level of resistance, offering traders an opportunity to capitalize on the move by entering long positions or adjusting their stop losses.
This indicator is particularly useful for support and resistance trading, where understanding key levels of price action and volume can improve decision-making in anticipating market reactions.
