Price Action + Support/Resistance with LabelsEntry Conditions:
Long Entry (BUY): Based on the bullish engulfing pattern and price being above the resistance level.
Short Entry (SELL): For demonstration, the short entry condition is set as price being below the support level and a bullish candle in the previous bar. You can modify this logic for your own use case.
Stop Loss and Take Profit:
Stoploss is plotted at the calculated stop loss level.
Target is plotted at the calculated take profit level.
Labels:
For long trades, labels are added with "BUY", "STOPLOSS", and "TARGET".
For short trades (if enabled), labels are added with "SELL", "STOPLOSS", and "TARGET".
Labels are placed using label.new at specific locations on the chart (above or below bars).
Alert Conditions:
Alerts are created for both long and short entry signals so you can get notified when the entry conditions are met.
How it works:
BUY label will appear below the bar when a long entry condition is met.
SELL label will appear above the bar when a short entry condition is met.
STOPLOSS and TARGET labels will appear at their respective levels when an entry signal is triggered.
The labels will appear on the chart to give you a clear visual cue of the entry, stop loss, and take profit levels.
How to Use:
Copy the script into your Pine Editor on TradingView and apply it to your chart.
Observe the labels that show up on the chart:
"BUY" will appear below the bar when long conditions are met.
"SELL" will appear above the bar when short conditions are met (if using short logic).
"STOPLOSS" will be plotted at the stop loss level.
"TARGET" will be plotted at the take profit level.
Optional Customization:
You can modify the short entry condition based on your preferred method.
You can adjust the length for the support/resistance calculation, the stopLossRR, and other parameters to fine-tune the strategy for Nifty 50 or any other asset.
Let me know if you have any further questions or need additional modifications!
Cerca negli script per "support resistance"

RSI + Fibonacci HH LL Support Resistance I have integrated my past scripts and brushed them up further.
This tool allows for support/resistance, stop loss, take profit, and trend analysis using RSI and Fibonacci ratios.
For example, the Fibonacci ratio is used as follows
l1 = m - dist * 0.618
l2 = m - dist * 1.618
l3 = m - dist * 2.618
l4 = m - dist * 4.235
l5 = m - dist * 6.857
l6 = m - dist * 11.089
When the Fibonacci ratio reaches 2.618 or higher and the RSI smoothed by the 5-day EMA is oversold/overbought, the bar color is changed by a gradation.
We have tried to make the design as beautiful and good-looking as possible. You can also hide the lines to suit your own preference.
Example usages are here:
BTCUSDT 1Hour Chart
Using Fibonacci numbers
BTCUSDT 15min Chart, for Scalping
Here, to set the highest and lowest prices one hour ago, "4" is substituted as the calculation: 15 minutes x 4 = 60
BTCUSDT 15min Chart, for Scalping
To set the highest and lowest prices 4 hours ago , "4" is substituted as the calculation: 15 minutes x 16 = 240
BTCUSDT 15min Chart, for Scalping
To draw yesterday's high and low as support/resistance lines, I substituted the number "96" as 1440/15=96.
BTCUSDT 1min Chart, for Scalping
Substituted "60" to trail the highest and lowest prices over a 60-minute period on a 1-minute chart, and removed lines to beautify
BTCUSDT 1day Chart, for Long-Term Investers
This is an example of using "90" because it is a 1-day chart and assumes that 3 months = 90 days in order to trail the highest and lowest prices over a 3-month period and no lines.
My past scripts are here:
RSI + FIB HH LL StopLoss Finder/Contrarian Trades
Fibonacci HH LL TRAMA Band

DB Support Resistance Levels + Smart Higher Highs and Lower LowsDB Support Resistance Levels + Smart Higher Highs and Lower Lows
The indicator plots historic lines for high, low and close prices shown in settings as "base levels". Users can control the lookback period that is plotted along with an optional multiplier. Traders will notice that the price bounces off these historic base levels. The base levels are shown as light gray by default (customizable in the settings). Users may choose to display base levels by a combination of historic high, low and close values.
On top of the historic base levels, the indicator display higher high and lower low levels from the current bar high/low. Higher highs are shown by default in pink and lower lows by default in yellow. The user can adjust the lookback period for displaying higher highs and the optional multiplier. Only historic values higher than the current bar high are displayed filtering out (by highlighting) the remaining levels for the current bar. Users may choose to use a combination of historic open, low and close values for displaying higher highs. The user can adjust the lookback period for displaying lower lows and the optional multiplier. Only historic values lower than the current bar low are displayed filtering out (by highlighting) the remaining levels for the current bar. Users may choose to use a combination of historic open, low and close values for displaying lower low.
The indicator includes two optional filters for filtering out higher highs and lower lows to focus (highlight) the most relevant levels. The filters include KC and a simple price multiplier filter. The latter is enabled by default and recommended.
The indicator aims to provide two things; first a simple plot of historic base levels and second as the price moves to highlight the most relevant levels for the current price action. While the indicator works on all timeframes, it was tested with the weekly. Please keep in mind adjusting the timeframe may require the lookback settings to be adjusted to ensure the bars are within range.
How should I use this indicator?
Traders may use this indicator to gain a visual reference of support and resistance levels from higher periods of time with the most likely levels highlighted in pink and yellow. Replaying the indicator gives a visual show of levels in action and just how very often price action bounces from these highlighted levels.
Additional Notes
This indicator does increase the max total lines allowed which may impact performance depending on device specs. No alerts or signals for now. Perhaps coming soon...

Pivot mtf semaphore support&resistance [LM]Hello Traders,
I would like to introduce you pivot semaphore mtf support&resistance levels. The idea is the same as my other S/R scripts to have a look at the important levels. The Semaphore is used to spot future multi-level Supports and Resistance zones. It is also useful to spot HL or LL or HH or LH zones. The script is based on amazing work of @LucF so really big thanks for your work on mtf line offsetting.
It has three settings:
First two settings are for higher timeframes
Third setting is setting for pivots on current timeframe
!!!! Very important is there is limitation in pinescript how many candles you can look back(4999) if you choose timeframes that are very distant from each other there is a chance that those lines won't show up
Hopefully you will enjoy
Cheers, Lukas

session min/max support&resistance [LM]Hello traders,
I would like to present you session min/max support&resistance indicator. The idea behind is to calculate min and max per session and render line at those levels and bars until the price reach the level. With this you can see levels where the price didn't reach with granular control over how many lines can be shown.
Indicator has following settings:
General control - where you can select session interval and show/hide labels
Line control - where you can adjust type of line, color of up/bottom level..
I hope you will enjoy it,
Lukas

Bollinger bands volume support&resistance multi timeframe [LM]Hello traders,
I would like to introduce you Bollinger bands volume support&resistance multi timeframe script. The benchmark is the Upper Bollinger Band applied on volume with a look-back setting of 233 and a displacement of 3 standard deviations.
(There’s nothing magical about the setting of 233, but you should use a long-term parameter so that you get a stable Bollinger Band. Short-term parameters tend to produce erratic bands.)
If a price bar shows volume that exceeds this benchmark, we will zoom in and use it as potential support or resistance area in our price analysis. if there is only one candle that will crossover and cross under than only high and lo of that candle is counting. If there are more consecutive bars that are above upper bollinger band than the range high and lo is calculated from high and lows of that candle
As you can see on the image high and low is only rendered when volume crossover and cross under bollinger bands
I hope you will enjoy it

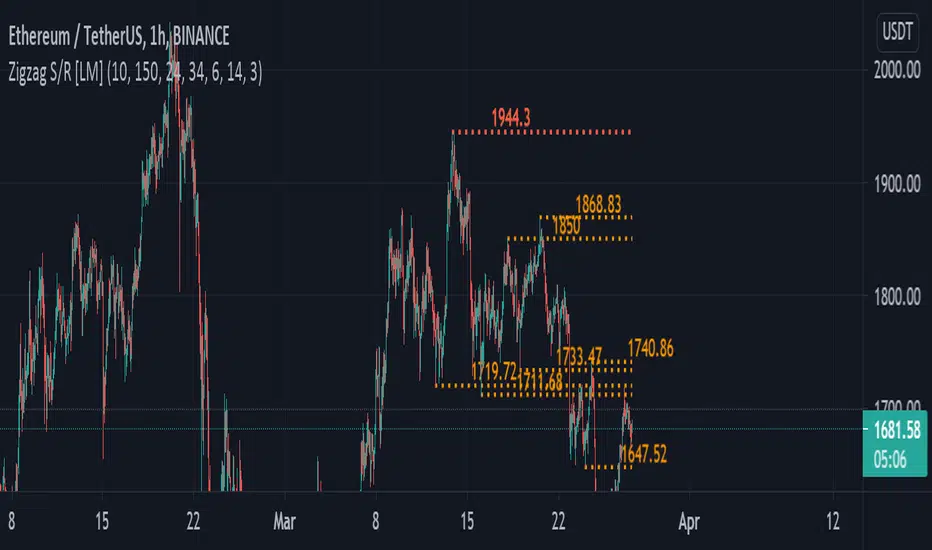
zigzag support&resistance levels [LM]Hello Traders,
I would like to introduce you zigzag support&resistance levels. It is based on the ZigZag semafor script made by DevLucem so shout out to him
The Semafor is used to spot future multi-level Supports and Resistance zones.
It is also useful to spot HL or LL or HH or LH zones at different Depth settings.
The red zones are the extreme places where the market has a higher chance of reversing while the green zones have the lowest setting with lower chances of the market reversal
I have refactored script and extended it with the horizontals.
The lines can be extended like so if you want to see
The lines also can expire when the price will reach it you can change this in general settings:
Also you can use view from the original script with just label circles
Enjoy!
EMA/SMA Support/Resistance Levels////////////////////////////////////////////////////////////
// saxonlucius 07/08/2019
// EMA/SMA Major Support/Resistance levels
////////////////////////////////////////////////////////////
The script contains major support/resistance EMA's and SMA's.
This includes:
EMA
EMA 21
EMA 34
EMA 50
EMA 89
EMA 100
EMA 200
EMA 377
SMA
SMA 10
SMA 100
SMA 200
SMA 900
The EMA 34 and SMA 900 are not as relevant as the others.


Ersoy Support-Resistance-Osilatorwebsite: www.ersoytoptas.com
Newspaper : tr.investing.com
Hi this is a oscillator ...
Close Support , Remote Support , Resistance and works with the live screen.

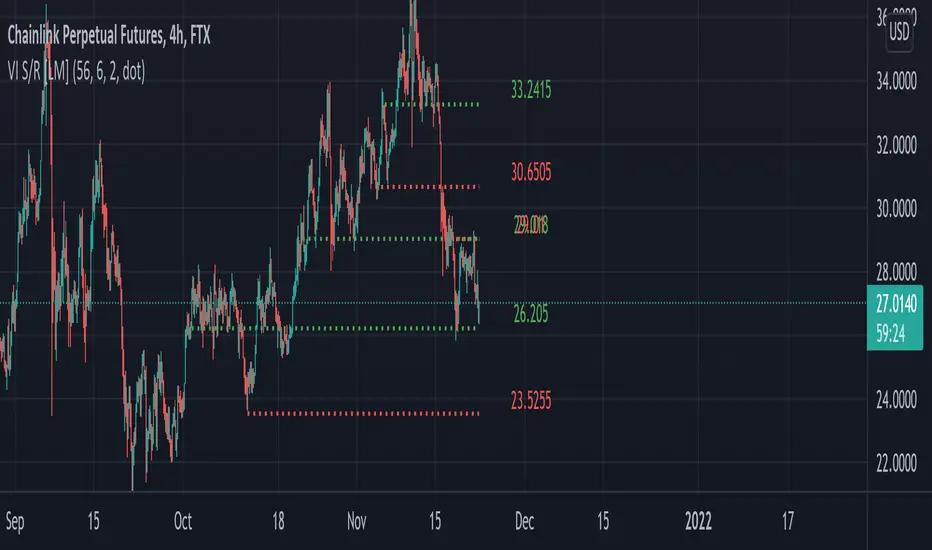
Vortex indicator cross support&resistance [LM]Hello traders,
I would like you to present Vortex indicator cross support&resistance script. The idea behind is same as my other S/R scripts to look for important S/R levels.
This time I have used little known and not that old Vortex Indicator that has been released in 2010. Vortex indicator has two plots that crosses each other and on the cross line is rendered. I have included smoothing with TEMA.
The indicator has following settings:
General control - here you can select period of vortex indicator and show/hide labels
Line control - where you can select type of line, colors...
Hope you will enjoy it,
Lukas
Compression support&resistance [LM]Hello traders,
I would like to present you Compression support&resistance script. The idea behind is to look for areas of price compression(inside bar candles). Basically the S/R lines are created after three candles that are formed in certain pattern and volume conditions. First candle of pattern is usually the most volatile and fist inside bar after volatile candle high and low creates S/R lines in order to look for breakouts or for future bounces of the S/R line. Also by default volume has to be decreasing from candle to candle, although this condition can be controlled by setting.
It has various settings as my other S/R scripts for multi timeframe analysis. The current timeframe uses line API but for multi timeframe I use plot lines. There are two filters. Volume filter for declining volume of the pattern candles and volatility filter which renders line only in case that pattern occurs after some % change has happened within some lookback period.
Credit also for this indicator goes to @berkek as he took time to explain it to me.
Hope you will enjoy it,
Lukas
Auto Support ResistanceAn indicator that draws support, resistance and trend lines automatically based on the high/low and current direction of the asset.

Quaterly & Monthly & Weekly & Daily Support&Resistance [LM]Hello traders,
I would like to introduce you Quaterly & Monthly & Weekly & Daily Support&Resistance study. The idea behind it is to look for natural S/R levels based on high/low of higher time and looking for ranges. Script has 4 different high&lows levels that you can configure at your will what is shon and how.
You can combine various timeframe ranges to look for bounces
I hope you will enjoy it.

donchain support&resistance levels [LM]Hello Traders,
I would like to introduce you donchain support&resistance levels. The idea is to look for important levels that are identified by donchain line, where donchain usualy spents a lot of time without any move usualy turns out to be good level for bounces.
Also note that when there is a big spread between first line and second line it usually leads to some pullback.
Here you have an example of big spread:
You are also able to show donchain lines and not only horizontals this you can find in settings:
Enjoy!

SW Support / Resistance System plus EMA cross alerts//=====================================================================
//SW Support / Resistance System plus EMA cross alerts
//(Some parts belong to ChrisMoody)
// June 23rd, 2019
//=====================================================================

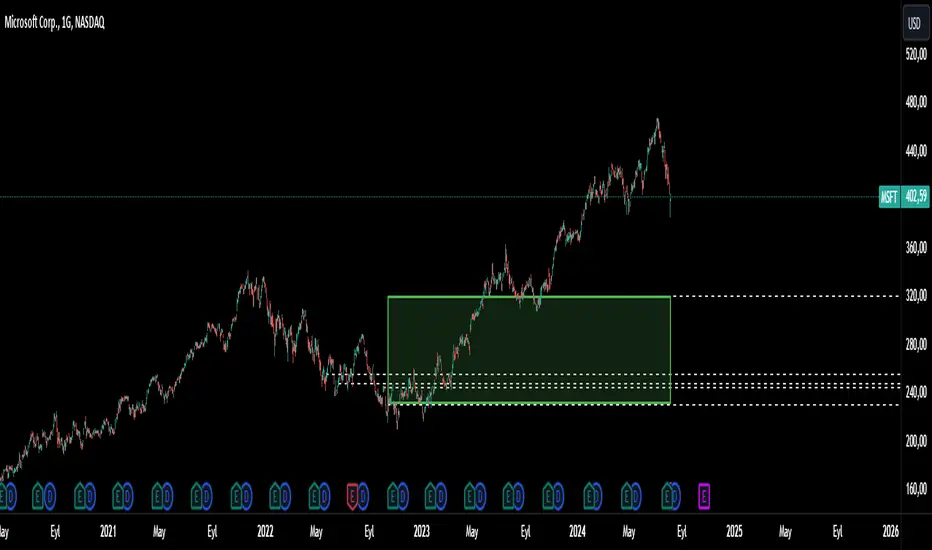
Support ResistanceThis indicator was written in pine script code, inspired by the L3 Banker Fund Flow Trend Oscillator indicator whose link I gave below.
This indicator is designed to track the flow of banker funds in the market by analyzing price movements and generating entry signals based on specific criteria. It uses a combination of custom functions and moving averages to identify potential points where bankers might be entering the market.
Key Features:
Fund Flow Trend Calculation:
The indicator calculates the fund flow trend using a combination of weighted moving averages. This helps in identifying the overall trend and potential reversals.
Bull Bear Line:
A key component of the indicator is the Bull Bear Line, which is derived from the typical price, lowest low, and highest high over a specified period. This line helps in determining the strength and direction of the market trend.
Banker Entry Signal:
The indicator generates a banker entry signal when the fund flow trend crosses above the Bull Bear Line, and the Bull Bear Line is below 25. This condition is indicative of a potential entry point for bankers.
Visual Representation:
Entry prices and indices for the last five banker entry signals are stored and used to draw dashed lines on the chart, representing these significant levels.
A dynamic rectangle is drawn between the last two entry prices, which extends to the right until the specified conditions are met. The rectangle's color changes from red to green if the price crosses above it by at least one bar, indicating a potential support zone.
Usage:
Trend Identification:
Use the fund flow trend and Bull Bear Line to identify the prevailing market trend and potential reversal points.
Entry Signals:
Pay attention to the banker entry signals as potential points of entry based on institutional fund flow.
Support and Resistance:
The dynamic rectangle can act as a support zone. Monitor price action relative to this rectangle for potential trading opportunities.
This indicator is a powerful tool for traders looking to align their trades with the movements of large institutional players. By understanding and tracking the flow of banker funds, traders can gain valuable insights into market dynamics and make more informed trading decisions.
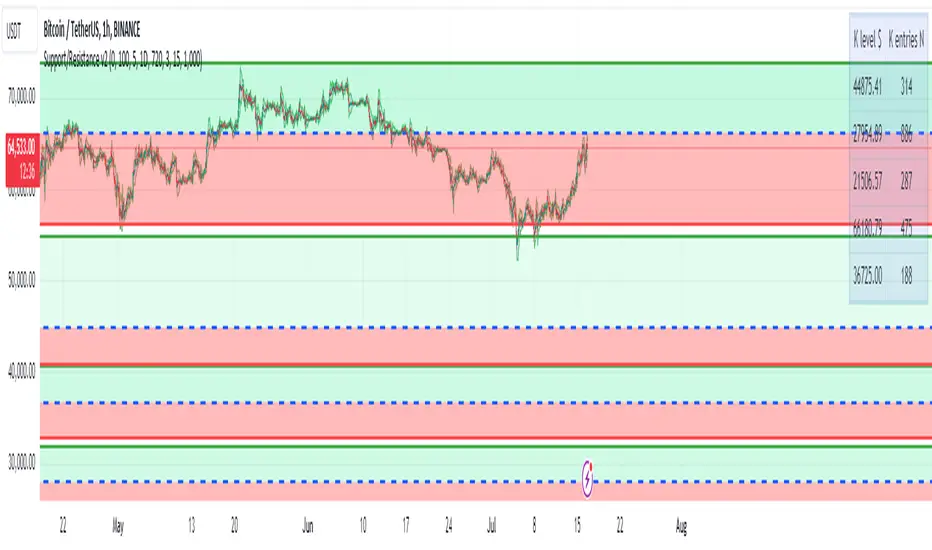
Support/Resistance v2 (ML) KmeanKmean with Standard Deviation Channel
1. Description of Kmean
Kmean (or K-means) is a popular clustering algorithm used to divide data into K groups based on their similarity. In the context of financial markets, Kmean can be applied to find the average price values over a specific period, allowing the identification of major trends and levels of support and resistance.
2. Application in Trading
In trading, Kmean is used to smooth out the price series and determine long-term trends. This helps traders make more informed decisions by avoiding noise and short-term fluctuations. Kmean can serve as a baseline around which other analytical tools, such as channels and bands, are constructed.
3. Description of Standard Deviation (stdev)
Standard deviation (stdev) is a statistical measure that indicates how much the values of data deviate from their mean value. In finance, standard deviation is often used to assess price volatility. A high standard deviation indicates strong price fluctuations, while a low standard deviation indicates stable movements.
4. Combining Kmean and Standard Deviation to Predict Short-Term Price Behavior
Combining Kmean and standard deviation creates a powerful tool for analyzing market conditions. Kmean shows the average price trend, while the standard deviation channels demonstrate the boundaries within which the price can fluctuate. This combination helps traders to:
Identify support and resistance levels.
Predict potential price reversals.
Assess risks and set stop-losses and take-profits.
Should you have any questions about code, please reach me at Tradingview directly.
Hope you find this script helpful!
Support Resistance Major/Minor [TradingFinder] Market Structure🔵 Introduction
Support and resistance levels are key concepts in technical analysis, serving as critical points where prices pause or reverse due to the interaction of supply and demand. These foundational elements in price action and classical technical analysis assist traders in understanding market behavior and making better trading decisions.
Support levels are zones where demand is strong enough to prevent further price declines, while resistance levels act as barriers that hinder price increases.
Support and resistance levels are divided into two main types: static and dynamic. Static levels are fixed horizontal lines on charts, formed based on historical price points, and are crucial due to repeated price reactions in these areas.
Dynamic levels, on the other hand, move with market trends and are often identified using tools like moving averages and trendlines. These levels are particularly useful for analyzing dynamic trends and identifying potential reversal points in financial markets.
The importance of support and resistance in technical analysis lies in their ability to pinpoint price reversal or continuation points. Professional traders use these levels to determine optimal entry and exit points and combine them with tools such as Fibonacci retracements or moving averages for precise strategies.
Detailed analysis of price behavior at these levels provides insights into trend strength and the likelihood of price breaks or reversals. By understanding these concepts, technical analysts can forecast future price movements and optimize their trading decisions using tools such as indicators and price action. Support and resistance levels, as a cornerstone of technical analysis, form the foundation for many trading strategies.
🔵 How to Use
The Static Support and Resistance Indicator is a vital tool for identifying significant price zones in financial markets. It automatically detects major and minor support and resistance levels in both short-term and long-term intervals, enabling traders to analyze price behavior accurately and develop optimal entry and exit strategies.
🟣 Major Long-Term Support and Resistance
Major Long-Term Support : The lowest price points recorded over long-term intervals that prevent further declines.
Major Long-Term Resistance : The highest price points in long-term intervals that limit further price increases.
🟣 Minor Long-Term Support and Resistance
Minor Long-Term Support : Temporary halts in price decline within a downtrend over long-term intervals.
Minor Long-Term Resistance : Short-term zones within long-term intervals where prices react negatively in an uptrend.
🟣 Major Short-Term Support and Resistance
Major Short-Term Support : The lowest price points in short-term intervals that act as barriers against sharp price drops.
Major Short-Term Resistance : The highest points in short-term intervals that prevent further price surges.
🟣 Minor Short-Term Support and Resistance
Minor Short-Term Support : Temporary halts in price decline within short-term downtrends.
Minor Short-Term Resistance : Zones where price reacts quickly and reverses in short-term uptrends.
🔵 Settings
Long Term S&R Pivot Period : Defines the interval for identifying long-term support and resistance levels (default: 21).
Short Term S&R Pivot Period : Defines the interval for identifying short-term support and resistance levels (default: 5).
🟣 Long-Term Lines
Major Line Display : Enable/disable major long-term lines.
Minor Line Display : Enable/disable minor long-term lines.
Major Line Colors : Green for support, red for resistance (long-term major levels).
Minor Line Colors : Light green for support, light red for resistance (long-term minor levels).
Major Line Style : Choose between solid, dotted, or dashed lines for major long-term levels.
Minor Line Style : Choose between solid, dotted, or dashed lines for minor long-term levels.
Major Line Width : Adjust the thickness of major long-term lines.
Minor Line Width : Adjust the thickness of minor long-term lines.
🟣 Short-Term Lines
Major Line Display : Enable/disable major short-term lines.
Minor Line Display : Enable/disable minor short-term lines.
Major Line Colors : Gray-green for support, gray-red for resistance (short-term major levels).
Minor Line Colors : Dark green for support, dark red for resistance (short-term minor levels).
Major Line Style : Choose between solid, dotted, or dashed lines for major short-term levels.
Minor Line Style : Choose between solid, dotted, or dashed lines for minor short-term levels.
Major Line Width : Adjust the thickness of major short-term lines.
Minor Line Width : Adjust the thickness of minor short-term lines.
🔵 Conclusion
Static support and resistance levels are among the most critical tools in technical analysis, helping traders identify key reversal or continuation points.
This indicator simplifies and enhances the analysis process by automatically detecting major and minor levels in both short-term and long-term intervals. It allows traders to customize settings to suit their trading strategies and analyze different market levels effectively.
Using this indicator improves price action analysis, enhances market understanding, and identifies trading opportunities. Applicable to all trading styles, from day trading to long-term investing, it is an essential tool for technical analysis.
Combining this indicator with other tools like trendlines, Fibonacci retracements, and moving averages enables comprehensive analysis and allows traders to navigate financial markets with greater confidence.

Support/Resistance With Breaks & Bounces [MyTradingCoder]This script uses the built-in pivothigh/pivotlow functions to find and identify new levels of basic support and resistance. The script will also automatically identify the first occurrence of a bounce/rejection off the most recent green/red line as well as automatically identify the first occurrence of a breakout of the most recent green/red line. This is a very basic, but effective indicator that is well written, and open source for anyone to learn from or build off of.
All details needed to understand how to use the script are listed below. Enjoy!
Customizable inputs:
- Option to change how pivot points are calculated('candle body' or 'candle wicks')
- Option to change the sensitivity of the pivots(leftbars and rightbars linked)
- Option to change the line width
Available Alert Options:
- Red Line Breakout
- Red Line Bounce/Rejection
- Green Line Breakout
- Green Line Bounce/Rejection
User Manual:
- All calculations are done on the last update of the bar(candle close)
- Only 1 breakout will be allowed per line
- Only 1 rejection will be allowed per line
- If the text is red, then the signal is related to the 'red line', if the text is green, then the signal is related to the 'green line'
- The code is open source, and is programmed using arrays/loops out of the gate, despite not needing to do so. This allows for easy modifications to the scripts behavior while keeping the functionality without it breaking.
- Pivot Rightbars is hardcoded to the same value for leftbars(leftbars = sensitivity). Uncomment the input for right_bars if you want the ability to change the rightbars independently from the leftbars
- When a new line is identified, the old one will stop updating, and no longer be considered for breakout/rejections. This can be changed with a bit of pine knowledge by performing some slight modifications to the code.
- When a new line is drawn, the old line will move backwards a little bit for cleanliness/clarity purposes
- If you have any questions/comments/requests/concerns please leave them down in the comments below
- Don't forget to leave a like if you find this script useful

Support Resistance base Volume RSIThe indicator displays support and resistance levels based on volume and the Relative Strength Index (RSI).
Variable and Input Assignment:
lookback: Determines the period for data lookback.
RsiVisible, RsilabelSize, OversoldForRsi, OverboughtForRsi: Various inputs to adjust RSI indicator parameters.
Indicator Calculation:
highestVol: Finds the highest volume within a certain period.
Rsi: Calculates the RSI value with a period of 14.
roc: Calculates the Rate of Change.
Support and Resistance Level Determination:
Uses a comparison between price change (roc) and RSI value to determine whether the price is rising or falling.
If the price is rising and the current volume is greater than the previous highest volume, a new resistance level is established.
If the price is falling and the current volume is greater than the previous highest volume, a new support level is established.
Support and Resistance Lines:
Creates lines indicating the latest support and resistance levels.
These lines are updated whenever there is a change in support or resistance levels.
RSI Labels:
Displays the RSI value above or below the price chart depending on whether the RSI is above or below the overbought or oversold levels.
If the RSI value is above the overbought level, the label is displayed above the price.
If the RSI value is below the oversold level, the label is displayed below the price.
Labels are removed if the corresponding conditions are not met.
Additional RSI Label:
Adds an additional label displaying the RSI value next to the price chart on the last bar.
The main purpose of this script is to assist traders in identifying support and resistance levels based on price movement, volume, and the RSI indicator. Thus, traders can use this information to make better trading decisions.

[UST] Protein+Support/Resistance Script: A Comprehensive Overview
Thanks to Pmgjiv for providing the foundation to this improved Version.
In the world of trading, having a robust support and resistance analysis tool can make a significant difference in decision-making and overall strategy. Let's delve into the enhancements made to the support/resistance script and how each component contributes to a trader's arsenal:
Changes and improvements made for the script to help Traders make better rational decisions in their Trading:
1. Multiple Timeframes:
Integrating multiple timeframes into the analysis provides a multi-dimensional view of the market. Traders can now assess price action across different time horizons simultaneously. This feature allows for a deeper understanding of market dynamics and helps in identifying significant support and resistance levels across various timeframes.
2. Timeframe Labels Inside Zones:
By including timeframe labels within the zones, traders can easily identify the origin of each support or resistance level. This contextual information enhances clarity and facilitates more informed decision-making, especially when navigating through multiple timeframes.
3. Visual Zone Update:
Visual updates on zones enable traders to track changes in support and resistance levels in real-time. This dynamic feature enhances the analytical process by providing immediate insights into evolving market conditions, thereby enabling traders to adapt their strategies accordingly.
4. Zones Hit:
Understanding the frequency and intensity of zone hits offers valuable insights into the strength and relevance of support and resistance levels. Traders can gauge the significance of each zone based on its historical interaction with price, thereby gaining a deeper understanding of market sentiment and potential trading opportunities.
5. Option to Turn off Current Timeframe:
The ability to toggle off the current timeframe streamlines chart analysis by focusing only on the most critical support and resistance zones. This decluttering feature helps traders prioritize key levels, reducing cognitive overload and enhancing decision-making efficiency.
Explanation of Additional Functions:
a. Lookback:
The 'lookback' parameter allows traders to customize the age of support and resistance zones based on their trading style and preferences. By adjusting the lookback setting, traders can choose whether to prioritize recent price action or consider historical data, thus tailoring the analysis to their specific trading strategies.
b. Swinglength:
Swinglength determines the sensitivity of the support and resistance zones. By modifying this parameter, traders can control how aggressively the script identifies pivot points. A higher swinglength value results in smoother, more stable zones, whereas a lower value increases sensitivity, capturing smaller price movements.
c. ZigZag Indicator:
The ZigZag indicator plays a pivotal role in identifying significant price reversals. Its period setting determines the number of price bars considered before confirming a pivot point. Traders can utilize this indicator to identify key turning points in the market, aiding in the identification of robust support and resistance levels.
Impact of Sensitivity on Zones:
Adjusting the sensitivity of the ZigZag indicator directly influences the identification and delineation of support and resistance zones. Higher sensitivity levels result in fewer but more robust zones, capturing significant price movements. Conversely, lower sensitivity levels yield more zones, accommodating smaller price fluctuations but potentially introducing noise into the analysis.
d. S/R Range:
The ability to adjust the width of support and resistance zones allows traders to customize the breadth of key areas on a chart. Choosing a wider range encompasses a broader spectrum of prices, thereby identifying more comprehensive support and resistance levels. This flexibility enables traders to adapt their analysis to different market conditions and trading strategies.
Utilization in Trading:
Comprehensive Analysis: By incorporating multiple timeframes, traders gain a holistic view of market dynamics, enabling them to identify high-probability trading opportunities across various horizons.
Contextual Understanding: Timeframe labels within zones provide context, helping traders understand the significance of each level in relation to different timeframes and market conditions.
Real-time Adaptability: Visual zone updates facilitate real-time analysis, allowing traders to adjust their strategies promptly in response to changing market conditions.
Informed Decision-making: By considering zone hits, traders can assess the strength and relevance of support and resistance levels, enhancing their ability to make informed trading decisions.
Customized Analysis: Adjustable parameters such as lookback, swinglength, and sensitivity empower traders to tailor the analysis to their individual trading styles and preferences, enhancing precision and effectiveness.
In summary, these enhancements to the support/resistance script provide traders with a powerful toolkit for analyzing market dynamics, identifying key levels, and executing well-informed trading strategies across various timeframes and market conditions.

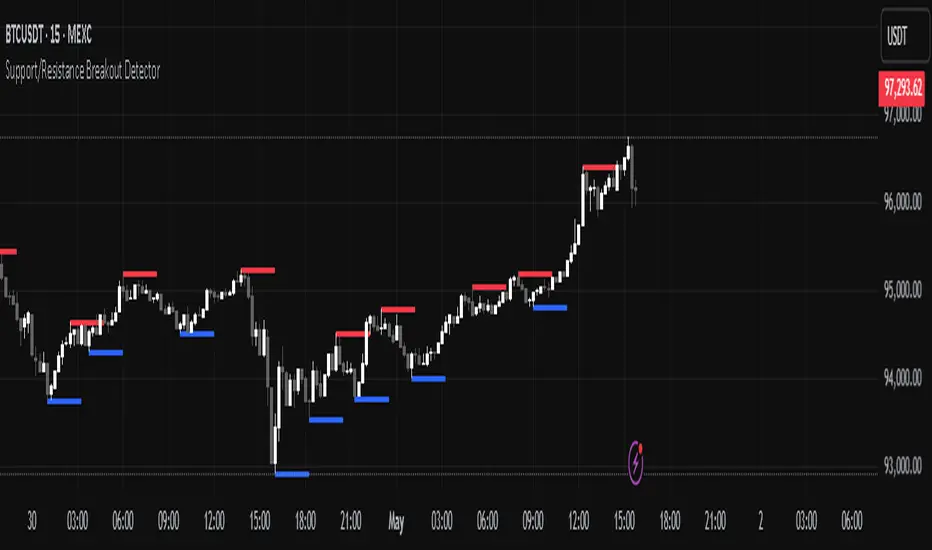
Support/Resistance Breakout DetectorThis indicator automatically detects and plots dynamic support and resistance levels using pivot highs and lows.
✅ It draws red resistance lines and blue support lines,
✅ The lines extend forward but automatically stop when the price touches them,
✅ It monitors for breakouts with strong volume,
✅ When a breakout happens, it shows labels like “B” or “Bull Wick” / “Bear Wick” on the chart,
✅ It also triggers alerts when support or resistance breaks with high volume.
Main settings:
Pivot lookback period
Show/hide breakout labels
Minimum volume for breakout
Maximum extension length for lines
This tool helps traders easily spot key price levels and watch for meaningful breakouts.