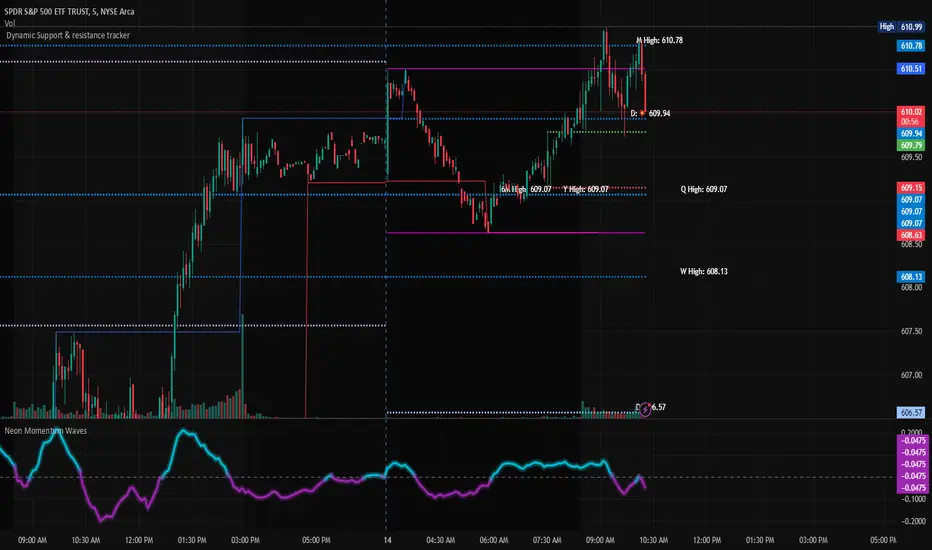
Dynamic Support & Resistance TrackerThe "Dynamic Support & Resistance Tracker" is a powerful Pine Script study designed to identify and visualize key support and resistance levels on a trading chart. This study dynamically adjusts to market conditions, providing traders with valuable insights for making informed trading decisions.
Key Features:
Dynamic Support & Resistance Lines:
The script identifies and plots support and resistance levels using pivot points based on a user-defined number of left and right bars.
Resistance lines are plotted in red, while support lines are plotted in blue, making it easy to distinguish between the two.
Toggle Breaks:
Users can choose to display or hide break signals for support and resistance levels using a simple toggle input.
Volume Threshold:
The study includes daily and weekly high and low calculations to provide a comprehensive view of market ranges.
Previous high and low lines are plotted for both daily and weekly timeframes, aiding in identifying potential breakout or breakdown levels.
Regular Market Hours:
The script defines regular market hours and tracks sessions, ensuring that support and resistance levels are relevant to active trading periods.
Midline and Extension Lines:
The study calculates and plots a midline between the previous high and low, along with extension lines above and below the range. These lines help identify potential target levels and extensions beyond the current range.
Real-time Updates:
The script ensures that all lines are updated in real-time, adjusting to new bars as they form. This dynamic feature keeps the levels relevant and accurate throughout the trading session.
Usage Instructions:
Adjust the number of left and right bars to define the sensitivity of the support and resistance levels.
Toggle the display of break signals to highlight significant breaks in support or resistance.
Monitor the daily and weekly high and low lines to understand the broader market context.
Utilize the midline and extension lines to set potential price targets and manage risk effectively.
This study provides traders with a robust tool for identifying and reacting to key market levels, enhancing their trading strategies with dynamic and real-time insights.
Cerca negli script per "support"
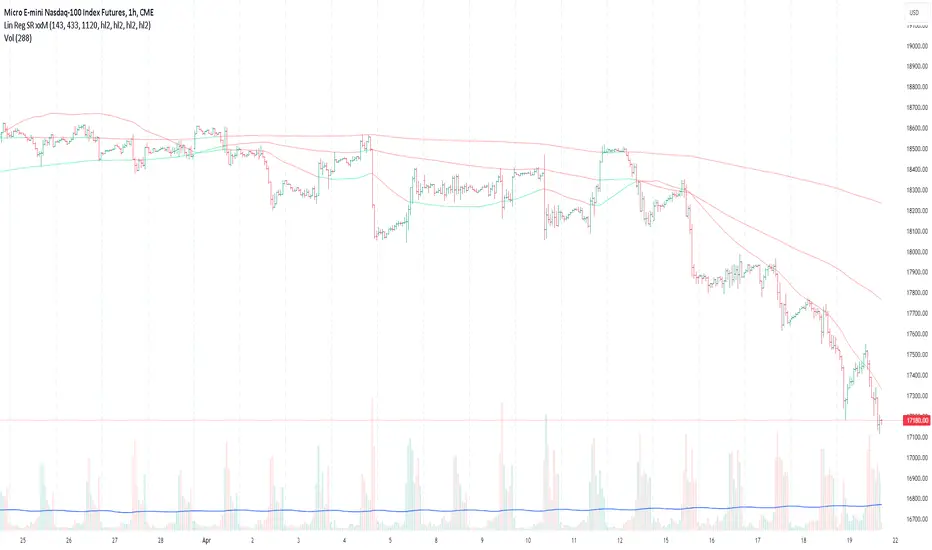
Lin Reg (Linear Regression) Support and Resistance by xxMargauxLin Reg (Linear Regression) Support & Resistance by xxMargaux 💸
This indicator plots three linear regression lines (Lin Reg) on the price chart, providing insights into potential support and resistance levels. It calculates Lin Reg lines based on user-defined lengths and sources.
This indicator's settings were initially configured for MNQ1! (E-Mini Nasdaq 100 futures contracts). But works as intended on any security and on any timeframe.
When price is below a given Lin Reg line, that line will be red and may serve as resistance as price moves up towards the line. That is, it may be a potential short entry opportunity. When price is above a given Lin Reg line, that line will be green and may serve as support as price continues up from the line. That is, it may be a potential long entry opportunity.
When price starts to break sideways or down through the Lin Reg lines, this may signal a reversal from uptrend to downtrend. When price starts to break sideways or up through the Lin Reg Lines, this may signal a reversal from downtrend to uptrend. In very strong trends, breaking through the lines briefly may provide an entry opportunity, but be cautious because a trend reversal may also be possible.
Inputs:
Length of Price Lin Reg Lines: Customize the lengths of the three Lin Reg lines.
Source for Price Lin Reg Lines: Choose the source for each Lin Reg line.
Source for Security Price: Select the price source for the security.
Features:
Trend Analysis: Assists in visualizing price trends based on the relationship between the security price and Lin Reg lines, which will be colored according to whether price is above or below each Lin Reg line.
Customizable Colors: When price is above a Lin Reg line that line will be green. When price is below a Lin Reg line, that line will be red.
Here's a beginner-friendly explanation of linear regression lines 💡
Best-Fit Line: Imagine you have a scatter plot of closing prices on a chart. Linear regression aims to find the straight line that best fits the overall trend of these data points. It's like drawing a line through the center of the data that minimizes the distance between the line and each data point.
Trend Identification: Once the linear regression line is plotted on a price chart, it provides a visual representation of the trend. If the price is generally rising, the linear regression line will slope upwards. If the price is falling, the line will slope downwards. This helps traders identify whether the trend is bullish (upward) or bearish (downward).
Support and Resistance: Linear regression lines can also act as dynamic support and resistance levels. When the price is above the linear regression line, it may act as support, meaning the price tends to bounce off the line and continue higher. Conversely, when the price is below the line, it may act as resistance, with the price encountering selling pressure and potentially reversing lower.
Reversal Signals: Changes in the slope or direction of the linear regression line can signal potential trend reversals. For example, if the price breaks above a downward-sloping linear regression line, it may indicate a shift from a downtrend to an uptrend, and vice versa.
Adjustable Parameters: Traders can customize the length of the linear regression line by adjusting the period over which it's calculated. Shorter periods may be more sensitive to recent price changes, while longer periods may provide a smoother trend line.
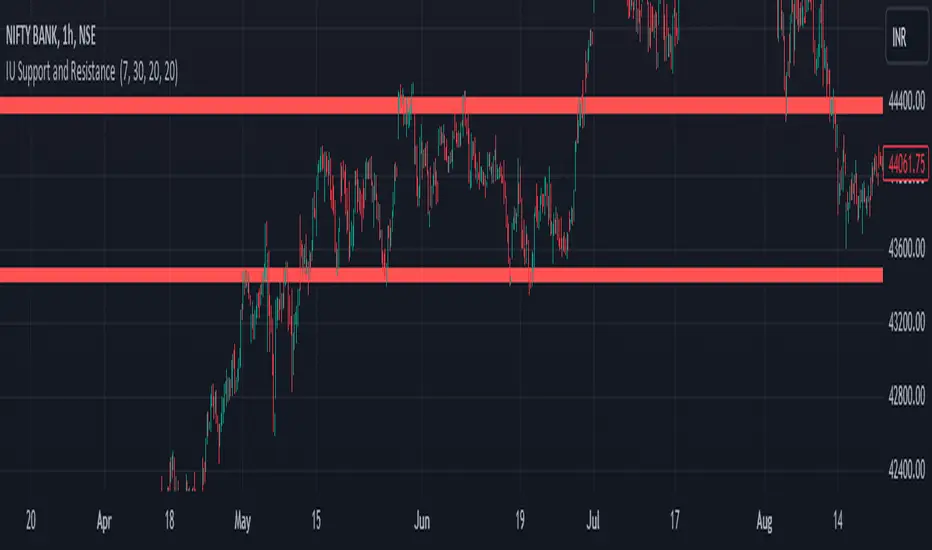
IU Support and Resistance How this script works :
1. This script is an indicator script which calculates the support and resistance based on pivot high and pivot low and plot them as zone onto the chart.
2. The first user input is minimum number of touches which indicates how many time pivot high or pivot low should be tested in order to be a valid support or resistance level.
3.The second user input "Set Buffer" check if the user wants to use a custom buffer or not if it's unchanged then the default is 50% of the 1000 period ATR value .
4. If "Set Buffer" is checked meaning if it's set to true then only the third user input will be execute which is the "buffer" which indicates how much price range user wants his zone to have.
5. After the user input part this script create two arrays to store the pivot high and pivot low values every time he have a new value.
6. This script also creates two arrays to store the bar index of the bar where the new pivot high or pivot low is detected those bar index will be later use while creating the support and resistance zones.
7. Then the script creates four more arrays to store the final support and resistance values and their respective bar index which will be use for creating the support and resistance zones.
8. After this the script check that we are at the last bar of our chart if we are then we sort the support and resistance indices by descending order and store them into an new variable after that we sort the support and resistance arrays by descending order, then we loop through the arrays elements and we check if the previous element comes under the zone of the current element if so we increase the "minimum touch" variable by 1, once we have 5 or more count in our variable and we no longer have a valid zone then we store the element value and the sorted index of the element into our final arrays.
9. Finally the script will loop through the final support and resistance arrays and it will create a box for each support and resistance with respect to extending it on both directions.
10.The green zones are the support and the red zones are the resistance.
How user can benifits from this script:
1. User can automatically identify support and resistance zones and he can plan his trade as per that.
2. User can test how different markets reacts with support and resistance zones.
3. User can plan breakout trade on the break of the support or resistance level.
4. User can adjust he stop loss and take profit as per the support and resistance zones.
EMA + ATR Support and Resistance + Take Profit SignalThe 'EMA+ ATR Support Resistance Take Profit signal' indicator is a technical analysis tool designed to help traders identify potential support and resistance levels, using the Exponential Moving Average (EMA) and the Average True Range (ATR) indicators. This indicator not only tracks the EMA and ATR but also plots these levels as support and resistance lines, providing useful insights into potential buy and sell points.
The indicator allows you to set the lengths for both the EMA and ATR, with default values set to 20 and 14, respectively. Moreover, you can specify the multiplier for the ATR in the Support/Resistance (S/R) length setting, which defaults to 2. The line width for the plotted lines can also be adjusted according to your preference.
The EMA line in center is invisible by default but you can change that by going to the setting of the indicator. The support and resistance lines are plotted in green and red, respectively. When the price hits the support or resistance levels, the indicator provides a visual signal with a cross shape below or above the respective bars, in lime and red, respectively. If you do not need the take profit signals you can disable them in the setting.
How to Use:
1. Define the EMA and ATR lengths according to your trading strategy. Higher lengths will provide smoother lines but may also lag the current price action.
2. Set the S/R length to determine the distance of the support and resistance lines from the EMA line. Higher values will place these lines further away from the EMA.
3. Monitor the chart for instances when the price hits the support or resistance levels. This is indicated by a cross shape below (for support hit) or above (for resistance hit) the price bar. These points may be considered as potential take profit points or entry/exit points, depending on your strategy.
4. Use the indicator in conjunction with other tools and indicators to confirm signals and reduce the risk of false signals. So the assumption is you enter a trade using your other indicators but you can rely on this indicator to remind you to take profit if you are long by a red cross of the resistance line and if you are short reminds you by a green cross on the support line.
Disclaimer: This indicator should not be used as the sole determinant for any investment decision. Always conduct thorough research and consider multiple factors before trading.

Divergence-Support/ResistenceAnother script based on zigzag, divergence, and to yield support and resistence levels.
This idea started with below two concepts:
▶ Support and resistence are simply levels where price has rejected to go further down or up. Usually, we can derive this based on pivots. But, if we start looking at every pivot, there will be many of them and may be confusing to understand which one to consider.
▶ Lot of people asked about one of my previous script on divergence detector on how to use it. I believe divergence should be considered as area of support and resistence because, they only amount to temporary weakness in momentum and nothing more. As per my understanding
Trend > Hidden Divergence > Divergence > Oscillator Levels of Overbought and Oversold
⬜ Process
▶ Now combining the above two concepts - what we are trying to do here is draw support resistence lines only on pivots which has observed either divergence or hidden divergence. Continuation and indecision pivots are ignored.
▶ Input requires only few parameters.
Zigzag lengths and oscillator to be used. Oscillator periods are automatically calculated based on zigzag length. Hence no other information required. You can also chose custom oscillator via external source.
▶ Display include horizontal lines of support/resistence which are drawn from the candle from where divergence or hidden divergence is detected.
▶ Support resistence lines are colored based on divergence. Green shades for bullish divergence and bullish hidden divergence whereas red shades for bearish divervence and bearish hidden divergence. Please note, red and green lines does not mean they only provide resistence or support. Any lines which are below the price should be treated as support and any line which are above the price should be treated as resistence.
▶ Divergence symbols are also printed on the bar from where divergence/hidden divergence is detected.
↗ - Bullish Hidden Divergence
↘ - Bearish Hidden Divergence
⤴ - Bullish Divergence
⤵ - Bearish Divergence
▶ Script also demonstrates usage of libraries effectively. I have used following libraries in this code.
import HeWhoMustNotBeNamed/ zigzag /2 as zg
import HeWhoMustNotBeNamed/enhanced_ta/8 as eta
import HeWhoMustNotBeNamed/ supertrend /4 as st
Can be good combination to use it with harmonic patterns.

RSI Support & Resistance by DGTRSI Sᴜᴘᴘᴏʀᴛ & Rᴇꜱɪꜱᴛᴀɴᴄᴇ ʙʏ DGT
This experimental study attempts to translate Relative Strength Index (RSI) threshold levels of oversold/overbought and bull/bear zones as probable Price Support and Resistance levels
█ OPTIONS
Support & Resistance Levels , the main aim of the study. Level calculations are based on Relative Strength Index (RSI) threshold levels of oversold/overbought and bull/bear zones, where all threshold values are customizable through the user dialog box. Background of the levels can be colored optionally
RSI Weighted Colored Bars and/or Mark Overbought/Oversold Bars , Bar colors can be painted to better emphasis RSI values. Darker colors when the oscillator is in oversold/overbought zones, light colors when oscillator readings are below/above the bull/bear zone respectively, and remain unchanged otherwise. Besides the colors, with “Display RSI Overbought/Oversold Price Bars” option little triangle shapes can be plotted on top or bottom of the bars when RSI is in oversold/overbought zones
Example usage of the study with explanations
█ OTHERS
More regarding Support & Resistance concept (definition, identifying levels, trading S&R, etc) you are kindly invited to check my previous publication
Price Action - Support & Resistance by DGT
More regarding Relative Strength Index (RSI) and Relative Strength of Volume Indicators , please check Relative Strength of Volume Indicators by DGT
Disclaimer:
Trading success is all about following your trading strategy and the indicators should fit within your trading strategy, and not to be traded upon solely
The script is for informational and educational purposes only. Use of the script does not constitute professional and/or financial advice. You alone have the sole responsibility of evaluating the script output and risks associated with the use of the script. In exchange for using the script, you agree not to hold dgtrd TradingView user liable for any possible claim for damages arising from any decision you make based on use of the script

Toltecas Tendencies, Supports and Resistances V2Trend Lines, Supports and Resistances.
Triangles indicators for confirmations buy/sell.
Use for binaries (1M-3M-5M)
- LRG_Channel_TF_mins_D_W_M = 30
- Range = 1
- SML_Channel_TF_mins_D_W_M = 240
Use for forex/cryptocurrencies/indices (15M-1H-4H)
- LRG_Channel_TF_mins_D_W_M = D
- Range = 1
- SML_Channel_TF_mins_D_W_M = W
Extrapolated Pivot Connector - Lets Make Support And ResistancesIntroduction
The support and resistance methodology remain the most used one in technical analysis, this is mainly due to its simplicity, and unlike lots of techniques used in technical analysis support and resistances have a certain logic, price can sometimes appear moving into a channel, support and resistances allow the trader to estimate such channel and project it into the future in order to spot points where price might reverse direction.
In this script a simple linear support and resistance indicator is proposed, the indicator is made by connecting past pivot high's/low's to more recent ones and extrapolating the resulting connection. The indicator is also able to make support and resistances by using other indicators as input.
Indicator Settings
The indicator include various settings, the first one being the length setting who determine the sensitivity of the pivot high/low detection, low values of length will detect the pivot high/low of noisy variations, while higher values will detect the pivot high/low of longer term variations.
The figure above use length = 5.
The A-High parameter determine the position of the pivot high to be used as first point of the resistance line, higher values will use oldest pivot high's as first point. The B-High parameter determine the last pivot high. A-Low and B-Low work the same way but affect the support line, a label is drawn on the chart in order to help you determine the position of A/B-High/Low.
Using Other Indicators Output As Input
The "Use Custom Source" option allow you to apply the indicator to other indicators, for example we can use a moving average of period 50 as input
Or the rsi :
Let me help you set the proposed indicator easily to indicators appearing on a separate window, for example the momentum oscillator, add the momentum oscillator to the chart, to do so click on indicator and search "momentum", click on the first result, once on the chart put your mouse pointer on the indicator title, you'll see appearing the hide, settings and delete option, at the right of delete you should see three dots which represent the "more" option, click on it and select "Add indicator on Mom" and select the extrapolated pivot indicator, you can do that by searching it, altho it might be easier to do it by adding the indicator to favorites first, you then only need to select it from your favorites.
You might see a mess on the indicator window, thats because the extrapolated pivot is still using high and low as input, go to the settings of the extrapolated pivot indicator and check "Use Custom Source", it should appear properly now.
Tips And Tricks When Using Support And Resistances
Linear support and resistances assume an approximately linear trend, if you see non linear growth in the price evolution you can use a logarithmic scale in order to have a more linear evolution. To do so right click on the the chart scale and select "Logarithmic" or use the following key shortcut "alt + l".
When applying the indicator to an oscillator centered around zero make sure to adjust the settings of the oscillator such that the peak magnitude of the oscillator is relatively constant over time.
Here a roc of period 9 has non constant peak amplitude, you can see that by looking at the position of the pivots (circles), increasing the period of the roc help capture more significant pivots high's/low's
Conclusion
In this post an indicator aiming to draw support and resistances is presented, the fact that it can be applied to any other indicator is a relatively nice option, and i hope you might make use of this feature.
The code make heavy use of the new features that where integrated on the v4 of pine, such features are really focused on making figures and labels, things i don't really work with, but it is nice to step out my short codes habits, and i don't exclude working with figures in pine in the future.
Thanks for reading !

Nifty OI Support Resistance This study is designed for educational purposes to assist traders in analyzing price structure on the Nifty 50 index. It creates visual reference zones based on standard mathematical intervals used in the derivatives market.
Purpose of the Tool: In the Nifty 50 index, price action is often analyzed relative to "Round Numbers" or standard strike intervals (e.g., multiples of 50). This script automatically plots these mathematical reference levels relative to the current price to help users observe price behavior.
How It Works: This indicator uses a mathematical formula to identify the nearest standard strike price intervals based on the current close price.
Strike Logic: It projects levels at standard 50-point intervals (Nifty's standard strike distance).
Volatility Buffers: It adds a user-defined buffer (default: 30 points) around these levels to visualize a "zone" rather than a specific price point.
Major Levels: It visually distinguishes major round numbers (multiples of 500) which are often significant for technical analysis.
Features:
Automated Plotting: Adjusts dynamically as price moves to show relevant upper and lower reference bands.
Zone Visualization: Helps in identifying potential areas of support or resistance based on technical structure.
Customizable: Users can adjust the strike distance and buffer range to suit different volatility conditions.
Usage: This tool is intended to be used as a visual aid for Technical Analysis. It allows users to see where the price is located relative to standard Nifty intervals.
⚠️ STANDARD DISCLAIMER & DISCLOSURE:
Nature of Content: This script and description are for educational and informational purposes only.
No Financial Advice: This tool does not constitute investment advice, buy/sell recommendations, or trading tips.
Not SEBI Registered: The author is not a SEBI registered Research Analyst (RA) or Investment Advisor (IA).
Methodology: The levels displayed are generated purely via mathematical calculation based on price inputs and do not represent real-time exchange Open Interest data.
Risk Warning: Trading in securities market is subject to market risks. Read all the related documents carefully before investing. User discretion is advised.

Ultra Clean Support / Resistance LevelsThis provides an Ultra Clean look for Support and Resistance levels
Ultra Clean Support / Resistance LevelsThis Provides a very clean Support and Resistance level on any timeframe

LDO Support and Resistance with Trend LinesUnderstanding the Indicator on Your Chart
Support Lines (Green): These horizontal lines represent price levels where LDO is likely to find buying interest, preventing further declines. They turn a semi-transparent green when the price is above them and blue when below.
Resistance Lines (Blue): These horizontal lines indicate price levels where selling pressure may halt upward movements. They turn a semi-transparent blue when the price is below them and green when above.
Trend Lines (Blue for Resistance, Green for Support): Diagonal lines show the overall trend direction. Blue trend lines indicate resistance (price may struggle to rise above), and green trend lines indicate support (price may find a floor).
Pivots: Small triangles appear above or below candles to mark pivot highs (resistance) and pivot lows (support), helping you identify key turning points.
Customizing the Indicator
You can tweak the indicator’s behavior through the settings panel. Here’s what each input does:
Show Trend Lines? (Default: True)
Enables or disables the display of trend lines on the chart. Set to false to hide trend lines if you only want support/resistance levels.
Choose Higher Time Frame
Select a higher timeframe (e.g., 1H, 4H, 1D) to display support and resistance levels from that timeframe on your current chart (e.g., 5M or 15M).
Pivot Length Settings (Current and Higher Timeframe):
Pivot Length Left Hand Side (Current/HTF): Adjusts how many bars to the left the indicator looks to identify pivot lows (default: 15 for current, 20 for HTF).
Pivot Length Right Hand Side (Current/HTF): Adjusts how many bars to the right the indicator looks to identify pivot highs (default: 10 for current, 15 for HTF).
Increase these values for fewer, more significant pivots; decrease for more frequent pivots.
Pivot Sources (Trend 1 and Trend 2 Pivots):
Select the price source (e.g., low, high) for calculating pivot lows and highs. Default is low for pivot lows and high for pivot highs.
Line Width Settings:
Lower Time Frame Line Width (Default: 5): Sets the thickness of support/resistance lines on the current timeframe.
Higher Time Frame Line Width (Default: 18): Sets the thickness of support/resistance lines on the higher timeframe.
Show Support & Resistance? (Default: True)
Enables or disables the display of horizontal support and resistance lines. Set to false to hide them if you only want trend lines.
Alert Settings (Under “Alerts” Group):
Enable Trend Line Alerts? (Default: True): Turns alerts on or off for trend line hits.
Alert on Resistance Trend Lines? (Default: True): Enables alerts when the price hits resistance trend lines.
Alert on Support Trend Lines? (Default: True): Enables alerts when the price hits support trend lines.
Alert Message: Customize the alert message format (default: “Price hit trend line at {0}”, where {0} is replaced by the price).
Setting Up Alerts
Enable Alerts in the Indicator:
In the indicator settings, ensure “Enable Trend Line Alerts?” is set to true, and choose whether to alert on resistance or support trend lines.
Create a TradingView Alert:
Click the “Alerts” button (bell icon) at the top of the chart.
Select “Create Alert” and choose this indicator from the “Condition” dropdown.
Set the alert frequency (e.g., once per bar, only once), notification method (e.g., email, popup), and save the alert.
Test the Alerts:

Yakloft Support and Resistance LevelsYakloft Support and Resistance Levels Indicator
The Yakloft Support and Resistance Levels indicator is a powerful tool designed to help traders identify key support and resistance levels on a price chart. By leveraging advanced pivot point calculations and customizable settings, this indicator provides clear visual cues for potential price reversals and market trends.
Key Features
Automatic Support and Resistance Levels:
Dynamic Calculation: The indicator automatically identifies and plots significant support and resistance levels based on pivot highs and lows.
Customizable Strength: Adjust the S/R Strength parameter to filter levels according to their significance. Higher values display fewer but more robust levels.
Zones Around Levels:
Support and Resistance Zones: Create zones around each support and resistance level to highlight areas of interest rather than exact price points.
High/Low Zones: Plot zones around the highest and lowest price levels within a specified period, providing additional context for potential breakouts or reversals.
Zone Width Adjustment: Customize the width of the zones using the Zone Width % parameter, calculated as a percentage of the price range over the last 300 bars.
Line Styles and Fills:
Customizable Appearance: Modify line colors, styles (Solid, Dotted, Dashed), and widths to match your chart preferences.
Line Fills: Enhance visual clarity by filling zones with semi-transparent colors, making it easier to distinguish between support and resistance areas.
Dynamic Line Management:
Automatic Line Removal: To keep your chart uncluttered, the indicator removes a support or resistance line after the price crosses it twice. This feature helps you focus on the most relevant and current levels.
Expandable Lines:
Line Extension: Choose to extend lines both forward and backward in time with the Expand S/R Lines option, providing a comprehensive view of historical support and resistance.
How It Works
The indicator analyzes price data to identify pivot highs and lows over a specified lookback period. These pivot points are potential areas where the price may reverse or experience significant support or resistance. By filtering these points based on the S/R Strength parameter, the indicator ensures that only the most significant levels are displayed.
Once the levels are identified:
Support Levels: Plotted when the price shows potential to stop falling and possibly start rising.
Resistance Levels: Plotted when the price may stop rising and potentially start falling.
The indicator enhances these levels by:
Adding Zones: By creating a buffer around each level, traders can see areas where the price might interact with support or resistance, rather than focusing on a single price point.
Line Fills: The zones are filled with a semi-transparent color corresponding to support or resistance, improving visual distinction.
Input Parameters
Enable Support & Resistance: Toggle the entire indicator on or off.
Support Color: Choose the color for support lines and fills.
Resistance Color: Choose the color for resistance lines and fills.
S/R Strength: Set the sensitivity of level detection. Higher values result in fewer, more significant levels.
Line Style: Select the style of the support and resistance lines (Solid, Dotted, Dashed).
S/R Line Width: Adjust the thickness of the support and resistance lines.
Enable Zones: Toggle the display of zones around each level.
Enable High/Low Zones: Toggle the display of zones around the highest and lowest price levels.
Zone Width %: Define the width of the zones as a percentage of the price range over the last 300 bars.
Expand S/R Lines: Choose whether to extend the lines across the entire chart or limit them to recent data.
Using the Indicator
Identifying Key Levels:
Use the plotted support and resistance levels to identify potential entry and exit points.
Pay attention to the zones, as they represent areas where the price is more likely to react.
Monitoring Price Interaction:
Observe how the price behaves around the support and resistance levels.
The automatic removal of lines after two crossings helps focus on active levels.
Customizing for Clarity:
Adjust the visual settings to match your trading style and improve chart readability.
Experiment with the S/R Strength and Zone Width % to fine-tune the indicator to different market conditions.
Best Practices
Combine with Other Analysis Tools:
Use the indicator alongside other technical analysis tools like trend lines, moving averages, and oscillators for a more comprehensive market view.
Adjust for Different Timeframes:
The indicator works on various timeframes. Adjust the parameters when switching between short-term and long-term charts to maintain effectiveness.
Stay Updated with Market Conditions:
Market volatility can affect the significance of support and resistance levels. Regularly adjust the S/R Strength parameter to align with current market dynamics.
Limitations
Not a Standalone Solution:
While the indicator provides valuable insights, it should not be used in isolation. Always consider broader market analysis and risk management practices.
Historical Data Dependency:
The accuracy of the levels depends on the availability of sufficient historical data. Ensure your chart includes enough data for the indicator to perform effectively.

CARNAC Trading Support and Resistance LevelsOverview
The "Carnac Trading Support and Resistance Levels" indicator is a powerful tool designed to help traders identify key support and resistance levels across multiple timeframes. This tool enhances trading strategies by visually marking significant price levels and providing configurable stop-loss and alert features.
Features
Support and Resistance Levels: Automatically calculates and plots support and resistance levels for the following timeframes:
5 minutes (5M)
10 minutes (10M)
15 minutes (15M)
30 minutes (30M)
1 hour (1H)
2 hours (2H)
4 hours (4H)
6 hours (6H)
12 hours (12H)
1 day (1D)
1 week (1W)
1 month (1M)
Configurable Stop-Loss (SL) Levels: Adds a stop-loss line below each support level and above each resistance level with customizable padding (as a percentage).
Visual Labels: Clearly labels support, resistance, and stop-loss levels with the corresponding prices and timeframes for easy identification.
Line Customization:
Support Levels: Green lines with varying thickness based on the timeframe.
Resistance Levels: Red lines with varying thickness based on the timeframe.
Stop-Loss Levels: Gray dotted lines for clear distinction.
Alerts: Alerts trigger when the price gets to a configurable percentage from the support or resistance levels, helping you stay informed about potential buying and selling opportunities.
Visibility Toggling: Easily toggle the visibility of support and resistance levels for each timeframe (default enabled for 2H, 4H, and 1D).
How to Use
Add the Indicator:
Navigate to the TradingView Pine Editor.
Paste the provided Pine Script code and click "Add to Chart."
Configure Inputs:
Lookback Periods: Adjust the lookback periods for each timeframe to suit your analysis needs.
Padding Percentage: Set the padding percentage for the stop-loss levels to define the distance below the support levels and above the resistance levels.
Visibility: Toggle the visibility of the support and resistance levels for each timeframe as needed (default enabled for 2H, 4H, and 1D).
Alert Trigger Distance: Set the alert trigger distance as a percentage to determine when the alerts should be triggered.
Interpret the Plotted Levels:
Green Lines: Indicate support levels for the respective timeframes.
Red Lines: Indicate resistance levels for the respective timeframes.
Gray Dotted Lines: Represent the stop-loss levels below each support level and above each resistance level, with the specified padding.
Labels: Provide clear indications of the price levels and their respective timeframes in white text for visibility.
Identifying Buying and Selling Opportunities:
Buying Opportunities:
Look for the price to approach or bounce off a support level (green line).
Confirm the potential for a reversal by checking if the price is nearing a key support level from multiple timeframes.
Use the stop-loss level (gray dotted line) to set your stop-loss order below the support level to minimize risk.
Selling Opportunities:
Look for the price to approach or get rejected at a resistance level (red line).
Confirm the potential for a reversal by checking if the price is nearing a key resistance level from multiple timeframes.
Use the stop-loss level (gray dotted line) to set your stop-loss order above the resistance level to minimize risk.
Alerts:
Alerts will notify you when the price gets within the specified percentage distance from each support or resistance level.
Use these alerts to stay informed about potential buying and selling opportunities.

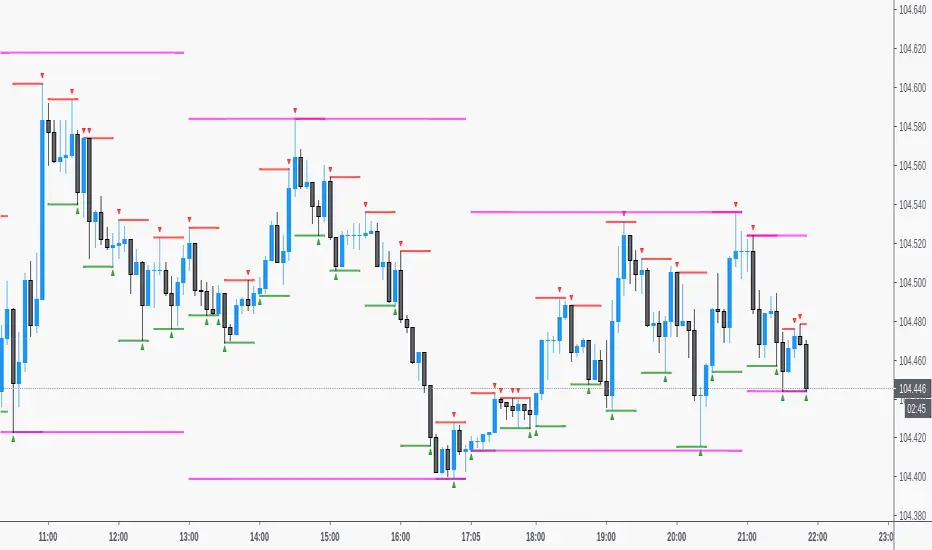
Psychological Support/Resistence [BigBeluga]The Psychological Support/Resistance indicator aims to provide the user with hypothetical support and resistance zones that are likely to provoke a strong reaction in price, either in both directions, providing good bouncing zones or significant movements once those levels are breached.
🔶 CALCULATION
The script takes into consideration the total number of sequential candles moving in the same direction, as determined by the user's settings. When this sequence is identified, a level is created.
A level is considered broken when the candle's close is above the top/bottom of the level.
Users have the option to select the width of the area based on the Average (AVG), Open, or Close.
AVG will provide the average width of the level of the area.
Close will offer a broader range to work with.
Open will provide a very narrow area.
🔶 METHODOLOGY
The idea behind these areas is that the price will be more likely to produce either a substantial move in the ongoing direction or, when breached, a strong price reaction.
The more the support level is touched or tested, the more likely it is to break.
The longer it has been since its creation and the less it has been tested, the more likely it is to offer strong support or resistance.
Wicks starting to close above the level will indicate a potential breakout to the upside or downside if a candle manages to close above it.
🔶 INPUTS
Users have the option to determine the number of sequential candles.
Users also have the option to decide how many zones to display on the chart.
Color changes are possible.
The possibility to show volume on the creation of the zone is included."

DB Support Resistance Levels + Smart Higher Highs and Lower LowsDB Support Resistance Levels + Smart Higher Highs and Lower Lows
The indicator plots historic lines for high, low and close prices shown in settings as "base levels". Users can control the lookback period that is plotted along with an optional multiplier. Traders will notice that the price bounces off these historic base levels. The base levels are shown as light gray by default (customizable in the settings). Users may choose to display base levels by a combination of historic high, low and close values.
On top of the historic base levels, the indicator display higher high and lower low levels from the current bar high/low. Higher highs are shown by default in pink and lower lows by default in yellow. The user can adjust the lookback period for displaying higher highs and the optional multiplier. Only historic values higher than the current bar high are displayed filtering out (by highlighting) the remaining levels for the current bar. Users may choose to use a combination of historic open, low and close values for displaying higher highs. The user can adjust the lookback period for displaying lower lows and the optional multiplier. Only historic values lower than the current bar low are displayed filtering out (by highlighting) the remaining levels for the current bar. Users may choose to use a combination of historic open, low and close values for displaying lower low.
The indicator includes two optional filters for filtering out higher highs and lower lows to focus (highlight) the most relevant levels. The filters include KC and a simple price multiplier filter. The latter is enabled by default and recommended.
The indicator aims to provide two things; first a simple plot of historic base levels and second as the price moves to highlight the most relevant levels for the current price action. While the indicator works on all timeframes, it was tested with the weekly. Please keep in mind adjusting the timeframe may require the lookback settings to be adjusted to ensure the bars are within range.
How should I use this indicator?
Traders may use this indicator to gain a visual reference of support and resistance levels from higher periods of time with the most likely levels highlighted in pink and yellow. Replaying the indicator gives a visual show of levels in action and just how very often price action bounces from these highlighted levels.
Additional Notes
This indicator does increase the max total lines allowed which may impact performance depending on device specs. No alerts or signals for now. Perhaps coming soon...

Volume Profile Fixed Range Support and Resistance LevelsThis script is based on the excellent Volume Profile / Fixed Range indicator by @LonesomeTheBlue, so all credit for the foundations of this indicator goes to @LonesomeTheBlue
I basically made 5 instances of the original script and added horizontal lines at the beginning and end of the each Value Area. To use the script as a support and resistance tool without the Value Areas and Point of Control (POC) labels you just need to untick "Boxes" and "Labels" in the "Style" section of the “Settings”.
The default look-back periods (in bars) are 7, 30, 60, 180 and 365, but you can change this or the colour of the lines easily in the “Settings”.
The dashed lines are the respective POC.
I find this tool to be very useful for quickly identifying interest levels on any chart while also ensuring a certain amount of objectivity in your TA.
Hope you find it useful and thanks again to @LonesomeTheBlue for going through the trouble of coding this and being so generous to share it with the rest of us!
Good luck out there!

Volume Based Support & ResistanceThis script uses the Volume of each candle to find support and resistances on the whole visible chart. There is a single easy to use setting that is the Distance between major S/R lines which is 10% for the default and better for Daily timeframe. If you set a lower number, for example 5% then there will be more lines on the chart which is better for lower time frames and higher number like 20% maybe better for weekly timeframes.
It is developed based on using for Bitcoin daily timeframe, but it can be used for any symbol on any timeframe with the proper settings.
The limitation is the number of visible candles which the data and S/R lines are calculated based on them (if the previous data was within the same price range and if not, there is no issue).
Also, this code is a good learning example of using arrays and lines together in the trading view's pine script.

PSAR-Support ResistanceParabolic Support Resistance -PSAR SR is based on the Dynamic Reversal Points of Price. This indicator eliminates the false signals of regular Parabolic SAR (Stop and Reverse). The Price of previous SAR Reversal point is plotted as Support and Resistance. The idea is to trade only after the previous reversal point is crossed and a new candle formation above / below the support resistance lines.
Price moves sideways in between the S/R Lines mostly.
Buy and Sell Signals are based on normal P-SAR settings however this S/R must be considered. Please be aware that the indicator cannot be used as a stand alone. Please make required confirmations before going into action.
Disclaimer: Please use it at your own Risk.

Bagang Pivot Zones | Supply & Demand, Support & ResistanceBagang Pivot Zones detects imbalances from classic reversal and momentum price actions.
Imbalances create pivot zones, a.k.a Supply & Demand / Support & Resistance / Orderblock zones.
Use Cases
1. Traders using Supply & Demand theory can quickly pinpoint imbalance zones created by BUY-to-SELL and SELL-to-BUY candles.
2. Trend Following traders can systematically catch and follow a trend based on pivot zones analysis.
3. Breakout traders can easily target pivot zones’ breakout and breakdown.
4. Take the guesswork out of risk management: manage stop-loss precisely behind pivot zones.
5. Analyze contrary pivot zones to set realistic profit targets.
Objectivity
By only comparing OHLC values to identify notable price actions, Bagang Pivot Zones avoids derived calculations with subjective parameters.
Chart Issue
If the chart zooms out after adding an indicator, right-click the price scale and toggle "Scale price chart only” on.

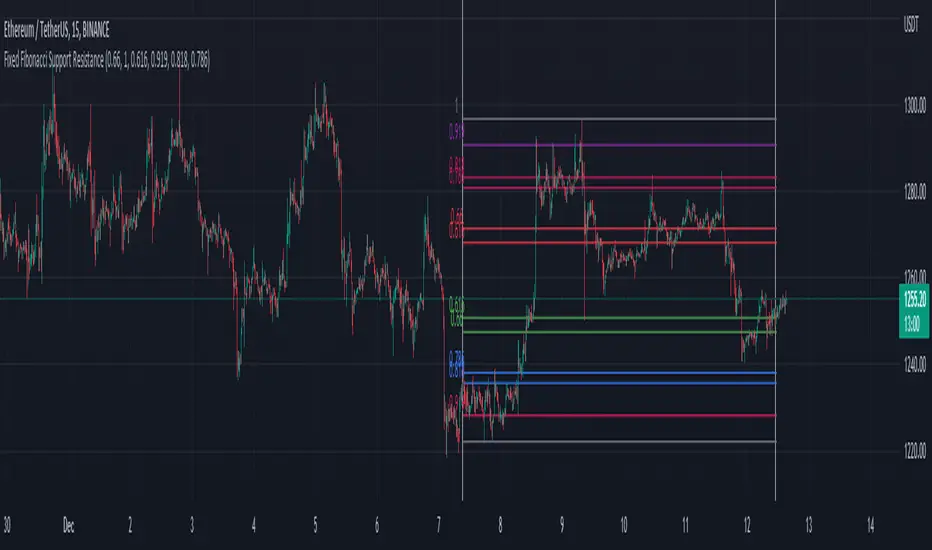
Fixed Fibonacci Support ResistanceI took the formula of the fibonacci from LonesomeTheBlue and made this script. You can take a look at his indicator here:
When you first add the indicator on the chart, click on the chart to select the first date and then the second date. It will then calculate the fibonacci support and resistance of the range you choose. You can also choose the date inside the inputs.
Be sure the first date is before the second date, otherwise it won't be able to show the fibonacci. If that happen, choose a correct date in the inputs.
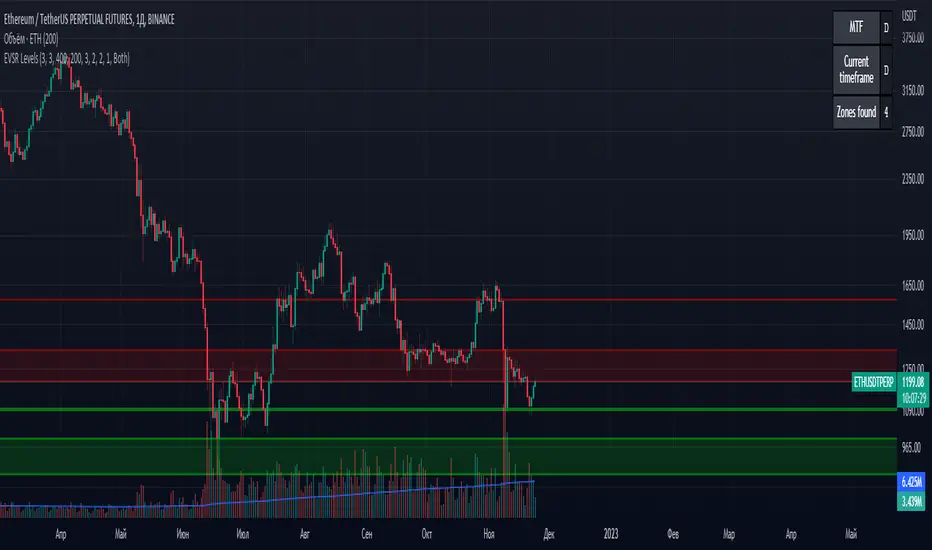
Extreme Volume Support Resistance LevelsExtreme Volume Support Resistance Levels are S/R levels(zones, basically), based on extreme volume .
Settings:
Lookback -- number of bars, which algorithm will be using;
Volume Threshold Period -- period of MA (Volume MA), which smoothers volume in order to find the extremes;
Volume Threshold Multiplier -- multiplier for Volume MA, which "lift" Volume MA and thus will provide the algorithm with more accurate extreme volume ;
Number of zones to show -- number of last S/R zones, which will be shown on the chart.
RU:
Extreme Volume Support Resistance Levels — это уровни S/R (зоны, в основном), основанные на избыточном объеме.
Параметры:
Lookback -- число баров, которое алгоритм будет использовать для расчётов;
Volume Threshold Period -- период MA (Volume MA), которая сглаживает объем для нахождения экстремумов объёма;
Volume Threshold Multiplier -- множитель для Volume MA, который "поднимает" Volume MA и тем самым обеспечивает алгоритм более точными значениями экстремального объёма;
Количество зон для отображения -- количество оставшихся зон S/R, которые отображаются на графике.
Donchian Trendline - Support Resistance Slope [UhoKang]// This is a strategy that draws a trend line in the form of a slope whenever the high point and low point are updated.
// The upper slope serves as a resistance line, and the lower slope serves as a support line.
// Buy when the of the candle crosses the slope
