Niv Deal + Previ D W M + OPR + Asian🧭 Indicator Description (English)
Name: Niveaux Dealers + Previous D/W/M Auto + OPR + Asian Session
Platform: TradingView (Pine Script v6)
Type: Multi-module visual indicator for market structure and session ranges
🧩 Overview
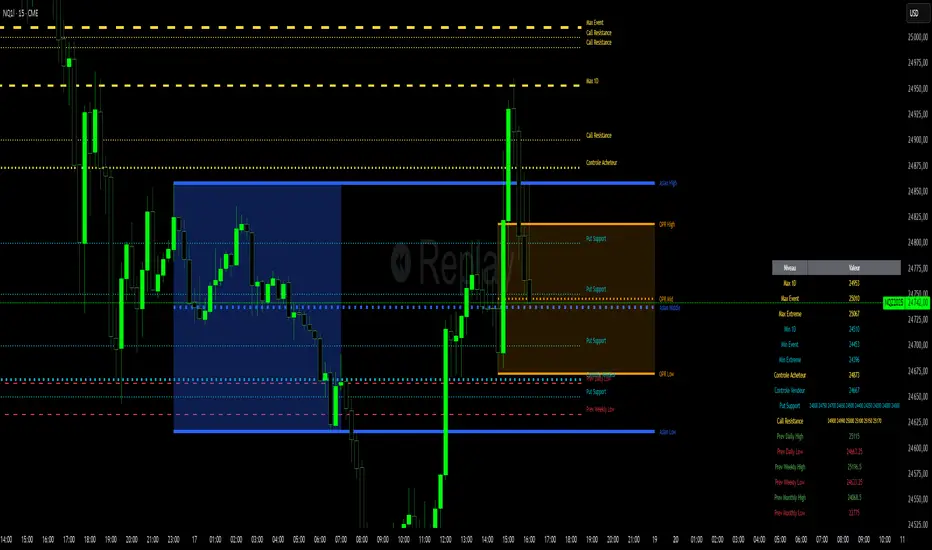
This indicator combines three complementary modules to help traders visualize key market levels, opening ranges, and session dynamics — all in one comprehensive tool.
It is designed primarily for index and futures trading (e.g. NQ, ES, DAX), but can be applied to any market or timeframe.
MODULE 1 — Dealers Levels + Previous High/Low (Auto)
This first module automatically extracts and plots custom Dealer Levels and Previous Period Levels.
It can parse manually entered price levels (from a single text input) such as daily max/min, control levels, put supports, and call resistances — then draw horizontal lines and labels on the chart.
Features:
One text input for all dealer levels (easy copy-paste format).
Automatic parsing of prices from text (ignores irrelevant characters).
Groups of levels:
Maxima (Max 1D / Event / Extreme)
Minima (Min 1D / Event / Extreme)
Buyer/Seller Controls
Put Supports and Call Resistances
Independent color, style, and width for each line.
Transparent rectangular labels positioned perfectly on the levels.
Previous Daily, Weekly, and Monthly High/Low levels added automatically.
Optional summary table showing all levels and values in real time.
MODULE 2 — OPR (Opening Price Range)
The second module highlights the Opening Price Range, defined by the first 15 minutes (or any chosen period) of the trading session.
Features:
Fully configurable start and end time (local chart timezone).
Displays:
High, Low, and Midline (median)
Optional rectangle between high/low
Optional labels on each line
Independent color, line style, and thickness.
Works perfectly with non-standard sessions (e.g. 13:30–22:00 UTC for U.S. futures).
Uses local chart time instead of exchange time for intuitive control.
MODULE 3 — Asian Session Range
The third module draws the Asian trading session range, automatically detecting price action between configurable hours (default 17:00 → 01:00).
Features:
Adjustable start and end time (supports overnight sessions).
Plots Asian High, Asian Low, and Asian Middle (mid-range line).
Highlights the Asian box area with semi-transparent color.
Optional labels at the end of each level.
Fully synchronized with the chart’s local timezone (same logic as OPR).
Simple toggle to enable or disable the entire Asian module.
⚙️ Customization & Display
Each module can be toggled independently.
Colors, line styles (solid, dashed, dotted), and thickness are customizable.
Label visibility and extensions (left/right) can be adjusted.
The indicator is lightweight and optimized for real-time performance.
💡 Use Case
Traders can use this multi-module setup to:
Identify dealer reaction zones and institutional levels.
Track previous highs/lows for potential liquidity sweeps.
Monitor session ranges (Opening and Asian) for volatility shifts.
Combine all three perspectives (Dealer, Session, Historical) into one unified view.
Would you like me to rewrite this description in TradingView publication form
Cerca negli script per "support"
Precision LevelsThis open-source Support and Resistance Indicator helps traders plot key price levels where the market may reverse or consolidate. By plotting support and resistance zones based on historical price action, it provides clear visual cues for potential entry and exit points across various timeframes.
Customizable Settings: Adjust visual styles to suit your trading strategy.
Multi-Timeframe Support: View and plot levels from higher timeframes using the monthly and weekly levels.
User-Friendly: Lightweight design with clear plotting for easy integration into any setup.
How It Works:
The indicator plots simple Support and resistance. Zones are labeled monthly, weekly, and daily
Usage:
Apply the indicator to your chart.
Enter a value for each support and resistance level. Drag and Adjust on the chart to your liking.
Use the plotted levels to identify potential reversals, breakouts, or stop-loss placements.
Combine with other tools (e.g., trendlines or oscillators) for confirmation.
Note: This is the open-source version of my previously protected Support and Resistance Indicator. The protected version is flagged and hidden from community and no longer maintained. Feel free to explore and modify the code to fit your needs! For feedback or suggestions, leave a comment below or message me direct.

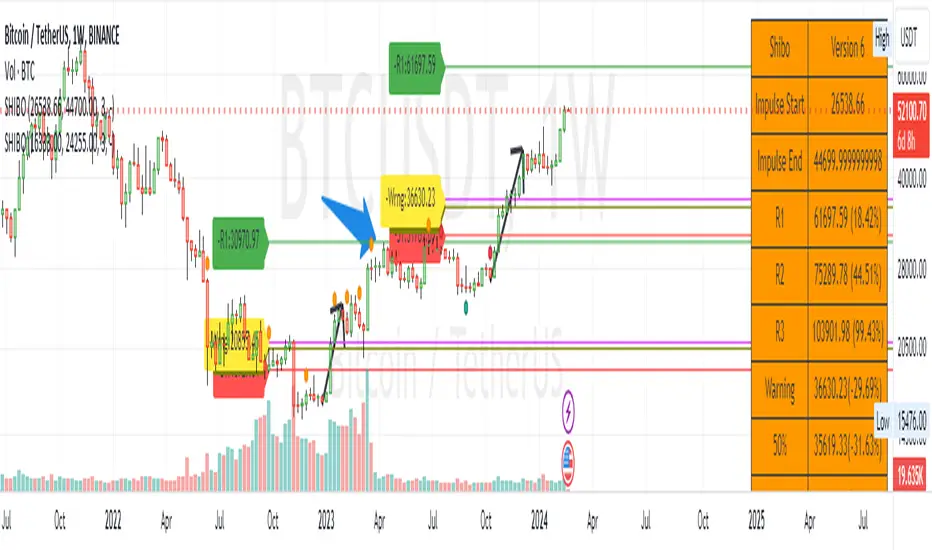
SHIBO V6.0**SHIBO v6 - Fibonacci Impulse Analysis Indicator**
*By Shahab Sadeghi (@shahabs2004)*
**Overview:**
Welcome to SHIBO v6, a revolutionary Fibonacci Impulse Analysis Indicator designed to harness the power of a unique chart pattern. The script employs a reverse Fibonacci methodology to identify powerful impulses that first reach Fibonacci level 0.382, experience a correction, and then continue toward Fibonacci level 1. This description delves into the intricacies of how the script calculates precise price targets based on this distinctive pattern.
keep in mind that this Indicator is based on this Idea that each Impulse have its own support and Resistant Levels(stop loss and Target)
**Key Features:**
1. **Reverse Fibonacci Calculation:** SHIBO v6 introduces a novel approach to Fibonacci analysis. Instead of the conventional method where price targets are set from Fibonacci 0 to 1, this script calculates the distance price moves towards Fibonacci 1 from 0.382. This innovative technique identifies potential reversal and continuation zones with unparalleled accuracy.
2. **Impulse and Correction Identification:** Users play a pivotal role in recognizing high-probability trading opportunities. The script requires manual selection and marking of powerful impulses, focusing on identifying corrections and anticipating potential reversal zones within these impulses.
3. **Optimized Fibonacci Levels:** Leveraging the reverse Fibonacci approach, the script dynamically computes and draws Fibonacci retracement levels (R1, R2, R3) based on the calculated distance the price has moved towards Fibonacci 1. These levels serve as strategic benchmarks, offering insights into potential price movements and areas of interest.
4. **Dynamic Line Drawings:** SHIBO v6 features dynamic line drawings, including impulse start and end points, Fibonacci levels, and stop-loss levels. These visual elements facilitate a comprehensive understanding of the analysis, assisting users in making well-informed trading decisions.
5. **Informative Table Display:** A dedicated table provides crucial information, including impulse start and end points, Fibonacci levels, and percentage deviations from the current price. This table enhances the user's grasp of the analyzed data, fostering effective decision-making.
6. **Prefix Identification:** Users employing multiple SHIBO indicators on a chart can use the Prefix input to assign a unique identifier to each instance. This streamlines the analysis process, particularly when dealing with multiple instances of the indicator.
**How the Script Calculates Targets:**
1. **Impulse Recognition:** Users manually identify a robust impulse in the price movement, signifying a potential trend change or continuation.
2. **Correction Confirmation:** Anticipate or confirm the start of a correction phase within the selected impulse. Corrections often occur after a strong price movement.
3. **Manual Setting of IS and IE Points:** Set the impulse start (IS) and end (IE) points manually based on the identified impulse and correction.
4. **Fibonacci Level Calculation:** The script dynamically calculates Fibonacci levels (R1, R2, R3) based on the distance the price has moved towards Fibonacci 1 from 0.382. These levels serve as potential targets and areas of interest.
5. **Visual Representation:** The script visually represents the calculated levels through dynamic line drawings, providing a clear picture of potential reversal and continuation zones.
**Advanced Usage (Pro Users):**
- **Customizable Line Drawings:** Explore the commented-out lines in the script for additional functionalities and customization options for line drawings. Pro users can tailor the script to align with unique trading strategies.
**Disclaimer:**
Trading carries inherent risks, and SHIBO v6 introduces a distinctive approach to technical analysis. Exercise caution, conduct thorough analysis, and consider risk management strategies before making trading decisions. Past performance does not guarantee future results.
**Support and Feedback:**
Join the community of traders committed to refining strategies based on reverse Fibonacci impulse analysis. Share your experiences, insights, and suggestions to contribute to the continuous improvement of SHIBO v6.
**how Calculations Goes ?**
Imagine you're analyzing a stock price:
IS (Initial Start Price): Let's say the stock price starts at $100.
IE (Initial End Price): After a significant movement, the price reaches $120.
1. Identify Fibonacci Retracement Levels:
fi1 (0.382): This level suggests a potential retracement of 38.2% of the upward move.
fi2 (0.5000): This level represents a 50% retracement, or halfway back to the starting price.
fi3 (0.6180): This level represents the "Golden Ratio" and another potential support/resistance area.
fi4 (0.7860): This level suggests a retracement of 78.6% and can also be used for stop-loss calculations.
2. Calculate Multiples:
m1: Divide the final price ($120) by the starting price ($100) raised to the power of fi1 (120 / 100^0.382). This gives you a value we'll use later.
m2: Similar calculation, but using fi2 instead of fi1.
m3: Similar calculation, but using fi3 instead of fi1.
3. Calculate Target Prices:
Take Profit (Resistance)
TP1: Raise the value of m1 to the power of 1/(1-fi1). This gives you a potential upside target price based on the 38.2% retracement level.
TP2: Similar calculation, but using m2 and fi2.
TP3: Similar calculation, but using m3 and fi3.
4. Calculate Stop-Loss Levels:
Stop loss(Support)
SL1 or Support: Multiply TP1 by the starting price ($100) raised to the power of fi4. This gives you a potential downside stop-loss level based on the 78.6% retracement from TP1.
SL2: Similar calculation, but using TP2 and fi4.
SL3: Similar calculation, but using TP3 and fi4.
5. Calculate Midpoint Level:
MID: Multiply TP1 by the starting price ($100) raised to the power of fi3. This gives you a potential support/resistance level halfway between TP1 and the starting price.
Remember, these are just potential levels and not guaranteed. It's important to use other technical and fundamental analysis alongside Fibonacci retracements.
Here's the breakdown of the steps and their results:
1. Fibonacci levels define potential support and resistance areas:
The chosen Fibonacci levels (0.382, 0.5, 0.618, and 0.786) are often seen as potential zones where the price might stall or reverse after a strong move.
2. Multiples and target prices:
The multiples (m1, m2, m3) represent price ratios based on different retracement levels.
Target prices (TP1, TP2, TP3) are calculated by raising these multiples to specific exponents. These prices suggest areas where the price might encounter resistance after a retracement (not guaranteed predictions).
3. Stop-loss levels:
Stop-loss levels (SL1, SL2, SL3) are based on the target prices and another Fibonacci level (0.786). They mark price points where a trader might exit a trade to manage risk if the price moves against them.
Essentially, the calculations translate Fibonacci retracement levels into concrete price points for potential entry (targets) and exit (stop-loss) points.
*Happy Trading and Empowered Analysis!*
Lines and DiagonalHere we have 2x Codes Together.
A) Volume-based S/R Levels >>> Credits for the creator @wugamlo
B) Support Resistance Diagonal >>> Credits fo the creator @pikusov
I Just mix them in one code.
This indicators are the best ones in tradingview to confirm Supports and Resistances.
it's a good way to help us to check the trend and gives an idea to get in or get out.
You can also use this together with the another indicators that i publish.
It's my setup today:

KTBB Intel: Multi-Timeframe ContextKabroda Intel
This is the official structural companion tool for the Kabroda System. While the "BattleBox Command" script handles specific intraday execution levels, this Kabroda Intel utility visualizes Multi-Timeframe Market Structure to provide broader context.
How It Works (Technical Logic): This script automates the analysis of higher-timeframe structure using standard Pivot High/Low logic, preventing the need for traders to manually switch timeframes.
Scanning: It utilizes request.security() to scan the user-defined Primary (default: 4H) and Secondary (default: 1H) timeframes.
Calculation: It identifies significant structural pivots using ta.pivothigh and ta.pivotlow functions with a customizable lookback period.
Data Integrity: It uses barmerge.lookahead_on with specific index offsets to ensure the data is non-repainting and represents confirmed closed-candle structure only.
Key Features:
Macro Context: Projects 4-Hour Supply & Demand zones directly onto your 5m or 15m execution chart.
Intraday Structure: Highlights 1-Hour breakdown/breakout levels that often act as "speed bumps" for intraday trends.
Zone Visualization:
Red Zones: 4H Supply / Major Resistance.
Green Zones: 4H Demand / Major Support.
Orange/Blue Zones: 1H Intraday Pivots.
Usage Guide:
Step 1: Add this indicator to your chart.
Step 2: Ensure it is running alongside the Kabroda BattleBox Command script.
Step 3: Use these zones as "Caution Areas." Do not execute trades directly into a Red 4H Zone, even if your lower timeframe triggers suggest a breakout. Context overrides execution.
Disclaimer: This tool is for structural analysis only. It identifies historical pivot points and projects them forward as potential areas of interest.

Advanced Psychological Levels with Dynamic Spacing═══════════════════════════════════════
ADVANCED PSYCHOLOGICAL LEVELS WITH DYNAMIC SPACING
═══════════════════════════════════════
A comprehensive psychological price level indicator that automatically identifies and displays round number levels across multiple timeframes. Features dynamic ATR-based spacing, smart crypto detection, distance tracking, and customizable alert system.
───────────────────────────────────────
WHAT THIS INDICATOR DOES
───────────────────────────────────────
This indicator automatically draws psychological price levels (round numbers) that often act as support and resistance:
- Dynamic ATR-Based Spacing - Adapts level spacing to market volatility
- Multiple Level Types - Major (250 pip), Standard (100 pip), Mid, and Intraday levels
- Smart Asset Detection - Automatically adjusts for Forex, Crypto, Indices, and CFDs
- Crypto Price Adaptation - Intelligent level spacing based on cryptocurrency price magnitude
- Distance Information Table - Real-time percentage distance to nearest levels
- Combined Level Labels - Clear identification when multiple level types coincide
- Performance Optimized - Configurable visible range and label limits
- Comprehensive Alerts - Notifications when price crosses any level type
───────────────────────────────────────
HOW IT WORKS
───────────────────────────────────────
PSYCHOLOGICAL LEVELS CONCEPT:
Psychological levels are round numbers where traders tend to place orders, creating natural support and resistance zones. These include:
- Forex: 1.0000, 1.0100, 1.0050 (pips)
- Crypto: $100, $1,000, $10,000 (whole numbers)
- Indices: 10,000, 10,500, 11,000 (points)
Why They Matter:
- Traders naturally gravitate to round numbers
- Stop losses cluster at these levels
- Take profit orders concentrate here
- Institutional algorithmic trading often targets these levels
DYNAMIC ATR-BASED SPACING:
Traditional Method:
- Fixed spacing regardless of volatility
- May be too tight in volatile markets
- May be too wide in quiet markets
Dynamic Method (Recommended):
- Uses ATR (Average True Range) to measure volatility
- Automatically adjusts level spacing
- Tighter levels in low volatility
- Wider levels in high volatility
Calculation:
1. Calculate ATR over specified period (default: 14)
2. Multiply by ATR multiplier (default: 2.0)
3. Round to nearest psychological level
4. Generate levels at dynamic intervals
Benefits:
- Adapts to market conditions
- More relevant levels in all volatility regimes
- Reduces clutter in trending markets
- Provides more detail in ranging markets
LEVEL TYPES:
Major Levels (250 pip/point):
- Highest significance
- Primary support/resistance zones
- Color: Red (default)
- Style: Solid lines
- Spacing: 2.5x standard step
Standard Levels (100 pip/point):
- Secondary importance
- Common psychological barriers
- Color: Blue (default)
- Style: Dashed lines
- Spacing: Standard step
Mid Levels (50% between major):
- Optional intermediate levels
- Halfway between major levels
- Color: Gray (default)
- Style: Dotted lines
- Usage: Additional confluence points
Intraday Levels (sub-100 pip):
- For intraday traders
- Fine-grained precision
- Color: Yellow (default)
- Style: Dotted lines
- Only shown on intraday timeframes
SMART ASSET DETECTION:
Forex Pairs:
- Detects major currency pairs automatically
- Uses pip-based calculations
- Standard: 100 pips (0.0100)
- Major: 250 pips (0.0250)
- Intraday: 20, 50, 80 pip subdivisions
Cryptocurrencies:
- Automatic price magnitude detection
- Adaptive spacing based on price:
* Under $0.10: Levels at $0.01, $0.05
* $0.10-$1: Levels at $0.10, $0.50
* $1-$10: Levels at $1, $5
* $10-$100: Levels at $10, $50
* $100-$1,000: Levels at $100, $500
* $1,000-$10,000: Levels at $1,000, $5,000
* Over $10,000: Levels at $5,000, $10,000
Indices & CFDs:
- Fixed point-based system
- Major: 500 point intervals (with 250 sub-levels)
- Standard: 100 point intervals
- Suitable for stock indices like SPX, NASDAQ
COMBINED LEVEL LABELS:
When multiple level types coincide at the same price:
- Single line drawn (highest priority color)
- Combined label shows all types
- Priority: Major > Standard > Mid > Intraday
Example Label Formats:
- "1.1000 Major" - Major level only
- "1.1000 Std + Major" - Both standard and major
- "50000 Intra + Mid + Std" - Three levels coincide
Benefits:
- Cleaner chart appearance
- Clear identification of confluence
- Reduced visual clutter
- Easy to spot high-importance levels
DISTANCE INFORMATION TABLE:
Real-time tracking of nearest levels:
Table Contents:
- Nearest major level above (price and % distance)
- Nearest standard level above (price and % distance)
- Nearest standard level below (price and % distance)
Display:
- Top right corner (configurable)
- Color-coded by level type
- Real-time percentage calculations
- Helpful for position management
Usage:
- Identify proximity to key levels
- Set realistic profit targets
- Gauge potential move magnitude
- Monitor approaching resistance/support
ALERT SYSTEM:
Comprehensive crossing alerts:
Alert Types:
- Major Level Crosses
- Standard Level Crosses
- Intraday Level Crosses
Alert Modes:
- First Cross Only: Alert once when level is crossed
- All Crosses: Alert every time level is crossed
Alert Information:
- Level type crossed
- Specific price level
- Direction (above/below)
- One alert per bar to prevent spam
Configuration:
- Enable/disable by level type
- Choose alert frequency
- Customize for your trading style
───────────────────────────────────────
HOW TO USE
───────────────────────────────────────
INITIAL SETUP:
General Settings:
1. Enable "Use Dynamic ATR-Based Spacing" (recommended)
2. Set ATR Period (14 is standard)
3. Adjust ATR Multiplier (2.0 is balanced)
Visibility Settings:
1. Set Visible Range % (10% recommended for clarity)
2. Adjust Label Offset for readability
3. Configure performance limits if needed
Level Selection:
1. Enable/disable level types based on trading style
2. Adjust line counts for each type
3. Choose line styles and colors for visibility
TRADING STRATEGIES:
Breakout Trading:
1. Wait for price to approach major or standard level
2. Monitor for consolidation near level
3. Enter on confirmed break above/beyond level
4. Stop loss just beyond the broken level
5. Target: Next major or standard level
Rejection Trading:
1. Identify major psychological level
2. Wait for price to test the level
3. Look for rejection signals (wicks, bearish/bullish candles)
4. Enter in direction of rejection
5. Stop beyond the level
6. Target: Previous level or mid-level
Range Trading:
1. Identify range between two major levels
2. Buy at lower psychological level
3. Sell at upper psychological level
4. Use standard and mid-levels for position management
5. Exit if major level breaks with volume
Confluence Trading:
1. Look for combined levels (Std + Major)
2. These represent high-probability zones
3. Use as primary support/resistance
4. Increase position size at confluence
5. Expect stronger reactions at these levels
Session-Based Trading:
1. Note opening level at session start (Asian/London/NY)
2. Trade breakouts of major levels during high-volume sessions
3. London/NY sessions: More likely to break levels
4. Asian session: More likely to respect levels (range trading)
RISK MANAGEMENT WITH PSYCHOLOGICAL LEVELS:
Stop Loss Placement:
- Place stops just beyond psychological levels
- Add buffer (5-10 pips for forex)
- Avoid exact round numbers (stop hunting risk)
- Use previous major level as maximum stop
Take Profit Strategy:
- First target: Next standard level (partial profit)
- Second target: Next major level (remaining position)
- Trail stops to breakeven at first target
- Use distance table to calculate risk/reward
Position Sizing:
- Larger positions at major levels (higher probability)
- Smaller positions at intraday levels (lower probability)
- Scale in at standard levels between major levels
- Reduce size when multiple levels are close together
TIMEFRAME CONSIDERATIONS:
Higher Timeframes (4H, Daily, Weekly):
- Focus on Major and Standard levels only
- Disable Intraday and Mid levels
- Wider level spacing expected
- Use for swing trading and position trading
Lower Timeframes (5m, 15m, 1H):
- Enable all level types
- Use Intraday levels for precision
- Tighter level spacing acceptable
- Good for day trading and scalping
Multi-Timeframe Approach:
- Identify major levels on Daily/4H charts
- Refine entries using 15m/1H intraday levels
- Trade in direction of higher timeframe bias
- Use lower timeframe levels for position management
───────────────────────────────────────
CONFIGURATION GUIDE
───────────────────────────────────────
GENERAL SETTINGS:
Dynamic ATR-Based Spacing:
- Enabled: Recommended for most markets
- Disabled: Fixed psychological levels
- ATR Period: 14 (standard), 10 (responsive), 20 (smooth)
- ATR Multiplier: 1.0-5.0 (2.0 is balanced)
VISIBILITY SETTINGS:
Visible Range %:
- 5%: Very tight range, minimal clutter
- 10%: Balanced view (recommended)
- 20%: Wide range, more context
- 50%: Maximum range, all levels visible
Label Offset:
- 10-20 bars: Close to current price
- 30-50 bars: Moderate distance
- 50-100 bars: Far from price action
Performance Limits:
- Max Historical Bars: Reduce if indicator loads slowly
- Max Labels: Reduce for cleaner chart (20-30 recommended)
LEVEL CUSTOMIZATION:
Line Count:
- Lower (1-3): Cleaner chart, fewer levels
- Medium (4-6): Balanced view
- Higher (7-10): More context, busier chart
Line Styles:
- Solid: High importance, easy to see
- Dashed: Medium importance, clear but subtle
- Dotted: Low importance, minimal visual weight
Colors:
- Use contrasting colors for different level types
- Red/Blue/Yellow default works well
- Adjust based on chart background and personal preference
DISTANCE TABLE:
Position:
- Top Right: Doesn't interfere with price action
- Top Left: Good for right-side price scale
- Bottom positions: Less common but available
Colors:
- Default (white text, dark background) works for most charts
- Match your chart theme for consistency
- Ensure text is readable against background
ALERT CONFIGURATION:
Alert by Level Type:
- Major: Most important, fewer false signals
- Standard: Balance of frequency and importance
- Intraday: Many signals, best for active traders
Alert Frequency:
- First Cross Only: Cleaner, less noise (recommended for swing trading)
- All Crosses: Every touch, good for scalping
Alert Setup in TradingView:
1. Configure desired alert types in indicator settings
2. Right-click chart → Add Alert
3. Select this indicator
4. Choose "Any alert() function call"
5. Set delivery method (mobile, email, webhook)
───────────────────────────────────────
ASSET-SPECIFIC TIPS
───────────────────────────────────────
FOREX (EUR/USD, GBP/USD, etc.):
- Major levels at x.x000, x.x500
- Standard levels at x.xx00
- Intraday levels at 20/50/80 pips
- Most effective during London/NY sessions
- Watch for "figure" levels (1.0000, 1.1000)
CRYPTOCURRENCIES (BTC, ETH, etc.):
- Enable dynamic spacing for volatile markets
- Levels adjust automatically based on price
- Watch major $1,000 increments for BTC
- $100 levels important for ETH
- Smaller caps: Use standard levels
- High volatility: Increase ATR multiplier to 3.0
STOCK INDICES (SPX, NASDAQ, etc.):
- 100-point levels most important
- 500-point levels for major S/R
- 50-point mid-levels for refinement
- Watch end-of-day for level reactions
- Futures often lead spot on level breaks
GOLD/COMMODITIES:
- Major levels at $50 increments ($1,900, $1,950)
- Standard levels at $10 increments
- Very reactive to psychological levels
- Watch for false breaks during low volume
- Best reactions during active trading hours
───────────────────────────────────────
BEST PRACTICES
───────────────────────────────────────
Chart Setup:
- Use clean price action charts
- Avoid too many indicators
- Ensure psychological levels are clearly visible
- Match colors to your chart theme
Level Selection:
- Start with Major and Standard levels only
- Add Mid and Intraday as needed
- Less is more - avoid chart clutter
- Adjust based on timeframe
Combining with Other Tools:
- Volume profile for confluence
- Trendlines intersecting psychological levels
- Moving averages near round numbers
- Fibonacci levels coinciding with psychological levels
Common Mistakes to Avoid:
- Trading every level touch (be selective)
- Ignoring volume confirmation
- Setting stops exactly at levels (stop hunting)
- Forgetting to adjust for different assets
- Over-relying on levels without price action confirmation
Performance Optimization:
- Reduce visible range for faster loading
- Lower max historical bars on lower timeframes
- Limit labels to 30-50 for clarity
- Disable unused level types
───────────────────────────────────────
EDUCATIONAL DISCLAIMER
───────────────────────────────────────
This indicator identifies psychological price levels based on round numbers that tend to act as support and resistance. The methodology includes:
- Round number detection algorithms
- ATR-based dynamic spacing calculations
- Asset-specific level determination
- Distance percentage calculations
Psychological levels are a recognized concept in technical analysis, studied by traders and institutions. However, they do not guarantee price reactions and should be used as part of a comprehensive trading strategy including proper risk management, volume analysis, and price action confirmation.
───────────────────────────────────────
USAGE DISCLAIMER
───────────────────────────────────────
This tool is for educational and analytical purposes. Psychological levels can act as support or resistance but price reactions are not guaranteed. Dynamic spacing may generate different levels in different market conditions. Always conduct independent analysis, use proper risk management, and never risk capital you cannot afford to lose. Past performance does not indicate future results.
───────────────────────────────────────
CREDITS & ATTRIBUTION
───────────────────────────────────────
Original Concept: Sonar Lab

Opening Range Breakout with Multi-Timeframe Liquidity]═══════════════════════════════════════
OPENING RANGE BREAKOUT WITH MULTI-TIMEFRAME LIQUIDITY
═══════════════════════════════════════
A professional Opening Range Breakout (ORB) indicator enhanced with multi-timeframe liquidity detection, trading session visualization, volume analysis, and trend confirmation tools. Designed for intraday trading with comprehensive alert system.
───────────────────────────────────────
WHAT THIS INDICATOR DOES
───────────────────────────────────────
This indicator combines multiple trading concepts:
- Opening Range Breakout (ORB) - Customizable time period detection with automatic high/low identification
- Multi-Timeframe Liquidity - HTF (Higher Timeframe) and LTF (Lower Timeframe) key level detection
- Trading Sessions - Tokyo, London, New York, and Sydney session visualization
- Volume Analysis - Volume spike detection and strength measurement
- Multi-Timeframe Confirmation - Trend bias from higher timeframes
- EMA Integration - Trend filter and dynamic support/resistance
- Smart Alerts - Quality-filtered breakout notifications
───────────────────────────────────────
HOW IT WORKS
───────────────────────────────────────
OPENING RANGE BREAKOUT (ORB):
Concept:
The Opening Range is a period at the start of a trading session where price establishes an initial high and low. Breakouts beyond this range often indicate the direction of the day's trend.
Detection Method:
- Default: 15-minute opening range (configurable)
- Custom Range: Set specific session times with timezone support
- Automatically identifies ORH (Opening Range High) and ORL (Opening Range Low)
- Tracks ORB mid-point for reference
Range Establishment:
1. Session starts (or custom time begins)
2. Tracks highest high and lowest low during the period
3. Range confirmed at end of opening period
4. Levels extend throughout the session
Breakout Detection:
- Bullish Breakout: Close above ORH
- Bearish Breakout: Close below ORL
- Mid-point acts as bias indicator
Visual Display:
- Shaded box during range formation
- Horizontal lines for ORH, ORL, and mid-point
- Labels showing level values
- Color-coded fills based on selected method
Fill Color Methods:
1. Session Comparison:
- Green: Current OR mid > Previous OR mid
- Red: Current OR mid < Previous OR mid
- Gray: Equal or first session
- Shows day-over-day momentum
2. Breakout Direction (Recommended):
- Green: Price currently above ORH (bullish breakout)
- Red: Price currently below ORL (bearish breakout)
- Gray: Price inside range (no breakout)
- Real-time breakout status
MULTI-TIMEFRAME LIQUIDITY:
Two-Tier System for comprehensive level identification:
HTF (Higher Timeframe) Key Liquidity:
- Default: 4H timeframe (configurable to Daily, Weekly)
- Identifies major institutional levels
- Uses pivot detection with adjustable parameters
- Suitable for swing highs/lows where large orders rest
LTF (Lower Timeframe) Key Liquidity:
- Default: 1H timeframe (configurable)
- Provides precision entry/exit levels
- Finer granularity for intraday trading
- Captures minor swing points
Calculation Method:
- Pivot high/low detection algorithm
- Configurable left bars (lookback) and right bars (confirmation)
- Timeframe multiplier for accurate multi-timeframe detection
- Automatic level extension
Mitigation System:
- Tracks when levels are swept (broken)
- Configurable mitigation type: Wick or Close-based
- Option to remove or show mitigated levels
- Display limit prevents chart clutter
Asset-Specific Optimization:
The indicator includes quick reference settings for different assets:
- Major Forex (EUR/USD, GBP/USD): Default settings optimal
- Crypto (BTC/ETH): Left=12, Right=4, Display=7
- Gold: HTF=1D, Left=20
TRADING SESSIONS:
Four Major Sessions with Full Customization:
Tokyo Session:
- Default: 04:00-13:00 UTC+4
- Asian trading hours
- Often sets daily range
London Session:
- Default: 11:00-20:00 UTC+4
- Highest liquidity period
- Major institutional activity
New York Session:
- Default: 16:00-01:00 UTC+4
- US market hours
- High-impact news events
Sydney Session:
- Default: 01:00-10:00 UTC+4
- Earliest Asian activity
- Lower volatility
Session Features:
- Shaded background boxes
- Session name labels
- Optional open/close lines
- Session high/low tracking with colored lines
- Each session has independent color settings
- Fully customizable times and timezones
VOLUME ANALYSIS:
Volume-Based Trade Confirmation:
Volume MA:
- Configurable period (default: 20)
- Establishes average volume baseline
- Used for spike detection
Volume Spike Detection:
- Identifies when volume exceeds MA * multiplier
- Default: 1.5x average volume
- Confirms breakout strength
Volume Strength Measurement:
- Calculates current volume as percentage of average
- Shows relative volume intensity
- Used in alert quality filtering
High Volume Bars:
- Identifies bars above 50th percentile
- Additional confirmation layer
- Indicates institutional participation
MULTI-TIMEFRAME CONFIRMATION:
Trend Bias from Higher Timeframes:
HTF 1 (Trend):
- Default: 1H timeframe
- Uses EMA to determine intermediate trend
- Compares current timeframe EMA to HTF EMA
HTF 2 (Bias):
- Default: 4H timeframe
- Uses 50 EMA for longer-term bias
- Confirms overall market direction
Bias Classifications:
- Bullish Bias: HTF close > HTF 50 EMA AND Current EMA > HTF1 EMA
- Bearish Bias: HTF close < HTF 50 EMA AND Current EMA < HTF1 EMA
- Neutral Bias: Mixed signals between timeframes
EMA Stack Analysis:
- Compares EMA alignment across timeframes
- +1: Bullish stack (lower TF EMA > higher TF EMA)
- -1: Bearish stack (lower TF EMA < higher TF EMA)
- 0: Neutral/crossed
Usage:
- Filters false breakouts
- Confirms trend direction
- Improves trade quality
EMA INTEGRATION:
Dynamic EMA for Trend Reference:
Features:
- Configurable period (default: 20)
- Customizable color and width
- Acts as dynamic support/resistance
- Trend filter for ORB trades
Application:
- Above EMA: Favor long breakouts
- Below EMA: Favor short breakouts
- EMA cross: Potential trend change
- Distance from EMA: Momentum gauge
SMART ALERT SYSTEM:
Quality-Filtered Breakout Notifications:
Alert Types:
1. Standard ORB Breakout
2. High Quality ORB Breakout
Quality Criteria:
- Volume Confirmation: Volume > 1.2x average
- MTF Confirmation: Bias aligned with breakout direction
Standard Alert:
- Basic breakout detection
- Price crosses ORH or ORL
- Icon: 🚀 (bullish) or 🔻 (bearish)
High Quality Alert:
- Both volume AND MTF confirmed
- Stronger probability setup
- Icon: 🚀⭐ (bullish) or 🔻⭐ (bearish)
Alert Information Includes:
- Alert quality rating
- Breakout level and current price
- Volume strength percentage (if enabled)
- MTF bias status (if enabled)
- Recommended action
One Alert Per Bar:
- Prevents alert spam
- Uses flag system to track sent alerts
- Resets on new ORB session
───────────────────────────────────────
HOW TO USE
───────────────────────────────────────
OPENING RANGE SETUP:
Basic Configuration:
1. Select time period for opening range (default: 15 minutes)
2. Choose fill color method (Breakout Direction recommended)
3. Enable historical data display if needed
Custom Range (Advanced):
1. Enable Custom Range toggle
2. Set specific session time (e.g., 0930-0945)
3. Select appropriate timezone
4. Useful for specific market opens (NYSE, LSE, etc.)
LIQUIDITY LEVELS SETUP:
Quick Configuration by Asset:
- Forex: Use default settings (Left=15, Right=5)
- Crypto: Set Left=12, Right=4, Display=7
- Gold: Set HTF=1D, Left=20
HTF Liquidity:
- Purpose: Major support/resistance levels
- Recommended: 4H for day trading, 1D for swing trading
- Use as profit targets or reversal zones
LTF Liquidity:
- Purpose: Entry/exit refinement
- Recommended: 1H for day trading, 4H for swing trading
- Use for position management
Mitigation Settings:
- Wick-based: More sensitive (default)
- Close-based: More conservative
- Remove or Show mitigated levels based on preference
TRADING SESSIONS SETUP:
Enable/Disable Sessions:
- Master toggle for all sessions
- Individual session controls
- Show/hide session names
Session High/Low Lines:
- Enable to see session extremes
- Each session has custom colors
- Useful for range trading
Customization:
- Adjust session times for your broker
- Set timezone to match your location
- Customize colors for visibility
VOLUME ANALYSIS SETUP:
Enable Volume Analysis:
1. Toggle on Volume Analysis
2. Set MA length (20 recommended)
3. Adjust spike multiplier (1.5 typical)
Usage:
- Confirm breakouts with volume
- Identify climactic moves
- Filter false signals
MULTI-TIMEFRAME SETUP:
HTF Selection:
- HTF 1 (Trend): 1H for day trading, 4H for swing
- HTF 2 (Bias): 4H for day trading, 1D for swing
Interpretation:
- Trade only with bias alignment
- Neutral bias: Be cautious
- Bias changes: Potential reversals
EMA SETUP:
Configuration:
- Period: 20 for responsive, 50 for smoother
- Color: Choose contrasting color
- Width: 1-2 for visibility
Usage:
- Filter trades: Long above, Short below
- Dynamic support/resistance reference
- Trend confirmation
ALERT SETUP:
TradingView Alert Creation:
1. Enable alerts in indicator settings
2. Enable ORB Breakout Alerts
3. Right-click chart → Add Alert
4. Select this indicator
5. Choose "Any alert() function call"
6. Configure delivery method (mobile, email, webhook)
Alert Filtering:
- All alerts include quality rating
- High Quality alerts = Volume + MTF confirmed
- Standard alerts = Basic breakout only
───────────────────────────────────────
TRADING STRATEGIES
───────────────────────────────────────
CLASSIC ORB STRATEGY:
Setup:
1. Wait for opening range to complete
2. Price breaks and closes above ORH or below ORL
3. Volume > average (if enabled)
4. MTF bias aligned (if enabled)
Entry:
- Bullish: Buy on break above ORH
- Bearish: Sell on break below ORL
- Consider retest entries for better risk/reward
Stop Loss:
- Bullish: Below ORL or range mid-point
- Bearish: Above ORH or range mid-point
- Adjust based on volatility
Targets:
- Initial: Range width extension (ORH + range width)
- Secondary: HTF liquidity levels
- Final: Session high/low or major support/resistance
ORB + LIQUIDITY CONFLUENCE:
Enhanced Setup:
1. Opening range established
2. HTF liquidity level near or beyond ORH/ORL
3. Breakout occurs with volume
4. Price targets the liquidity level
Entry:
- Enter on ORB breakout
- Target the HTF liquidity level
- Use LTF liquidity for position management
Management:
- Partial profits at ORB + range width
- Move stop to breakeven at LTF liquidity
- Final exit at HTF liquidity sweep
ORB REJECTION STRATEGY (Counter-Trend):
Setup:
1. Price breaks above ORH or below ORL
2. Weak volume (below average)
3. MTF bias opposite to breakout
4. Price closes back inside range
Entry:
- Failed bullish break: Short below ORH
- Failed bearish break: Long above ORL
Stop Loss:
- Beyond the failed breakout level
- Or beyond session extreme
Target:
- Opposite end of opening range
- Range mid-point for partial profit
SESSION-BASED ORB TRADING:
Tokyo Session:
- Typically narrower ranges
- Good for range trading
- Wait for London open breakout
London Session:
- Highest volume and volatility
- Strong ORB setups
- Major liquidity sweeps common
New York Session:
- Strong trending moves
- News-driven volatility
- Good for momentum trades
Sydney Session:
- Quieter conditions
- Suitable for range strategies
- Sets up Tokyo session
EMA-FILTERED ORB:
Rules:
- Only take bullish breaks if price > EMA
- Only take bearish breaks if price < EMA
- Ignore counter-trend breaks
Benefits:
- Reduces false signals
- Aligns with larger trend
- Improves win rate
───────────────────────────────────────
CONFIGURATION GUIDE
───────────────────────────────────────
OPENING RANGE SETTINGS:
Time Period:
- 15 min: Standard for most markets
- 30 min: Wider range, fewer breakouts
- 60 min: For slower markets or swing trades
Custom Range:
- Use for specific market opens
- NYSE: 0930-1000 EST
- LSE: 0800-0830 GMT
- Set timezone to match exchange
Historical Display:
- Enable: See all previous session data
- Disable: Cleaner chart, current session only
LIQUIDITY SETTINGS:
Left Bars (5-30):
- Lower: More frequent, sensitive levels
- Higher: Fewer, more significant levels
- Recommended: 15 for most markets
Right Bars (1-25):
- Confirmation period
- Higher: More reliable, less frequent
- Recommended: 5 for balance
Display Limit (1-20):
- Number of active levels shown
- Higher: More context, busier chart
- Recommended: 7 for clarity
Extension Options:
- Short: Levels visible near formation
- Current: Extended to current bar (recommended)
- Max: Extended indefinitely
VOLUME SETTINGS:
MA Length (5-50):
- Shorter: More responsive to spikes
- Longer: Smoother baseline
- Recommended: 20 for balance
Spike Multiplier (1.0-3.0):
- Lower: More sensitive spike detection
- Higher: Only extreme spikes
- Recommended: 1.5 for day trading
MULTI-TIMEFRAME SETTINGS:
HTF 1 (Trend):
- 5m chart: Use 15m or 1H
- 15m chart: Use 1H or 4H
- 1H chart: Use 4H or 1D
HTF 2 (Bias):
- One level higher than HTF 1
- Provides longer-term context
- Don't use same as HTF 1
EMA SETTINGS:
Length:
- 20: Responsive, more signals
- 50: Smoother, stronger filter
- 200: Long-term trend only
Style:
- Choose contrasting color
- Width 1-2 for visibility
- Match your trading style
───────────────────────────────────────
BEST PRACTICES
───────────────────────────────────────
Chart Timeframe Selection:
- ORB Trading: Use 5m or 15m charts
- Session Review: Use 1H or 4H charts
- Swing Trading: Use 1H or 4H charts
Quality Over Quantity:
- Wait for high-quality alerts (volume + MTF)
- Avoid trading every breakout
- Focus on confluence setups
Risk Management:
- Position size based on range width
- Wider ranges = smaller positions
- Use stop losses always
- Take partial profits at targets
Market Conditions:
- Best results in trending markets
- Reduce position size in choppy conditions
- Consider session overlaps for volatility
- Avoid trading near major news if inexperienced
Continuous Improvement:
- Track win rate by session
- Note which confluence factors work best
- Adjust settings based on market volatility
- Review performance weekly
───────────────────────────────────────
PERFORMANCE OPTIMIZATION
───────────────────────────────────────
This indicator is optimized with:
- max_bars_back declarations for efficient processing
- Conditional calculations based on enabled features
- Proper memory management for drawing objects
- Minimal recalculation on each bar
Best Practices:
- Disable unused features (sessions, MTF, volume)
- Limit historical display to reduce rendering
- Use appropriate timeframe for your strategy
- Clear old drawing objects periodically
───────────────────────────────────────
EDUCATIONAL DISCLAIMER
───────────────────────────────────────
This indicator combines established trading concepts:
- Opening Range Breakout theory (price action)
- Liquidity level detection (pivot analysis)
- Session-based trading (time-of-day patterns)
- Volume analysis (confirmation technique)
- Multi-timeframe analysis (trend alignment)
All calculations use standard technical analysis methods:
- Pivot high/low detection algorithms
- Moving averages for trend and volume
- Session time filtering
- Timeframe security functions
The indicator identifies potential trading setups but does not predict future price movements. Success requires proper application within a complete trading strategy including risk management, position sizing, and market context.
───────────────────────────────────────
USAGE DISCLAIMER
───────────────────────────────────────
This tool is for educational and analytical purposes. Opening Range Breakout trading involves substantial risk. The alert system and quality filters are designed to identify potential setups but do not guarantee profitability. Always conduct independent analysis, use proper risk management, and never risk capital you cannot afford to lose. Past performance does not indicate future results. Trading intraday breakouts requires experience and discipline.
───────────────────────────────────────
CREDITS & ATTRIBUTION
───────────────────────────────────────
ORIGINAL SOURCE:
This indicator builds upon concepts from LuxAlgo's-ORB

ORB Sessions w/ MidlineORB Sessions with Midline – Customizable Opening Range Breakout Indicator
📌 Overview:
This indicator allows traders to visualize Opening Range Breakout (ORB) sessions with customizable high, low, and midline levels. It supports both predefined ORB sessions and user-defined custom sessions. The ORB levels update in real-time and are automatically hidden on higher timeframes.
🔹 Features:
✅ Predefined ORB Sessions – Toggle commonly used ORB periods to match your strategy.
✅ Custom ORB Sessions – Define up to three additional ORB sessions with custom start and end times.
✅ Live ORB Updates – ORB high, low, and midline update dynamically as bars close within the session.
✅ Customizable Colors & Labels – Set unique colors for high, midline, and low levels, and enable/disable price labels.
✅ Smart Timeframe Filtering – ORB lines automatically hide on higher timeframes when they exceed the ORB duration.
✅ Futures Market Adjustments – Automatically shifts ORB session times for NQ, ES, YM, RTY, and M2K to align with market hours.
🛠️ How to Use:
1️⃣ Enable ORB Sessions – Select which predefined sessions you want to track.
2️⃣ Customize Your Own ORBs – Define up to three custom ORB sessions with specific start and end times.
3️⃣ Adjust Visualization – Modify ORB colors and labels for better chart clarity.
4️⃣ Trade ORB Breakouts – Use these key levels to identify potential breakouts, reversals, and trend continuation setups.

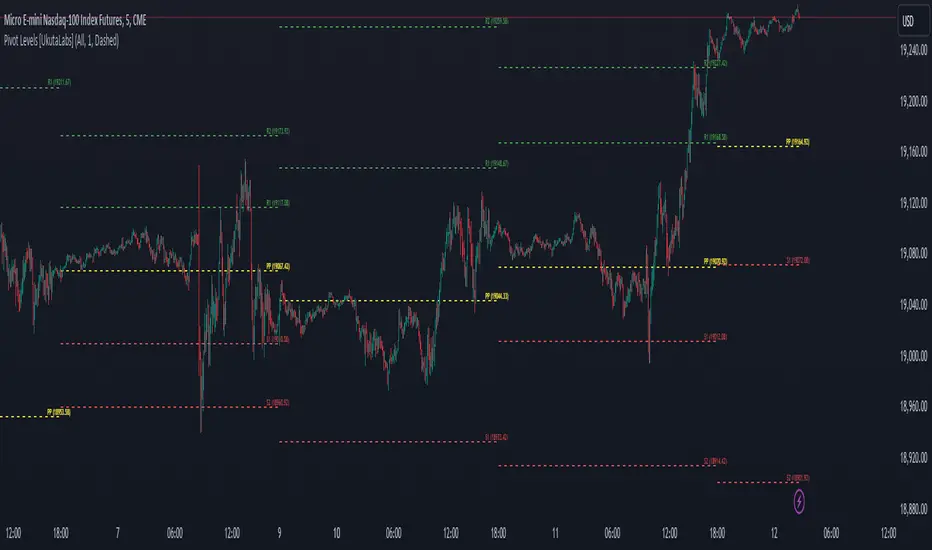
Pivot Levels [UkutaLabs]█ OVERVIEW
The Pivot Levels Indicator provides real-time insight into key price levels within the market that can serve as powerful support and resistance levels. These levels are based on currently-relevant price-action information to ensure that the lines being drawn provide the most value to traders regardless of their trading style.
The aim of this script is to simplify the trading experience of users by automatically identifying and displaying price levels that they should be aware of.
█ USAGE
At the beginning of each trading day, the script will identify the previous day’s hlc3 level. We refer to this level as the day’s Source Level, and it is from this price that the other Resistance and Support levels are calculated.
The script then identifies the total price range of the previous day (Previous Day High - Previous Day Low), then draws Resistance and Support lines based on the Source Level and the previous day’s range.
The script identifies these levels on both sides of the Source. Levels above the Source are considered to be points of Resistance and below the Source are considered to be Support, but the levels are free to be interpreted and used in whatever way fits the user’s trading strategy.
A label is drawn at the end of each line that identifies the line and whether it represents support or resistance. These labels can be disabled in the settings.
█ SETTINGS
Configuration
• Show Labels: Determines whether or not labels are displayed at the end of each line.
• Display Mode: Determines the number of days for the script to load.
Line Settings
• Resistance Color: Determines the color of the resistance lines and labels above the Source Level.
• Source Color: Determines the color of the source line and label.
• Support Color: Determines the color of the support lines and labels below the Source Level.
• Line width: Determines the width of lines.
• Line Style: Determines the style of lines.
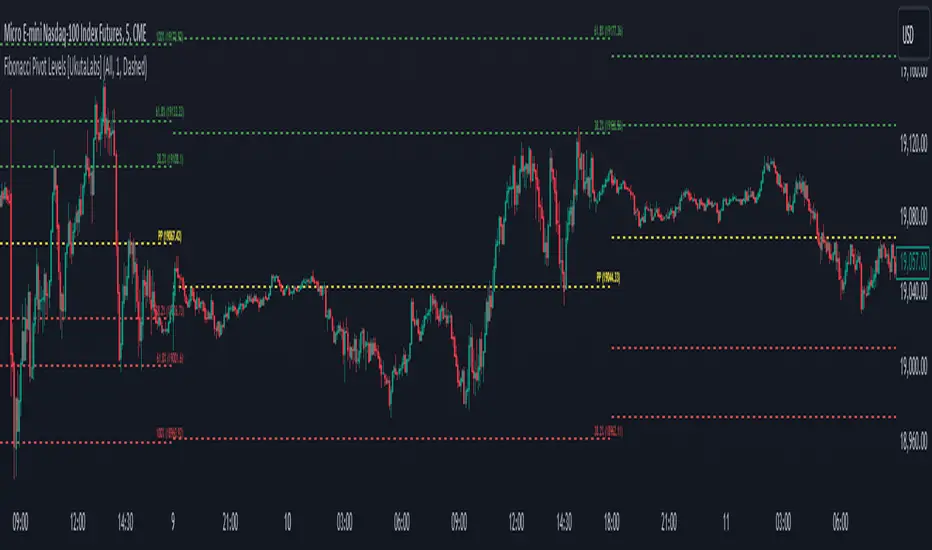
Fibonacci Pivot Levels [UkutaLabs]█ OVERVIEW
The Fibonacci Pivot Levels Indicator provides real-time insight into key price levels within the market that can serve as powerful support and resistance levels. These levels are based on currently-relevant price-action information as well as key Fibonacci ratios to ensure that the lines being drawn provide the most value to traders regardless of their trading style.
The Fibonacci levels are a powerful form of technical analysis that allows traders to predict future potential price support and resistance levels.
The aim of this script is to simplify the trading experience of users by automatically identifying and displaying price levels that they should be aware of.
█ USAGE
At the beginning of each trading day, the script will identify the previous day’s hlc3 level. We refer to this level as the day’s Source Level, and it is from this price that the other Resistance and Support levels are calculated.
The script then identifies the total price range of the previous day (Previous Day High - Previous Day Low), then incrementally draws lines at a distance of the previous day’s range multiplied by key Fibonacci ratios from the Source Level.
The script identifies these levels on both sides of the Source. Levels above the Source are considered to be points of Resistance and below the Source are considered to be Support, but the levels are free to be interpreted and used in whatever way fits the user’s trading strategy.
A label is drawn at the end of each line that displays the Fibonacci ratio that was used to calculate it as well as the price that the line represents. These labels can be disabled in the settings.
█ SETTINGS
Configuration
• Display Mode: Determines how many days the script will draw lines for.
• Show Labels: Determines whether or not labels are drawn at the end of each line.
Line Colors
• Resistance Color: Determines the color of Resistance Lines drawn above the Source.
• Source Color: Determines the color of the Source Line.
• Support Color: Determines the color of Support Lines drawn below the Source.
Line Settings
• Line Width: Determines the width of all lines.
• Line Style: Determines the style of all lines.
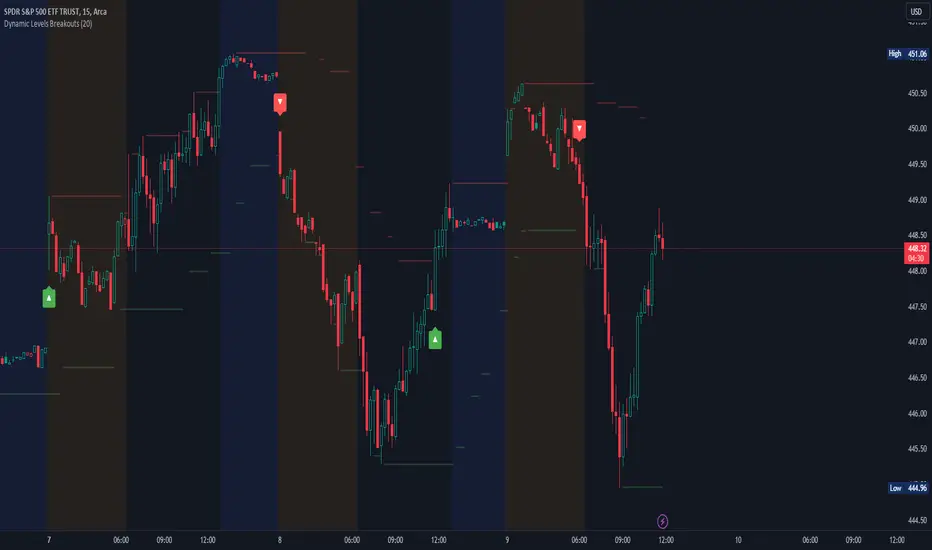
Dynamic Levels Breakouts [Angel Algo]INTRODUCTION
The Dynamic Levels Breakouts indicator is a powerful tool designed to identify dynamic support and resistance levels in the price action. It plots these levels on the chart and provides visual signals for bullish and bearish breakouts.
FEATURES
1. Dynamic Support and Resistance Levels.
The indicator calculates the maximum (resistance) and minimum (support) price levels within the defined rolling window. The highest high and lowest low are used to identify dynamic resistance and support levels, respectively.
2. Coloring Conditions
The indicator uses conditional coloring to highlight potential support and resistance levels. When a significant level is detected, it will be colored with a transparent overlay. Red color indicates potential resistance (max_level), and green color indicates potential support (min_level).
3. Bullish and Bearish Breakouts
The indicator also identifies potential bullish and bearish breakouts from the dynamic levels. A bullish breakout occurs when the closing price crosses above the dynamic resistance level (max_level). A bearish breakout occurs when the closing price crosses below the dynamic support level (min_level). The breakout signals are marked with arrow symbols (▲ for bullish and ▼ for bearish) below and above the respective bars.
4. Market Regime
To prevent multiple signals within a short period, the indicator considers the current market regime. If a bullish breakout has occurred recently, it will not generate a new bullish signal until a bearish breakout occurs, and vice versa.
HOW TO USE
The Dynamic Levels Breakouts indicator can be used to identify potential breakout trading opportunities. A bullish breakout signal (▲) suggests a potential long entry or an increase in buying pressure. A bearish breakout signal (▼) indicates a potential short entry or an increase in selling pressure. Traders can use these signals as a reference and combine them with other technical analysis tools and strategies for confirmation.
SETTINGS
Period (length): The user can adjust the "Period" input to define the rolling window for calculating the maximum and minimum price levels. The default value is 20, but it can be set anywhere between 2 and 30. A higher value may yield more significant levels but can also result in delayed signals
Price Nery, by Pércio FrançaThis indicator plot supports and resistances lines based on the Min and Max of the day before, divided by 25% zones.

S/R-Zones [SouthEast]Autro Support/ Resistance zones, drawn by default on 1 hr timeframe for last 3 months

Kabroda BattleBox Command [Renderer]Kabroda BattleBox Command
This is a specialized visualization utility designed to render pre-calculated institutional price levels on your chart. It is intended for traders who utilize the Kabroda Daily Calibration method to define their intraday execution framework.
How it Works: This script does not calculate levels internally. Instead, it serves as a "renderer" for external data.
Input: The user inputs a comma-separated data string (generated daily via their Kabroda Dashboard calibration) into the settings.
Parsing: The script parses this string to extract 6 key price coordinates: Daily Resistance, Breakout Trigger, Breakdown Trigger, Daily Support, and the 30-minute Opening Range High/Low.
Visualizing: It projects these levels forward in time for the current trading session.
Key Features:
Execution Levels: Plots specific Breakout and Breakdown triggers derived from the opening 30-minute volatility.
Liquidity Sessions: Automatically highlights key global trading hours (London Open, NY AM, NY PM, Tokyo, Sydney) based on New York Time, helping traders visualize volume injection points.
Imbalance Zones (Optional): Identifies and highlights market imbalances created by aggressive buying or selling, which often act as magnets for price re-tests.
Usage Guide:
Step 1: Obtain your daily data string.
Step 2: Open Indicator Settings -> "Daily Calibration".
Step 3: Paste the string into the "Paste Data String" field.
Step 4: The script will instantly render the day's battle map.
Disclaimer: This tool is a visualization aid. It requires valid external data to function. Without the daily input string, the chart will remain blank.

Order Blocks & Breaker BlocksOrder Blocks & Breaker Blocks
Enhance your trading with this advanced indicator that highlights Bullish and Bearish Order Blocks (OBs) and Breaker Blocks on any chart. It is designed to help traders quickly identify key supply and demand zones and potential reversal points with clear visual cues.
Key Features
Automatically highlights Bullish and Bearish OBs.
Detects Breaker Blocks when OB levels are violated, signaling potential trend shifts.
Fully customizable visuals:
Box and Breaker Box transparency
Line transparency, width, and style (Solid, Dashed, Dotted)
Option to calculate OBs using candle body or high/low.
Adjustable number of recent OBs displayed.
Recommended Settings by Timeframe
Timeframe Swing Lookback Show OBs Notes
5 min 10 3 For fast intraday trading and scalping.
15 min 12 3 For intraday trend analysis
1H 15 3 Ideal for intraday support/resistance and breakout detection.
4H 22 3 Captures stronger OBs for swing trades.
Daily 22 3 Highlights major supply and demand zones for trend trading.
Weekly 30 2 Focuses on long-term OBs for strategic analysis.
These values provide a good balance of accuracy and chart clarity across all timeframes.
Why Use This Indicator
Quickly visualize key supply and demand zones.
Identify potential reversals and breakout points.
Improve trade timing and risk management with enhanced visual clarity.
Works across all major timeframes, making it suitable for intraday, swing, and long-term traders.

DAILY AND WEEKLY MID LINESDAILY AND WEEKLY MID LINES INDICATOR
Description:
This indicator calculates and visualizes the dynamic midpoint (mid) of the current day and week in real-time. It provides traders with key reference levels based on developing price action.
Features:
Daily Mid Line:
Color: Orange
Thickness: 3 pixels
Style: Solid line
Updates: Automatically recalculates with each new candle
Calculation: Average of the day's highest high and lowest low from market open
Weekly Mid Line:
Color: Blue
Thickness: 3 pixels
Style: Dashed line
Updates: Continuously recalculates throughout the week
Calculation: Average of the week's highest high and lowest low from week start
How It Works:
At the start of each new trading day (00:00), the daily mid line resets and begins calculating from the first candle
At the start of each new trading week (typically Monday), the weekly mid line resets and begins fresh calculations
Both lines extend automatically to the right as new candles form
The lines are dynamic - they adjust as new highs/lows are made during the day/week
Trading Applications:
Support/Resistance Levels:
The mid lines act as natural equilibrium points where price may find temporary support or resistance
Daily mid can serve as intraday pivot, weekly mid as broader market balance point
Trend Analysis:
Price consistently above mid lines suggests bullish momentum
Price consistently below mid lines suggests bearish momentum
Relationship between daily and weekly mid lines shows multi-timeframe alignment
Entry/Exit Signals:
Price crossing above daily mid may indicate short-term bullish momentum
Price crossing below daily mid may indicate short-term bearish momentum
Weekly mid breaks can signal more significant trend changes
Market Context:
Distance between price and mid lines indicates market extremity
Steeper mid line slopes suggest stronger directional momentum
Flat mid lines suggest range-bound or consolidating markets
Confluence Trading:
Combine with other indicators (RSI, MACD, moving averages) for confirmation
Use as dynamic levels for stop-loss placement or take-profit targets
Best Practices:
More effective on higher timeframes (1H, 4H, Daily) for clearer signals
Works well in trending markets where mid lines act as moving support/resistance
Monitor for price rejection or acceptance at mid levels for trading decisions
Use in conjunction with volume analysis for confirmation
Psychological Significance:
Mid points often represent fair value areas where buyers and sellers find temporary equilibrium, making them natural decision points for market participants.
This indicator is particularly useful for day traders, swing traders, and position traders looking for dynamic, real-time reference points that adapt to current market conditions rather than relying on static historical levels.

Custom Session Static Breakout Levels
This indicator defines a trading session based on user-specified time and a custom GMT timezone. Its primary function is to provide traders with fixed historical data rather than dynamic information.
Core Logic:
Dynamic Box Update: While the price remains within the session, the "Box" (dynamic high/low) tracks the current session's extreme prices.
Static Level Anchoring: The moment price breaks above the session's high or below its low, the Box updates, and a static horizontal price line is immediately drawn at the previous, unbroken extreme (the historical support/resistance of the Box).
Breakout Identification: The candle responsible for the breakout is clearly marked, providing traders with an anchor point for fixed, structural analysis.

@DARKPOOL Magnet - MEMEDescription:
The @DARKPOOL Magnet indicator identifies and displays significant price levels where institutional buying and selling activity has created persistent support and resistance zones. The indicator focuses on three primary types of institutional footprints:
Pin Zone Detection: Identifies price levels where multiple pin bars (high volume, narrow range candles) have clustered within a specified tolerance, indicating repeated institutional defense of those levels.
Whale Footprint Detection: Detects absorption events where significant volume occurs with minimal net price movement, suggesting large institutional orders being filled without allowing substantial directional movement.
Dark Pool Detection: Identifies potential dark pool prints characterized by unexplained price gaps that occur without visible tape activity, indicating off-exchange institutional transactions.
The indicator draws horizontal lines at these identified institutional price levels and highlights areas where multiple detection methods converge, creating confluence zones that represent higher probability support and resistance levels.
Confluence lines are displayed when multiple independently identified institutional levels occur within a user-specified proximity, providing visual emphasis on price levels with the strongest institutional interest.

Daily AVWAPsDaily AVWAPs is designed for intraday and swing traders who track institutional volume benchmarks. Instead of a single "rolling" line that resets continuously, this indicator identifies the starting timestamp of the last 5 trading sessions and draws five distinct Anchored VWAPs from those exact moments.
This allows traders to see exactly where the average volume-weighted price stands for the current day (1D), yesterday (2D), and the three days prior (3D, 4D, 5D) simultaneously.
Key Features
Polyline Visualization: Unlike standard indicators that plot historical values for every bar (creating a messy "sawtooth" effect), this script uses Pine Script Polylines. It draws clean, static lines starting from the specific anchor point to the present price, mimicking the manual "Anchored VWAP" drawing tool.
Dynamic Session Detection: The script contains zero hardcoded dates. It automatically detects when a new trading day begins based on the chart data. It works seamlessly across all asset classes (Stocks, Crypto, Futures) and automatically adjusts for weekends, holidays, and irregular trading weeks without manual updates.
Unified Color Control: Input colors are synchronized. Changing a color in the settings menu updates both the chart line and the price scale label instantly.
Toggle Controls: Individual checkboxes allow you to toggle any specific VWAP (1D through 5D) on or off to keep your chart clean.
How to Use
Trend Strength: When the 1D, 2D, and 3D VWAPs are "fanning out" in alignment, the trend is strong.
Mean Reversion: In a sideways market, price often gravitates back to the 5-Day VWAP as a "value area."
Support & Resistance: Watch for price to respect the VWAP of a previous high-volume day (e.g., bouncing off the 3D VWAP during a pullback).
Settings
Source: Select the price data source (default is OHLC4) .
Colors & Toggles: Use the checkboxes to enable/disable specific lines. Customize the color for each specific day's AVWAP directly in the Inputs tab.
This indicator was adapted and repurposed from the original work by The_Last_Gentleman .
Technical Note: This indicator is optimized for intraday timeframes (1m, 5m, 15m, 1H). Because it uses polyline and array logic to scan specific session timestamps, it calculates exclusively on the most recent bar to maintain high performance.

Automated Intraday Key LevelsThis indicator is designed for day traders who focus on price action and key support/resistance levels. It automates the morning routine of marking up charts by instantly plotting critical levels from the Previous Day, the Premarket Session, and the Current Live Session.
Instead of manually drawing lines every morning, this script dynamically calculates and anchors these levels to the market open, extending them across the trading day for a clean, professional workspace.
Key Features
1. Previous Day Context (Static - White Lines) Before the market opens, it is crucial to know where price closed and traded yesterday.
Prev High & Low: Major support/resistance boundaries.
Prev Close: A magnetic level often used for "Gap Fill" strategies.
Prev Open: Provides context on yesterday's directional sentiment.
2. Premarket Session (Static - Orange Lines) The script fetches data from the Extended Trading Hours session (04:00 – 09:30 EST) to identify the overnight range.
PM High & Low: A breakout above the PM High or breakdown below the PM Low often signals the start of a trend day.
PM Midpoint (Dashed): Represents the overnight equilibrium. Staying above this level indicates early bullish strength.
3. Current Day Stats (Dynamic - Blue Lines) Once the Regular Trading Hours (RTH) begin, the script tracks live price action.
Day High (HOD) & Low (LOD): These lines update in real-time as price pushes new extremes. They are thicker to denote their importance as immediate liquidity zones.
Day Midpoint (Dashed): Calculated as (High + Low) / 2. This is a dynamic trend filter; price holding above the daily midpoint suggests buyers are in control, while trading below suggests seller dominance.
Visual Guide
To keep the chart clean and readable, the levels are color-coded:
🟦 Solid Blue (Width 2): Current Day High / Low (The most active levels).
🟦 Dashed Blue: Current Day Midpoint (50% Retracement level).
🟧 Solid Orange: Premarket High / Low.
🟧 Dashed Orange: Premarket Midpoint.
⬜ Solid White: Previous Day Open, High, Low, Close.
All lines are anchored to the 09:30 EST start time to keep the pre-market area of your chart uncluttered.

RBD Market ProfileA Market Profile visually shows how much time (or how many bars) price spent at each price level within a session — helping identify areas of “fair value” (where price spent most time) and extremes (where price barely traded).
It divides each trading session (for example, a day, week, or month depending on input) into price segments, counts how many bars closed within each segment, and then identifies:
POC (Point of Control): price level with the highest frequency (most traded or visited).
VAH (Value Area High): upper boundary of the zone that contains 70% (or user-defined percentage) of all activity around the POC.
VAL (Value Area Low): lower boundary of that same 70% activity zone.
Finally, it plots lines for:
VAH (green line)
VAL (red line)
POC Upper & Lower (white lines)
Session Open (blue dashed line)
How to use this Market Profile:
Determine Key Areas of Support/Resistance by the VAH and VAL
VAH: Responsive Sellers and Initiative Buyers
VAL: Responsive Buyers and Initiative Sellers
POC: Can be used as Fair Value

Previous Day OHLCDescription :
This script automatically draws the previous day’s Open, High, Low, and Close levels on each trading day. Traders widely use these reference levels to identify key support and resistance zones, potential breakout areas, and intraday bias.
The levels update daily and remain visible throughout the trading session to quickly identify price interactions with yesterday’s important zones.
Features :
Plots the previous day’s Open, High, Low, and Close.
Levels extend across the full trading day for easy reference.
Useful for intraday and swing traders tracking price reactions at historical levels.

Today's 5min HH/LL LinesOverview
This indicator identifies the highest high (HH) and lowest low (LL) formed by the first 5 one-minute candles of the current trading day. Once calculated, it plots continuous horizontal lines at those price levels for the remainder of the day.
How it works
The script internally requests 1-minute data for the current symbol, regardless of your chart’s timeframe.
At the start of each new trading day, it resets counters.
It captures the highest high and lowest low across the first five completed 1-minute candles.
After the 5th one-minute bar closes, it draws:
A green horizontal line at the highest high.
A red horizontal line at the lowest low.
These lines extend to the right, covering the entire trading session, and automatically scale with zoom/pan.
At the next session, the old lines are deleted and recalculated for the new day.
Use cases
Helps spot early intraday support and resistance zones.
Useful for breakout or reversal strategies that monitor when price breaches the first 5-minute range (derived from 5x1m bars).
Can be combined with volume, momentum, or candlestick signals for high-probability entries.
Key features
Works on any timeframe — always uses 1-minute data for precision.
Shows lines only for the current day (no clutter from prior sessions).
Lines are dynamic and adaptive — they remain fixed at the calculated price but extend continuously across the chart.
