Options Series - Dynamic Support & Resistance
🌟 Key Features & How It Works:
⭐ Dynamic Support and Resistance Management:
The script dynamically calculates and draws support and resistance lines based on pivot highs and pivot lows. Unlike static levels that remain unchanged, these lines are updated in real-time. When a support or resistance level is breached, the corresponding line is automatically deleted, keeping the chart clean and relevant. This feature ensures that the trader is always looking at valid support and resistance levels based on the current price action.
⭐ Use of Arrays for Line Management:
The script utilizes arrays to store and manage support and resistance lines (array.new_line(0)). This is a more advanced feature of Pine Script v5, allowing for efficient handling of multiple lines on the chart. By using arrays, the script can easily track and manipulate multiple lines (adding, removing, updating), ensuring that the chart remains optimized for real-time analysis.
⭐ Customizable Inputs for Flexibility:
The script includes user inputs for the pivot length and the line width, making it adaptable to different trading styles and preferences. The pivot length determines how sensitive the indicator is to price changes, while the line width allows traders to customize the visual representation of support and resistance levels. These inputs add flexibility and make the script accessible to a broad range of traders.
⭐ Efficient Breach Detection Mechanism:
The isBreached function is a key part of the script. It checks whether the current price has breached any of the existing support or resistance levels. If a breach is detected (i.e., the price crosses below a support or above a resistance), the respective line is deleted, ensuring that only active and valid lines remain on the chart. This automatic update feature reduces the need for manual intervention, helping traders stay focused on key price levels.
⭐ Visual Clarity and Chart Cleanliness:
By deleting breached lines, the script ensures that the chart does not become cluttered with outdated or irrelevant lines. This visual clarity is crucial for traders who rely on clean, simple charts for decision-making. Removing unnecessary information helps traders make faster, more confident decisions based on the current market structure.
⭐ Scalability for Multiple Timeframes:
The use of pivot points makes the script adaptable to different timeframes, from intraday scalping to longer-term swing trading. By changing the pivot length, traders can optimize the indicator for different market environments, ensuring that it can be applied across various asset classes and timeframes.
⭐ Practical for Range-bound and Breakout Trading:
This script is particularly effective for traders who focus on range-bound markets or breakout strategies. It allows them to quickly identify areas where price is likely to reverse (support/resistance) or break out (when support/resistance is breached), providing real-time insight into market dynamics.
⭐ Simplification of Price Action Analysis:
By automating the calculation of pivots and management of support/resistance levels, the script simplifies price action analysis. Traders no longer need to manually draw or monitor these levels, which is a common task in technical analysis. This provides an edge, as it reduces the time spent on chart preparation and helps focus on executing trades.
⭐ Originality:
The script "Options Series - Pivot Based Support & Resistance" is an original approach to generating support and resistance levels using pivot points. Pivot-based techniques are popular, but the script introduces an automated dynamic way of drawing support and resistance lines, tracking breaches, and deleting lines when they are no longer valid. This aspect adds a refreshing layer of interactivity and functionality that sets it apart from basic pivot point scripts. The use of arrays to store and manage multiple support and resistance lines is also a good application of Pine Script’s newer array functionalities.
⭐ Uniqueness of the Script:
The script stands out due to its dynamic management of support and resistance lines. Unlike traditional scripts that simply plot static pivot points, this one evolves with the market by removing broken levels, ensuring only valid support and resistance lines are visible on the chart. This is particularly useful for traders who focus on clean charting. The use of arrays to store and manage the lines, alongside the efficient deletion of lines when breached, demonstrates a solid understanding of Pine Script v5's advanced features, such as array manipulation.
🚀 Conclusion:
This script stands out for its real-time adaptability, dynamic support/resistance management, and efficient use of Pine Script’s advanced features. It a powerful tool for both novice and advanced traders.
The script is an indicator designed to draw support and resistance levels based on pivot highs and lows, dynamically removing lines when they are breached. If a price crosses a support or resistance level, the respective line is deleted, ensuring the chart reflects the current state of support and resistance accurately.
Cerca negli script per "support"

Support Resistance ImportanceThe Support Resistance Importance indicator is designed to highlight key price levels based on the relationship between fractal occurrences and volume distribution within a given price range. By dividing the range into bins, the indicator calculates the total volume traded at each fractal level and normalizes the values for easy visualization. The normalized values represent an "importance score" for each price range, helping traders identify critical support and resistance levels where price action might react.
Key Features:
Fractal Detection:
The indicator detects Williams Fractals, which are specific price patterns representing potential market reversals. It identifies both upward fractals (potential resistance) and downward fractals (potential support).
Price Range Binning:
The price range is divided into a user-defined number of bins (default is 20). Each bin represents a segment of the total price range, allowing the indicator to bucket price action and track fractal volumes in each bin.
Volume-Based Importance Calculation:
For each bin, the indicator sums up the volume traded at the time a fractal occurred. The volumes are then normalized to reflect their relative importance.
The importance score is calculated as the relative volume in each bin, representing the potential influence of that price range. Higher scores indicate stronger support or resistance levels.
Normalization:
The volume data is normalized to allow for better comparison across bins. This normalization ensures that the highest and lowest volumes are scaled between 0 and 1 for visualization purposes. The smallest volume value is used to scale the rest, ensuring meaningful comparisons.
Visualization:
The indicator provides a table-based visualization showing the price range and the corresponding importance score for each bin.
Each bin is color-coded based on the normalized importance score, with blue or greenish shades indicating higher importance levels. The current price range is highlighted to help traders quickly identify relevant areas of interest.
Trading Utility:
Traders can use the importance scores to identify price levels where significant volume has accumulated at fractals. A higher importance score suggests a stronger likelihood of the price reacting to that level.
If a price moves towards a bin with a high score and the bins above it have much smaller values, it suggests that the price may "pump" up to the next high-scored range, similar to how price drops can occur.
Example Use Case:
Suppose the price approaches a bin with an importance score of 25, and the bins above have much smaller values. This suggests that price may break higher towards the next significant level of resistance, offering traders an opportunity to capitalize on the move by entering long positions or adjusting their stop losses.
This indicator is particularly useful for support and resistance trading, where understanding key levels of price action and volume can improve decision-making in anticipating market reactions.

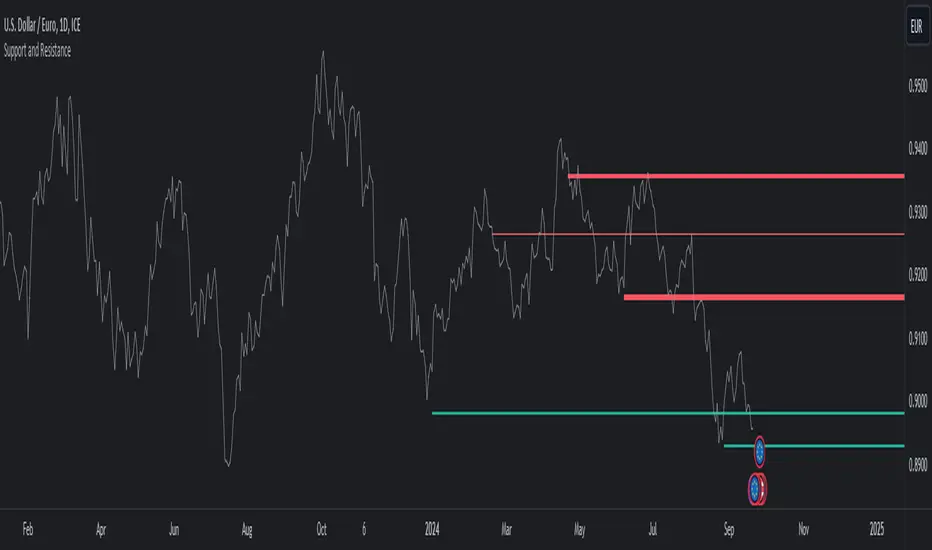
Support and ResistanceThis indicator, titled "Support and Resistance," is designed to identify and display key price levels based on volume and pivot points. It's a versatile tool that can be adapted for different market views and timeframes.
Key Features
Market View Options
The indicator offers three market view settings:
Short term
Standard
Long term
These settings affect the lookback periods used in calculations, allowing users to adjust the indicator's sensitivity to market movements.
Volume-Based Levels
The indicator calculates support and resistance levels using a rolling Point of Control (POC) derived from volume data. This approach helps identify price levels where the most trading activity has occurred.
Pivot Points
In addition to volume-based levels, the indicator incorporates pivot points to identify potential support and resistance areas.
Customizable Appearance
Users can adjust:
Number of lines to display (1-8)
Colors for support and resistance levels
Line thickness based on level importance
Calculation Methods
Rolling POC
The indicator uses a custom function f_rolling_poc to calculate the rolling Point of Control. This function analyzes volume distribution across price levels within a specified lookback period.
Pivot Points
Both standard and quick pivot points are calculated using the rolling POC as input, rather than traditional price data.
Level Importance
The indicator assigns importance to each level based on:
Number of touches (how often price has interacted with the level)
Duration (how long the level has been relevant)
This importance score determines the thickness of the displayed lines.
Unique Aspects
Dynamic Line Thickness: Lines become thicker when levels overlap, highlighting potentially stronger support/resistance areas.
Adaptive Coloring: The color of each line changes dynamically based on whether the current price is above or below the level, indicating whether it's acting as support or resistance.
Flexible Time Frames: The market view options allow the indicator to be easily adapted for different trading styles and timeframes.
Potential Uses
This indicator could be valuable for:
Identifying key price levels for entry and exit points
Recognizing potential breakout or breakdown levels
Understanding the strength of support and resistance based on line thickness
Adapting analysis to different market conditions and timeframes
Overall, this "Support and Resistance" indicator offers a sophisticated approach to identifying key price levels, combining volume analysis with pivot points and providing visual cues for level importance and current market position.
This Support and Resistance indicator is provided for informational and educational purposes only. It should not be considered as financial advice or a recommendation to buy or sell any security. The indicator's calculations are based on historical data and may not accurately predict future market movements. Trading decisions should be made after thorough research and consultation with a licensed financial advisor. The creator of this indicator is not responsible for any losses incurred from its use. Past performance does not guarantee future results. Use at your own risk.
Support Resistance DynamicsThe Support Resistance Dynamics indicator is an advanced technical analysis tool designed to identify and visualize key support and resistance levels in real-time. This innovative indicator stands out from traditional support and resistance tools by employing a dynamic approach that adapts to market conditions.
Key Features:
Dynamic Level Calculation: Unlike static support and resistance indicators, this tool continuously updates levels based on recent price action, providing traders with the most relevant and up-to-date information.
Logarithmic Scale Option: The indicator offers a unique logarithmic scale feature, essential for analyzing long-term trends or assets with significant price changes. This allows for more accurate level plotting across various timeframes and price ranges.
Customizable Display: Users can adjust the number of support and resistance lines displayed, allowing for a clean and uncluttered chart view while focusing on the most significant levels.
Adaptive Slope Calculation: The indicator uses an innovative approach to calculate the slope of support and resistance lines, offering options from dynamic adaptation to fixed long-term periods. This ensures the lines remain relevant in both trending and ranging markets.
Enhanced Visualization: With customizable line colors, styles, and transparency, traders can easily distinguish between support and resistance levels, improving chart readability and analysis.
Flexible Period Settings: From dynamic calculations based on recent pivots to fixed long-term periods, the indicator adapts to various trading styles and timeframes.
The Support Resistance Dynamics indicator is particularly useful for:
Identifying potential reversal points in trends
Setting more accurate entry and exit points for trades
Placing stop-loss orders with greater precision
Recognizing breakout levels for potential new trends
By combining dynamic calculation methods with customizable visual elements, this indicator provides traders with a powerful tool for market analysis. Whether you're a day trader looking for short-term opportunities or a long-term investor analyzing macro trends, the Support Resistance Dynamics indicator offers valuable insights to enhance your trading strategy.
This indicator is provided for informational and educational purposes only. It should not be considered as financial advice or a recommendation to buy or sell any financial instrument. Past performance is not indicative of future results. Trading involves significant risk of loss. Users should conduct their own research and due diligence before making any investment decisions. The creator of this indicator is not responsible for any losses incurred from its use. Always test thoroughly on demo accounts before applying to live trading.

Support Resistance UltimateThe "Support Resistance ULTIMATE" indicator is a comprehensive tool for traders on the TradingView platform, designed to identify key support and resistance levels using two primary techniques: pivot points and volume data. This indicator provides flexibility and customization, allowing traders to adapt it to their specific trading strategies.
KEY FEATURES
Pivot-Based Levels:
This feature calculates support and resistance levels using pivot points, which are derived from the high, low, and close prices of previous trading periods. Pivot points are crucial for forecasting potential market turning points.
Users can customize the pivot calculation by selecting the source type (either 'Close' or 'High/Low') and adjusting the lookback periods for both the left and right sides of the pivot calculation. This flexibility allows traders to adapt the indicator to different market conditions and timeframes.
Volume-Based Levels:
This option focuses on identifying support and resistance levels based on volume data, specifically the Point of Control (POC). The POC represents the price level with the highest traded volume during a specific time period, reflecting a consensus value among market participants.
The indicator includes a rolling POC calculation, allowing traders to dynamically assess areas of significant trading interest that may serve as support or resistance zones.
ADVANTAGES
Customization and Flexibility:
Traders can choose between pivot-based and volume-based levels or use both simultaneously, depending on their analysis needs. This dual approach provides a comprehensive view of market dynamics, accommodating various trading styles.
The indicator offers customizable color settings for support and resistance lines, enhancing chart readability and allowing traders to personalize their visual analysis.
Enhanced Market Insights:
By utilizing pivot points, traders can identify potential reversal or consolidation points, aiding in the prediction of market trends and the establishment of strategic entry and exit points.
Volume-based levels provide insights into market sentiment and participation, highlighting areas of strong support or resistance based on trading volume. This can improve risk management and trade execution by identifying high-probability trading zones.
Importance Scoring:
The indicator calculates the importance of each level based on the number of touches and the duration it holds. This scoring system helps traders assess the strength of support and resistance levels, with thicker lines indicating more significant levels.
This indicator is intended for educational and informational purposes only and should not be considered financial advice. Trading involves significant risk, and you should consult with a financial advisor before making any trading decisions. The performance of this indicator is not guaranteed, and past results do not predict future performance. Use at your own risk.

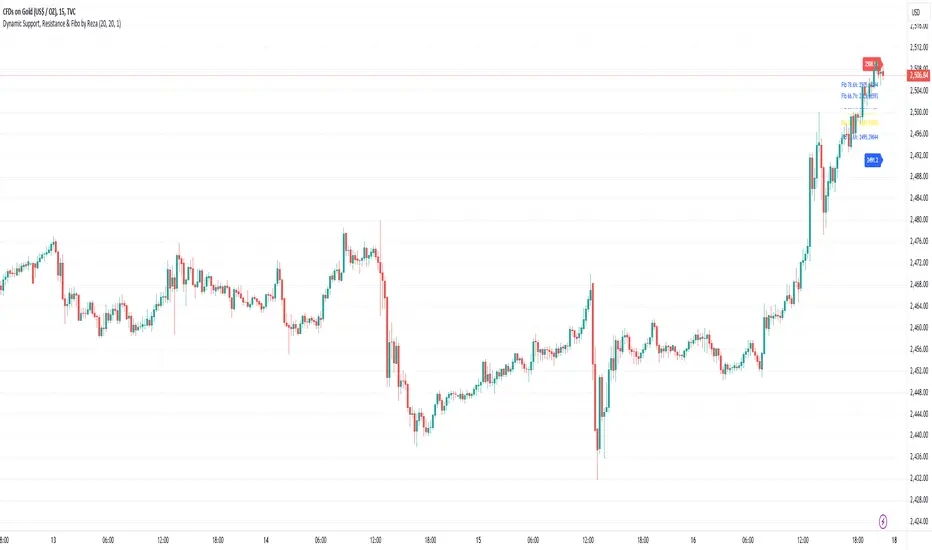
Dynamic Support, Resistance & Fibo by RezaDynamic Support, Resistance & Fibonacci Levels by Reza
This Pine Script indicator dynamically calculates and plots significant support and resistance levels, along with key Fibonacci retracement levels, based on recent price action. It provides traders with essential tools to identify crucial levels on the chart that may influence future price movements.
Key Features:
Dynamic Support and Resistance Lines:
The script identifies recent swing highs and swing lows within a customizable lookback period to determine dynamic support and resistance levels.
These levels are plotted as horizontal lines (blue for support, red for resistance) and are updated in real-time to reflect changes in the price structure.
Labels next to each line display the exact price level of the support and resistance, making it easy to identify them at a glance.
Fibonacci Retracement Levels:
The script calculates and plots Fibonacci retracement levels (23.6%, 38.2%, 50.0%, 55.9%, 61.8%, 66.7%, and 78.6%) between the identified support and resistance levels.
These Fibonacci levels are plotted as dotted lines, with customizable colors and labels for clarity.
The Fibonacci levels provide traders with potential retracement and extension levels, which are commonly used to predict price reversals, pullbacks, and continuation zones.
Customization:
Users can adjust the lookback period for swing high and swing low calculations to suit different trading styles and market conditions.
The script allows traders to enable or disable Fibonacci levels and choose whether or not to remove the background color of the labels for cleaner chart visuals.
Line width, highlight colors, and label colors are fully customizable for better integration with various chart styles and themes.
Real-Time Dashboard:
The indicator includes a real-time dashboard that calculates and displays the next potential target based on current market conditions, including potential retracement or continuation targets.
The dashboard dynamically updates based on trend direction and Fibonacci zones, giving traders valuable insights into potential price objectives.
How to Use:
This indicator is suitable for multiple timeframes, helping traders identify key levels in real-time as the market evolves.
By providing support and resistance zones along with Fibonacci retracement levels, this script offers a powerful combination of technical analysis tools for both novice and experienced traders.
The dynamic calculations help traders spot potential areas for entering or exiting trades, placing stop-loss levels, and identifying profit-taking zones.
Ideal for:
Traders who want to use support and resistance levels for trade planning.
Fibonacci enthusiasts looking for automated level plotting.
Anyone seeking to identify key price levels in real-time across different timeframes.
Script Author:
Reza – Bringing you dynamic, real-time support, resistance, and Fibonacci level plotting for more effective trading decisions.
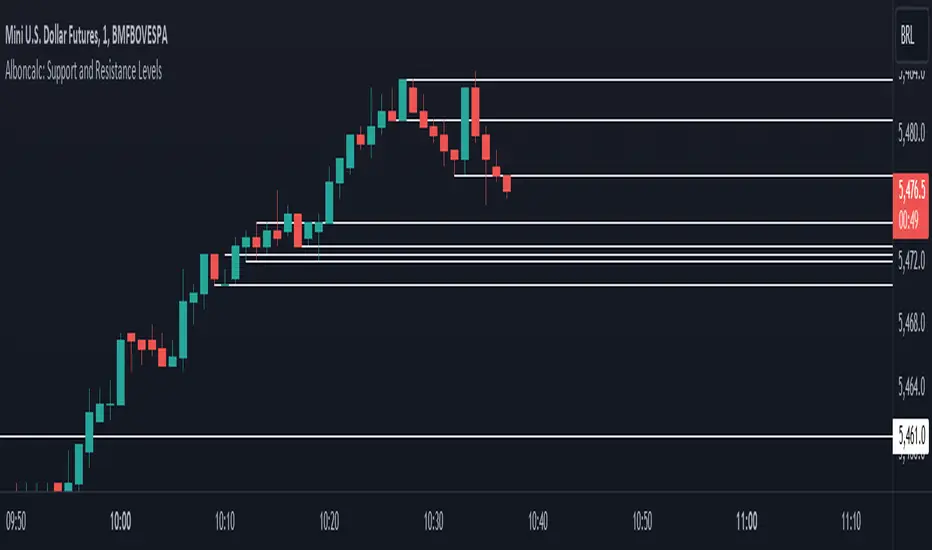
Alboncalc: Support and Resistance LevelsAlboncalc: Support and Resistance Levels
Description:
Alboncalc is an innovative TradingView indicator that identifies significant support and resistance levels based on patterns where two candles form equal highs and/or lows. This indicator automatically plots these critical levels on the chart, providing traders with clear visual cues of potential price reversal or consolidation points.
Originality and Usefulness:
Alboncalc stands out for its ability to detect specific candle patterns that indicate support and resistance, setting it apart from traditional support and resistance indicators. This specific method of price action analysis offers a unique and refined perspective for traders, adding value to the body of knowledge within the TradingView community.
How It Works:
Alboncalc analyzes historical prices to identify where two consecutive candles achieve equal highs or lows. When these conditions are met, the indicator automatically plots a support or resistance line on the chart. These levels are dynamically updated, ensuring that traders always have the most relevant and accurate information.
How to Use:
Installation: Add Alboncalc to your chart on TradingView.
Interpretation: Observe the plotted support and resistance lines. These lines indicate potential reversal or consolidation points.
Application: Use these levels to confirm breakout points or identify areas of price exhaustion. The clear visualization of technical levels helps enhance your trading strategies.
Underlying Concepts:
Alboncalc is based on price action analysis, focusing on specific candle patterns that signal important technical levels. The formation of two candles with equal highs or lows indicates a temporary balance between buyers and sellers, suggesting potential price direction changes.
Support & Resistance AI (K means/median) [ThinkLogicAI]█ OVERVIEW
K-means is a clustering algorithm commonly used in machine learning to group data points into distinct clusters based on their similarities. While K-means is not typically used directly for identifying support and resistance levels in financial markets, it can serve as a tool in a broader analysis approach.
Support and resistance levels are price levels in financial markets where the price tends to react or reverse. Support is a level where the price tends to stop falling and might start to rise, while resistance is a level where the price tends to stop rising and might start to fall. Traders and analysts often look for these levels as they can provide insights into potential price movements and trading opportunities.
█ BACKGROUND
The K-means algorithm has been around since the late 1950s, making it more than six decades old. The algorithm was introduced by Stuart Lloyd in his 1957 research paper "Least squares quantization in PCM" for telecommunications applications. However, it wasn't widely known or recognized until James MacQueen's 1967 paper "Some Methods for Classification and Analysis of Multivariate Observations," where he formalized the algorithm and referred to it as the "K-means" clustering method.
So, while K-means has been around for a considerable amount of time, it continues to be a widely used and influential algorithm in the fields of machine learning, data analysis, and pattern recognition due to its simplicity and effectiveness in clustering tasks.
█ COMPARE AND CONTRAST SUPPORT AND RESISTANCE METHODS
1) K-means Approach:
Cluster Formation: After applying the K-means algorithm to historical price change data and visualizing the resulting clusters, traders can identify distinct regions on the price chart where clusters are formed. Each cluster represents a group of similar price change patterns.
Cluster Analysis: Analyze the clusters to identify areas where clusters tend to form. These areas might correspond to regions of price behavior that repeat over time and could be indicative of support and resistance levels.
Potential Support and Resistance Levels: Based on the identified areas of cluster formation, traders can consider these regions as potential support and resistance levels. A cluster forming at a specific price level could suggest that this level has been historically significant, causing similar price behavior in the past.
Cluster Standard Deviation: In addition to looking at the means (centroids) of the clusters, traders can also calculate the standard deviation of price changes within each cluster. Standard deviation is a measure of the dispersion or volatility of data points around the mean. A higher standard deviation indicates greater price volatility within a cluster.
Low Standard Deviation: If a cluster has a low standard deviation, it suggests that prices within that cluster are relatively stable and less likely to exhibit sudden and large price movements. Traders might consider placing tighter stop-loss orders for trades within these clusters.
High Standard Deviation: Conversely, if a cluster has a high standard deviation, it indicates greater price volatility within that cluster. Traders might opt for wider stop-loss orders to allow for potential price fluctuations without getting stopped out prematurely.
Cluster Density: Each data point is assigned to a cluster so a cluster that is more dense will act more like gravity and
2) Traditional Approach:
Trendlines: Draw trendlines connecting significant highs or lows on a price chart to identify potential support and resistance levels.
Chart Patterns: Identify chart patterns like double tops, double bottoms, head and shoulders, and triangles that often indicate potential reversal points.
Moving Averages: Use moving averages to identify levels where the price might find support or resistance based on the average price over a specific period.
Psychological Levels: Identify round numbers or levels that traders often pay attention to, which can act as support and resistance.
Previous Highs and Lows: Identify significant previous price highs and lows that might act as support or resistance.
The key difference lies in the approach and the foundation of these methods. Traditional methods are based on well-established principles of technical analysis and market psychology, while the K-means approach involves clustering price behavior without necessarily incorporating market sentiment or specific price patterns.
It's important to note that while the K-means approach might provide an interesting way to analyze price data, it should be used cautiously and in conjunction with other traditional methods. Financial markets are influenced by a wide range of factors beyond just price behavior, and the effectiveness of any method for identifying support and resistance levels should be thoroughly tested and validated. Additionally, developments in trading strategies and analysis techniques could have occurred since my last update.
█ K MEANS ALGORITHM
The algorithm for K means is as follows:
Initialize cluster centers
assign data to clusters based on minimum distance
calculate cluster center by taking the average or median of the clusters
repeat steps 1-3 until cluster centers stop moving
█ LIMITATIONS OF K MEANS
There are 3 main limitations of this algorithm:
Sensitive to Initializations: K-means is sensitive to the initial placement of centroids. Different initializations can lead to different cluster assignments and final results.
Assumption of Equal Sizes and Variances: K-means assumes that clusters have roughly equal sizes and spherical shapes. This may not hold true for all types of data. It can struggle with identifying clusters with uneven densities, sizes, or shapes.
Impact of Outliers: K-means is sensitive to outliers, as a single outlier can significantly affect the position of cluster centroids. Outliers can lead to the creation of spurious clusters or distortion of the true cluster structure.
█ LIMITATIONS IN APPLICATION OF K MEANS IN TRADING
Trading data often exhibits characteristics that can pose challenges when applying indicators and analysis techniques. Here's how the limitations of outliers, varying scales, and unequal variance can impact the use of indicators in trading:
Outliers are data points that significantly deviate from the rest of the dataset. In trading, outliers can represent extreme price movements caused by rare events, news, or market anomalies. Outliers can have a significant impact on trading indicators and analyses:
Indicator Distortion: Outliers can skew the calculations of indicators, leading to misleading signals. For instance, a single extreme price spike could cause indicators like moving averages or RSI (Relative Strength Index) to give false signals.
Risk Management: Outliers can lead to overly aggressive trading decisions if not properly accounted for. Ignoring outliers might result in unexpected losses or missed opportunities to adjust trading strategies.
Different Scales: Trading data often includes multiple indicators with varying units and scales. For example, prices are typically in dollars, volume in units traded, and oscillators have their own scale. Mixing indicators with different scales can complicate analysis:
Normalization: Indicators on different scales need to be normalized or standardized to ensure they contribute equally to the analysis. Failure to do so can lead to one indicator dominating the analysis due to its larger magnitude.
Comparability: Without normalization, it's challenging to directly compare the significance of indicators. Some indicators might have a larger numerical range and could overshadow others.
Unequal Variance: Unequal variance in trading data refers to the fact that some indicators might exhibit higher volatility than others. This can impact the interpretation of signals and the performance of trading strategies:
Volatility Adjustment: When combining indicators with varying volatility, it's essential to adjust for their relative volatilities. Failure to do so might lead to overemphasizing or underestimating the importance of certain indicators in the trading strategy.
Risk Assessment: Unequal variance can impact risk assessment. Indicators with higher volatility might lead to riskier trading decisions if not properly taken into account.
█ APPLICATION OF THIS INDICATOR
This indicator can be used in 2 ways:
1) Make a directional trade:
If a trader thinks price will go higher or lower and price is within a cluster zone, The trader can take a position and place a stop on the 1 sd band around the cluster. As one can see below, the trader can go long the green arrow and place a stop on the one standard deviation mark for that cluster below it at the red arrow. using this we can calculate a risk to reward ratio.
Calculating risk to reward: targeting a risk reward ratio of 2:1, the trader could clearly make that given that the next resistance area above that in the orange cluster exceeds this risk reward ratio.
2) Take a reversal Trade:
We can use cluster centers (support and resistance levels) to go in the opposite direction that price is currently moving in hopes of price forming a pivot and reversing off this level.
Similar to the directional trade, we can use the standard deviation of the cluster to place a stop just in case we are wrong.
In this example below we can see that shorting on the red arrow and placing a stop at the one standard deviation above this cluster would give us a profitable trade with minimal risk.
Using the cluster density table in the upper right informs the trader just how dense the cluster is. Higher density clusters will give a higher likelihood of a pivot forming at these levels and price being rejected and switching direction with a larger move.
█ FEATURES & SETTINGS
General Settings:
Number of clusters: The user can select from 3 to five clusters. A good rule of thumb is that if you are trading intraday, less is more (Think 3 rather than 5). For daily 4 to 5 clusters is good.
Cluster Method: To get around the outlier limitation of k means clustering, The median was added. This gives the user the ability to choose either k means or k median clustering. K means is the preferred method if the user things there are no large outliers, and if there appears to be large outliers or it is assumed there are then K medians is preferred.
Bars back To train on: This will be the amount of bars to include in the clustering. This number is important so that the user includes bars that are recent but not so far back that they are out of the scope of where price can be. For example the last 2 years we have been in a range on the sp500 so 505 days in this setting would be more relevant than say looking back 5 years ago because price would have to move far to get there.
Show SD Bands: Select this to show the 1 standard deviation bands around the support and resistance level or unselect this to just show the support and resistance level by itself.
Features:
Besides the support and resistance levels and standard deviation bands, this indicator gives a table in the upper right hand corner to show the density of each cluster (support and resistance level) and is color coded to the cluster line on the chart. Higher density clusters mean price has been there previously more than lower density clusters and could mean a higher likelihood of a reversal when price reaches these areas.
█ WORKS CITED
Victor Sim, "Using K-means Clustering to Create Support and Resistance", 2020, towardsdatascience.com
Chris Piech, "K means", stanford.edu
█ ACKNOLWEDGMENTS
@jdehorty- Thanks for the publish template. It made organizing my thoughts and work alot easier.

Retest Support Resistance Signals [ChartPrime]The Retest Support Resistance Signals Indicator is a powerful tool designed to assist traders in identifying key support and resistance levels within the market. Most importantly and uniquely it identifies retests of these structures and displays them on the trader's chart. By utilizing a combination of pivot points and price action analysis, this indicator offers valuable insights for both signal-based and support/resistance trading strategies.
Key Features & settings:
Retest Confirmation: The indicator waits for a break above a support or resistance level and observes subsequent price action. If price retraces and forms a wick below the level, followed by a bounce, the indicator identifies it as a retest and labels it as "R" to indicate potential support or resistance confirmation.
This indicator combines the benefits of signal-based trading and support/resistance analysis, providing users with a versatile trading tool suitable for various strategies.
Retest Weaker Toggle: Users have the option to enable or disable the retest weaker feature. When enabled, the indicator considers a support or resistance level weaker if it experiences a test. When disabled, the indicator assumes that a bounce may occur from the level.
Pivot Detection Customization: Users can adjust the pivot detection method based on either wicks or bodies. This flexibility allows traders to adapt the indicator to different market conditions and preferences. The trader can also customize the number of bars used for pivot detection on both the left and right sides. This feature enables traders to fine-tune the indicator's sensitivity and responsiveness.
Users also have control over how support or resistance levels are managed on the chart. They can choose to either stop updating the levels (freeze) or completely remove them (delete) from the chart.
Breakout Threshold Setting: Traders can adjust the breakout threshold until deletion setting. This setting determines the number of successful breakouts through a support or resistance level required to remove it from the chart. This feature helps filter out weaker levels and focus on more significant ones.
Shown above we see the retest labels in action denoted with an R label
This indicator can be a useful addition to an SR trader's toolkit. Identifying when a level in the market is retested can reveal interesting information about the underlying strength of a trend. This indicator has been designed with the two major schools of thought; a level gets weaker the more it's tested vs stronger the more it's tested. We have designed this therefore to be versatile and adapt to both thought procceses. The R labels should be taken and considered as a larger part of an analysis process and not followed blindly.

Price Action - Support & Resistance + MACD LONG StrategyUsing "Price Action - Support & Resistance by DGT" and the MACD (Moving Average Convergence Divergence) indicator in TradingView can help develop a trade strategy. Here's a step-by-step approach you can follow:
1. Identifying Support and Resistance Levels: Apply the "Price Action - Support & Resistance by DGT" indicator to your chart. This indicator helps you identify key support and resistance levels based on price action. These levels act as potential areas where the price may reverse or consolidate.
2. Confirming Support and Resistance Levels: Once the indicator has plotted support and resistance levels on your chart, analyze the historical price action around these levels. Look for multiple touches or bounces from the same level, which adds strength to the support or resistance zone.
3. Analyzing the MACD Indicator: Add the MACD indicator to your chart. The MACD consists of two lines: the MACD line and the signal line, along with a histogram representing the difference between the two lines. The MACD helps identify momentum and potential trend reversals.
When the MACD line crosses above the signal line and the histogram turns positive, it suggests bullish momentum.
4. Identifying Trade Opportunities:
Bullish Trade: Look for a bullish setup when the price approaches a strong support level identified by the "Price Action - Support & Resistance by DGT" indicator. Wait for the MACD lines to cross above the signal line and the histogram to turn positive, indicating bullish momentum. Enter a long position with a stop loss below the
support level.
Managing the Trade: Once you enter a trade, consider setting a target based on the distance between your entry point and the nearest significant support or resistance level. You can also use trailing stop losses or other risk management techniques to protect your profits and limit potential losses.
Remember that no trading strategy is guaranteed to be successful, and it's important to practice proper risk management and conduct thorough analysis before making any trading decisions. Additionally, it's recommended to backtest and demo trade this strategy before using it with real money.

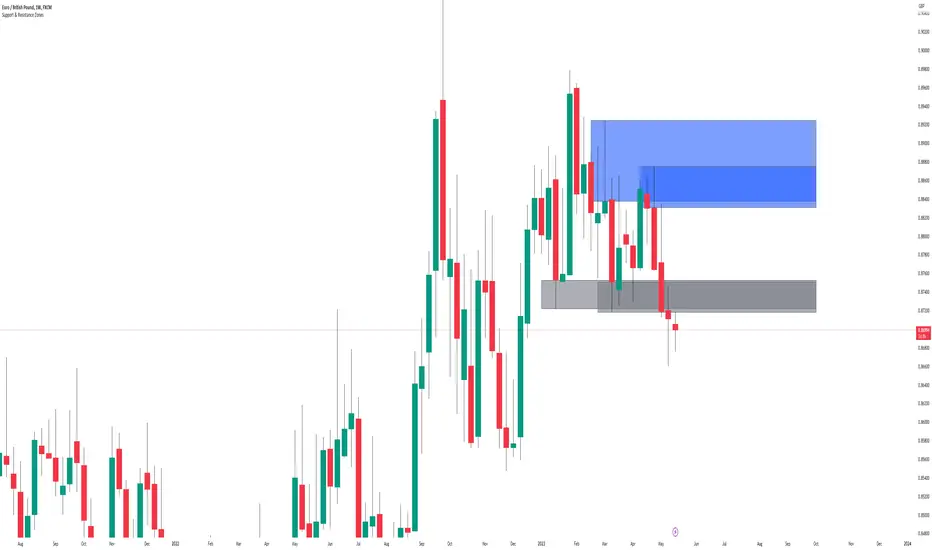
Support & Resistance ZonesTitle: A Comprehensive Guide to the Support & Resistance Zones Indicator
Introduction
In the world of technical analysis, the Support & Resistance Zones indicator plays a crucial role in identifying potential trading opportunities. These zones are essential for traders looking to capitalize on bounces or break and retests. In this article, we will delve into the specifics of the Support & Resistance Zones indicator, outlining how it works, how it finds and marks zones, and the various options available for traders.
What the indicator is about
The Support & Resistance Zones indicator, developed by @HarryCTC, is a powerful tool for detecting areas of potential price reversal or consolidation in a financial market. These zones are significant as they can act as a guide for traders to make informed decisions on entering or exiting positions. Specifically, the indicator helps identify:
1. Support Zones: Areas where the price has a tendency to bounce back up after falling, indicating a potential buying opportunity.
2. Resistance Zones: Areas where the price has a tendency to reverse after rising, indicating a potential selling opportunity.
How the indicator finds its zones
The Support & Resistance Zones indicator utilizes pivot points to identify potential support and resistance levels. By analyzing the fractal structure of the price chart, the indicator identifies key turning points, known as bull and bear fractals. The bull fractal is a high pivot point, while the bear fractal is a low pivot point.
The fractal structure is determined by the 'Switch Zone Period' input, which can be adjusted to suit the trader's preferences. A higher value will result in fewer zones being identified, while a lower value will result in more zones.
How it marks zones and why it marks zones
The indicator marks the support and resistance zones by creating rectangular boxes around the identified fractal points. The zones are extended horizontally from the fractal point, allowing traders to visualize the potential areas of price reversal.
The zones are marked for the following reasons:
1. To provide a clear visual representation of potential support and resistance levels.
2. To help traders identify potential entry and exit points based on the price's reaction to these zones.
3. To serve as a reference for stop-loss and take-profit levels when planning trades.
The indicator's for traders trading bounces or break and retests
Traders who focus on trading bounces or break and retests can benefit immensely from the Support & Resistance Zones indicator. By providing a visual representation of key support and resistance levels, the indicator enables traders to:
1. Identify potential buying opportunities at support zones where the price is likely to bounce back up.
2. Identify potential selling opportunities at resistance zones where the price is likely to reverse after rising.
3. Make informed decisions on stop-loss and take-profit levels based on the price's proximity to support and resistance zones.
4. Monitor the market for potential breakouts or breakdowns when the price breaches these zones.
Indicator options
The Support & Resistance Zones indicator offers several customizable options to suit the trader's preferences. These options include:
1. Switch Zone Period: Adjusts the number of periods used to calculate the fractal structure, influencing the number of identified zones.
2. No. of Displayed Zones: Determines the maximum number of zones displayed on the chart, ranging from 1 to 8.
3. Zone Extension: Adjusts the horizontal extension of the support and resistance zones.
4. Resistance Zone Color: Customizes the color of the resistance zone boxes.
5. Support Zone Color: Customizes the color of the support zone boxes.
6. Zone Border Color: Customizes the color of the zone box borders.
Conclusion
The Support & Resistance Zones indicator is a valuable tool for traders looking to identify potential trading opportunities based on the price's interaction with support and resistance levels. By providing a clear visual representation of these zones, the
indicator allows traders to make informed decisions on entry and exit points, stop-loss, and take-profit levels. With customizable options, the indicator can be tailored to suit individual trading preferences and strategies.
Multi ZZ - Support/ResistenceExperimental and probably can be improved further.
Method of deriving support/resistence is as follows:
Calculate Zigzags and start pushing them to SR array as and when they form
If any of the existing item is within the small distance - merge them. ATR is used to find if the prices are close by.
Whenever we merge two pivots, strength of support keeps increasing. This means, price has bounced off this point more time. Hence, keep track of number of pivots merged together.
Keep removing old pivots which are far away based on Loopback input
And that's all we got the full list of support and resistence points.
Now, to filter insignificant pivots, chose only those points which has been merged by more than Min Pivots input. Width of the support/resistence lines also will be thicker for the pivots which has more count. Hence thicker line imply strong support and resistence whereas the thinner ones are minor ones.
Dynamic Support and ResistanceSupport is a price level where a downtrend can be expected to pause due to a concentration of demand or buying interest. As the price of assets or securities drops, demand for the shares increases, thus forming the support line.
Meanwhile, resistance zones arise due to selling interest when prices have increased.s their name implies, dynamic support and resistance levels change their level with each new price-tick.To draw dynamic support and resistance levels, traders usually use moving averages which are automatically drawn by your trading platform. The 200-day exponential moving average (EMA), 100-day EMA, and 20-30-40-50-day EMA are very popular dynamic support and resistance levels.also in some references Williams Fractal level used for dynamic support and resistance levels. and it also includes other support and resistance levels that are projected based on the pivot point calculation. All these levels help traders see where the price could experience support or resistance. Similarly, if the price moves through these levels it lets the trader know the price is trending in that direction.

Swing High/Low Support ResistanceThis indicator detects recent swing highs and swing lows using Pine Script pivots and marks them with visible chart labels. These points highlight potential turning areas in price action and can help identify short-term support or resistance for intraday or swing trading.
How to Apply
Locate the indicator in TradingView’s “Indicators” library; search by its name or author.
Click the star icon to mark it as a favourite for quick future access.
Apply directly to your chosen chart and timeframe with a single click—no need to enter or paste code.
Adjust the input parameters from the settings panel if desired to personalize swing sensitivity.
Choose Your Timeframe:
Apply to any intraday or swing timeframe; shorter lengths show more frequent pivots.
Set Sensitivity:
Use the “Swing Detection Length” input to adjust how many bars define a pivot, making swings more or less sensitive to price action.
How to Analyze
Swing High Labels: Mark recent local peaks, suggesting resistance zones or possible reversal points.
Swing Low Labels: Highlight recent bottoms, indicating support or bounce areas.
Monitor labels for clustering or repeated appearance at similar levels, which may strengthen their importance as price reacts near those points.
Track how price behaves after forming new pivots—multiple tests can affirm the relevance of a level.
What Traders Should Watch
Price reaction at labeled areas: frequent tests may anticipate reversals or breakouts.
Transition between higher highs/higher lows (uptrend) vs. lower highs/lower lows (downtrend).
Combine the swing levels with other analysis methods, such as volume, RSI, or EMA, for better signal quality.
Features Included
Dynamic swing high and low detection via confirmed pivots.
Direct labeling on the chart for market structure clarity.
No repainting—labels show only after complete formation.
Fully automatic updates as price action unfolds.
No promotional, external, or non-compliant elements; open source and safe for public or private use.
Compliance Notes
No signals, buy/sell calls, financial advice, or performance claims.
No hidden code, advertising, or off-platform contacts.
Pure educational and analytical utility; adheres to all TradingView house rules and script publishing policies.
Disclaimer
This indicator is for informational purposes only and does not constitute advice. Always do your own research and use proper risk management.

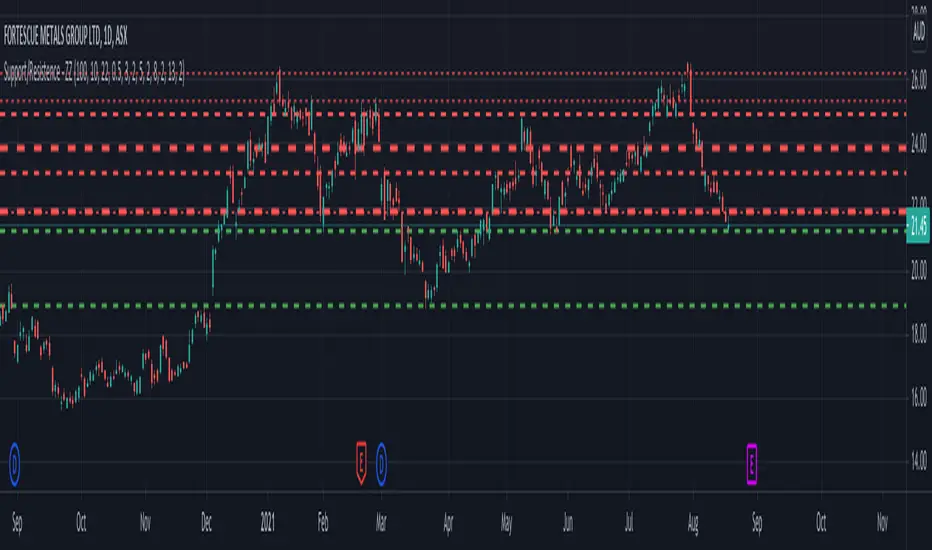
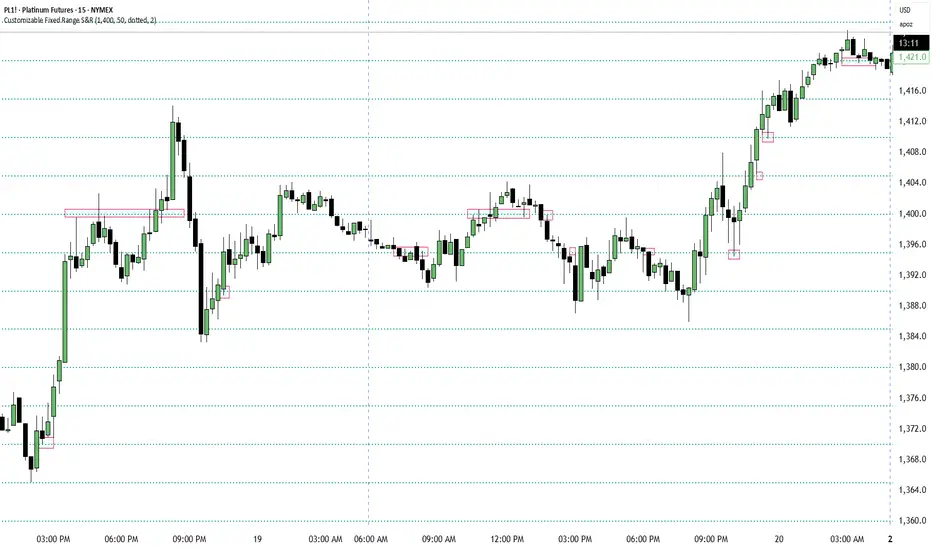
Customizable Fixed Range Support & ResistanceTraders often overlook the fixed range support and resistance, especially if they are round numbers. If you make some observations, you will see that buyers and sellers engage in numerous transactions at those levels. You can have a look at the screenshots presented here (find the red boxes!) or check it out for yourselves on the instrument's chart that you prefer. This indicator will be a big help for day traders and scalpers to set their entries, profit targets, and stop loss levels.
[L2] Enhanced MACD Support-Kisslooking for support line, before pumping, script can find where possible points for enter

Support and Resistance ZonesSupport and Resistance Zones— Indicator
Overview :
This indicator dynamically detects and visualizes key support and resistance zones by aggregating price data into synthetic candles. It highlights these critical price areas as shaded boxes that adjust in real-time, providing traders with clear visual cues on where price might find support or resistance.
Key Features :
-Dynamic Zone Detection: Automatically identifies zones formed by consecutive grouped candles meeting customizable criteria.
-Aggregation Factor: Combine multiple bars into synthetic candles to reduce noise and emphasize significant price zones.
-Customizable Zone Length: Extend the zone boxes by a user-defined number of bars beyond the current price for enhanced visualization.
-Visual Styling: Fully customizable zone fill and border colors to suit your chart preferences.
-Zone Lifecycle Control: Option to terminate old zones to maintain a clean chart.
-Breakout Alerts: Trigger alerts when price breaks above or below confirmed zones, signaling potential trading opportunities.
Inputs :
-Minimum Candles to Form Zone: Sets how many consecutive synthetic candles must align to form a valid zone.
-Aggregation Factor: Defines how many bars are combined to create a synthetic candle.
-Zone Fill and Border Colors: Customize the appearance of zones on the chart.
-Terminate Old Zones: Enable or disable automatic removal of previous zones.
-Box Extension Bars: Number of bars the zone boxes extend beyond their detected range for better visibility.
How to Use :
1. Apply the Indicator : Add it to your chart on any timeframe or market (Forex, stocks, crypto).
2. Set Input : Adjust the minimum candles, aggregation factor, and box extension bars based on your trading style and timeframe. For example, higher aggregation smooths noise for longer-term zones.
3. Visualize Zones : Watch as the indicator dynamically draws shaded boxes representing areas of support and resistance. Zones will grow as price action confirms their strength.
4. Monitor Breakouts : Use breakout alerts to be notified when price decisively moves beyond a zone, providing signals for possible entries or exits.
5.Customize Appearance : Adjust colors and enable zone termination to keep your chart clear and focused.
This tool simplifies identifying important price levels, reducing manual analysis time and helping you make informed trading decisions.

Support and Resistance Profile with Volatility ClusteringThe indicator begins by looking at recent volatility behavior in the market: it measures the average true range over your chosen “Length” and compares it to the average true range over ten times that period. When volatility over the short window is high relative to longer-term volatility, we mark that period as a “cluster.” As price moves through these clusters—whether in a quiet period or a sudden burst of activity—the script isolates each cluster and examines the sequence of closing prices within it.
Within every cluster, the algorithm next finds the points along the price path that matter most to a human eye, smoothing out minor wobbles and highlighting the peaks and valleys that define the cluster’s shape. It does this by drawing a straight line between the beginning and end of the cluster, then repeatedly snapping the single point that deviates most from that line back onto it and re-interpolating, until it has identified a fixed number of perceptually important points. Those points capture where price really turned or accelerated, stripping away noise so that you see the genuine memory-markers in each volatility episode.
Each of those important points inherits a “weight” based on the cluster’s normalized volatility—essentially how large the average true range in that cluster was relative to its average close. Over your “Main Length for Profile” window, every time one of these weighted points occurs at a particular price level, it adds to a running total in that level’s bin. At the end of the window you see a silhouette of boxes extending to the right of the chart: where boxes are wide, many important points (with high volatility weight) have happened there in the past; where boxes are thin or absent, price memory is light.
For a trader, the value of this profile lies in spotting zones where the market has repeatedly “remembered” price extremes during volatile episodes—those are areas where support or resistance is likely to be strongest. Conversely, gaps in the profile—price levels with little weighted history—suggest frictionless zones. If price enters such a gap, it may move swiftly until it encounters another region of heavy memory. You can use this in several ways: as a filter on breakouts and breakdowns (only trade through a gap when you see sufficient momentum), as a guide for scaling into positions (add when price enters a low-memory zone and tighten stops where memory boxes thicken), or to anticipate where price might pause or reverse (when it reaches a band of wide boxes). By turning raw volatility clusters into a human-readable map of price memory, this tool helps you see at a glance where the market is likely to push or pause—and plan entries, exits, and risk targets accordingly.

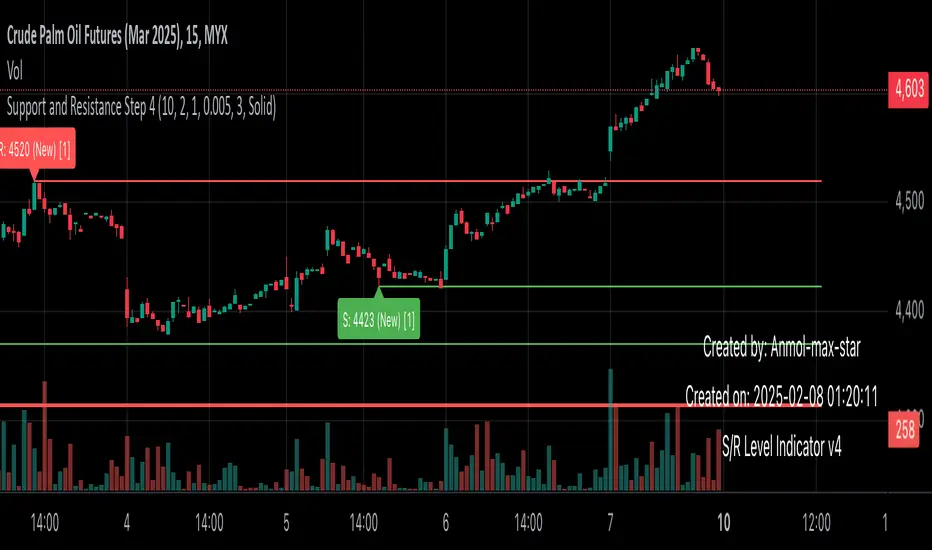
Support and Resistance all in one The Support and Resistance Indicator (v4) is designed to identify and track key price levels in financial markets. Here's how it works:
Core Functionality
Level Detection
Uses pivot points to identify significant price levels
Looks for swing highs (resistance) and swing lows (support)
Requires price action to pivot over a specified period (default 10 bars)
Dynamic Level Management
Maintains separate arrays for support and resistance levels
Limits maximum displayed levels (default 10) to prevent chart clutter
Removes oldest levels when maximum is reached
Ensures new levels are sufficiently distant from existing ones (minimum 1% separation)
Touch Detection System
Monitors price interaction with established levels
Counts when price comes within 0.1% of any level
Updates touch count and strength classification
Categories: "New" (1 touch), "Moderate" (2 touches), "Strong" (3+ touches)
Visual Representation
Draws horizontal lines at each level
Updates line width based on strength (thicker for stronger levels)
Shows labels with price and strength information
Color coding: Red (new/moderate levels), Green (strong levels)
Displays triangles (▼▲) at pivot points
Trading Applications
Support/Resistance Trading
Strong levels (3+ touches) suggest reliable trading zones
More touches indicate higher probability reversal points
Use for stop loss and target placement
Breakout Trading
Monitor breaks of strong levels
Higher touch count suggests more significant breakouts
Watch for false breakouts at weaker levels
Risk Management
Place stops beyond strong levels
Use level strength to adjust position size
Consider multiple timeframe analysis
Best Practices
Use with other indicators for confirmation
Consider market context and trend
Monitor level strength development
Don't rely solely on touch count
Watch for price reaction at levels
Customization Options
Adjust pivot length for different timeframes
Modify minimum distance between levels
Change required touches for "Strong" classification
Toggle strength labels display
Choose line style (Solid/Dashed/Dotted)
This indicator helps identify key price levels where market participants have shown interest, making it valuable for trade planning and risk management
RSI & DPO support/resistanceThis indicator combines the Relative Strength Index (RSI) to identify overbought and oversold conditions with the Detrended Price Oscillator (DPO) to highlight support and resistance levels.
Unlike traditional indicators that display these metrics in a separate window, this tool integrates them directly onto the main price chart.
This allows for a more cohesive analysis, enabling traders to easily visualize the relationship between price movements and momentum indicators in one unified view.
How to Use It:
Identify Overbought and Oversold Conditions:
Look for RSI values above 70 to identify overbought conditions, suggesting a potential price reversal or pullback. Conversely, RSI values below 30 indicate oversold conditions, which may signal a potential price bounce or upward movement.
Analyze Support and Resistance Levels:
Observe the DPO lines on the main chart to identify key support and resistance levels. When the price approaches these levels, it can provide insights into potential price reversals or breakouts.
Combine Signals for Trading Decisions:
Use the RSI and DPO signals together to make informed trading decisions. For example, if the RSI indicates an overbought condition while the price is near a resistance level identified by the DPO, it may be a good opportunity to consider selling or taking profits.
Monitor Divergences:
Watch for divergences between the RSI and price movements. If the price is making new highs while the RSI is not, it could indicate weakening momentum and a potential reversal.
Set Alerts:
Consider setting alerts for when the RSI crosses above or below the overbought or oversold thresholds, or when the price approaches significant support or resistance levels indicated by the DPO.
Practice Risk Management:
Always use proper risk management techniques, such as setting stop-loss orders and position sizing, to protect your capital while trading based on these indicators.
By following these steps, traders can effectively utilize this indicator to enhance their market analysis and improve their trading strategies.

Support line based on RSIThis indicator builds a support line using the stock price and RSI.
Inputs:
1. Time window for the RSI:
the time window the RSI is calculated with, usually it's 14 but in here I recommend 30.
2. offset by percentage:
just adding or subtructing some percentage of the result, some stocks need a bit of offset to work
3. stability:
the higher it is the less the RSI effects the graph. for realy high stability the indicator the the stock price will be realy close.
formula: (close*(100-newRSI)/50)*(100+offset)/100
when:
newRSI = (RSI + (50 * stability1))/(stability+1)
recommended usage:
Usually, if the indicator becomes higher than the price, (the price lowers). the stock will go up again to around the last price where they met.
so, for example, if the stock price was 20 and going down. while the indicator was 18 and going up, then they met at 19 and later the indicator became 20 while the stock fell to 18. most chances are that the stock will come back to 19 where they met and at the same time the indicator will also get to 19.
In stocks that are unstable, like NVDA. this indicator can be used to see the trend and avoid the unstability of the stock.

Support and Resistance [CryptoSea]The Support and Resistance Indicator is a powerful tool developed by CryptoSea for traders seeking to identify key market levels with precision. This script leverages advanced pivot and volume analysis to highlight support and resistance zones on the price chart.
Key Features
Multi-Source Pivot Analysis: Choose between wicks or body prices for calculating pivot points, providing flexibility in market analysis.
Volume Spike Detection: Automatically identifies volume spikes using a customizable threshold multiplier, enhancing the accuracy of support and resistance levels.
Dynamic Box Display: Configurable options for extending and graying out boxes based on price interaction, ensuring a clear visual representation of active and invalidated zones.
In the example below, we see a resistance box formed based on wick highs and a volume spike. The box extends to where we see price rejecting from it. In the settings you can change this so the box will stop if price touches it if you prefer.
How it Works
Pivot Point Calculation: The script determines pivot highs and lows using either wicks or body prices over a specified term (Short, Medium, Long), corresponding to 5, 15, or 30 bars.
Volume Analysis: Calculates average volume over twice the pivot length and identifies volume spikes exceeding the user-defined threshold, crucial for confirming support and resistance levels.
Box Management: Maintains arrays of support and resistance boxes, limiting the number based on user settings (All, Recent Few, Recent Several).
Settings Explained
Source: Choose between 'Wicks' or 'Bodies' to determine whether pivot points are calculated using candle wicks or body prices.
Pivot Term: Select 'Short' (5 bars), 'Medium' (15 bars), or 'Long' (30 bars) to adjust the distance for pivot calculation. Longer terms take more bars to confirm support/resistance.
Volume Threshold (multiplier): Set a multiplier of average volume to detect volume spikes, essential for validating support/resistance levels.
Extend Until Price Hits: Enable this to extend support/resistance boxes until the price touches them, providing dynamic levels.
Gray Out Boxes Once Hit: Enable this to gray out the boxes once the price interacts with them, indicating that they are no longer active.
Max Boxes Displayed: Choose 'All', 'Recent Few' (up to 3 boxes each for bull and bear), or 'Recent Several' (up to 10 boxes each for bull and bear) to control the number of visible boxes.
Invalidate Condition: Select 'Touch' to invalidate a box when the price touches it or 'Through' to invalidate when the price passes entirely through the box.
Candle Colors: Option to color candles based on neutral, bullish, or bearish conditions for easier visual analysis.
Application
Strategic Planning: Assists traders in pinpointing potential entry and exit points by marking significant support and resistance zones.
Trend Confirmation: Validates trend strength and potential reversals with volume-based analysis of support and resistance levels.
Customizable Settings: Tailors analysis to various trading strategies with extensive input settings for pivot source, term, volume threshold, and display preferences.
The Support and Resistance Indicator by is an essential addition to any trader’s toolkit, offering robust and customizable market level analysis for improved trading decisions.

Support & Resistance IndicatorThe MACD Support & Resistance indicator is an enhanced tool to better visualize potential supply (resistance) and demand (support) zones based on the MACD indicator. It combines the strength of the MACD with recent price highs and lows to depict potential breakout or reversal areas in the market.
Features:
MACD Settings: Users can adjust the fast length, slow length, source of MACD, signal smoothing, and MA type for both the oscillator and the signal line.
Dynamic Color Settings: Customize the color of supply boxes, demand boxes, and closed boxes for improved visualization.
Table View: An optional table can be displayed showing the average MACD high and low values, with customizable table position, size, background color, and text color.
Historical MACD Average: The indicator uses a historical average of MACD pivot highs and lows to determine potential support and resistance zones.
Real-Time Zone Detection: The indicator plots 'High Boxes' when the MACD crosses above its average high and 'Low Boxes' when it crosses below its average low, which signifies potential breakout or reversal zones.
How It Works:
The MACD line is calculated using user-defined moving average types (either EMA or SMA).
Pivot highs and pivot lows of the MACD are identified over a specified period.
Historical MACD highs and lows are stored and managed for average calculation. The average MACD high and low values are then used to determine potential trading zones.
When the MACD crosses over its average high, a 'High Box' (representing a potential breakout zone) is plotted from the recent high price to the candle top.
Conversely, when the MACD crosses under its average low, a 'Low Box' (indicating a potential reversal zone) is plotted from the recent low price to the candle base.
As price progresses, the boxes can either extend (if price stays within the zone) or close if a breakout happens.
For those who prefer a tabular view, an optional table displays the average MACD high and low, enhancing the on-chart data representation.
Use Cases:
Traders can use this indicator as an additional tool to spot potential breakout or reversal areas based on the MACD's behavior against its historical average. The visual representation in the form of boxes can assist in making better trading decisions by offering a clear picture of potential supply and demand zones.
Note: As with all trading indicators, it's advisable to use this tool in conjunction with other technical analysis methods or indicators for more informed decision-making.
