Hma Swing Points | viResearchHma Swing Points | viResearch
Conceptual Foundation and Innovation
The "Hma Swing Points" script introduces a simple yet effective method for identifying key swing points in the market using Hull Moving Averages (HMA). The Hull Moving Average is a faster and smoother alternative to traditional moving averages, making it ideal for detecting significant price swings. By applying HMA to both high and low prices, the script identifies swing highs and lows, providing traders with visual cues for potential trend reversals or continuations. This approach helps traders recognize turning points in the market with minimal lag, allowing for more precise entries and exits.
Technical Composition and Calculation
This script uses two Hull Moving Averages—one for the high prices and another for the low prices. These HMAs offer smoother trend detection while filtering out market noise. The script identifies the highest and lowest HMA values over a user-defined lookback period to determine the swing high and swing low points. Long signals are generated when the current HMA of the highs matches the highest value within the lookback period, while short signals are generated when the HMA of the lows matches the lowest value. These signals are plotted on the chart, and alerts can be set to notify the trader of possible entry or exit points.
Features and User Inputs
The script offers several customizable inputs to adjust its sensitivity and behavior according to the trader’s preferences. The lookback period defines the number of bars used to calculate the highest and lowest HMA values, allowing traders to control how responsive the script is to price changes. The length of the Hull Moving Average can also be modified, giving traders flexibility in smoothing the indicator. Additionally, optional bar color settings provide visual cues, with bullish and bearish trends highlighted. Alerts are included to notify traders when long or short swing points are detected, ensuring they are informed even when not actively monitoring the chart.
Practical Applications
The "Hma Swing Points" script is useful for traders who aim to identify critical market turning points and potential reversals. It is especially effective in trending markets where price swings present trading opportunities. Traders can use the script to detect reversals by spotting swing points that indicate a possible shift from bullish to bearish trends, or vice versa. The script also helps confirm ongoing trends by showing the strength of swings, allowing traders to make informed decisions about entering or exiting trades. Its ability to mark precise swing points enhances trade timing, helping traders optimize their entries and exits.
Advantages and Strategic Value
The script offers a streamlined approach to detecting swing points with the speed and smoothness of the Hull Moving Average. This makes it easier to filter out false signals and noise, improving the accuracy of trend identification. The customizable inputs allow traders to tailor the script for different assets and market conditions, making it versatile for various trading styles. By highlighting key swing points, the script provides traders with clear visual signals for potential reversals and trend confirmations, enhancing their ability to follow and act on market movements.
Summary and Usage Tips
Incorporating the "Hma Swing Points" script into a trading strategy helps traders identify market reversals and continuation points more effectively. Adjusting the lookback period and HMA length ensures the script adapts to different assets and market conditions. The alert system ensures traders don’t miss key swing points. As always, backtesting is important to evaluate the script’s performance under various market conditions, and past results may not guarantee future outcomes.
Cerca negli script per "swing"

False Breakouts [TradingFinder] Fake Breakouts Failure🔵 Introduction
Technical indicators are essential tools for analysts and traders in financial markets, helping them predict price movements and make better trading decisions. One of the key concepts in technical analysis that should be carefully considered is the "False Breakout."
This phenomenon occurs when a price temporarily breaks through a significant support or resistance level but fails to hold and quickly returns to its previous range. Understanding this concept and applying it in trading can reduce risks and increase profitability.
🟣 What is a False Breakout?
A Fake Breakout, as the name suggests, refers to a breakout that appears to occur but fails to sustain, leading the price to quickly revert back to its previous range. This situation often happens when inexperienced or non-professional traders, under psychological pressure and eager to enter the market quickly, initiate trades.
This creates opportunities for professional traders to take advantage of these short-term fluctuations and execute successful trades.
🟣 The Importance of Recognizing False Breakouts
Recognizing False Breakouts is crucial for any trader aiming for success in financial markets. False Breakouts typically occur when the market approaches a critical support or resistance level.
In these situations, many traders are waiting to see if the price will break through this level. However, when the price quickly returns to its previous range, it indicates weakness in the movement and the inability to sustain the breakout.
🟣 How to identify False Breakouts?
To identify Fake Breakouts, it is important to carefully analyze price charts and look for signs of a quick price reversal after breaking a key level.
Here are some chart patterns that may help you identify a False Breakout :
1. Pin Bar Pattern : The Pin Bar is a candlestick pattern that indicates a price reversal. This pattern usually appears near support and resistance levels, showing that the price attempted to break through a key level but failed and reversed.
2. Fakey Pattern : This pattern, which consists of several candlesticks, indicates a False Breakout and a quick price return to the previous range. It usually appears near key levels and can signal a trend reversal.
3. Using Multiple Timeframes : One way to identify False Breakouts is by using charts of different timeframes. Sometimes, a breakout on a one-hour chart may be a False Breakout on a daily chart. Analyzing charts across multiple timeframes can help you accurately identify this phenomenon.
🔵 How to Use
Once you identify a False Breakout, you can use it as a trading signal. For this, it is best to look for trading opportunities in the opposite direction of the False Breakout. In other words, if a False Breakout occurs at a resistance level, you might consider selling opportunities, and if it happens at a support level, you might look for buying opportunities.
Here are some key points for trading based on False Breakouts :
1. Patience and Discipline : Patience and discipline are crucial when trading with False Breakouts. Wait for the False Breakout to clearly form before entering a trade.
2. Use Stop Loss : Setting an appropriate stop loss is vital when trading based on False Breakouts. Typically, the stop loss can be placed near the level where the False Breakout occurred.
3. Seek Confirmations : Before entering a trade, look for additional confirmations. These can include other analyses or technical indicators that show the price is likely to return to its previous level.
🔵 Settings
🟣 Logical settings
Swing period : You can set the swing detection period.
Max Swing Back Method : It is in two modes "All" and "Custom". If it is in "All" mode, it will check all swings, and if it is in "Custom" mode, it will check the swings to the extent you determine.
Max Swing Bac k: You can set the number of swings that will go back for checking.
🟣 Display settings
Displaying or not displaying swings and setting the color of labels and lines.
🟣 Alert Settings
Alert False Breakout : Enables alerts for Breakout.
Message Frequency : Determines the frequency of alerts. Options include 'All' (every function call), 'Once Per Bar' (first call within the bar), and 'Once Per Bar Close' (final script execution of the real-time bar). Default is 'Once per Bar'.
Show Alert Time by Time Zone : Configures the time zone for alert messages. Default is 'UTC'.
🔵Conclusion
False Breakouts, as a key concept in technical analysis, are powerful tools for identifying sudden price changes and using them in trading. Understanding this phenomenon and applying it can help traders perform better in financial markets and avoid potential losses.
To benefit from False Breakouts, traders need to carefully analyze charts and use the appropriate analytical tools. By leveraging this strategy, traders can achieve lower-risk and higher-reward trades.

Breakouts with Tests & Retests [LuxAlgo]The Breakouts Tests & Retests indicator highlights tests and retests of levels constructed from detected swing points. A swing area of interest switches colors when a breakout occurs.
Users can control the sensitivity of the swing point detection and the width of the swing areas.
🔶 USAGE
When a Swing point is detected, an area of interest is drawn, colored green for a bullish swing and red when bearish.
A test is confirmed when the opening price is situated in the area of interest, and the closing price is above or below the area, depending on whether it is a bullish or bearish swing. Tests are highlighted with a solid-colored triangle.
A breakout is confirmed when the price closes in the opposite position, below or above the area, in which case the area will switch colors.
If the opening price is located within the area and the closing price closes outside the area, in the same direction as the breakout, this is considered a retest . Retests are highlighted with a hollow-colored triangle.
Note that tests/retests do not act on wicks. The main factor is that the opening price is in the area of interest, while the closing price is outside.
🔹 Area Of Interest Width
The user can adjust the width of the swing areas. Changing the " Width " is a fast and easy way to find different areas of interest.
A higher "Multiple" setting would return a wider area, allowing price to develop within it for a longer period of time and potentially provide later test signals.
When a swing area is broken, a higher "Width" setting can make it more complicated for the price to break it again, allowing a swing area to remain valid for a longer period of time thus potentially providing more retest signals.
🔶 DETAILS
Generally, only one bullish/bearish pattern can be active at a time. This means that no more than 1 bullish or bearish area will be active.
The " Display " settings, however, can help control how areas of different types are displayed.
Bullish AND Bearish: Both, bullish and bearish patterns can be drawn at the same time
Bullish OR Bearish: Only 1 bullish or 1 bearish pattern is drawn at a time
Bullish: Only bullish patterns
Bearish: Only bearish patterns
🔹 Test/Retest Labels
The user can adjust the settings so only the latest test/retest label is shown or set a minimum number of bars until the next test/retest can be drawn.
🔹 Maximum Bars
Users can set a limit of bars for when there is no test/retest in that period; the area of interest won't be updated anymore and will be available and ready for the next Swing.
An option for pulling the area back to the last retest is included.
🔶 SETTINGS
Display: Determines which swing areas are displayed by the indicator. See the "DETAILS" section for more information
Multiple: Adjusts the width of the areas of interest
Maximum Bars: Limit of bars for when there is no test/retest
Display Test/Retest Labels: Show all labels or just the last test/retest label associated with a swing area
Minimum Bars: Minimum bars required for a subsequent test/retest label are allowed to be displayed
Set Back To Last Retest: When after "Maximum Bars" no test/retest is found, place the right side of the area at the last test/retest
🔹 Swings
Left: x amount of wicks on the left of a potential Swing need to be higher/lower for a Swing to be confirmed.
Right: The number of wicks on the right of a potential swing needs to be higher/lower for a Swing to be confirmed.
🔹 Style
Bullish: color for test period (before a breakout) / retest period (after a breakout)
Bearish: color for test period (before a breakout) / retest period (after a breakout)
Label Size

Smart Market Structure and Swing Points, version 1.0Smart Market Structure and Swing Points, Version 1.0
Overview
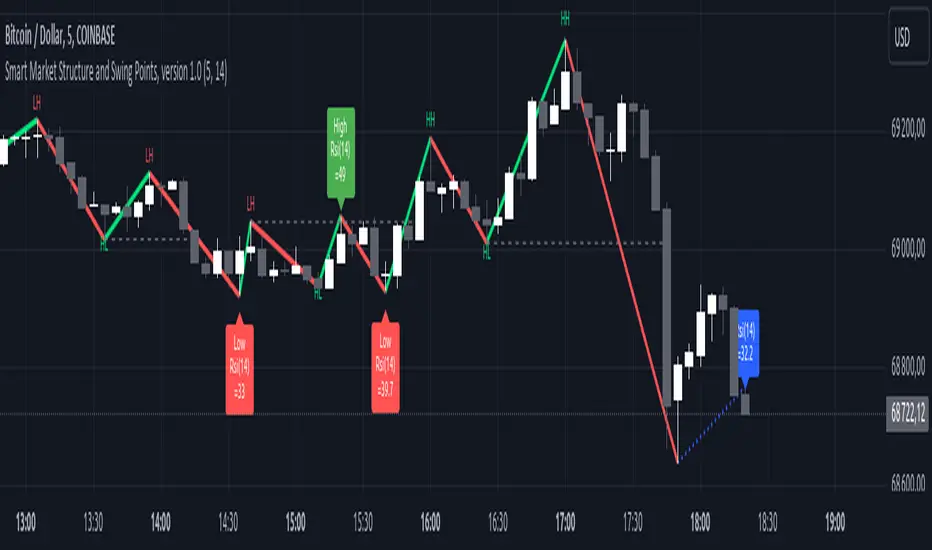
The Smart Market Structure and Swing Points script is designed to provide advanced insights into market structure and key swing points. This script helps identify important highs and lows, trend direction changes (structure breaks), and swing points, enhancing decision-making for both trend-following and reversal strategies. See below for detail presentation and why it has unique features.
Unique Features of the New Script
Market Structure Identification : Analyzes and marks key highs and lows to determine market structure, including higher highs, lower highs, higher lows, and lower lows.
Customizable Detection Length : Allows users to set the length for detecting highs and lows, providing flexibility to adapt to different market conditions and timeframes. Default value is 5 bars, but can be changed if needed.
Visual Signal Indicators (Labels) : Plots labels on the chart to indicate higher highs (HH), lower highs (LH), higher lows (HL), and lower lows (LL), along with corresponding RSI values, offering clear visual cues for market structure analysis. The indication of RSI values directly on high and low points enables to better judge whether the points are strong references (extreme RSI values) or weak references (middle RSI values)
Dynamic Trend Lines : Draws solid and dotted lines to connect significant highs and lows, visually representing the current trend direction and potential trend changes. Dashed lines indicates structure breaks.
Swing High and Swing Low Detection : Identifies and marks the most recent swing highs and swing lows, helping traders spot potential reversal points and key levels for setting stop losses or take profit targets .
Originality and Usefulness
This script combines market structure, trend breaks and RSI to provide a more robust view of market dynamic by indicating the strength or weakness of swing points , in that way the script is unique.
Signal Description
The script includes various signal features that highlight potential trading opportunities based on market structure:
Higher Highs (HH) and Higher Lows (HL) : These labels are plotted when new highs or lows are formed, indicating a continuation of an uptrend. The labels are positioned with consideration of the Average True Range (ATR) for better visibility.
Lower Highs (LH) and Lower Lows (LL) : These labels are plotted when new highs or lows are formed, indicating a continuation of a downtrend. The labels include RSI values to provide additional information on the strength or weakness of the points.
Trend Direction Change : Dotted lines are drawn to indicate potential trend direction changes when the script detects significant shifts in market structure.
Swing Highs and Swing Lows : These are identified based on a customizable swing length, marking recent significant highs and lows to highlight potential reversal points.
These signals help identify high-probability turning points and confirm trend direction by ensuring that the market structure aligns with the trading strategy.
Detailed Description
Input Variables
Length for High/Low Detection (`length`) : Defines the range to check for highs and lows. Default is 5.
RSI Length (`rsilength`) : The number of periods to calculate the RSI. Default is 14.
Functionality
Market Structure Calculation : The script determines the highest high and lowest low within the specified range to identify key points in market structure.
```pine
h = ta.highest(high, length * 2 + 1)
l = ta.lowest(low, length * 2 + 1)
```
Directional Logic : Variables and functions manage the state of the indicator, updating highs and lows based on the current trend direction.
```pine
var bool dirUp = false
var float lastLow = high * 100
var float lastHigh = 0.0
// Additional variables for tracking state
```
Drawing Lines and Labels : Functions draw lines and labels on the chart to visualize market structure and trend changes.
```pine
f_drawLine() =>
_li_color = dirUp ? color.red : color.lime
line.new(x1=timeHigh - length, y1=lastHigh, x2=timeLow - length, y2=lastLow, color=_li_color, width=3, style=line.style_solid, xloc=xloc.bar_index)
f_drawLastLine() =>
_li_color = dirUp ? color.blue : color.blue
if timeHigh > timeLow
line.new(x1=timeHigh - length, y1=lastHigh, x2=bar_index, y2=low, color=_li_color, width=2, style=line.style_dotted, xloc=xloc.bar_index)
else
line.new(x1=timeLow - length, y1=lastLow, x2=bar_index, y2=high, color=_li_color, width=2, style=line.style_dotted, xloc=xloc.bar_index)
```
Updating Highs and Lows : The main logic updates highs and lows based on the current trend direction, adding labels for new higher highs, lower highs, higher lows, and lower lows.
```pine
if dirUp
if f_isMin(length)
lastLow := low
// Additional logic for updating lows and labels
if f_isMax(length) and high > lastLow
lastHigh := high
// Additional logic for updating highs and labels
dirUp := false
li := f_drawLine()
```
Swing Highs and Lows : The script identifies recent swing highs and swing lows based on a customizable swing length, drawing lines to mark these points.
```pine
swingLength = 3 * length
isSwingHigh = ta.highestbars(high, swingLength) == 0
isSwingLow = ta.lowestbars(low, swingLength) == 0
if (isSwingHigh)
if (na(highLine))
highLine := line.new(bar_index, high, bar_index, high, color=color.green, style=line.style_solid, width=1)
else
line.set_xy1(highLine, bar_index, high)
line.set_xy2(highLine, bar_index + swingLength, high)
if (isSwingLow)
if (na(lowLine))
lowLine := line.new(bar_index, low, bar_index, low, color=color.red, style=line.style_solid, width=1)
else
line.set_xy1(lowLine, bar_index, low)
line.set_xy2(lowLine, bar_index + swingLength, low)
```
How to Use
Configuring Inputs : Adjust the detection length and RSI length as needed. Modify the lookback periods to suit your trading strategy. The indicator is adaptable and can be used on any timeframe.
Interpreting the Indicator : Use the labels and lines to gauge market structure and trend direction. Look for higher highs, lower highs, higher lows, and lower lows to confirm market structure.
Signal Confirmation : Pay attention to the labels and lines that provide signals for potential trend changes and swing points. Use these signals to better time entries and exits.
This script provides a detailed view of market structure and swing points, helping make more informed decisions by considering key highs and lows, trend direction changes, and the strength or weakness of swing points.
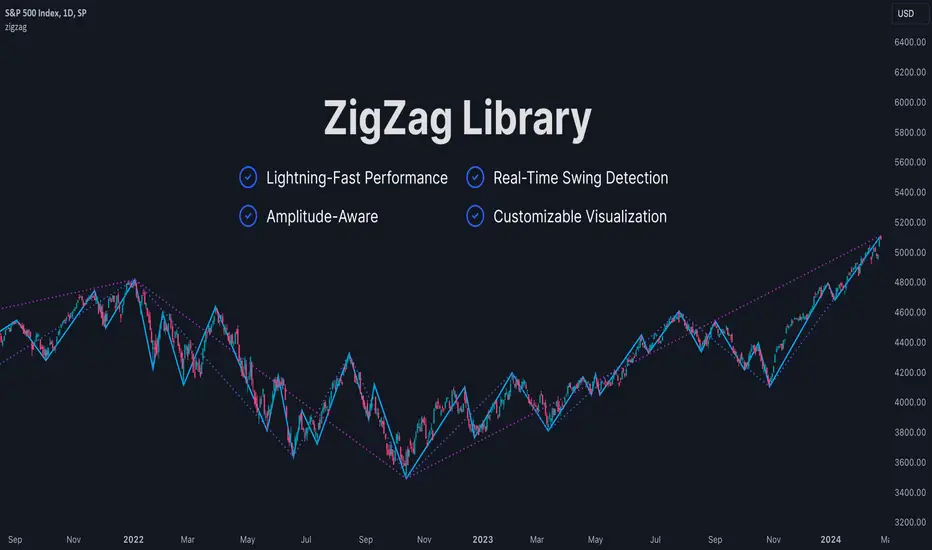
ZigZag LibraryThis is yet another ZigZag library.
🔵 Key Features
1. Lightning-Fast Performance : Optimized code ensures minimal lag and swift chart updates.
2. Real-Time Swing Detection : No more waiting for swings to finalize! This library continuously identifies the latest swing formation.
3. Amplitude-Aware : Discover significant swings earlier, even if they haven't reached the standard bar length.
4. Customizable Visualization : Draw ZigZag on-demand using polylines for a tailored analysis experience.
Stay tuned for more features as this library is being continuously enhanced. For the latest updates, please refer to the release information.
🔵 API
// Import this library. Remember to check the latest version of this library and replace the version number below.
import algotraderdev/zigzag/1 as zz
// Initialize the ZigZag instance.
var zz.ZigZag zig = zz.ZigZag.new().init(
zz.Settings.new(
swingLen = 5,
lineColor = color.blue,
lineStyle = line.style_solid,
lineWidth = 1))
// Analyze the ZigZag using the latest bar's data.
zig.tick()
// Draw the ZigZag.
if barstate.islast
zig.draw()
Filter-Out Weak Pivot highs/lows, Swing highs/lows: MethodJust a simple indicator for refining the standard method of finding Pivot highs & Lows; Allowing user to filter-out weak/flat/rounded Pivot highs/lows
-Aim of this is to get pivot highs & pivot lows coded to print more in line with what the eye would naturally be drawn to as an obvious pivot high/low.
-This uses local moving average around the pivot high/low together with user-input ATR multiple, to create a condition for filtering out lacklustre pivot highs/lows.
-Thought i'd publish this separately as a tool that other coders might find useful.
//inputs//
~adjust looback/lookforward for Pivot highs/lows
~adjust 'spikiness' index to filter out less impressive pivot highs/lows (higher number = more selective)
'last red low / last green high' exitThis is a good alternative to pivot points and ma lines to find long and short exit points (stop loss prices) for a trade.
When you hear traders say "set the stop loss to the recent swing", this indicator seems to do a reasonable job of finding those.
This script marks
the low of the most recent red candle
the high of the most recent green candle
in order to help identify a reasonable stop loss exit point for long and short trades.
You can also specify a distance threshold to the stop loss point.
How to use it.
Decide how far from the current price the exit should be (default 1.5%)
Use your chosen trading strategy to identify a long or short entry position
Add a long/short drawing to the close of the trade candle
Set the stop loos of your drawing to the exit line of this indicator
Set the take profit of your drawing using the desired risk to reward ratio
Note: A good rule is that if this indicator does not show a valid exit line, do not enter the trade.
Note: If the change of a new "last Green High" or the "last Red Low" is below 0.5%, the indicator will keep the previous values

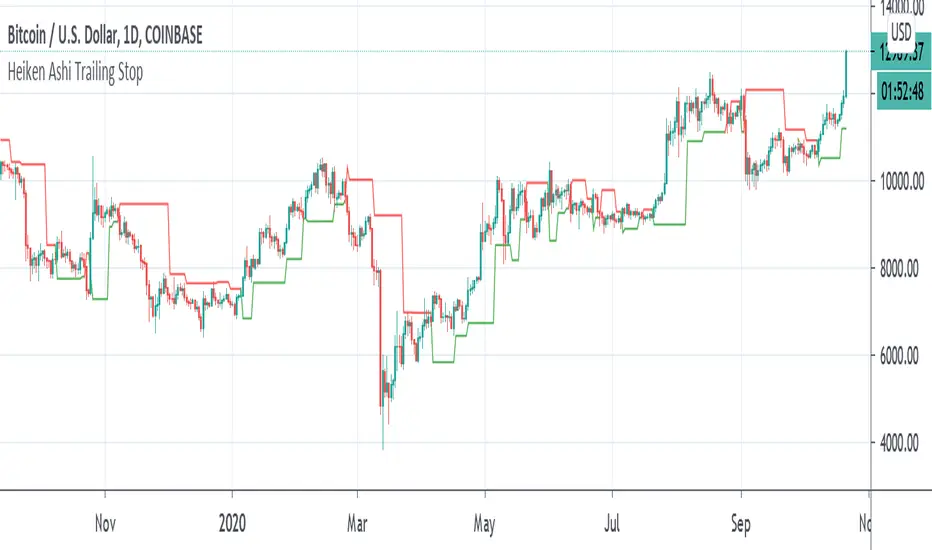
Heiken Ashi Pivot Breakout Trailing StopThis is a heiken ashi pivot based trailing stop for breakout entries and exits. It's possibly related to the Swing Index System by Welles Wilder or an alternative to it that I came up with, in case determining the swings on the Accumulative Swing Index is too much of a burden. It is believed that the ASI uses the calculation of heiken ashi in its formula. This does not use the ASI as a bottom indicator in the chart but instead uses the heiken ashi bars on the top of the chart to objectively find the swing pivots . These swings pivots act as support and resistance and can be used to confirm the start of a breakout or the end of one.
Suppose you find a chart pattern or setup, such as divergence or a pennant in the RSI , a pattern on the ASI, and/or on the chart, or the end of an elliot wave , etc and want to confirm a strong breakout and ride it to the end. Many trailing stops won't be able to confirm the beginning or would last too long or not long enough to exit out of one. On an uptrend, when the price breaks below the last swing low pivot , it can confirm the end of the breakout. On a downtrend, when the price breaks above the last swing high pivot , it can confirm the end of the breakout.
This trailing stop is not meant to replace trend following ones. The swing pivots can vary yet the price can still continue at an uptrend whereas this heiken ashi pivot based trailing stop exits as soon as it goes above or below the last resistance point. These swing points can end up being too close for trend following but can work well for breakout trading. The bigger the chart pattern or breakout, the more reliable the exit signal will be in my opinion. This is an experimental idea that I came up with from trying to interpret the ASI.
Pulse DPO: Major Cycle Tops and Bottoms█ OVERVIEW
Pulse DPO is an oscillator designed to highlight Major Cycle Tops and Bottoms .
It works on any market driven by cycles. It operates by removing the short-term noise from the price action and focuses on the market's cyclical nature.
This indicator uses a Normalized version of the Detrended Price Oscillator (DPO) on a 0-100 scale, making it easier to identify major tops and bottoms.
Credit: The DPO was first developed by William Blau in 1991.
█ HOW TO READ IT
Pulse DPO oscillates in the range between 0 and 100. A value in the upper section signals an OverBought (OB) condition, while a value in the lower section signals an OverSold (OS) condition.
Generally, the triggering of OB and OS conditions don't necessarily translate into swing tops and bottoms, but rather suggest caution on approaching a market that might be overextended.
Nevertheless, this indicator has been customized to trigger the signal only during remarkable top and bottom events.
I suggest using it on the Daily Time Frame , but you're free to experiment with this indicator on other time frames.
The indicator has Built-in Alerts to signal the crossing of the Thresholds. Please don't act on an isolated signal, but rather integrate it to work in conjunction with the indicators present in your Trading Plan.
█ OB SIGNAL ON: ENTERING OVERBOUGHT CONDITION
When Pulse DPO crosses Above the Top Threshold it Triggers ON the OB signal. At this point the oscillator line shifts to OB color.
When Pulse DPO enters the OB Zone, please beware! In this Area the Major Players usually become Active Sellers to the Public. While the OB signal is On, it might be wise to Consider Selling a portion or the whole Long Position.
Please note that even though this indicator aims to focus on major tops and bottoms, a strong trending market might trigger the OB signal and stay with it for a long time. That's especially true on young markets and on bubble-mode markets.
█ OB SIGNAL OFF: EXITING OVERBOUGHT CONDITION
When Pulse DPO crosses Below the Top Threshold it Triggers OFF the OB signal. At this point the oscillator line shifts to its normal color.
When Pulse DPO exits the OB Zone, please beware because a Major Top might just have occurred. In this Area the Major Players usually become Aggressive Sellers. They might wind up any remaining Long Positions and Open new Short Positions.
This might be a good area to Open Shorts or to Close/Reverse any remaining Long Position. Whatever you choose to do, it's usually best to act quickly because the market is prone to enter into panic mode.
█ OS SIGNAL ON: ENTERING OVERSOLD CONDITION
When Pulse DPO crosses Below the Bottom Threshold it Triggers ON the OS signal. At this point the oscillator line shifts to OS color.
When Pulse DPO enters the OS Zone, please beware because in this Area the Major Players usually become Active Buyers accumulating Long Positions from the desperate Public.
While the OS signal is On, it might be wise to Consider becoming a Buyer or to implement a Dollar-Cost Averaging (DCA) Strategy to build a Long Position towards the next Cycle. In contrast to the tops, the OS state usually takes longer to resolve a major bottom.
█ OS SIGNAL OFF: EXITING OVERSOLD CONDITION
When Pulse DPO crosses Above the Bottom Threshold it Triggers OFF the OS signal. At this point the oscillator line shifts to its normal color.
When Pulse DPO exits the OS Zone, please beware because a Major Bottom might already be in place. In this Area the Major Players become Aggresive Buyers. They might wind up any remaining Short Positions and Open new Long Positions.
This might be a good area to Open Longs or to Close/Reverse any remaining Short Positions.
█ WHY WOULD YOU BE INTERESTED IN THIS INDICATOR?
This indicator is built over a solid foundation capable of signaling Major Cycle Tops and Bottoms across many markets. Let's see some examples:
Early Bitcoin Years: From 0 to 1242
This chart is in logarithmic mode in order to properly display various exponential cycles. Pulse DPO is properly signaling the major early highs from 9-Jun-2011 at 31.50, to the next one on 9-Apr-2013 at 240 and the epic top from 29-Nov-2013 at 1242.
Due to the massive price movements, the OB condition stays pinned during most of the exponential price action. But as you can see, the OB condition quickly vanishes once the Cycle Top has been reached. As the market matures, the OB condition becomes more exceptional and triggers much closer from the Cycle Top.
With regards to Cycle Bottoms, the early bottom of 2 after having peaked at 31.50 doesn’t get captured by the indicator. That is the only cycle bottom that escapes the Pulse DPO when the bottom threshold is set at a value of 5. In that event, the oscillator low reached 6.95.
Bitcoin Adoption Spreading: From 257 to 73k
This chart is in logarithmic mode in order to properly display various exponential cycles. Pulse DPO is properly signaling all the major highs from 17-Dec-2017 at 19k, to the next one on 14-Apr-2021 at 64k and the most recent top from 9-Nov-2021 at 68k.
During the massive run of 2017, the OB condition still stayed triggered for a few weeks on each swing top. But on the next cycles it started to signal only for a few days before each swing top actually happened. The OB condition during the last cycle top triggered only for 3 days. Therefore the signal grows in focus as the market matures.
At the time of publishing this indicator, Bitcoin printed a new All Time High (ATH) on 13-Mar-2024 at 73k. That run didn’t trigger the OB condition. Therefore, if the indicator is correct the Bitcoin market still has some way to grow during the next months.
With regards to Cycle Bottoms, the bottom of 3k after having peaked at19k got captured within the wide OS zone. The bottom of 15k after having peaked at 68k got captured too within the OS accumulation area.
Gold
Pulse DPO behaves surprisingly well on a long standing market such as Gold. Moving back to the 197x years it’s been signaling most Cycle Tops and Bottoms with precision. During the last cycle, it shows topping at 2k and bottoming at 1.6k.
The current price action is signaling OB condition in the range of 2.5k to 2.7k. Looking at past cycles, it tends to trigger on and off at multiple swing tops until reaching the final cycle top. Therefore this might indicate the first wave within a potential gold run.
Oil
On the Oil market, we can see that most of the cycle tops and bottoms since the 80s got signaled. The only exception being the low from 2020 which didn’t trigger.
EURUSD
On Forex markets the Pulse DPO also behaves as expected. Looking back at EURUSD we can see the marketing triggering OB and OS conditions during major cycle tops and bottoms from recent times until the 80s.
S&P 500
On the S&P 500 the Pulse DPO catched the lows from 2016 and 2020. Looking at present price action, the recent ATH didn’t trigger the OB condition. Therefore, the indicator is allowing room for another leg up during the next months.
Amazon
On the Amazon chart the Pulse DPO is mirroring pretty accurately the major swings. Scrolling back to the early 2000s, this chart resembles early exponential swings in the crypto space.
Tesla
Moving onto a younger tech stock, Pulse DPO captures pretty accurately the major tops and bottoms. The chart is shown in logarithmic scale to better display the magnitude of the moves.
█ SETTINGS
This indicator is ideal for identifying major market turning points while filtering out short-term noise. You are free to adjust the parameters to align with your preferred trading style.
Parameters : This section allows you to customize any of the Parameters that shape the Oscillator.
Oscillator Length: Defines the period for calculating the Oscillator.
Offset: Shifts the oscillator calculation by a certain number of periods, which is typically half the Oscillator Length.
Lookback Period: Specifies how many bars to look back to find tops and bottoms for normalization.
Smoothing Length: Determines the length of the moving average used to smooth the oscillator.
Thresholds : This section allows you to customize the Thresholds that trigger the OB and OS conditions.
Top: Defines the value of the Top Threshold.
Bottom: Defines the value of the Bottom Threshold.

Fine-tune Inputs: Gann + Laplace Smooth Volume Zone OscillatorUse this Strategy to Fine-tune inputs for the GannLSVZ0 Indicator.
Strategy allows you to fine-tune the indicator for 1 TimeFrame at a time; cross Timeframe Input fine-tuning is done manually after exporting the chart data.
I suggest using "Close all" input False when fine-tuning Inputs for 1 TimeFrame. When you export data to Excel/Numbers/GSheets I suggest using "Close all" input as True, except for the lowest TimeFrame.
MEANINGFUL DESCRIPTION:
The Volume Zone oscillator breaks up volume activity into positive and negative categories. It is positive when the current closing price is greater than the prior closing price and negative when it's lower than the prior closing price. The resulting curve plots through relative percentage levels that yield a series of buy and sell signals, depending on level and indicator direction.
The Gann Laplace Smoothed Volume Zone Oscillator GannLSVZO is a refined version of the Volume Zone Oscillator, enhanced by the implementation of the upgraded Discrete Fourier Transform, the Laplace Stieltjes Transform. Its primary function is to streamline price data and diminish market noise, thus offering a clearer and more precise reflection of price trends.
By combining the Laplace with Gann Swing Entries and with Ehler's white noise histogram, users gain a comprehensive perspective on volume-related market conditions.
HOW TO USE THE INDICATOR:
The default period is 2 but can be adjusted after backtesting. (I suggest 5 VZO length and NoiceR max length 8 as-well)
The VZO points to a positive trend when it is rising above the 0% level, and a negative trend when it is falling below the 0% level. 0% level can be adjusted in setting by adjusting VzoDifference. Oscillations rising below 0% level or falling above 0% level result in a natural trend.
HOW TO USE THE STRATEGY:
Here you fine-tune the inputs until you find a combination that works well on all Timeframes you will use when creating your Automated Trade Algorithmic Strategy. I suggest 4h, 12h, 1D, 2D, 3D, 4D, 5D, 6D, W and M.
When Indicator/Strategy returns 0 or natural trend, Strategy Closes All it's positions.
ORIGINALITY & USFULLNESS:
Personal combination of Gann swings and Laplace Stieltjes Transform of a price which results in less noise Volume Zone Oscillator.
The Laplace Stieltjes Transform is a mathematical technique that transforms discrete data from the time domain into its corresponding representation in the frequency domain. This process involves breaking down a signal into its individual frequency components, thereby exposing the amplitude and phase characteristics inherent in each frequency element.
This indicator utilizes the concept of Ehler's Universal Oscillator and displays a histogram, offering critical insights into the prevailing levels of market noise. The Ehler's Universal Oscillator is grounded in a statistical model that captures the erratic and unpredictable nature of market movements. Through the application of this principle, the histogram aids traders in pinpointing times when market volatility is either rising or subsiding.
The Gann swing strategy is developed by meomeo105, this Gann high and low algorithm forms the basis of the EMA modification.
DETAILED DESCRIPTION:
My detailed description of the indicator and use cases which I find very valuable.
What is oscillator?
Oscillators are chart indicators that can assist a trader in determining overbought or oversold conditions in ranging (non-trending) markets.
What is volume zone oscillator?
Price Zone Oscillator measures if the most recent closing price is above or below the preceding closing price.
Volume Zone Oscillator is Volume multiplied by the 1 or -1 depending on the difference of the preceding 2 close prices and smoothed with Exponential moving Average.
What does this mean?
If the VZO is above 0 and VZO is rising. We have a bullish trend. Most likely.
If the VZO is below 0 and VZO is falling. We have a bearish trend. Most likely.
Rising means that VZO on close is higher than the previous day.
Falling means that VZO on close is lower than the previous day.
What if VZO is falling above 0 line?
It means we have a high probability of a bearish trend.
Thus the indicator returns 0 and Strategy closes all it's positions when falling above 0 (or rising bellow 0) and we combine higher and lower timeframes to gauge the trend.
What is approximation and smoothing?
They are mathematical concepts for making a discrete set of numbers a
continuous curved line.
Laplace Stieltjes Transform approximation of a close price are taken from aprox library.
Key Features:
You can tailor the Indicator/Strategy to your preferences with adjustable parameters such as VZO length, noise reduction settings, and smoothing length.
Volume Zone Oscillator (VZO) shows market sentiment with the VZO, enhanced with Exponential Moving Average (EMA) smoothing for clearer trend identification.
Noise Reduction leverages Euler's White noise capabilities for effective noise reduction in the VZO, providing a cleaner and more accurate representation of market dynamics.
Choose between the traditional Fast Laplace Stieltjes Transform (FLT) and the innovative Double Discrete Fourier Transform (DTF32) soothed price series to suit your analytical needs.
Use dynamic calculation of Laplace coefficient or the static one. You may modify those inputs and Strategy entries with Gann swings.
I suggest using "Close all" input False when fine-tuning Inputs for 1 TimeFrame. When you export data to Excel/Numbers/GSheets I suggest using "Close all" input as True, except for the lowest TimeFrame. I suggest using 100% equity as your default quantity for fine-tune purposes. I have to mention that 100% equity may lead to unrealistic backtesting results. Be avare. When backtesting for trading purposes use Contracts or USDT.

Pivots and SwingsThis indicator displays simple pivots of varying degrees and connects them into swings whilst displaying the information of each swing.
First order pivot highs are confirmed when the N number of bars each side of the bar in question have a lower high whilst a first order pivot low is confirmed when the N number of bars on each side of the bar in question have a higher low. In this script N is set to 2 as a default, so when the middle bar of a set of 5 bars has the highest high, then it is considered a first order pivot high and vice versa for lows.
Second order pivot highs are confirmed when a first order pivot is higher than the first order pivot points on either side of the pivot point in question. Second order pivot lows are confirmed when a first order pivot low is lower than the first order pivot lows either side of the pivot in question.
Third order pivots follow the same logic but consider the highest and lowest second order pivots
A quick note on how the bars are coloured basis trends. If price breaks through the last first order pivot high, the bars will be coloured in a (default) green sequence and will stay green until price moves back below the most recent first order pivot low, at which time it will revert to a (default) red sequence.
The information about the duration and magnitude of the swings are displayed in an effort to identify when a swing leg of an overall trend may be shortening which signifies a weakening trend, or lengthening to signify a trend that is gaining in strength.
I hope you find this indicator useful!

Price Pivots for NSE Index & F&O StocksPrice Pivots for NSE Index & F&O Stocks
What is this Indicator?
• This indicator calculates the price range a Stock or Index can move in a Day, Week or Month.
Advantages of this Indicator
• This is a Leading indicator, not Dynamic or Repaint.
• Helps to identify the tight range of price movement.
• Can easily identify the Options strike price.
• The levels are more reliable and authentic than Gann Square of 9 Levels.
• Develops a discipline in placing Targets.
Disadvantages of this Indicator
• The indicator is specifically made for National Stock Exchange of India (NSE) listed index and stocks.
• The indicator is calculated only for index NIFTY, BANKNIFTY, FINNIFTY, MIDCPNIFTY and Stocks listed in Futures and Options.
• The indicator shows nothing for other indexes and stocks other than above mentioned.
• The data need to be entered manually.
• The data need to be updated manually when the F&O listed stocks are updated.
Who to use?
Highly beneficial for Day Traders, it can be used for Swing and Positions as well.
What timeframe to use?
• Any timeframe.
• The highlighted levels in Red and Green will not show correct levels in 1 minute timeframe.
• 5min is recommended for Day Traders.
When to use?
• Wait for proper swing to form.
• Recommended to avoid 1st 1 hour or market open, that is 9.15am to 10.15 or 10.30am.
• Within this time a proper swing will be formed.
How to use?
Entry
• Enter when the Price reach closer to the Blue line.
• Enter Long when the Price takes a pullback or breakout at the Red lines.
Exit
• Exit position when the Price reach closer to the Red lines in Long positions.
What are the Lines?
Gray Lines:
• Every lines with price labels are the Strike Prices in the Option Chain from NSE website.
• Price moves from 1 Strike Price level to another.
• The dashed lines are average levels of 2 Strike Prices.
Red & Green Lines:
• The Red and Green Lines will appear only after the first 1 hour.
• The levels are calculated based on the 1st 1 hour.
• Red Lines are important Resistance levels, these are strong Bearish reversal points. It is also a breakout level, this need to be figured out from the past levels, trend, percentage change and consolidation.
• Green Lines are important Support levels, these are strong Bullish reversal points. It is also a breakdown level, this need to be figured out from the past levels, trend, percentage change and consolidation.
What are the Labels?
• First Number: Price of that level.
• Numbers in (): Percentage change and Change of price from LTP(Last Traded Price) to that Level.
How to use?
Entry:
• Enter when price is closer to the Red or Green lines.
• Enter after considering previous Swing and Trend.
• Note the 50% of previous Swing.
• Enter Short when price reverse from each level.
• If 50% of swing and the pivot level is closer it can be a good entry.
Exit:
• Use the logic of Entry, each level can be a target.
• Exit when price is closer to the Red or Green lines.
Indicator Menu
Source
• Custom: Enter the price manually after choosing the Source as Custom to show the Pivots at that price.
• LTP: Pivot is calculated based on Last Traded Price.
• Day Open: Pivot is calculated based on current day opening price.
• PD Close: Pivot is calculated based on previous day closing price.
• PD HL2: Pivot is calculated based on previous day average of High and Low.
• PD HLC3: Pivot is calculated based on previous day average of High, Low and Close.
"Time (IST) (Vertical)"
• This is a marker of every 1 hour.
• Usually major price movement happen between previous day last 1 hour (2:15 pm) to today first 1 hour (10:15 pm).
• Two swings can happen between first 2 hour of current day.
• At the end of the day last 1 hour from 2.15 pm another important movement will happen.
• Usually rest of the time won't show any interesting movement.
To the Users
• Certain symbols may show the levels as a single line. For such symbols choose a different Source or Timeframe from the indicator menu.
• Please inform if any of the Symbol's price levels don't react to the pivots, include the Symbol a well.
• Also inform if you notice any wrong values, errors or abnormal behavior in the indicator.
• Feel free to suggest or adding new features and options.
General Tips
• It is good if Stock trend is same as that of NIFTY trend.
• Lots of indicators creates lots of confusion.
• Keep the chart simple and clean.
• Buy Low and Sell High.
• Master averages or 50%.
• Previous Swing High and Swing Low are crucial.

Fibonacci Sequence Grid [BigBeluga]🔵 OVERVIEW
A geometric price mapping tool that projects Fibonacci sequence levels and grid structures from recent price swings to help traders visualize natural expansion and reversion zones.
This indicator overlays Fibonacci-based structures directly on the chart, utilizing both grid projections and horizontal levels based on the classic Fibonacci integer sequence (0, 1, 1, 2, 3, 5, 8, ...). It identifies recent swing highs or lows and builds precision-aligned levels based on the trend direction.
🔵 CONCEPTS
Uses the Fibonacci integer sequence (not ratios) to define distances from the most recent swing point.
Identifies a trend based on EMA cross of fast and slow periods.
Projects two types of Fibonacci tools:
A grid projection from the swing point, displaying multiple sloped levels based on the sequence.
A set of horizontal Fibonacci levels for clean structural references.
Levels can be plotted from either swing low or high depending on the current trend direction.
Adjustable “Size” inputs control spacing between levels for better price alignment.
Lookback period defines how far the script searches for recent swing extremes.
🔵 FEATURES
Fibonacci Grid Projection:
Draws two mirrored Fibonacci grids—one expanding away from the swing high/low, the other converging toward price.
Swing-Based Trend Detection:
Uses a fast/slow EMA crossover to determine trend direction and reference swing points for projections.
Fibonacci Sequence Levels:
Displays horizontal levels based on the Fibonacci number sequence (0, 1, 2, 3, 5, 8, 13, 21...) for natural price targets.
Dynamic Labels and Coloring:
Each level is labeled with its sequence value and colored based on trend direction (e.g., red = downtrend, green = uptrend).
Both grids and levels can be toggled on/off independently.
Sizing controls allow tighter or looser clustering of levels depending on chart scale.
🔵 HOW TO USE
Enable Fibonacci Grid to visualize price expansion zones during impulsive trends.
Use Fibonacci Levels as horizontal support/resistance or target zones.
A label below price means the current trend is up and levels are projected from swing low.
A label above price means trend is down and levels are projected from swing high.
Adjust “Size” input to fit grid/level projection to your preferred chart scale or instrument volatility.
Use in confluence with price action, trend indicators, or volume tools for layered trading decisions.
🔵 CONCLUSION
Fibonacci Sequence Grid reimagines Fibonacci analysis using whole-number spacing from natural math progressions. Whether used for projecting grid-based expansions or horizontal support/resistance zones, it provides a powerful and intuitive structure to trade within. Perfect for traders who rely on symmetry, market geometry, and mathematically consistent levels.

CNE - Efficient Swing Structure + MomentumThe CNE Efficient Swing Structure and Momentum indicator is a sophisticated technical analysis tool designed to quantify the strength and exhaustion of price movements relative to genuine market structure rather than arbitrary time constraints. Unlike traditional oscillators that reset based on a fixed number of candles, this indicator anchors its calculations to confirmed structural pivots. The foundation of the system is a volatility-adaptive swing detection algorithm that utilizes the Average True Range (ATR) to filter out insignificant noise. A trend change is only registered when price retraces against the current direction by a user-defined multiple of the ATR, ensuring that the tool remains locked onto the prevailing trend until a statistically significant reversal occurs. This mechanism allows the trader to view momentum as a cumulative force continuously building from a verified low or high, providing a pure view of the current leg's intensity.
Once a structural anchor is established, the indicator calculates the "Pivot-to-Pivot" momentum, displaying the percent change from the start of the trend to the current price. This creates a zero-based oscillator where the zero line represents the structural origin—the absolute bottom of the current uptrend or the absolute top of the current downtrend. To contextualize this raw data, the script overlays dynamic statistical bands based on standard deviations. These bands function similarly to Bollinger Bands but are applied to the momentum of the swing itself. When the momentum histogram pushes into the outer deviation bands, specifically beyond two standard deviations, it signals that the current move is statistically overextended relative to the asset's recent volatility profile. This helps traders distinguish between a healthy, sustainable trend and a climactic move that is prone to a mean-reversion snapback.
A critical feature of this system is its ability to visualize the "average extension" of market moves, providing an immediate benchmark for trade management and target setting. The indicator plots two distinct sets of lines for both upward extensions and downward drawdowns without relying on heavy historical arrays, ensuring optimal computational efficiency. The first is a solid step-line representing the historical average of all past swings, serving as a long-term baseline for what constitutes a "normal" move. The second is a dotted marker representing a recency-weighted average, heavily biased toward the last five swings. By comparing these two lines, a trader can instantly gauge the changing market regime; if the recent weighted average is expanding away from the historical baseline, volatility is increasing, whereas a contracting recent average suggests the market is entering a period of compression.
Finally, the indicator integrates automated divergence detection based on structural flips rather than simple candle-to-candle comparisons. It records the peak momentum value of every completed trend leg and compares it to the peak of the previous leg in the same direction. If price makes a new structural high but the momentum oscillator fails to surpass the peak of the previous uptrend leg, a bearish divergence is flagged. Conversely, if price pushes to a new structural low with weaker downside momentum than the prior drop, a bullish divergence is highlighted. This combination of volatility-filtered structure, statistical deviation bands, efficiency-optimized extension targets, and structural divergence creates a comprehensive framework for assessing the probability of trend continuation versus reversal.

Inside SwingsOverview
The Inside Swings indicator identifies and visualizes "inside swing" patterns in price action. These patterns occur when price creates a series of pivots that form overlapping ranges, indicating potential consolidation or reversal zones.
What are Inside Swings?
Inside swings are specific pivot patterns where:
- HLHL Pattern: High-Low-High-Low sequence where the first high is higher than the second high, and the first low is lower than the second low
- LHLH Pattern: Low-High-Low-High sequence where the first low is lower than the second low, and the first high is higher than the second high
Here an Example
These patterns create overlapping price ranges that often act as:
- Support/Resistance zones
- Consolidation areas
- Potential reversal points
- Breakout levels
Levels From the Created Range
Input Parameters
Core Settings
- Pivot Lookback Length (default: 5): Number of bars on each side to confirm a pivot high/low
- Max Boxes (default: 100): Maximum number of patterns to display on chart
Extension Settings
- Extend Lines: Enable/disable line extensions - this extends the Extremes of the Swings to where a new Swing Started or Extended Right for the Latest Inside Swings
- Show High 1 Line: Display first high/low extension line
- Show High 2 Line: Display second high/low extension line
- Show Low 1 Line: Display first low/high extension line
- Show Low 2 Line: Display second low/high extension line
Visual Customization
Box Colors
- HLHL Box Color: Color for HLHL pattern boxes (default: green)
- HLHL Border Color: Border color for HLHL boxes
- LHLH Box Color: Color for LHLH pattern boxes (default: red)
- LHLH Border Color: Border color for LHLH boxes
Line Colors
- HLHL Line Color: Extension line color for HLHL patterns
- LHLH Line Color: Extension line color for LHLH patterns
- Line Width: Thickness of extension lines (1-5)
Pattern Detection Logic
HLHL Pattern (Bullish Inside Swing)
Condition: High1 > High2 AND Low1 < Low2
Sequence: High → Low → High → Low
Visual: Two overlapping boxes with first range encompassing second
Detection Criteria:
1. Last 4 pivots form High-Low-High-Low sequence
2. Fourth pivot (first high) > Second pivot (second high)
3. Third pivot (first low) < Last pivot (second low)
LHLH Pattern (Bearish Inside Swing)
Condition: Low1 < Low2 AND High1 > High2
Sequence: Low → High → Low → High
Visual: Two overlapping boxes with first range encompassing second
Detection Criteria:
1. Last 4 pivots form Low-High-Low-High sequence
2. Fourth pivot (first low) < Second pivot (second low)
3. Third pivot (first high) > Last pivot (second high)
Visual Elements
Boxes
- Box 1: Spans from first pivot to last pivot (larger range)
- Box 2: Spans from third pivot to last pivot (smaller range)
- Overlap: The intersection of both boxes represents the inside swing zone
Extension Lines
- High 1 Line: Horizontal line at first high/low level
- High 2 Line: Horizontal line at second high/low level
- Low 1 Line: Horizontal line at first low/high level
- Low 2 Line: Horizontal line at second low/high level
Line Extension Behavior
- Historical Patterns: Lines extend until the next pattern starts
- Latest Pattern: Lines extend to the right edge of chart
- Dynamic Updates: All lines are redrawn on each bar for accuracy
Trading Applications
Support/Resistance Levels
Inside swing levels often act as:
- Dynamic support/resistance
- Breakout confirmation levels
- Reversal entry points
Pattern Interpretation
- HLHL Patterns: Potential bullish continuation or reversal
- LHLH Patterns: Potential bearish continuation or reversal
- Overlap Zone: Key area for price interaction
Entry Strategies
1. Breakout Strategy: Enter on break above/below inside swing levels
2. Reversal Strategy: Enter on bounce from inside swing levels
3. Range Trading: Trade between inside swing levels
Technical Implementation
Data Structures
type InsideSwing
int startBar // First pivot bar
int endBar // Last pivot bar
string patternType // "HLHL" or "LHLH"
float high1 // First high/low
float low1 // First low/high
float high2 // Second high/low
float low2 // Second low/high
box box1 // First box
box box2 // Second box
line high1Line // High 1 extension line
line high2Line // High 2 extension line
line low1Line // Low 1 extension line
line low2Line // Low 2 extension line
bool isLatest // Latest pattern flag
Memory Management
- Pattern Storage: Array-based storage with automatic cleanup
- Pivot Tracking: Maintains last 4 pivots for pattern detection
- Resource Cleanup: Automatically removes oldest patterns when limit exceeded
Performance Optimization
- Duplicate Prevention: Checks for existing patterns before creation
- Efficient Redraw: Only redraws lines when necessary
- Memory Limits: Configurable maximum pattern count
Usage Tips
Best Practices
1. Combine with Volume: Use volume confirmation for breakouts
2. Multiple Timeframes: Check higher timeframes for context
3. Risk Management: Set stops beyond inside swing levels
4. Pattern Validation: Wait for confirmation before entering
Common Scenarios
- Consolidation Breakouts: Inside swings often precede significant moves
- Reversal Zones: Failed breakouts at inside swing levels
- Trend Continuation: Inside swings in trending markets
Limitations
- Lagging Indicator: Patterns form after completion
- False Signals: Not all inside swings lead to significant moves
- Market Dependent: Effectiveness varies by market conditions
Customization Options
Visual Adjustments
- Modify colors for different market conditions
- Adjust line widths for visibility
- Enable/disable specific elements
Detection Sensitivity
- Increase pivot length for smoother patterns
- Decrease for more sensitive detection
- Balance between noise and signal
Display Management
- Control maximum pattern count
- Adjust cleanup frequency
- Manage memory usage
Conclusion
The Inside Swings indicator provides a systematic approach to identifying consolidation and potential reversal zones in price action. By visualizing overlapping pivot ranges
The indicator's strength lies in its ability to:
- Identify key price levels automatically
- Provide visual context for market structure
- Offer flexible customization options
- Maintain performance through efficient memory management

Pivot-based Swing Highs and LowsRelease Notes for Pivot-based Swing Highs and Lows Indicator with HH, HL, LH, LL and Labels
Version 1.0.0
Release Date: 29th Sept 2024
Overview:
This Pine Script version 5 indicator is designed to identify and display Swing Highs and Swing Lows based on pivot points. The indicator visually marks Higher Highs (HH), Lower Highs (LH), Higher Lows (HL), and Lower Lows (LL) on the chart. The release introduces an improved visual representation with dotted lines and colored labels for easy identification of market structure, using plotshape() and line.new().
Key Features:
1. Pivot-Based Swing Identification:
The indicator uses ta.pivothigh() and ta.pivotlow() to detect significant pivot points on the chart.
The length of the pivot can be adjusted through the pivot_length parameter, allowing users to customize the sensitivity of swing identification.
2. Swing Highs and Lows with Labels:
Higher High (HH) and Lower High (LH) points are marked with green downward triangles.
Higher Low (HL) and Lower Low (LL) points are marked with red upward triangles.
The plotshape() function is used to provide clear visual markers, making it easy to spot the changes in market structure.
3. Dotted Line Visuals:
Green Dotted Lines: Connect Higher Highs (HH) and Higher Lows (HL) to their corresponding previous swings.
Red Dotted Lines: Connect Lower Highs (LH) and Lower Lows (LL) to their corresponding previous swings.
The use of color-coded dotted lines ensures better visual understanding of the trend continuation or reversal patterns.
4. Customizable Input:
The user can adjust the pivot_length parameter to fine-tune the detection of pivot highs and lows according to different timeframes or trading strategies.
Usage:
Higher High (HH): Green downward triangle, indicating a new high compared to the previous pivot high.
Lower High (LH): Green downward triangle, indicating a lower high compared to the previous pivot high.
Higher Low (HL): Red upward triangle, indicating a higher low compared to the previous pivot low.
Lower Low (LL): Red upward triangle, indicating a new lower low compared to the previous pivot low.
Dotted Lines: Connect previous swing points, helping users visualize the trend and potential market structure changes.
Improvements:
Label Substitution: In place of label.new() (which might cause issues in some environments), the indicator now uses plotshape() to provide a reliable and visually effective solution for marking swings.
Streamlined Performance: The logic for determining higher highs, lower highs, higher lows, and lower lows has been optimized for smooth performance across multiple timeframes.
Known Limitations:
No Direct Text Labels: Due to the constraints of plotshape(), text labels like "HH", "LH", "HL", and "LL" are not directly displayed. Instead, color-coded shapes are used for easy identification.
How to Use:
Apply the script to your chart via the TradingView Pine Editor.
Customize the pivot_length to suit your trading style or the timeframe you are analyzing.
Monitor the chart for marked Higher Highs, Lower Highs, Higher Lows, and Lower Lows for potential trend continuation or reversal opportunities.
Use the dotted lines to trace the evolution of market structure.
Please share your comments, thoughts. Also please follow me for more scripts in future. Mean time Happy Trading :)

FVG (ICT) with Swing LevelsThis indicator, called "Fair Value Gaps (ICT) with Swing Levels", overlays on the main chart and does the following:
Initial Setup:
It defines user-adjustable parameters:
lookback: Lookback period to keep FVGs visible.
swingPeriod: Period for calculating swing highs and lows.
bullColor and bearColor: Colors for bullish and bearish FVGs.
Fair Value Gaps (FVGs) Detection:
Uses a function to identify FVGs by comparing candle high and low prices.
A bullish FVG forms when the low of two candles ago is higher than the high of the current candle.
A bearish FVG forms when the high of two candles ago is lower than the low of the current candle.
Swing Levels Calculation:
Calculates swing highs and lows over the specified period.
These swing levels define the current market range.
Current Range Verification:
Implements a function to check if an FVG is within the range defined by swing levels.
This ensures only the most relevant FVGs for the current market situation are displayed.
FVG Drawing:
When it detects an FVG (bullish or bearish) within the current range, it draws a box on the chart.
Boxes extend from the bar where the FVG formed to the current bar.
Bullish FVGs are drawn in green and bearish in red (colors are customizable).
Old FVGs Management:
On each new bar, the indicator checks all existing FVG boxes.
It removes boxes that are outside the specified lookback period.
It also removes boxes that are no longer within the current range of swing levels.
Swing Levels Visualization:
Draws lines on the chart to show swing highs (in blue) and swing lows (in purple).
These lines help visualize the current market range.
Continuous Update:
The indicator updates on each new candle, constantly refreshing FVGs and swing levels.
In summary, this indicator identifies and visualizes Fair Value Gaps according to the ICT methodology, filtering them based on higher timeframe swing levels. This helps traders focus on the most significant FVGs within the current market context, reducing visual noise and potentially improving trading decision-making.

Liquidity Sweeps [LuxAlgo]The Liquidity Sweeps indicator detects the presence of liquidity sweeps on the user's chart, while also providing potential areas of support/resistance or entry when Liquidity levels are taken.
In the event of a Liquidity Sweep a Sweep Area is created which may provide further areas of interest.
🔶 USAGE
A Liquidity Sweep occurs when the price breaks through a liquidity level (further referred to as LqL ), after which the price returns below/above the liquidity level , forming a wick.
The script provides 2 options when this can happen:
A wick passes a LqL after which the price quickly returns.
First the closing price breaks through a LqL . After a while, the price retests the LqL and forms a wick in the opposite direction.
The examples above show a bullish and bearish scenario of "a wick passing through an LqL where the price quickly comes back". This type of Liquidity Sweep is represented by a dotted line.
The following example shows a broken LqL , where the price retests the Liquidity zone and bounces back.
Instead of a dotted line, this type of Liquidity Sweep is represented by a dashed line.
When a Liquidity Sweep takes place, this is indicated by highlighting the "wick- LqL " distance. This distance is also the basis for the Sweep Area (see next sub-section). A small 3-bar long dotted line starts from the opposite wick as an extra aid to determine potential support/resistance/entry, ...
Colors can be set in the settings (here yellow and aqua blue instead of default colors for clarity).
🔹 Sweep Areas
The distance between the LqL and the maximum limit of the wick forms a Sweep Area , which can provide a potential support/resistance or entry zone.
These examples show both types of Liquidity Sweeps , followed by a box indicating the Sweep Area .
When the Sweep Area is mitigated or a certain amount of bars has passed (Settings - 'Max bars'), the boxes will no longer be updated.
In this case, the 'Trigger' label shows the bar where the high crossed a LqL , after which a red box starts between LqL and high.
The low of the 'Trigger' bar is the starting point of a short dotted line. Next to the 'Trigger bar' the high touches the Sweep Area before returning, providing a potential short entry. One bar further, another entry opportunity presents itself when the price breaks the small dotted line.
In the following bullish example, not only do we see opportunities when the LqL has been swept, but the following Sweep Area provides some potential entries.
The small green dotted lines also act as a guide where the price breaks above, then forms a small range, after which the price continues in an upward direction.
Here, the initial trigger on the left forms a Sweep Area that is quickly broken. However, the small green line provides a potential entry area later on. The price moves in a short channel before breaking above the LqL (green dashed line), providing more potential entries. Price retests this LqL , and goes below this level. The price remained around the previously formed channel, after which the price resumed its upward trend.
🔶 SETTINGS
🔹 Liquidity Sweeps
Swings: Period used for the swing detection, with higher values returning longer term Liquidity Levels .
Options:
- Only Wicks: Only detects a Liquidity Sweep when a wick sweeps a previous wick
- Only Outbreaks & Retest: Only detects a Liquidity Sweep when the price breaks a Liquidity Level , returns & retests the Liquidity Level , and forms a wick in the opposite direction.
- Wicks + Outbreaks & Retest: Both options can be detected.
🔹 Sweep Area
Extend: Enables/Disables extension of the Sweep Area boxes.
Max Bars: Limit the extension to a certain number of bars.
Color Sweep Area box.

Bollinger %B Candles StrategyStrategy built based on earlier published indicator:
Looks to be doing good for short term swing trades. But, I am not sure if there is repainting. I tried to avoid buy/sell trades on same day - but wasn't successful.
So far back-tested on following:
COINBASE:BTCUSD - works on both long and short
CURRENCYCOM:GOLD and equities - long only.
Some of the failures: ASX:WPL , ASX:WHC , ASX:NHC
As usual for back-testing - using 1000 as initial capital with 100% invested on each trade and no compounding so that it will be easy to compare with buy and hold. Trade with caution :)

Next Candle PredictorAdvanced TradingView Indicator for Precise Buy and Sell Signals
Overview:
The Predicta Futures - Next Candle Predictor is a cutting-edge TradingView indicator designed to forecast the next candle's direction in futures and cryptocurrency markets. Leveraging a multi-indicator confluence strategy, this tool provides traders with actionable long and short prediction percentages, enhanced by dynamic ADX-based thresholds and visual projection candles. Ideal for scalping, day trading, or swing trading on platforms like MEXC or Binance futures, it combines Supertrend, MACD, RSI, Stochastic, ADX, and volume analysis to deliver high-probability buy and sell signals while minimizing false positives.
Key Features:
* Multi-Indicator Confluence Scoring: Integrates Supertrend for trend direction, EMAs (8, 21, 50) for alignment, MACD for momentum crossovers, RSI for overbought/oversold conditions, Stochastic for divergence detection, ADX for trend strength, and volume ratios for confirmation. A customizable confluence score (0-6) ensures signals meet user-defined criteria, reducing whipsaws in volatile markets.
* Dynamic Prediction Thresholds: ADX-driven adjustments lower the required prediction percentage (e.g., 60% in strong trends) for "PERFECT TIME" entries, adapting to market conditions like ranging or trending phases.
* Visual Analysis Table: A sleek, color-coded dashboard displays progress bars for each indicator, prediction percentages, and status (e.g., "PERFECT TIME" or "WAIT"). Supports long and short analyses with intuitive ASCII bars for quick scans.
* Projection Candles: Simulates potential next-candle outcomes with volatility-scaled (via Bollinger Bands width) green long and red short candles, aiding in visualizing price targets.
Buy/Sell Signals and Alerts: Generates labeled "BUY" and "SELL" arrows on EMA crossovers within confirmed trends, with separate alerts for basic signals and high-confluence "PERFECT TIME" opportunities.
* Customizable Inputs: Adjust ATR periods, Supertrend factors, minimum confluence scores, and volume ratios to tailor the indicator for stocks, forex, or crypto perpetual futures.
How It Works:
This TradingView script calculates long and short scores using weighted contributions from key indicators, normalizing them into prediction percentages. A confluence check—factoring trend, EMA alignment, MACD, Stochastic, volume, and ADX—triggers "PERFECT TIME" only when conditions align robustly. For example:
In a downtrend (Supertrend red), with bearish MACD and Stochastic, and sufficient volume, the indicator highlights short opportunities.
Dynamic thresholds ensure aggressive entries in strong trends (ADX >25) and conservative ones in weak trends.
Backtested for reliability, it excels in identifying reversals and continuations, making it a must-have for traders seeking an edge in futures trading strategies.
Usage Instructions:
1. Add the indicator to your TradingView chart.
2. Customize settings via the inputs panel (e.g., set minConfluence to 5 for stricter signals).
3. Monitor the analysis table for predictions and confluence scores.
4. Act on "BUY/SELL" labels or "PERFECT TIME" alerts, combining with your risk management.
5. Enable projection candles for visual forecasting of the next bar.
Compatible with all timeframes, from 1-minute scalping to daily swings. Note: This is not financial advice; always verify signals with additional analysis.
Rate and review if it boosts your trades!
Thank you!

ATR Distance from 50 SMA By DanBobDanA simple indicator that measures the distance between current price and the 50 SMA
The average momentum swing trade might run 7 times the ATR before pulling back
Therefore, its recommended to not buy a stock that is beyond 4 times its ATR to the 50 SMA
This script will quickly and easily calculate the 50 SMA to ATR distance for you

Asia & London Session Boxes (NY Time) + 4H SwingsAsia & London Session Boxes + 4H Swings
Description
A multi-timeframe session analysis tool designed for forex and futures traders operating on NY time. This indicator visualizes major trading sessions with automatic high/low range boxes while simultaneously tracking 4-hour swing levels, giving you a complete picture of institutional trading activity and key price levels.
How It Works
Session Boxes (NY Time Zone)
Asia Session (20:00 – 00:00 NY): Blue-shaded box marking the complete range from open to close
London Session (02:00 – 06:00 NY): Yellow-shaded box capturing the high-volatility London open
Each session box automatically records the highest high and lowest low during that timeframe, providing instant reference for session extremes and potential supply/demand zones.
4-Hour Swing Levels
Detects swing highs and lows on a 30-minute timeframe for ultra-responsive level identification
Red lines: Swing highs (resistance levels)
Green lines: Swing lows (support levels)
Lines extend to the right for continuous monitoring
Auto-removes touched levels: When price breaches a swing, it automatically deletes that level to keep your chart clean and focused on active levels
Key Features
Session-Based Trading Analysis: Identify which session created important price levels and ranges
Multi-Timeframe Architecture: Analyzes 30-minute swings while tracking 4-hour patterns on your current chart
Smart Level Cleanup: Touched swings automatically remove themselves, eliminating clutter
NY Time Conversion: All times automatically adjust to your NY timezone for consistency
Institutional Perspective: View exactly where institutions are trading during major session hours
Zero Lag Detection: Real-time identification of swing extremes
Ideal For
Forex traders (especially EUR/USD, GBP/USD) targeting session breakouts
Scalpers and swing traders needing precise support/resistance levels
Market structure traders analyzing institutional price action
Session traders looking to trade Asia/London opens
1-minute to 4-hour timeframe charts
Trading Applications
Trade Asia session breakouts into London
Identify liquidity zones from previous sessions
Detect swing extremes for entry/exit planning
Confirm trend direction using multi-session structure
Find support/resistance on intraday pullbacks
Default Settings Optimized For
NASDAQ futures and forex pairs
Scalping and short-term swing trading
NY timezone trading (automatically converts UTC-4)
30-minute swing detection for precise level identification

RSI Failure Swing Pattern (with Alerts & Targets)RSI Failure Swing Pattern Indicator – Detailed Description
Overview
The RSI Failure Swing Pattern Indicator is a trend reversal detection tool based on the principles of failure swings in the Relative Strength Index (RSI). This indicator identifies key reversal signals by analyzing RSI swings and confirming trend shifts using predefined overbought and oversold conditions.
Failure swing patterns are one of the strongest RSI-based reversal signals, initially introduced by J. Welles Wilder. This indicator detects these patterns and provides clear buy/sell signals with labeled entry, stop-loss, and profit target levels. The tool is designed to work across all timeframes and assets.
How the Indicator Works
The RSI Failure Swing Pattern consists of two key structures:
1. Bullish Failure Swing (Buy Signal)
Occurs when RSI enters oversold territory (below 30), recovers, forms a higher low above the oversold level, and finally breaks above the intermediate swing high in RSI.
Step 1: RSI dips below 30 (oversold condition).
Step 2: RSI rebounds and forms a local peak.
Step 3: RSI retraces but does not go below the previous low (higher low confirmation).
Step 4: RSI breaks above the previous peak, confirming a bullish trend reversal.
Buy signal is triggered at the breakout above the RSI peak.
2. Bearish Failure Swing (Sell Signal)
Occurs when RSI enters overbought territory (above 70), declines, forms a lower high below the overbought level, and then breaks below the intermediate swing low in RSI.
Step 1: RSI rises above 70 (overbought condition).
Step 2: RSI declines and forms a local trough.
Step 3: RSI bounces but fails to exceed the previous high (lower high confirmation).
Step 4: RSI breaks below the previous trough, confirming a bearish trend reversal.
Sell signal is triggered at the breakdown below the RSI trough.
Features of the Indicator
Custom RSI Settings: Adjustable RSI length (default 14), overbought/oversold levels.
Buy & Sell Signals: Buy/sell signals are plotted directly on the price chart.
Entry, Stop-Loss, and Profit Targets:
Entry: Price at the breakout of the RSI failure swing pattern.
Stop-Loss: Lowest low (for buy) or highest high (for sell) of the previous two bars.
Profit Targets: Two levels calculated based on Risk-Reward ratios (1:1 and 1:2 by default, customizable).
Labeled Price Levels:
Entry Price Line (Blue): Marks the point of trade entry.
Stop-Loss Line (Red): Shows the calculated stop-loss level.
Target 1 Line (Orange): Profit target at 1:1 risk-reward ratio.
Target 2 Line (Green): Profit target at 1:2 risk-reward ratio.
Alerts for Trade Execution:
Buy/Sell signals trigger alerts for real-time notifications.
Alerts fire when price reaches stop-loss or profit targets.
Works on Any Timeframe & Asset: Suitable for stocks, forex, crypto, indices, and commodities.
Why Use This Indicator?
Highly Reliable Reversal Signals: Unlike simple RSI overbought/oversold strategies, failure swings filter out false breakouts and provide strong confirmation of trend reversals.
Risk Management Built-In: Stop-loss and take-profit levels are automatically set based on historical price action and risk-reward considerations.
Easy-to-Use Visualization: Clearly marked entry, stop-loss, and profit target levels make it beginner-friendly while still being valuable for experienced traders.
How to Trade with the Indicator
Buy Trade Example (Bullish Failure Swing)
RSI drops below 30 and recovers.
RSI forms a higher low and then breaks above the previous peak.
Entry: Buy when RSI crosses above its previous peak.
Stop-Loss: Set below the lowest low of the previous two candles.
Profit Targets:
Target 1 (1:1 Risk-Reward Ratio)
Target 2 (1:2 Risk-Reward Ratio)
Sell Trade Example (Bearish Failure Swing)
RSI rises above 70 and then declines.
RSI forms a lower high and then breaks below the previous trough.
Entry: Sell when RSI crosses below its previous trough.
Stop-Loss: Set above the highest high of the previous two candles.
Profit Targets:
Target 1 (1:1 Risk-Reward Ratio)
Target 2 (1:2 Risk-Reward Ratio)
Final Thoughts
The RSI Failure Swing Pattern Indicator is a powerful tool for traders looking to identify high-probability trend reversals. By using the RSI failure swing concept along with built-in risk management tools, this indicator provides a structured approach to trading with clear entry and exit points. Whether you’re a day trader, swing trader, or long-term investor, this indicator helps in capturing momentum shifts while minimizing risk.
Would you like any modifications or additional features? 🚀
