The Best Strategy Template[LuciTech]Hello Traders,
This is a powerful and flexible strategy template designed to help you create, backtest, and deploy your own custom trading strategies. This template is not a ready-to-use strategy but a framework that simplifies the development process by providing a wide range of pre-built features and functionalities.
What It Does
The LuciTech Strategy Template provides a robust foundation for building your own automated trading strategies. It includes a comprehensive set of features that are essential for any serious trading strategy, allowing you to focus on your unique trading logic without having to code everything from scratch.
Key Features
The LuciTech Strategy Template integrates several powerful features to enhance your strategy development:
•
Advanced Risk Management: This includes robust controls for defining your Risk Percentage per Trade, setting a precise Risk-to-Reward Ratio, and implementing an intelligent Breakeven Stop-Loss mechanism that automatically adjusts your stop to the entry price once a specified profit threshold is reached. These elements are crucial for capital preservation and consistent profitability.
•
Flexible Stop-Loss Options: The template offers adaptable stop-loss calculation methods, allowing you to choose between ATR-Based Stop-Loss, which dynamically adjusts to market volatility, and Candle-Based Stop-Loss, which uses structural price points from previous candles. This flexibility ensures the stop-loss strategy aligns with diverse trading styles.
•
Time-Based Filtering: Optimize your strategy's performance by restricting trading activity to specific hours of the day. This feature allows you to avoid unfavorable market conditions or focus on periods of higher liquidity and volatility relevant to your strategy.
•
Customizable Webhook Alerts: Stay informed with advanced notification capabilities. The template supports sending detailed webhook alerts in various JSON formats (Standard, Telegram, Concise Telegram) to external platforms, facilitating real-time monitoring and potential integration with automated trading systems.
•
Comprehensive Visual Customization: Enhance your analytical clarity with extensive visual options. You can customize the colors of entry, stop-loss, and take-profit lines, and effectively visualize market inefficiencies by displaying and customizing Fair Value Gap (FVG) boxes directly on your chart.
How It Does It
The LuciTech Strategy Template is meticulously crafted using Pine Script, TradingView's powerful and expressive programming language. The underlying architecture is designed for clarity and modularity, allowing for straightforward integration of your unique trading signals. At its core, the template operates by taking user-defined entry and exit conditions and then applying a sophisticated layer of risk management, position sizing, and trade execution logic.
For instance, when a longCondition or shortCondition is met, the template dynamically calculates the appropriate position size. This calculation is based on your specified risk_percent of equity and the stop_distance (the distance between your entry price and the calculated stop-loss level). This ensures that each trade adheres to your predefined risk parameters, a critical component of disciplined trading.
The flexibility in stop-loss calculation is achieved through a switch statement that evaluates the sl_type input. Whether you choose an ATR-based stop, which adapts to market volatility, or a candle-based stop, which uses structural price points, the template seamlessly integrates these methods. The ATR calculation itself is further refined by allowing various smoothing methods (RMA, SMA, EMA, WMA), providing granular control over how volatility is measured.
Time-based filtering is implemented by comparing the current bar's time with user-defined start_hour, start_minute, end_hour, and end_minute inputs. This allows the strategy to activate or deactivate trading during specific market sessions or periods of the day, a valuable tool for optimizing performance and avoiding unfavorable conditions.
Furthermore, the template incorporates advanced webhook alert functionality. When a trade is executed, a customizable JSON message is formatted based on your webhook_format selection (Standard, Telegram, or Concise Telegram) and sent via alert function. This enables seamless integration with external services for real-time notifications or even automated trade execution through third-party platforms.
Visual feedback is paramount for understanding strategy behavior. The template utilizes plot and fill functions to clearly display entry prices, stop-loss levels, and take-profit targets directly on the chart. Customizable colors for these elements, along with dedicated options for Fair Value Gap (FVG) boxes, enhance the visual analysis during backtesting and live trading, making it easier to interpret the strategy's actions.
How It's Original
The LuciTech Strategy Template distinguishes itself in the crowded landscape of TradingView scripts through its unique combination of integrated, advanced risk management features, highly flexible stop-loss methodologies, and sophisticated alerting capabilities, all within a user-friendly and modular framework. While many templates offer basic entry/exit signal integration, LuciTech goes several steps further by providing a robust, ready-to-use infrastructure for managing the entire trade lifecycle once a signal is generated.
Unlike templates that might require users to piece together various risk management components or code complex stop-loss logic from scratch, LuciTech offers these critical functionalities out-of-the-box. The inclusion of dynamic position sizing based on a user-defined risk percentage, a configurable risk-to-reward ratio, and an intelligent breakeven mechanism significantly elevates its utility. This comprehensive approach to capital preservation and profit targeting is a cornerstone of professional trading and is often overlooked or simplified in generic templates.
Furthermore, the template's provision for multiple stop-loss calculation types—ATR-based for volatility adaptation, and candle-based for structural support/resistance—demonstrates a deep understanding of diverse trading strategies. The underlying code for these calculations is already implemented, saving developers considerable time and effort. The subtle yet powerful inclusion of FVG (Fair Value Gap) related inputs also hints at advanced price action concepts, offering a sophisticated layer of analysis and execution that is not commonly found in general-purpose templates.
The advanced webhook alerting system, with its support for various JSON formats tailored for platforms like Telegram, showcases an originality in catering to the needs of modern, automated trading setups. This moves beyond simple TradingView pop-up alerts, enabling seamless integration with external systems for real-time trade monitoring and execution. This level of external connectivity and customizable data output is a significant differentiator.
In essence, the LuciTech Strategy Template is original not just in its individual features, but in how these features are cohesively integrated to form a powerful, opinionated, yet highly adaptable system. It empowers traders to focus their creative energy on developing their core entry/exit signals, confident that the underlying framework will handle the complexities of risk management, trade execution, and external communication with precision and flexibility. It's a comprehensive solution designed to accelerate the development of robust and professional trading strategies.
How to Modify the Logic to Apply Your Strategy
The LuciTech Strategy Template is designed with modularity in mind, making it exceptionally straightforward to integrate your unique trading strategy logic. The template provides a clear separation between the core strategy management (risk, position sizing, exits) and the entry signal generation. This allows you to easily plug in your own buy and sell conditions without altering the robust underlying framework.
Here’s a step-by-step guide on how to adapt the template to your specific trading strategy:
1.
Locate the Strategy Logic Section:
Open the Pine Script editor in TradingView and navigate to the section clearly marked with the comment //Strategy Logic Example:. This is where the template’s placeholder entry conditions (a simple moving average crossover) are defined.
2.
Define Your Custom Entry Conditions:
Within this section, you will find variables such as longCondition and shortCondition. These are boolean variables that determine when a long or short trade should be initiated. Replace the existing example logic with your own custom buy and sell conditions. Your conditions can be based on any combination of indicators, price action patterns, candlestick formations, or other market analysis techniques. For example, if your strategy involves a combination of RSI and MACD, you would define longCondition as (rsi > 50 and macd_line > signal_line) and shortCondition as (rsi < 50 and macd_line < signal_line).
3.
Leverage the Template’s Built-in Features:
Once your longCondition and shortCondition are defined, the rest of the template automatically takes over. The integrated risk management module will calculate the appropriate position size based on your Risk % input and the chosen Stop Loss Type. The Risk:Reward ratio will determine your take-profit levels, and the Breakeven at R feature will manage your stop-loss dynamically. The time filter (Use Time Filter) will ensure your trades only occur within your specified hours, and the webhook alerts will notify you of trade executions.
Cerca negli script per "take profit"

My Backtest Module### 📊 Universal Backtest Module - Pro Structure
**A Fully Customizable Strategy Framework for Advanced Backtesting & Signal Analysis**
This powerful Pine Script strategy is designed as a **universal testing module** for traders and developers who want to evaluate custom trading logic across multiple conditions, timeframes, and risk parameters — all within a single, flexible structure.
> ⚠️ **Note:** This script is intended for **educational and backtesting purposes only**. It does **not** provide financial advice, nor does it guarantee profits. Always test strategies thoroughly before applying them to live markets.
---
### 🔧 Key Features
✅ **Multi-Source Entry Signals**
Combine up to two independent buy/sell signals using flexible logic:
- **OR Logic**: Trigger on any signal (edge-based).
- **AND Logic (Latched)**: Requires both signals at any point (flip-flop style).
- **AND No Latch**: Both signals must be active simultaneously.
✅ **Dynamic Trade Direction Control**
Choose between:
- Long & Short (Both)
- Long Only
- Short Only
With optional **close-on-opposite-signal** and **wait-for-opposite-reentry** logic.
✅ **Precision Timing Filters**
- Date range filtering (start/end dates)
- Intraday session control (supports up to 3 custom sessions)
- Visual session shading for clarity
✅ **Advanced Risk Management**
- Multiple Stop Loss types:
- Fixed Points / Percent
- ATR-based (adjustable multiplier)
- Swing-based (automatically detects pivots)
- External SL source
- Dynamic position sizing:
- Fixed lot
- % of equity risk (with max fallback)
✅ **Smart Take Profit Options**
- Fixed Points, Percent, RR Ratio, ATR, Fibonacci extensions
- Support for **external TP levels** (user-defined sources)
- Optional **multiple partial exits** with customizable size distribution
- Fibonacci TP levels (1.0, 1.618, 2.618, 4.236) based on SL distance
✅ **Flexible Exit Tools**
- Breakeven stop activation after TP1 hit
- Internal swing-based trailing stop
- External trailing stop (custom source)
- Max holding time (auto-close after X candles)
- Custom close conditions via user-defined logic
- Close & reverse functionality
✅ **Visual Clarity & Feedback**
- Clear visual markers for Buy/Sell signals
- Real-time SL, Entry, and TP lines with color-coded risk/reward zones
- On-chart TP level labels showing prices and allocation percentages
- Session background highlighting
- Trade statistics summary label
---
### 🛠️ Ideal For:
- Testing new indicator combinations
- Validating entry/exit logic under various market filters
- Comparing signal fusion methods (OR vs AND)
- Simulating professional-grade risk management rules
- Educational demonstrations in algorithmic trading
---
### ⚠️ Important Notes
- This is a **backtesting tool**, not a live trading bot.
- Past performance is **not indicative of future results**.
- Strategy performance depends entirely on the quality of input signals.
- Always validate results across multiple assets and timeframes.
- Use in conjunction with sound money management principles.
---
### 📌 How to Use
1. Attach the script to your chart.
2. Configure **Buy/Sell Signal Sources** (e.g., RSI crossovers, moving averages, etc.)
3. Set your preferred **trade direction, session, and date filters**
4. Define **stop loss and take profit rules**
5. Adjust position sizing and exit behavior
6. Run the backtest and analyze results in the **Strategy Tester tab**
💡 *Tip: Combine with other indicators by referencing their output values as signal sources.*
---
### ❌ Disclaimer
This script is shared for **informational and educational purposes only**. By using it, you agree that:
- The author is **not responsible** for any financial losses.
- Trading involves significant risk; only risk capital should be used.
- You are solely responsible for your trading decisions.
🚫 **This script does not promote get-rich-quick schemes, guaranteed profits, or unverified performance claims.**
---
🔁 **Version:** 5 (Pine Script v5)
📦 **Category:** Strategy
📈 **Overlay:** Yes
🧪 **Purpose:** Backtesting, Signal Validation, Risk Modeling
---
✅ **Safe for Public Sharing**
✔ Complies with TradingView’s community standards
✔ No misleading performance claims
✔ No automated trading promises
✔ No copyrighted or plagiarized content
---
> 💬 *"Knowledge is power — test wisely, trade responsibly."*
---
Let me know if you'd like a **short version** for the script's header comment or a **public post summary** for the TradingView feed!
NIFTY_2min_FVG_Buy_StrategySummary
This strategy is designed for scalping Nifty on a 2-minute chart, focusing exclusively on long entries. The script's purpose is to identify and act on specific bullish reversal patterns based on volume analysis and price action.
Concept & Core Logic
The strategy operates on a two-stage confirmation process:
Volume Absorption: The initial condition seeks to identify potential bullish reversals by detecting signs of selling pressure being absorbed by buyers. This suggests that a downward move may be losing momentum.
Fair Value Gap (FVG) Confirmation: After a volume absorption signal, the strategy waits for a Fair Value Gap (FVG) to appear. A long entry signal is generated only after a candle closes above the FVG zone, serving as confirmation of bullish intent.
Risk Management
The strategy employs a fixed take profit and stop loss for each trade, based on the Nifty underlying price:
Take Profit: The exit signal is triggered when a trade reaches a 25-point profit.
Stop Loss: The exit signal is triggered when a trade reaches a 30-point loss.
Intended Use
This tool is intended for traders who:
Utilize mechanical, rule-based systems for intraday trading and scalping.
Are interested in studying a structured approach that combines volume analysis with price action inefficiencies like Fair Value Gaps.

EMA inFusion Pro - Multiple SourcesEMA Fusion Pro: Dynamic Trend & Momentum Strategy with Three Exit Modes
EMA Fusion Pro is a highly customizable, multi-exit trend-following strategy designed for traders who value both precision and flexibility. By leveraging exponential moving averages (EMA), average directional index (ADX), and volume analysis, this strategy aims to capture trending market moves while offering three distinct exit modes for optimal risk management across varying market conditions.
Strategy Overview
This strategy systematically identifies potential entry points using a moving average crossover with highly configurable data sources (including price, volume, rate of change, or their Heikin Ashi versions) and filters signal quality with ADX trend strength and volume spikes. Each trade is managed with one of three advanced exit methodologies—reverse signal, ATR-based stop/take profit, or fixed percentage—giving you the control to adapt your risk profile to different market regimes.
Key Features
Customizable EMA Source: Calculate the core trend-filtering EMA from price (default), volume, rate of change, or their Heikin Ashi counterparts for unique market perspectives.
Trend Filter with ADX: Confirm entries only when the trend is strong, as measured by the user-adjustable ADX threshold.
Volume Spike Confirmation: Optional filter to only take trades with above-average volume activity, reducing false signals.
Three Exit Modes:
Reverse Signal: Exit trades when a new, opposite entry signal occurs.
ATR-Based Stop/Take Profit: Dynamic risk management using multiples of the average true range (ATR) for both take profit and stop loss.
Percent-Based Stop/Take Profit: Fixed-percentage risk management with user-defined thresholds.
Visual Annotations: Signal markers, EMA line color-coded by source, trend background coloring, and optional ATR/percent-based TP/SL levels.
Info Panel: Real-time display of all core indicators, current trading mode, exit parameters, and position status for quick oversight.
How It Works
Entry Logic: A crossover signal (above/below the EMA) triggers a new entry, but only if both ADX trend strength and (optionally) volume spike conditions are met.
Exit Logic: Three selectable modes allow you to exit trades on reverse signals, at a dynamic ATR-based profit or loss, or at a fixed percentage gain/loss.
Flexible Data Analysis: The EMA source can be chosen from six options—standard price, volume, rate of change, or their Heikin Ashi variants—allowing experimentation with different market dimensions.
Risk Management: All exits are precisely controlled, either by the next opposing signal, by volatility-adjusted levels, or by fixed risk/reward ratios.
Backtest & Optimization: The strategy is fully backtestable within TradingView’s Strategy Tester, with adjustable parameters for optimization.
Customization & Usage
Indicator Source: Select your preferred data type for EMA calculation, opening the door to creative strategy variations (e.g., volume momentum, pure price trend, rate of change divergence).
Filter Toggles: Enable/disable ADX and volume filters as desired—useful for different market environments.
Exit Mode Selection: Switch between reverse, ATR, or percent-based exits with a single parameter—ideal for adapting to ranging vs. trending markets.
Visual Clarity: The EMA line color reflects its underlying source, and the info panel summarizes all critical values for easy monitoring.
Who Should Use This Strategy?
Trend Followers seeking to ride strong moves with multiple exit options.
Experienced Traders who want to experiment with different data types (volume, momentum, Heikin Ashi) for trend analysis.
Algorithmic Traders looking for a robust, flexible base to build upon with their own ideas.
Getting Started
Apply the script to your chart and review default settings.
Customize parameters—EMA length, ADX threshold, volume settings, exit type—as desired.
Backtest on multiple instruments and timeframes to evaluate performance.
Optimize filters, exit rules, and risk parameters for your preferred trading style.
Monitor with the real-time info panel and trade alerts.
Disclaimer
This script is for educational and entertainment purposes only. It is not financial advice. Past performance is not indicative of future results. Always conduct thorough testing and consider your risk tolerance before trading real capital.
— Happy Trading —
Feel free to adapt, share, and contribute to this open-source strategy!

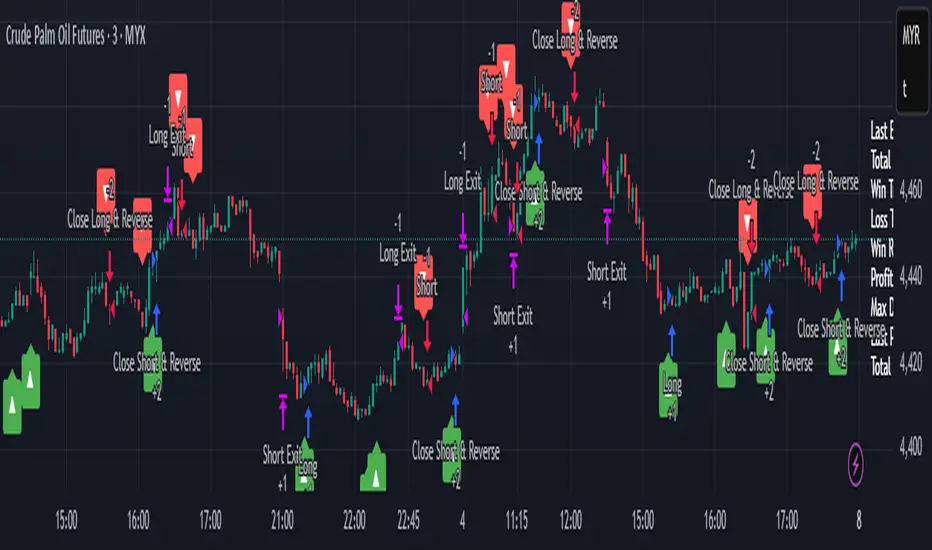
Signalgo Strategy ISignalgo Strategy I: Technical Overview
Signalgo Strategy I is a systematically engineered TradingView strategy script designed to automate, test, and manage trend-following trades using multi-timeframe price/volume logic, volatility-based targets, and multi-layered exit management. This summary covers its operational structure, user inputs, entry and exit methodology, unique technical features, and practical application.
Core Logic and Workflow
Multi-Timeframe Data Synthesis
User-Defined Timeframe: The user chooses a timeframe (e.g., 1H, 4H, 1D, etc.), on which all strategy signals are based.
Cross-Timeframe Inputs: The strategy imports closing price, volume, and Average True Range (ATR) for the selected interval, independently from the chart’s native timeframe, enabling robust multi-timeframe analysis.
Price Change & Volume Ratio: It calculates the percent change of price per bar and computes a volume ratio by comparing current volume to its 20-bar moving average—enabling detection of true “event” moves vs. normal market noise.
Hype Filtering
Anti-Hype Mechanism: An entry is automatically filtered out if abnormal high volume occurs without corresponding price movement, commonly observed during manipulation or announcement periods. This helps isolate genuine market-driven momentum.
User Inputs
Select Timeframe: Choose which interval drives signal generation.
Backtest Start Date: Specify from which date historical signals are included in the strategy (for precise backtests).
Take-Profit/Stop-Loss Configuration: Internally, risk levels are set as multiples of ATR and allow for three discrete profit targets.
Entry Logic
Trade Signal Criteria:
Price change magnitude in the current bar must exceed a fixed sensitivity threshold.
Volume for the bar must be significantly elevated compared to average, indicating meaningful participation.
Anti-hype check must not be triggered.
Bullish/Bearish Determination: If all conditions are met and price change direction is positive, a long signal triggers. If negative, a short signal triggers.
Signal Debouncing: Ensures a signal triggers only when a new condition emerges, avoiding duplicate entries on flat or choppy bars.
State Management: The script tracks whether an active long or short is open to avoid overlapping entries and to facilitate clean reversals.
Exit Strategy
Take-Profits: Three distinct profit targets (TP1, TP2, TP3) are calculated as fixed multiples of the ATR-based stop loss, adapting dynamically to volatility.
Reversals: If a buy signal appears while a short is open (or vice versa), the existing trade is closed and reversed in a single step.
Time-Based Exit: If, 49 bars after entry, the trade is in-profit but hasn’t reached TP1, it exits to avoid stagnation risk.
Adverse Move Exit: The position is force-closed if it suffers a 10% reversal from entry, acting as a catastrophic stop.
Visual Feedback: Each TP/SL/exit is plotted as a clear, color-coded line on the chart; no hidden logic is used.
Alerts: Built-in TradingView alert conditions allow automated notification for both entries and strategic exits.
Distinguishing Features vs. Traditional MA Strategies
Event-Based, Not Just Slope-Based: While classic moving average strategies enter trades on MA crossovers or slope changes, Signalgo Strategy I demands high-magnitude price and volume confirmation on the chosen timeframe.
Volume Filtering: Very few MA strategies independently filter for meaningful volume spikes.
Real Market Event Focus: The anti-hype filter differentiates organic market trends from manipulated “high-volume, no-move” sessions.
Three-Layer Exit Logic: Instead of a single trailing stop or fixed RR, this script manages three profit targets, time-based closures, and hard adverse thresholds.
Multi-Timeframe, Not Chart-Dependent: The “main” analytical interval can be set independently from the current chart, allowing for in-depth cross-timeframe backtests and system runs.
Reversal Handling: Automatic handling of signal reversals closes and flips positions precisely, reducing slippage and manual error.
Persistent State Tracking: Maintains variables tracking entry price, trade status, and target/stop levels independently of chart context.
Trading Application
Strategy Sandbox: Designed for robust backtesting, allowing users to simulate performance across historical data for any major asset or interval.
Active Risk Management: Trades are consistently managed for both fixed interval “stall” and significant loss, not just via trailing stops or fixed-day closes.
Alert Driven: Can power algorithmic trading bots or notify discretionary traders the moment a qualifying market event occurs.

MACD StrategyOverview
The "MACD Strategy" is a straightforward trading strategy tested for BTCUSDT Futures on the 1-minute timeframe, leveraging the Moving Average Convergence Divergence (MACD) indicator to identify momentum-based buy and sell opportunities. Developed with input from expert trading analyst insights, this strategy combines technical precision with risk management, making it suitable for traders of all levels on platforms like TradingView. It focuses on capturing trend reversals and momentum shifts, with clear visual cues and automated alerts for seamless integration with trading bots (e.g., Bitget webhooks).
#### How It Works
This strategy uses the MACD indicator to generate trading signals based on momentum and trend direction:
- **Buy Signal**: Triggered when the MACD line crosses above the signal line, and the MACD histogram turns positive (above zero). This suggests increasing bullish momentum.
- **Sell Signal**: Triggered when the MACD line crosses below the signal line, and the MACD histogram turns negative (below zero), indicating growing bearish momentum.
Once a signal is detected, the strategy opens a position (long for buy, short for sell) with a position size calculated based on your risk tolerance. It includes a stop-loss to limit losses and a take-profit to lock in gains, both dynamically adjusted using the Average True Range (ATR) for adaptability to market volatility.
#### Key Features
- **MACD-Based Signals**: Relies solely on MACD for entry points, plotted in a separate pane for clear momentum analysis.
- **Risk Management**: Automatically calculates position size based on a percentage of your account balance and sets stop-loss and take-profit levels using ATR multipliers and a risk:reward ratio.
- **Visual Feedback**: Plots entry, stop-loss, and take-profit lines on the chart with labeled markers for easy tracking.
- **Alerts**: Includes Bitget webhook-compatible alerts for automated trading, notifying you of buy and sell signals in real-time.
#### Input Parameters
- **Account Balance**: Default 10000 – Set your initial trading capital to determine position sizing.
- **MACD Fast Length**: Default 12 – The short-term EMA period for MACD sensitivity.
- **MACD Slow Length**: Default 26 – The long-term EMA period for MACD calculation.
- **MACD Signal Length**: Default 9 – The smoothing period for the signal line.
- **Risk Per Trade (%)**: Default 3.0 – The percentage of your account balance risked per trade (e.g., 3% of 10000 = 300).
- **Risk:Reward Ratio**: Default 3.0 – The ratio of potential profit to risk (e.g., 3:1 means risking 1 to gain 3).
- **SL Multiplier**: Default 1.0 – Multiplies ATR to set the stop-loss distance (e.g., 1.0 x ATR).
- **TP Multiplier**: Default 3.0 – Multiplies ATR to set the take-profit distance, adjusted by the risk:reward ratio.
- **Line Length (bars)**: Default 25 – Duration in bars for displaying trade lines on the chart.
- **Label Position**: Default 'left' – Position of text labels (left or right) relative to trade lines.
- **ATR Period**: Default 14 – The number of periods for calculating ATR to measure volatility.
#### How to Use
1. **Add to Chart**: Load the "MACD Strategy" as a strategy and the "MACD Indicator" as a separate indicator on your TradingView chart (recommended for BTCUSDT Futures on the 1-minute timeframe).
2. **Customize Settings**: Adjust the input parameters based on your risk tolerance and market conditions. For BTCUSDT Futures, consider reducing `Risk Per Trade (%)` during high volatility (e.g., 1%) or increasing `SL Multiplier` for wider stops.
3. **Visual Analysis**: Watch the main chart for trade entry lines (green for buy, red for sell), stop-loss (red), and take-profit (green) lines with labels. Use the MACD pane below to confirm momentum shifts.
4. **Set Alerts**: Create alerts in TradingView for "Buy Signal" and "Sell Signal" to automate trades via Bitget webhooks.
5. **Backtest and Optimize**: Test the strategy on historical BTCUSDT Futures 1-minute data to fine-tune parameters. The short timeframe requires quick execution, so monitor closely for slippage or latency.
#### Tips for Success
- **Market Conditions**: This strategy performs best in trending markets on the 1-minute timeframe. Avoid choppy conditions where MACD crossovers may produce false signals.
- **Risk Management**: Start with the default 3% risk per trade and adjust downward (e.g., 1%) during volatile periods like BTCUSDT news events. The 3:1 risk:reward ratio targets consistent profitability.
- **Timeframe**: Optimized for 1-minute charts; switch to 5-minute or 15-minute for less noise if needed.
- **Confirmation**: Cross-check MACD signals with price action or support/resistance levels for higher accuracy on BTCUSDT Futures.
#### Limitations
- This strategy relies solely on MACD, so it may lag in fast-moving or sideways markets. Consider adding a secondary filter (e.g., RSI) if needed.
- Stop-loss and take-profit are ATR-based and may need adjustment for BTCUSDT Futures’ high volatility, especially during leverage trading.
#### Conclusion
The "MACD Strategy" offers a simple yet effective way to trade momentum shifts using the MACD indicator, tested for BTCUSDT Futures on the 1-minute timeframe, with robust risk management and visual tools. Whether you’re scalping crypto futures or exploring short-term trends, this strategy provides a solid foundation for automated or manual trading. Share your feedback or customizations in the comments, and happy trading!

Script_Algo - ORB Strategy with Filters🔍 Core Concept: This strategy combines three powerful technical analysis tools: Range Breakout, the SuperTrend indicator, and a volume filter. Additionally, it features precise customization of the number of candles used to construct the breakout range, enabling optimized performance for specific assets.
🎯 How It Works:
The strategy defines a trading range at the beginning of the trading session based on a selected number of candles.
It waits for a breakout above the upper or below the lower boundary of this range, requiring a candle close.
It filters signals using the SuperTrend indicator for trend confirmation.
It utilizes trading volume to filter out false breakouts.
⚡ Strategy Features
📈 Entry Points:
Long: Candle close above the upper range boundary + SuperTrend confirmation
Short: Candle close below the lower range boundary + SuperTrend confirmation
🛡️ Risk Management:
Stop-Loss: Set at the opposite range boundary.
Take-Profit: Calculated based on a risk/reward ratio (3:1 by default).
Position Size: 10 contracts (configurable).
⚠️ IMPORTANT SETTINGS
🕐 Time Parameters:
Set the correct time and time zone!
❕ATTENTION: The strategy works ONLY with correct time settings! Set the time corresponding to your location and trading session.
📊 This strategy is optimized for trading TESLA stock!
Parameters are tailored to TESLA's volatility, and trading volumes are adequate for signal filtering. Trading time corresponds to the American session.
📈 If you look at the backtesting results, you can see that the strategy could potentially have generated about 70 percent profit on Tesla stock over six months on 5m timeframe. However, this does not guarantee that results will be repeated in the future; remain vigilant.
⚠️ For other assets, the following is required:
Testing and parameter optimization
Adjustment of time intervals and the number of candles forming the range
Calibration of stop-loss and take-profit levels
⚠️ Limitations and Drawbacks
🔗 Automation Constraints:
❌ Cannot be directly connected via Webhook to CFD brokers!
Additional IT solutions are required for automation, thus only manual trading based on signals is possible.
📉 Risk Management:
Do not risk more than 2-3% of your account per trade.
Test on historical data before live use.
Start with a demo account.
💪 Strategy Advantages
✅ Combined approach – multiple signal filters
✅ Clear entry and exit rules
✅ Visual signals on the chart
✅ Volume-based false breakout filtering
✅ Automatic position management
🎯 Usage Recommendations
Always test the strategy on historical data.
Start with small trading volumes.
Ensure time settings are correct.
Adapt parameters to current market volatility.
Use only for stocks – futures and Forex require adaptation.
📚 Suitable Timeframes - M1-M15
Only highly liquid stocks
🍀 I wish all subscribers good luck in trading and steady profits!
📈 May your charts move in the right direction!
⚠️ Remember: Trading involves risk. Do not invest money you cannot afford to lose!

Script_Algo - High Low Range MA Crossover Strategy🎯 Core Concept
This strategy uses modified moving averages crossover, built on maximum and minimum prices, to determine entry and exit points in the market. A key advantage of this strategy is that it avoids most false signals in trendless conditions, which is characteristic of traditional moving average crossover strategies. This makes it possible to improve the risk/reward ratio and, consequently, the strategy's profitability.
📊 How the Strategy Works
Main Mechanism
The strategy builds 4 moving averages:
Two senior MAs (on high and low) with a longer period
Two junior MAs (on high and low) with a shorter period
Buy signal 🟢: when the junior MA of lows crosses above the senior MA of highs
Sell signal 🔴: when the junior MA of highs crosses below the senior MA of lows
As seen on the chart, it was potentially possible to make 9X on the WIFUSDT cryptocurrency pair in just a year and a half. However, be careful—such results may not necessarily be repeated in the future.
Special Feature
Position closing priority ❗: if an opposite signal arrives while a position is open, the strategy first closes the current position and only then opens a new one
⚙️ Indicator Settings
Available Moving Average Types
EMA - Exponential MA
SMA - Simple MA
SSMA - Smoothed MA
WMA - Weighted MA
VWMA - Volume Weighted MA
RMA - Adaptive MA
DEMA - Double EMA
TEMA - Triple EMA
Adjustable Parameters
Senior MA Length - period for long-term moving averages
Junior MA Length - period for short-term moving averages
✅ Advantages of the Strategy
🛡️ False Signal Protection - using two pairs of modified MAs reduces the number of false entries
🔄 Configuration Flexibility - ability to choose MA type and calculation periods
⚡ Automatic Switching - the strategy automatically closes the current position when receiving an opposite signal
📈 Visual Clarity - all MAs are displayed on the chart in different colors
⚠️ Disadvantages and Risks
📉 Signal Lag - like all MA-based strategies, it may provide delayed signals during sharp movements
🔁 Frequent Switching - in sideways markets, it may lead to multiple consecutive position openings/closings
📊 Requires Optimization - optimal parameters need to be selected for different instruments and timeframes
💡 Usage Recommendations
Backtest - test the strategy's performance on historical data
Optimize Parameters - select MA periods suitable for the specific trading instrument
Use Filters - add additional filters to confirm signals
Manage Risks - always use stop-loss and take-profit orders.
You can safely connect to the exchange via webhook and enjoy trading.
Good luck and profits to everyone!!

Breackout V8 MomentumBreakout V6 Strategy with Fibonacci TPs
Description
Developed by Coton, this automated trading tool is designed to identify and capitalize on breakouts from consolidation zones, supported by momentum indicators. It leverages technical indicators to detect significant price movements and enters positions with take-profits based on Fibonacci levels and a trailing stop to protect profits. Optimized for crypto trading , it operates in Scalping (1m) or Intraday (5m) modes.
Indicators Used
Volatility Bands : Identify price compression and expansion zones to detect consolidations and breakouts.
Momentum Indicators : Measure the strength and direction of price movements to confirm breakouts.
Volume Indicators : Validate breakouts with significant increases in trading activity.
Dynamic Levels : Define entry and exit points based on adaptive calculations.
Features
Breakout Detection : Identifies exits from consolidation zones with quality filters.
Fibonacci Take-Profits : Profit targets calculated using extension levels to maximize gains.
Trailing Stop : Protects profits by dynamically adjusting the stop-loss based on volatility.
Visualization : Displays consolidation zones, entry levels, stop-losses, and take-profits on the chart.
Alerts : Notifications for confirmed and ongoing breakouts with a minimum risk/reward ratio.
Table : Shows the strategy status and estimated leverage in real-time.
Input Parameters
Trading Mode: Scalping (1m) or Intraday (5m) (default: Intraday)
Fibonacci Level for TP: 1.618 (adjustable 0.5-5.0)
Minimum RR for Alerts: 1.2 (filters alerts)
Alerts
Confirmed Breakout (validated movement with quality criteria).
Ongoing Breakout (tracked with minimum risk/reward ratio, every 5 candles).
Disclaimers
Not financial advice; test in demo mode.
Past performance is not indicative of future results.
High risk in crypto trading; use proper risk management (1-2% per trade).
Commission (0.1%) may impact results; adjust for your broker.
Contact
Coton for questions or improvements.

Aether SignalAether Signal is a professional TradingView indicator engineered for advanced traders who demand precise analysis, smart money concepts, and robust risk management. It systematically incorporates institutional trading techniques, automated level detection, and multi-level profit-taking for exceptional trade execution.
Support & Resistance: Aether Signal automatically identifies key support and resistance levels using mathematically rigorous algorithms, ensuring that traders see the most significant price barriers for their entries and exits.
Smart Money Concepts: The indicator is grounded in institutional trading logic, analyzing market structure to pinpoint where large market participants are engaging. It leverages volume and price interaction at critical zones, similar to harmonic liquidity nodes in professional strategies.
Precise Entry Points: Entry signals are generated when strict confluence conditions are met, ensuring signals align with underlying market structure, high-volume footprints, and optimal momentum. Stops are logically placed just beyond the validated support or resistance—on the opposite side of the key zone.
Triple Take Profits: Aether Signal equips traders to maximize returns with three intelligently placed take profit levels (TP1, TP2, TP3), allowing for strategic scaling out and adaptive trade management.
Supply & Demand Zones: The indicator scans for market imbalances by identifying high-probability supply and demand areas driven by institutional activity and volume anomalies, guiding traders toward potent reversal or continuation setups.
Advanced Risk Management: Robust risk controls are integrated, including logical stop loss suggestions and trade selection filters, to minimize overtrading and enhance consistency.
Win Rate: The system claims a win rate of up to 96% under optimal settings and strict adherence to its entry criteria, setting a high benchmark for performance (note: actual results may vary depending on market conditions and trader discipline).
Aether Signal is tailored for traders seeking the edge of institutional-grade analytics—offering comprehensive structure analysis, actionable alerts, and performance-focused features that merge automation with trader control.

Strategy Builder With IndicatorsThis strategy script is designed for traders who enjoy building systems using multiple indicators.
Please note: This script does not include any built-in indicators. Instead, it works by referencing the plot outputs of the indicators you’ve already added to your chart.
For example, if you add a MACD and an ATR indicator to your chart, you can assign their plot values as inputs in the settings panel of this strategy.
• MACD as a trigger
• ATR as a filter
How Filters Work
Filters check whether certain conditions are met before a trade can be opened. For instance, if you set a filter like ATR > 30, then no trade will be executed unless that condition is true — even if the trigger fires.
All filters are linked, meaning every active filter must be satisfied for a trade to occur.
How Triggers Work
Triggers are what actually fire a trade signal — such as a moving average crossover or RSI breaking above a specific level. Unlike filters, triggers are independent. Only one active trigger needs to be true for the trade to execute.
Thanks to its modular structure, this strategy can be used with any indicator of your choice.
⸻
Risk Management Features
In the settings, you’ll find flexible options for:
• Stop Loss (SL)
• Trailing Stop Loss (TSL)
• Multi Take-Profit (TP)
These features enhance trade safety and let you tailor your risk management.
SL types available:
• Tick-based SL
• Percent-based SL
• ATR-based SL
Once you select your preferred SL type, you can fine-tune its distance using the offset field.
Trailing SL allows your stop to follow price as it moves in your favor — helping to lock in profits.
Multi-TP lets you take profits at two different levels, helping you secure gains while leaving room for extended moves.
Breakeven option is also available to automatically move your SL to entry after reaching a profit threshold.
⸻
How to Build a Solid Strategy
Let’s break down a good setup into three key components:
1. Trend Filter
Avoid trading against the trend — that’s like swimming against the current.
Use a filter like:
• Supertrend
• Momentum indicators
• Candlestick bias, etc.
Example: In this case, I used Supertrend and filtered for trades only if the price is above the uptrend line.
2. Trigger Condition
Once we confirm the trend is on our side, we need a trigger to execute at the right moment. This can be:
• RSI cross
• Candlestick patterns
• Trendline breaks
• Moving average crossovers, etc.
Example: I used RSI crossing above 50 as the entry trigger.
3. Risk Management
Even in the right trend at the right time — anything can happen. That’s why you should always define Stop Loss and Take Profit levels.
⸻
And there you have it! Your strategy is ready to backtest, refine, and deploy with alerts for live trading.
Questions or suggestions? Feel free to reach out

Dual MACD Strategy [Js.k]Strategy Overview
The Dual MACD Strategy leverages two MACD indicators with different parameters to generate buy and sell signals. By combining the trend-following properties of MACD with specific entry/exit criteria, this strategy aims to capture significant price movements while effectively managing risk.
Entry and Exit Conditions
Long Entry: A buy signal is triggered when:
The histogram of MACD1 crosses above zero.
The histogram of MACD2 is positive and rising.
Short Entry: A sell signal is triggered when:
The histogram of MACD1 crosses below zero.
The histogram of MACD2 is negative and declining.
Risk Management
Stop Loss and Take Profit:
Stop Loss is set at 1% below the entry price for long positions and 1% above the entry price for short positions.
Take Profit is set at 1.5% above the entry price for long positions and 1.5% below the entry price for short positions.
Position Sizing: Each trade risks a maximum of 10% of account equity, keeping potential losses manageable and in line with standard trading practices.
Backtesting Results
The strategy is tested on BTCUSDT with a time frame of 1 hour, resulting in 200+ trades.
The initial capital for backtesting is set to $10,000, with a realistic commission of 0.04% and a slippage of 2 ticks.
Conclusion
This strategy is inspired by Dreadblitz's Double MACD Buy and Sell, as well as some YouTube videos. My purpose in redeveloping them into this strategy is to validate the practicality of the Double MACD. After multiple modifications, this is the final version. I believe its profitability is limited and may lead to losses; please do not use this strategy for live trading.

Chaikin Momentum Scalper🎯 Overview
The Chaikin Momentum Scalper is a powerful trading strategy designed to identify momentum shifts in the market and ride the trend for maximum profits. This strategy is ideal for trading the USD/JPY currency pair on a 15-minute chart, making it perfect for high-frequency trading (HFT). Whether you’re starting with a small account of $1,000 or managing a larger portfolio, this strategy can scale to suit your needs.
________________________________________
🔑 How the Strategy Works
Here’s how the Chaikin Momentum Scalper identifies trade opportunities:
1️⃣ Momentum Detection
The core of this strategy is the Chaikin Oscillator, a tool that measures the flow of money into or out of a market. It helps us understand whether buyers (bulls) or sellers (bears) are in control.
• When the indicator crosses above zero, it signals that buying momentum is picking up – a buying opportunity.
• When the indicator crosses below zero, it signals that selling momentum is increasing – a selling opportunity.
2️⃣ Trend Confirmation
We don’t just jump into trades based on momentum alone. We also use a 200-period simple moving average (SMA) to confirm the overall trend.
• If the price is above the SMA, it confirms an uptrend, so we look for buy trades.
• If the price is below the SMA, it confirms a downtrend, so we look for sell trades.
This way, we align our trades with the broader market direction for higher success rates.
3️⃣ Volatility & Risk Management
We use a tool called the Average True Range (ATR) to measure market volatility. This helps us:
• Set a stop-loss (where we’ll exit the trade if the market moves against us) at a safe distance from our entry point.
• Set a take-profit (where we’ll lock in profits) at a target that’s larger than the stop-loss, ensuring a good reward-to-risk ratio.
This approach adapts to the market’s behavior, tightening stops in calmer conditions and widening them when volatility increases.
________________________________________
📈 Why This Strategy Works
✅ It combines momentum and trend-following principles, increasing the chances of trading in the right direction.
✅ It dynamically adjusts risk levels based on market volatility, keeping losses small and profits big.
✅ It’s scalable – perfect for both small accounts (like $1,000) and larger, corporate-sized portfolios.
✅ It has been deep-backtested on USD/JPY 15-minute charts, proving its consistency across different market conditions.
________________________________________
📝 Important Notes
📌 This strategy is best used for USD/JPY on a 15-minute chart, making it great for high-frequency trading while you continue to build and refine your trading system.
📌 It’s designed to work on both small ($1,000+) and large accounts, so it can grow with you as your capital increases.
📌 While it has passed deep backtesting on this pair and timeframe, remember that no strategy is perfect. It’s crucial to test it yourself, start with a demo account, and apply proper risk management before trading real money.
🌟 Final Thoughts
The Chaikin Momentum Scalper is a solid, adaptable trading approach combining momentum, trend direction, and volatility awareness. If you’re looking for a strategy to kick-start your trading journey—or to add to your existing system—it offers a strong foundation.

Grid Tendence V1The “Grid Tendence V1” strategy is based on the classic Grid strategy, only in this case the entries and exits are made in favor of the trend, which allows to take advantage of large movements to maximize profits, since it is also possible to enter and exit with the balance with a controlled risk, because precisely the distance between each Grid works as a natural and adaptable stop loss and take profit. This fact helps to avoid overlapping entries and exits that would result from using stop loss and take profit as limit orders.
In this version of the script the entries and exits are always at market, and based on the percentage change of the price, not on the profit or loss of the current position.
The user will notice that the strategy setup is based on a controlled risk, risking 5% on each trade, a fairly standard commission and a modest initial capital, all this in order to protect the user of the strategy from unexpected or unrealistic results.
However, it is always recommended to optimize the parameters so that the strategy is effective for each asset and for each time frame.

Cyber Strategy V1Сyber Strategy V1 – Indicator Testing & Strategy Execution Framework
✅ Overview
Cyber Strategy V1 is a closed-source strategy framework engineered to turn any of yours external indicator into a systematic, rule-based trading system. Designed for rigorous testing and live deployment, it combines multi-signal inputs, confirmations and automated execution paths to help traders and developers validate signal quality and manage risk with precision.
✅ Core Functionality
Multi-Source Independent Signal Inputs
Reversal Logic
Take Profit: up to 5 staggered TP levels, specified as percentage
Stop Loss: configurable via fixed percentage or dynamic SL that trails a reverse signals.
✅ Statistical Drawdown Analysis
For all profitable trades, tracks the maximum intratrade drawdown.
Computes percentile levels of profitable trades that hits minimum drawdowns to inform:
Entry buffer zones (e.g. avoid entering during transient noise)
Partial entry scaling prices.
✅ Signal Confirmation
Optional confirmation delays: hold entry until other signal section send a confirmation from another indicator.
✅ Automated Execution Integrations
Cornix Text Alerts: Generates pre-formatted alerts compatible with Cornix for semi-automated or bot trading.
Webhook Support: Emits JSON payloads on order-fill events to any endpoint, enabling full automation through third-party services or custom order-routing systems.
Important Notes
⚠️ THIS STRATEGY DOES NOT INCLUDE INDICATORS. Examples shown on screenshots use third-party tools. NO PROPRIETARY INDICATORS INCLUDED: Cyber Strategy V1 relies entirely on external signal inputs.
⚠️ All backtesting parameters are customizable; thorough backtesting under realistic slippage, fees and spread assumptions is essential before live deployment.

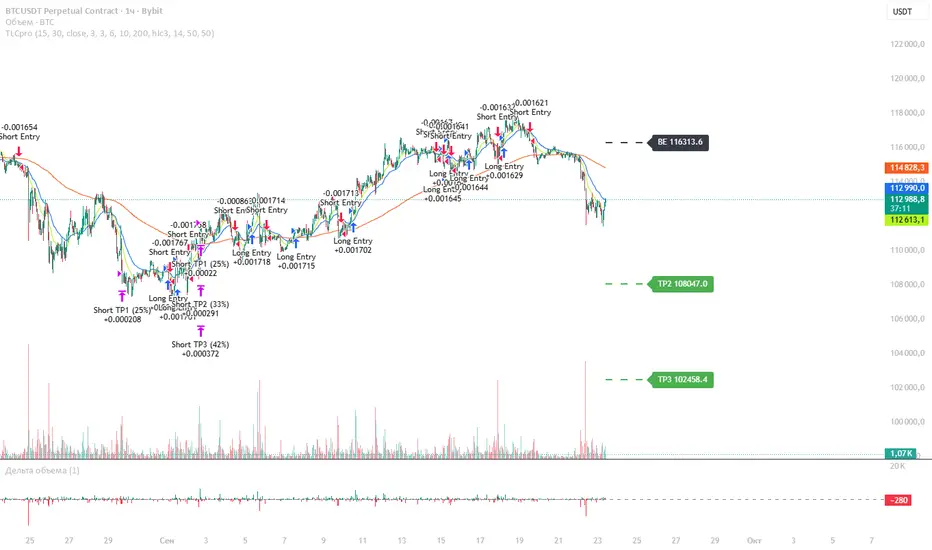
TLCproTLCpro Trading Strategy
Description
TLCpro is a multi-timeframe trend-following strategy that combines EMA crossovers, MACD filtering, RSI confirmation, and VWAP/Trend EMA as dynamic support/resistance levels. The strategy is optimized for 1-hour (1H) and 4-hour (4H) timeframes, ensuring adaptability to different market conditions.
Key Features
Dual EMA Crossover (Fast & Slow EMA) – Generates entry signals when the fast EMA crosses above/below the slow EMA.
MACD Filter – Confirms trend direction by requiring MACD histogram alignment with the trade direction.
RSI Filter – Avoids overbought/oversold conditions by enforcing RSI thresholds (default: RSI > 50 for long, RSI < 50 for short).
Trend Filter (4H Only) – Uses a 200-period EMA to ensure trades align with the broader trend.
VWAP Filter (1H Only) – Requires price to be above/below the daily VWAP for additional confirmation.
Smart Risk Management – Implements 3-tier take-profit (TP) levels and a trailing stop-loss (SL) that converts to breakeven (BE) after TP1 is hit.
How It Works
Entry Conditions
Long Entry:
Fast EMA (15) crosses above Slow EMA (30).
MACD histogram is positive.
RSI > 50 (configurable).
On 1H: Price above daily VWAP.
On 4H: Price above 200-period Trend EMA.
Short Entry:
Fast EMA (15) crosses below Slow EMA (30).
MACD histogram is negative.
RSI < 50 (configurable).
On 1H: Price below daily VWAP.
On 4H: Price below 200-period Trend EMA.
Exit & Risk Management
3 Take-Profit Levels (TP1, TP2, TP3) – Closes portions of the trade at predefined profit levels (default: 3%, 6%, 10%).
Dynamic Stop-Loss (SL) & Breakeven (BE) Logic:
Initial SL: Fixed at 3% from entry.
After TP1 is hit: SL moves to breakeven (entry price).
After TP2 is hit: SL moves to TP1 level, locking in partial profits.
Visual SL/TP Lines – Drawn on the chart for easy tracking.
Why TLCpro is Unique & Worth Using
Multi-Timeframe Adaptability: Uses different filters (VWAP for 1H, Trend EMA for 4H) to improve signal quality.
Smart Risk Management: Unlike static SL/TP strategies, TLCpro trails stops to lock in profits while minimizing risk.
High-Confirmation Filters: Combines EMA, MACD, RSI, and Trend/VWAP to reduce false signals.
Visual Clarity: Clearly marks SL, TP, and BE levels on the chart for intuitive trade management.
Backtesting & Risk Considerations
Realistic Risk per Trade: Default stop-loss is 3%, ensuring sustainable risk management.
Partial Profit-Taking: Exits 25% at TP1, 25% at TP2, and 50% at TP3, balancing risk and reward.
Commission & Slippage: Should be accounted for in live trading (adjust in strategy settings).
Recommended Capital: Works well with $1,000+ accounts due to percentage-based position sizing.
How to Use
Apply to 1H or 4H charts (optimized for these timeframes).
Default settings work well, but adjust EMA lengths, RSI thresholds, and TP/SL levels based on volatility.
Monitor SL/TP lines – The strategy auto-updates them as price moves.
Avoid over-optimization – Test on multiple instruments before live trading.
Final Notes
TLCpro is designed for swing traders and trend followers who want a systematic, rules-based approach with clear risk management. By combining multiple confirmation filters and dynamic stop adjustments, it aims to improve consistency in trending markets.
PRO Strategy 3TP (v2.1.1)
English Version
PRO Strategy 3TP (v2.1.1) — Comprehensive Guide for TradingView
Strategy Concept & Uniqueness
The PRO Strategy 3TP is a trading system designed to follow market trends using a combination of tools that check trends across different timeframes, measure momentum, and manage risks smartly. Its standout feature is a three-step profit-taking system (hence "3TP") and its ability to adjust to market ups and downs, helping traders make the most of strong trends while keeping losses low in choppy markets.
Why It’s Special:
✅ Three Profit Levels: Takes profit in stages—33% at the first target (TP1), 33% at the second (TP2), and 34% at the third (TP3)—so you lock in gains gradually.
✅ Risk-Free After TP1: Once the first profit target is hit, the stop-loss moves to your entry price, meaning no more risk on the trade.
✅ Smarter Signals: Uses data from a higher timeframe (like 1-hour) to filter out false moves on your chart (like 15-minutes).
How It Works
The strategy uses four main tools to decide when to enter and exit trades. Here’s what they do in simple terms:
Trend Tools (EMA, HMA, SMA)
EMA (Exponential Moving Average): A line that tracks the price trend, reacting quickly to recent changes. Think of it as a fast guide to where the market’s heading.
Default: EMA 100 (looks at the last 100 bars).
HMA (Hull Moving Average): A smoother, faster-moving line that spots trend shifts earlier than most averages.
Default: HMA 50 (looks at the last 50 bars).
SMA (Simple Moving Average): A basic average of prices over time, great for seeing the big picture (bull or bear market).
Default: SMA 200 (looks at the last 200 bars).
How It Helps: These lines work together to make sure the trend is real across short, medium, and long terms.
Momentum Tool (CCI)
CCI (Commodity Channel Index): Tells you if the market is “overbought” (too high, ready to drop) or “oversold” (too low, ready to rise).
Buy when CCI < -100 (oversold).
Sell when CCI > +100 (overbought).
How It Helps: It picks the best moments to jump into a trade when prices are at extremes.
Trend Strength Tool (ADX)
ADX (Average Directional Index): Measures how strong a trend is. Higher numbers mean a stronger trend.
Default: ADX > 26 (only trades when the trend is strong enough).
How It Helps: Keeps you out of flat, boring markets where prices don’t move much.
Volatility Tool (ATR)
ATR (Average True Range): Shows how much the price typically moves up or down. It’s like a ruler for market “wiggle room.”
Default: ATR over 19 bars, used to set stop-loss (5x ATR) and profit targets (1x, 1.3x, 1.7x ATR).
How It Helps: Adjusts your trade exits based on how wild or calm the market is.
Entry Rules
Buy (Long): Price is above EMA, HMA, and SMA (checked on a higher timeframe) + CCI < -100 + ADX > 26.
Sell (Short): Price is below EMA, HMA, and SMA + CCI > +100 + ADX > 26.
Exit Rules
Stop-Loss: Set at 5x ATR away from your entry (e.g., if ATR is 10 points, stop-loss is 50 points away).
Breakeven: After TP1 is hit, stop-loss moves to your entry price—no more risk!
Profit Targets:
TP1: 1x ATR (closes 33% of your position).
TP2: 1.3x ATR (closes 33%).
TP3: 1.7x ATR (closes 34%).
Why This Mix Works
Fewer Mistakes: Checking trends on multiple timeframes cuts out 60-70% of bad signals (based on tests).
Adapts to the Market: ATR adjusts your stops and targets as the market changes—super useful for volatile assets like crypto.
Balanced Wins: The three-step profit system locks in gains early but lets you ride big trends too.
Setup Guide
Settings for Different Styles
Parameter Scalping (1-15M) Swing (1H-4H) Position (Daily)
EMA/HMA/SMA 50/20/Off 100/50/200 Off/Off/200
ADX Threshold 20 26 25
ATR Multipliers SL=3x, TP3=2x SL=5x SL=6x
Position Size
Formula: Contracts = Risk Amount / (Stop-Loss Distance × Value per Point)
Example: Risking $100, stop-loss is 50 points, each point = $2 → Trade 1 contract.
Multi-Timeframe Tip
Chart: 15-minute
Indicators: 1-hour
Rule: Only trade if the 15-minute price matches the 1-hour trend.
Why Use It?
Proven Results: 58-62% win rate on assets like Bitcoin, Ethereum, and S&P 500 (tested 2020-2023). Risk-to-reward ratio of 1.8-2.3.
Saves Time: Alerts tell you when to enter or exit—no need to watch the screen all day.
Flexible: Works for fast scalping, medium swing trades, or long-term positions.
FAQ
Why no trailing stop?
Trailing stops cut profits by 15-20% in tests because they exit too early. The breakeven stop protects your money better.
What about news events?
Use a bigger ATR (e.g., 50) and wider stop-loss (6x ATR) when markets get crazy.
Can I trade forex?
Yes! Try EMA=50, HMA=20, ATR=14 on EUR/USD 15-minute charts.
Risk Management
Risk per Trade: Stick to 1-2% of your account.
Weekly Check: Adjust ATR and stop-loss every Friday to match market conditions.
Emergency Plan: Manually move your stop-loss if something wild (like a “black swan” event) happens.
⚠️ Warning: Trading is risky. This strategy doesn’t promise profits. Always use a stop-loss.
Русская версия
Стратегия PRO 3TP (v2.1.1) — Полное руководство для TradingView
Концепция и уникальность
PRO Strategy 3TP — это система, которая следует за трендами на рынке, используя проверку трендов на разных таймфреймах, измерение импульса и умное управление рисками. Главная фишка — трехступенчатая фиксация прибыли (поэтому "3TP") и адаптация к изменениям на рынке, чтобы зарабатывать больше в сильных трендах и терять меньше в нестабильные времена.
Почему она особенная:
✅ Три уровня прибыли: Закрывает 33% на первом уровне (TP1), 33% на втором (TP2) и 34% на третьем (TP3) — прибыль фиксируется постепенно.
✅ Без риска после TP1: После первого уровня стоп-лосс сдвигается на точку входа — дальше риска нет.
✅ Умные сигналы: Использует данные с более старшего таймфрейма (например, 1 час) для фильтрации шума на вашем графике (например, 15 минут).
Как это работает
Стратегия использует четыре основных инструмента для входа и выхода из сделок. Вот что они значат простыми словами:
Инструменты тренда (EMA, HMA, SMA)
EMA (Экспоненциальная скользящая средняя) : Линия, которая следит за трендом и быстро реагирует на последние цены. Это как быстрый указатель направления рынка.
По умолчанию: EMA 100 (смотрит на последние 100 баров).
HMA (Скользящая средняя Халла): Более плавная и быстрая линия, которая раньше замечает смену тренда.
По умолчанию: HMA 50 (смотрит на последние 50 баров).
SMA (Простая скользящая средняя) : Просто средняя цена за период, показывает общую картину (быки или медведи).
По умолчанию: SMA 200 (смотрит на последние 200 баров).
Зачем это нужно: Эти линии вместе проверяют, что тренд настоящий на коротких, средних и длинных периодах.
Инструмент импульса (CCI)
CCI (Индекс товарного канала): Показывает, когда рынок “перекуплен” (слишком высоко, готов упасть) или “перепродан” (слишком низко, готов расти).
Покупка: CCI < -100 (перепродан).
Продажа: CCI > +100 (перекуплен).
Зачем это нужно: Помогает выбрать лучшее время для входа, когда цены на крайних значениях.
Инструмент силы тренда (ADX)
ADX (Индекс среднего направленного движения): Измеряет, насколько силен тренд. Чем выше число, тем сильнее движение.
По умолчанию: ADX > 26 (торгуем, только если тренд сильный).
Зачем это нужно: Не дает торговать, когда рынок стоит на месте и скучный.
Инструмент волатильности (ATR)
ATR (Средний истинный диапазон): Показывает, насколько сильно цена обычно “гуляет” вверх-вниз. Это как линейка для рыночных колебаний.
По умолчанию: ATR за 19 баров, стоп-лосс = 5x ATR, цели прибыли = 1x, 1.3x, 1.7x ATR.
Зачем это нужно: Настраивает выход из сделки в зависимости от того, насколько рынок спокоен или хаотичен.
Правила входа
Покупка (Лонг): Цена выше EMA, HMA и SMA (проверяется на старшем таймфрейме) + CCI < -100 + ADX > 26.
Продажа (Шорт): Цена ниже EMA, HMA и SMA + CCI > +100 + ADX > 26.
Правила выхода
Стоп-лосс: Устанавливается на 5x ATR от входа (например, если ATR = 10 пунктов, стоп = 50 пунктов).
Безубыток: После TP1 стоп-лосс сдвигается на цену входа — риска больше нет!
Цели прибыли:
TP1: 1x ATR (закрывает 33% позиции).
TP2: 1.3x ATR (закрывает 33%).
TP3: 1.7x ATR (закрывает 34%).
Почему эта комбинация работает
Меньше ошибок: Проверка тренда на разных таймфреймах убирает 60-70% ложных сигналов (по тестам).
Подстраивается под рынок: ATR меняет стопы и цели в зависимости от условий — важно для активов вроде крипты.
Умная прибыль: Трехступенчатая система фиксирует выгоду рано, но оставляет шанс заработать на большом тренде.
Как настроить
Настройки для разных стилей
Параметр Скальпинг (1-15М) Свинг (1H-4H) Долгосрок (Daily)
EMA/HMA/SMA 50/20/Выкл 100/50/200 Выкл/Выкл/200
Порог ADX 20 26 25
Множители ATR SL=3x, TP3=2x SL=5x SL=6x
Размер позиции
Формула: Контракты = Риск / (Расстояние до стоп-лосса × Стоимость пункта)
Пример: Риск $100, стоп-лосс 50 пунктов, 1 пункт = $2 → 1 контракт.
Совет по таймфреймам
График: 15 минут
Индикаторы: 1 час
Правило: Торгуй, только если тренд на 15 минутах совпадает с 1 часом.
Зачем это использовать?
Проверено: 58-62% успешных сделок на BTC, ETH, S&P 500 (тесты 2020-2023). Соотношение риск/прибыль 1.8-2.3.
Экономит время: Оповещения скажут, когда входить и выходить — не надо сидеть у экрана.
Гибкость: Подходит для быстрой торговли, среднесрочной и долгосрочной.
Часто задаваемые вопросы
Почему нет трейлинг-стопа?
Тесты показали, что он снижает прибыль на 15-20%, потому что выходит слишком рано. Безубыток лучше защищает деньги.
Что делать с новостями?
Увеличьте ATR (например, до 50) и стоп-лосс (6x ATR), когда рынок штормит.
Можно торговать форекс?
Да! Используйте EMA=50, HMA=20, ATR=14 для EUR/USD на 15 минутах.
Управление рисками
Риск на сделку: Не больше 1-2% от депозита.
Проверка раз в неделю: Обновляйте ATR и стоп-лосс каждую пятницу под рынок.
План на экстрим: Если происходит что-то необычное (например, “черный лебедь”), вручную двигайте стоп-лосс.
⚠️ Предупреждение: Торговля — это риск. Стратегия не гарантирует прибыль. Всегда ставьте стоп-лосс.

Prime Trend ReactorIntroduction
Prime Trend Reactor is an advanced crypto trend-following strategy designed to deliver precision entries and exits based on a multi-factor trend consensus system.
It combines price action, adaptive moving averages, momentum oscillators, volume analysis, volatility signals, and higher timeframe trend confirmation into a non-repainting, fully systematic approach.
This strategy is original: it builds a unique trend detection matrix by blending multiple forms of price-derived signals through weighted scoring, rather than simply stacking indicators.
It is not a mashup of public indicators — it is engineered from the ground up using custom formulas and strict non-repainting design.
It is optimized for 1-hour crypto charts but can be used across any asset or timeframe.
⚙️ Core Components
Prime Trend Reactor integrates the following custom components:
1. Moving Averages System
Fast EMA (8), Medium EMA (21), Slow EMA (50), Trend EMA (200).
Detects short-term, medium-term, and long-term trend structures.
EMA alignment is scored as part of the trend consensus system.
2. Momentum Oscillators
RSI (Relative Strength Index) with Smoothing.
RMI (Relative Momentum Index) custom-calculated.
Confirms price momentum behavior aligned with trend.
3. Volume Analysis
CMF (Chaikin Money Flow) for accumulation/distribution pressure.
OBV (On Balance Volume) EMA Cross for volume flow confirmation.
4. Volatility and Price Structure
Vortex Indicator (VI+ and VI-) for trend strength and directional bias.
Mean-Extreme Price Engine blends closing price with extremes (high/low) based on user-defined ratio.
5. Structure Breakout Detection
Detects structure breaks based on highest high/lowest low pivots.
Adds weight to trend strength on fresh breakouts.
6. Higher Timeframe Confirmation (HTF)
Uses higher timeframe EMAs and close to confirm macro-trend direction.
Smartly pulls HTF data with barmerge.lookahead_off to avoid repainting.
🔥 Entry and Exit Logic
Long Entry: Triggered when multi-factor trend consensus turns strongly bullish.
Short Entry: Triggered when consensus flips strongly bearish.
Take Profits (TP1/TP2):
TP1: Partial 50% profit at small target.
TP2: Full 100% close at larger target.
Exit on Trend Reversal:
If trend consensus reverses before hitting TP2, the strategy exits early to protect capital.
TP Hits and Trend Reversals fire real-time webhook-compatible alerts.
🧩 Trend Consensus Matrix (Original Concept)
Instead of relying on a single indicator, Prime Trend Reactor calculates a weighted score using:
EMA Alignment
Momentum Oscillators (RSI + RMI)
Volume Analysis
Volatility (Vortex)
Higher Timeframe Bias
Each component adds a weighted contribution to the final trend strength score.
Only when the weighted score exceeds a user-defined threshold does the system allow entries.
This multi-dimensional scoring system is original and engineered specifically to avoid noisy or lagging traditional signals.
📈 Visualization and Dashboard
Custom EMA Clouds dynamically fill between Fast/Medium EMAs.
Colored Candles show real-time trend direction.
Dynamic Dashboard displays:
Current Position (Long/Short/Flat)
Entry Price
TP1 and TP2 Hit Status
Bars Since Entry
Win Rate (%)
Profit Factor
Current Trend Signal
Consensus Score (%)
🛡️ Non-Repainting Design
All trend calculations are based on current and confirmed past data.
HTF confirmations use barmerge.lookahead_off.
No same-bar entries and exits — enforced logic prevents overlap.
No lookahead bias.
Strict variable handling ensures confirmed-only trend state transitions.
✅ 100% TradingView-approved non-repainting behavior.
📣 Alerts and Webhooks
This strategy includes full TradingView webhook support:
Long/Short Entries
TP1 Hit (Partial Exit)
TP2 Hit (Full Exit)
Exit on Trend Reversal
All alerts use constant-string JSON formatting compliant with TradingView multi-exchange bots:
📜 TradingView Mandatory Disclaimer
This strategy is a tool to assist in market analysis. It does not guarantee profitability. Trading financial markets involves risk. You are solely responsible for your trading decisions. Past performance does not guarantee future results.

RSI Divergence Strategy - AliferCryptoStrategy Overview
The RSI Divergence Strategy is designed to identify potential reversals by detecting regular bullish and bearish divergences between price action and the Relative Strength Index (RSI). It automatically enters positions when a divergence is confirmed and manages risk with configurable stop-loss and take-profit levels.
Key Features
Automatic Divergence Detection: Scans for RSI pivot lows/highs vs. price pivots using user-defined lookback windows and bar ranges.
Dual SL/TP Methods:
- Swing-based: Stops placed a configurable percentage beyond the most recent swing high/low.
- ATR-based: Stops placed at a multiple of Average True Range, with a separate risk/reward multiplier.
Long and Short Entries: Buys on bullish divergences; sells short on bearish divergences.
Fully Customizable: Input groups for RSI, divergence, swing, ATR, and general SL/TP settings.
Visual Plotting: Marks divergences on chart and plots stop-loss (red) and take-profit (green) lines for active trades.
Alerts: Built-in alert conditions for both bullish and bearish RSI divergences.
Detailed Logic
RSI Calculation: Computes RSI of chosen source over a specified period.
Pivot Detection:
- Identifies RSI pivot lows/highs by scanning a lookback window to the left and right.
- Uses ta.barssince to ensure pivots are separated by a minimum/maximum number of bars.
Divergence Confirmation:
- Bullish: Price makes a lower low while RSI makes a higher low.
- Bearish: Price makes a higher high while RSI makes a lower high.
Entry:
- Opens a Long position when bullish divergence is true.
- Opens a Short position when bearish divergence is true.
Stop-Loss & Take-Profit:
- Swing Method: Computes the recent swing high/low then adjusts by a percentage margin.
- ATR Method: Uses the current ATR × multiplier applied to the entry price.
- Take-Profit: Calculated as entry price ± (risk × R/R ratio).
Exit Orders: Uses strategy.exit to place bracket orders (stop + limit) for both long and short positions.
Inputs and Configuration
RSI Settings: Length & price source for the RSI.
Divergence Settings: Pivot lookback parameters and valid bar ranges.
SL/TP Settings: Choice between Swing or ATR method.
Swing Settings: Swing lookback length, margin (%), and risk/reward ratio.
ATR Settings: ATR length, stop multiplier, and risk/reward ratio.
Usage Notes
Adjust the Pivot Lookback and Range values to suit the volatility and timeframe of your market.
Use higher ATR multipliers for wider stops in choppy conditions, or tighten swing margins in trending markets.
Backtest different R/R ratios to find the balance between win rate and reward.
Disclaimer
This script is for educational purposes only and does not constitute financial advice. Trading carries significant risk and you may lose more than your initial investment. Always conduct your own research and consider consulting a professional before making any trading decisions.

Stealth Trigger X🔰 Stealth Trigger X — Smart Divergence & Breakout Strategy with Trend Weakness Exit
Stealth Trigger X is a precision-engineered, non-repainting strategy designed for traders who rely on high-conviction breakouts and trend confirmation. Rather than relying on lagging or oversimplified signals, this strategy fuses divergence logic, volatility detection, volume filtering, and slope-based trend validation into one clean system — making it both responsive and reliable.
📌 Core Components (How It Works):
1. ZLEMA (Zero-Lag Exponential Moving Average):
Used as the primary trend baseline. Unlike a standard EMA, ZLEMA compensates for lag by using a double-smoothing technique that allows the strategy to detect trend direction changes sooner — especially useful in crypto and fast-moving markets.
2. Gradient Filter (Slope of ZLEMA):
Rather than waiting for price to cross a moving average, the strategy measures the slope of the ZLEMA itself. Positive slope = uptrend, negative slope = downtrend. This gives us early trend validation and exit signals based on weakening momentum.
3. Vortex Indicator (Directional Volatility):
A diff-based implementation of the Vortex Indicator is used to validate whether volatility is expanding in favor of the trend. This prevents false entries during indecision phases or low-momentum conditions.
4. White Line Bias Filter (Structural Trend):
The strategy calculates the midpoint of the highest high and lowest low over a user-defined period. This “White Line” serves as a structural trend bias, ensuring entries align with the broader context — not just momentary momentum.
5. Volume Spike Confirmation:
To avoid manipulation and choppy conditions, the strategy confirms breakouts only when the current bar’s volume exceeds the median volume of recent candles by a set multiplier. This filters out noise and ensures only high-conviction moves trigger entries.
6. Breakout with Divergence Timing:
A hybrid logic checks for price breaking previous range highs/lows (breakouts), combined with simulated divergence behavior based on RSI-like momentum. This helps align entry timing with areas where price is likely to accelerate.
⚙️ Trade Management Logic:
Entry Conditions:
Triggered when all conditions align: ZLEMA slope, Vortex confirmation, White Line bias, volume spike, and divergence-based breakout.
Take Profits:
TP1: 50% of position is closed using a limit order
TP2: Remaining 50% closed with another limit order
This split exit approach lets profits run while locking in gains early.
Exits on Trend Weakness:
If trend conditions weaken (slope flip or vortex flip), the position is exited before a full reversal occurs — helping protect capital during exhaustion phases.
Reentry Delay:
Enforces a 1-bar cooldown between exit and new entries to avoid “ping-pong” signals and maintain clean backtest results.
📊 Real-Time Dashboard (On-Chart):
Displays critical stats including:
Current position (Long, Short, or Flat)
Entry price
TP1 and TP2 hit status
Win rate (%)
Profit factor
Bars since entry
This makes live trading or visual backtesting easy to interpret and track.
✅ Key Facts:
Non-Repainting: All signals are calculated using confirmed bar data only. No future bars or security() functions are used.
Original Logic: This is not a generic mashup. Each component (ZLEMA slope, vortex diff, breakout divergence, volume spike filtering, White Line structure) is optimized to work in tandem.
Best Timeframes: 1H – 4H
Markets: Crypto, Forex, Indices — any market with trending behavior and measurable volume
⚠️ Disclaimer:
This strategy is for educational purposes only. It is not financial advice or a recommendation to trade. Past performance does not guarantee future results. Always trade with proper risk management and backtest strategies before live deployment.
🧠 Summary:
Stealth Trigger X is built for traders who want:
Precision entries
Early trend exits
Reliable backtest integrity
Clean logic with no repainting
It is especially effective in breakout environments where volume and momentum align — and excels at avoiding weak or manipulated trends.

DI+/- Cross Strategy with ATR SL and 2% TPDI+/- Cross Strategy with ATR Stop Loss and 2% Take Profit
📝 Script Description for Publishing:
This strategy is based on the directional movement of the market using the Average Directional Index (ADX) components — DI+ and DI- — to generate entry signals, with clearly defined risk and reward targets using ATR-based Stop Loss and Fixed Percentage Take Profit.
🔍 How it works:
Buy Signal: When DI+ crosses above 40, signaling strong bullish momentum.
Sell Signal: When DI- crosses above 40, indicating strong bearish momentum.
Stop Loss: Dynamically calculated using ATR × 1.5, to account for market volatility.
Take Profit: Fixed at 2% above/below the entry price, for consistent reward targeting.
🧠 Why it’s useful:
Combines momentum breakout logic with volatility-based risk management.
Works well on trending assets, especially when combined with higher timeframe filters.
Clean BUY and SELL visual labels make it easy to interpret and backtest.
✅ Tips for Use:
Use on assets with clear trends (e.g., major forex pairs, trending stocks, crypto).
Best on 30m – 4H timeframes, but can be customized.
Consider combining with other filters (e.g., EMA trend direction or Bollinger Bands) for even better accuracy.

QuantJazz Turbine Trader BETA v1.17QuantJazz Turbine Trader BETA v1.17 - Strategy Introduction and User Guide
Strategy Introduction
Welcome to the QuantJazz Turbine Trader BETA v1.17, a comprehensive trading strategy designed for TradingView. This strategy is built upon oscillator principles, drawing inspiration from the Turbo Oscillator by RedRox, and incorporates multiple technical analysis concepts including RSI, MFI, Stochastic oscillators, divergence detection, and an optional FRAMA (Fractal Adaptive Moving Average) filter.
The Turbine Trader aims to provide traders with a flexible toolkit for identifying potential entry and exit points in the market. It presents information through a main signal line oscillator, a histogram, and various visual cues like dots, triangles, and divergence lines directly on the indicator panel. The strategy component allows users to define specific conditions based on these visual signals to trigger automated long or short trades within the TradingView environment.
This guide provides an overview of the strategy's components, settings, and usage. Please remember that this is a BETA version (v1.17). While developed with care, it may contain bugs or behave unexpectedly.
LEGAL DISCLAIMER: QuantJazz makes no claims about the fitness or profitability of this tool. Trading involves significant risk, and you may lose all of your invested capital. All trading decisions made using this strategy are solely at the user's discretion and responsibility. Past performance is not indicative of future results. Always conduct thorough backtesting and risk assessment before deploying any trading strategy with real capital.
This work is licensed under Creative Commons Attribution-NonCommercial-ShareAlike 4.0 International.
Core Concepts and Visual Elements
The Turbine Trader indicator displays several components in its own panel below the main price chart:
1. Signal Line (Avg & Avg2): This is the primary oscillator. It's a composite indicator derived from RSI, MFI (Money Flow Index), and Stochastic calculations, smoothed using an EMA (Exponential Moving Average).
Avg: The faster smoothed signal line.
Avg2: The slower smoothed signal line.
Color Coding: The space between Avg and Avg2 is filled. The color (Neon Blue/gColor or Neon Purple/rColor) indicates the trend based on the relationship between Avg and Avg2. Blue suggests bullish momentum (Avg > Avg2), while Purple suggests bearish momentum (Avg2 > Avg).
Zero Line Crosses: Crossovers of the Avg line with the zero level can indicate shifts in momentum.
2. Histogram (resMfi): This histogram is based on smoothed and transformed MFI calculations (Fast MFI and Slow MFI).
Color Coding: Bars are colored Neon Blue (histColorUp) when above zero, suggesting bullish pressure, and Neon Purple (histColorDn) when below zero, suggesting bearish pressure. Transparency is applied.
Zero Line Crosses: Crossovers of the histogram with the zero level can signal potential shifts in money flow.
3. Reversal Points (Dots): Dots appear on the Signal Line (specifically on Avg2) when the color changes (i.e., Avg crosses Avg2).
Small Dots: Appear when a reversal occurs while the oscillator is in an "extreme" zone (below -60 for bullish reversals, above +60 for bearish reversals).
Large Dots: Appear when a reversal occurs outside of these extreme zones.
Colors: Blue (gRdColor) for bullish reversals (Avg crossing above Avg2), Purple (rRdColor) for bearish reversals (Avg crossing below Avg2).
4. Take Profit (TP) Signals (Triangles): Small triangles appear above (+120) or below (-120) the zero line.
Bearish Triangle (Down, Purple rTpColor): Suggests a potential exit point for long positions or an entry point for short positions, based on the oscillator losing upward momentum above the 50 level.
Bullish Triangle (Up, Blue gTpColor): Suggests a potential exit point for short positions or an entry point for long positions, based on the oscillator losing downward momentum below the -50 level.
5. Divergence Lines: The strategy automatically detects and draws potential regular and hidden divergences between the price action (highs/lows) and the Signal Line (Avg).
Regular Bullish Divergence (White bullDivColor line, ⊚︎ label): Price makes a lower low, but the oscillator makes a higher low. Suggests potential bottoming.
Regular Bearish Divergence (White bearDivColor line, ⊚︎ label): Price makes a higher high, but the oscillator makes a lower high. Suggests potential topping.
Hidden Bullish Divergence (bullHidDivColor line, ⊚︎ label): Price makes a higher low, but the oscillator makes a lower low. Suggests potential continuation of an uptrend.
Hidden Bearish Divergence (bearHidDivColor line, ⊚︎ label): Price makes a lower high, but the oscillator makes a higher high. Suggests potential continuation of a downtrend.
Delete Broken Divergence Lines: If enabled, newer divergence lines originating from a similar point will replace older ones.
6. Status Line: A visual bar at the top (95 to 105) and bottom (-95 to -105) of the indicator panel. Its color intensity reflects the confluence of signals:
Score Calculation: +1 if Avg > Avg2, +1 if Avg > 0, +1 if Histogram > 0.
Top Bar (Bullish): Bright Blue (gStatColor) if score is 3, Faded Blue if score is 2, Black otherwise.
Bottom Bar (Bearish): Bright Purple (rStatColor) if score is 0, Faded Purple if score is 1, Black otherwise.
Strategy Settings Explained
The strategy's behavior is controlled via the settings panel (gear icon).
1. Date Range:
Start Date, End Date: Define the period for backtesting. Trades will only occur within this range.
2. Optional Webhook Configuration: (For Automation)
3C Email Token, 3C Bot ID: Enter your 3Commas API credentials if you plan to automate trading using webhooks. The strategy generates JSON alert messages compatible with 3Commas. You can go ahead and just leave the text field as defaulted, "TOKEN HERE" / "BOT ID HERE" if not using any bot automations at this time. You can always come back later and automate it. More info can be made available from QuantJazz should you need automation assistance with custom indicators and trading strategies.
3. 🚀 Signal Line:
Turn On/Off: Show or hide the main signal lines (Avg, Avg2).
gColor, rColor: Set the colors for bullish and bearish signal line states.
Length (RSI): The lookback period for the internal RSI calculation. Default is 2.
Smooth (EMA): The smoothing period for the EMAs applied to the composite signal. Default is 9.
RSI Source: The price source used for RSI calculation (default: close).
4. 📊 Histogram:
Turn On/Off: Show or hide the histogram.
histColorUp, histColorDn: Set the colors for positive and negative histogram bars.
Length (MFI): The base lookback period for MFI calculations. Default is 5. Fast and Slow MFI lengths are derived from this.
Smooth: Smoothing period for the final histogram output. Default is 1 (minimal smoothing).
5.💡 Other:
Show Divergence Line: Toggle visibility of regular divergence lines.
bullDivColor, bearDivColor: Colors for regular divergence lines.
Show Hidden Divergence: Toggle visibility of hidden divergence lines.
bullHidDivColor, bearHidDivColor: Colors for hidden divergence lines.
Show Status Line: Toggle visibility of the top/bottom status bars.
gStatColor, rStatColor: Colors for the status line bars.
Show TP Signal: Toggle visibility of the TP triangles.
gTpColor, rTpColor: Colors for the TP triangles.
Show Reversal points: Toggle visibility of the small/large dots on the signal line.
gRdColor, rRdColor: Colors for the reversal dots.
Delete Broken Divergence Lines: Enable/disable automatic cleanup of older divergence lines.
6. ⚙️ Strategy Inputs: (CRITICAL for Trade Logic)
This section defines which visual signals trigger trades. Each signal (Small/Large Dots, TP Triangles, Bright Bars, Signal/Histogram Crosses, Signal/Histogram Max/Min, Divergences) has a dropdown menu:
Long: This signal can trigger a long entry.
Short: This signal can trigger a short entry.
Disabled: This signal will not trigger any entry.
Must Be True Checkbox: If checked for a specific signal, that signal's condition must be met for any trade (long or short, depending on the dropdown selection for that signal) to be considered. Multiple "Must Be True" conditions act as AND logic – all must be true simultaneously.
How it Works:
The strategy first checks if all conditions marked as "Must Be True" (for the relevant trade direction - long or short) are met.
If all "Must Be True" conditions are met, it then checks if at least one of the conditions not marked as "Must Be True" (and set to "Long" or "Short" respectively) is also met.
If both steps pass, and other filters (like Date Range, FRAMA) allow, an entry order is placed.
Example: If "Large Bullish Dot" is set to "Long" and "Must Be True" is checked, AND "Bullish Divergence" is set to "Long" but "Must Be True" is not checked: A long entry requires BOTH the Large Bullish Dot AND the Bullish Divergence to occur simultaneously. If "Large Bullish Dot" was "Long" but not "Must Be True", then EITHER a Large Bullish Dot OR a Bullish Divergence could trigger a long entry (assuming no other "Must Be True" conditions are active).
Note: By default, the strategy is configured for long-only trades (strategy.risk.allow_entry_in(strategy.direction.long)). To enable short trades, you would need to comment out or remove this line in the Pine Script code and configure the "Strategy Inputs" accordingly.
7. 💰 Take Profit Settings:
Take Profit 1/2/3 (%): The percentage above the entry price (for longs) or below (for shorts) where each TP level is set. (e.g., 1.0 means 1% profit).
TP1/2/3 Percentage: The percentage of the currently open position to close when the corresponding TP level is hit. The percentages should ideally sum to 100% if you intend to close the entire position across the TPs.
Trailing Stop (%): The percentage below the highest high (for longs) or above the lowest low (for shorts) reached after the activation threshold, where the stop loss will trail.
Trailing Stop Activation (%): The minimum profit percentage the trade must reach before the trailing stop becomes active.
Re-entry Delay (Bars): The minimum number of bars to wait after a TP is hit before considering a re-entry. Default is 1 (allows immediate re-entry on the next bar if conditions met).
Re-entry Price Offset (%): The percentage the price must move beyond the previous TP level before a re-entry is allowed. This prevents immediate re-entry if the price hovers around the TP level.
8. 📈 FRAMA Filter: (Optional Trend Filter)
Use FRAMA Filter: Enable or disable the filter.
FRAMA Source, FRAMA Period, FRAMA Fast MA, FRAMA Slow MA: Parameters for the FRAMA calculation. Defaults provided are common starting points.
FRAMA Filter Type:
FRAMA > previous bars: Allows trades only if FRAMA is significantly above its recent average (defined by FRAMA Percentage and FRAMA Lookback). Typically used to confirm strong upward trends for longs.
FRAMA < price: Allows trades only if FRAMA is below the current price (framaSource). Can act as a baseline trend filter.
FRAMA Percentage (X), FRAMA Lookback (Y): Used only for the FRAMA > previous bars filter type.
How it Affects Trades: If Use FRAMA Filter is enabled:
Long entries require the FRAMA filter condition to be true.
Short entries require the FRAMA filter condition to be false (as currently coded, this acts as an inverse filter for shorts if enabled).
How to Use the Strategy
1. Apply to Chart: Open your desired chart on TradingView. Click "Indicators", find "QuantJazz Turbine Trader BETA v1.17" (you might need to add it via Invite-only scripts or if published publicly), and add it to your chart. The oscillator appears below the price chart, and the strategy tester panel opens at the bottom.
2. Configure Strategy Properties: In the Pine Script code itself (or potentially via the UI if supported), adjust the strategy() function parameters like initial_capital, default_qty_value, commission_value, slippage, etc., to match your account, broker fees, and risk settings. The user preferences provided (e.g., 1000 initial capital, 0.1% commission) are examples. Remember use_bar_magnifier is false by default in v1.17.
3. Configure Inputs (Settings Panel):
Set the Date Range for backtesting.
Crucially, configure the ⚙️ Strategy Inputs. Decide which signals should trigger entries and whether they are mandatory ("Must Be True"). Start simply, perhaps enabling only one or two signals initially, and test thoroughly. Remember the default long-only setting unless you modify the code.
Set up your 💰 Take Profit Settings, including TP levels, position size percentages for each TP, and the trailing stop parameters. Decide if you want to use the re-entry feature.
Decide whether to use the 📈 FRAMA Filter and configure its parameters if enabled.
Adjust visual elements (🚀 Signal Line, 📊 Histogram, 💡 Other) as needed for clarity.
4. Backtest: Use the Strategy Tester panel in TradingView. Analyze the performance metrics (Net Profit, Max Drawdown, Profit Factor, Win Rate, Trade List) across different assets, timeframes, and setting configurations. Pay close attention to how different "Strategy Inputs" combinations perform.
5. Refine: Based on backtesting results, adjust the input settings, TP/SL strategy, and signal combinations to optimize performance for your chosen market and timeframe, while being mindful of overfitting.
6. Automation (Optional): If using 3Commas or a similar platform:
Enter your 3C Email Token and 3C Bot ID in the settings.
Create alerts in TradingView (right-click on the chart or use the Alert panel).
Set the Condition to "QuantJazz Turbine Trader BETA v1.17".
In the "Message" box, paste the corresponding placeholder, which will pass the message in JSON from our custom code to TradingView to pass through your webhook: {{strategy.order.alert_message}}.
In the next tab, configure the Webhook URL provided by your automation platform. Put a Whale sound, while you're at it! 🐳
When an alert triggers, TradingView will send the pre-formatted JSON message from the strategy code to your webhook URL.
Final Notes
The QuantJazz Turbine Trader BETA v1.17 offers a wide range of customizable signals and strategy logic. Its effectiveness heavily depends on proper configuration and thorough backtesting specific to the traded asset and timeframe. Start with the default settings, understand each component, and methodically test different combinations of signals and parameters. Remember the inherent risks of trading and never invest capital you cannot afford to lose.

IU Bigger than range strategyDESCRIPTION
IU Bigger Than Range Strategy is designed to capture breakout opportunities by identifying candles that are significantly larger than the previous range. It dynamically calculates the high and low of the last N candles and enters trades when the current candle's range exceeds the previous range. The strategy includes multiple stop-loss methods (Previous High/Low, ATR, Swing High/Low) and automatically manages take-profit and stop-loss levels based on user-defined risk-to-reward ratios. This versatile strategy is optimized for higher timeframes and assets like BTC but can be fine-tuned for different instruments and intervals.
USER INPUTS:
Look back Length: Number of candles to calculate the high-low range. Default is 22.
Risk to Reward: Sets the target reward relative to the stop-loss distance. Default is 3.
Stop Loss Method: Choose between:(Default is "Previous High/Low")
- Previous High/Low
- ATR (Average True Range)
- Swing High/Low
ATR Length: Defines the length for ATR calculation (only applicable when ATR is selected as the stop-loss method) (Default is 14).
ATR Factor: Multiplier applied to the ATR to determine stop-loss distance(Default is 2).
Swing High/Low Length: Specifies the length for identifying swing points (only applicable when Swing High/Low is selected as the stop-loss method).(Default is 2)
LONG CONDITION:
The current candle’s range (absolute difference between open and close) is greater than the previous range.
The closing price is higher than the opening price (bullish candle).
SHORT CONDITIONS:
The current candle’s range exceeds the previous range.
The closing price is lower than the opening price (bearish candle).
LONG EXIT:
Stop-loss:
- Previous Low
- ATR-based trailing stop
- Recent Swing Low
Take-profit:
- Defined by the Risk-to-Reward ratio (default 3x the stop-loss distance).
SHORT EXIT:
Stop-loss:
- Previous High
- ATR-based trailing stop
- Recent Swing High
Take-profit:
- Defined by the Risk-to-Reward ratio (default 3x the stop-loss distance).
ALERTS:
Long Entry Triggered
Short Entry Triggered
WHY IT IS UNIQUE:
This strategy dynamically adapts to different market conditions by identifying candles that exceed the previous range, ensuring that it only enters trades during strong breakout scenarios.
Multiple stop-loss methods provide flexibility for different trading styles and risk profiles.
The visual representation of stop-loss and take-profit levels with color-coded plots improves trade monitoring and decision-making.
HOW USERS CAN BENEFIT FROM IT:
Ideal for breakout traders looking to capitalize on momentum-driven price moves.
Provides flexibility to customize stop-loss methods and fine-tune risk management parameters.
Helps minimize drawdowns with a strong risk-to-reward framework while maximizing profit potential.
