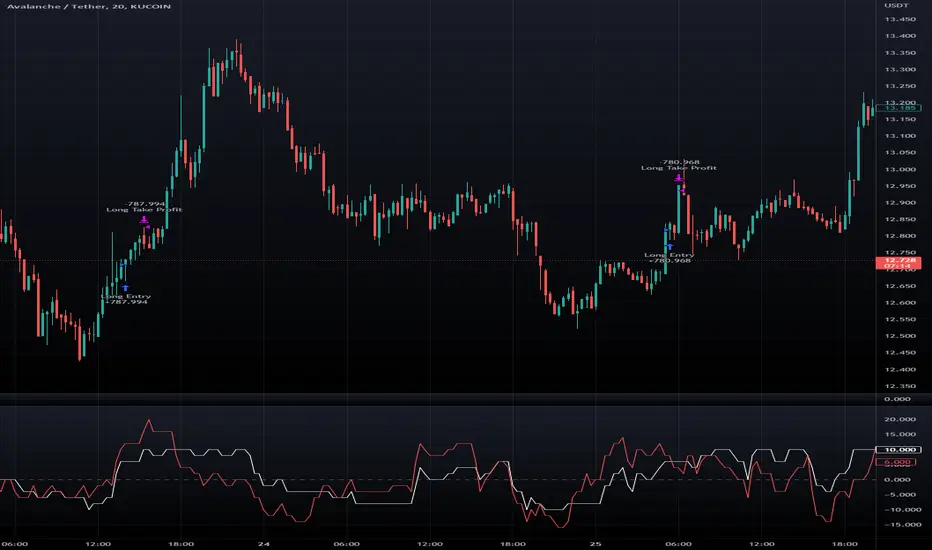
Channels With NVI Strategy [TradeDots]The "Channels With NVI Strategy" is a trading strategy that identifies oversold market instances during a bullish trading market. Specifically, the strategy integrates two principal indicators to deliver profitable opportunities, anticipating potential uptrends.
2 MAIN COMPONENTS
1. Channel Indicators: This strategy gives users the flexibility to choose between Bollinger Band Channels or Keltner Channels. This selection can be made straight from the settings, allowing the traders to adjust the tool according to their preferences and strategies.
2. Negative Volume Indicator (NVI): An indicator that calculates today's price rate of change, but only when today's trading volume is less than the previous day's. This functionality enables users to detect potential shifts in the trading volume with time and price.
ENTRY CONDITION
First, the assets price must drop below the lower band of the channel indicator.
Second, NVI must ascend above the exponential moving average line, signifying a possible flood of 'smart money' (large institutional investors or savvy traders), indicating an imminent price rally.
EXIT CONDITION
Exit conditions can be customized based on individual trading styles and risk tolerance levels. Traders can define their ideal take profit or stop loss percentages.
Moreover, the strategy also employs an NVI-based exit policy. Specifically, if the NVI dips under the exponential moving average – suggestive of a fading trading momentum, the strategy grants an exit call.
RISK DISCLAIMER
Trading entails substantial risk, and most day traders incur losses. All content, tools, scripts, articles, and education provided by TradeDots serve purely informational and educational purposes. Past performances are not definitive predictors of future results.
Cerca negli script per "take profit"

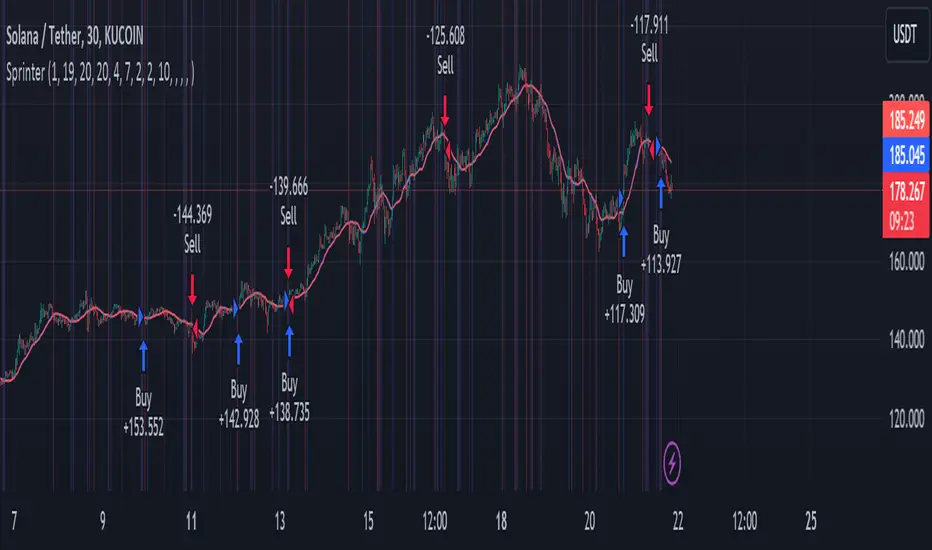
Big RunnerPresenting the "Big Runner" technique, dubbed "Sprinter," which is intended to help traders looking for momentum chances recognise important market swings. This approach maximises profit potential while controlling risk by using trend ribbons and moving averages to identify entry and exit locations.
Important characteristics:
Moving Averages: To determine the direction of the underlying trend, moving averages, both rapid and slow, are used. Depending on their preferred trading strategy, traders can alter the duration of these averages.
Trend Ribbon: Shows phases of bullish and bearish momentum by using a ribbon indicator to visualise the strength of the trend. Trend transitions are simple to spot for traders so they can make wise decisions.
Buy and Sell Signals: This tool generates buy and sell signals that indicate possible entry and exit opportunities based on the crossing and crossunder of moving averages.
Stop Loss/Take Profit Management: This feature enables traders to successfully apply risk management methods by giving them the ability to set stop loss and take profit levels as a percentage of the entry price.
Dynamic Position Sizing: Optimises capital allocation for every trade by dynamically calculating position size depending on leverage and portfolio proportion.
Implementation:
Long Entry: Started when a bullish trend is indicated by a price cross above the fast and slow moving averages. To control risk and lock in earnings, stop loss and take profit thresholds are established appropriately.
Short Entry: Indicates a bearish trend when the price crosses below both moving averages. The concepts of risk management are similar, with dynamic calculations used to determine take-profit and stop-loss levels.
Extra Personalisation:
Take Profit/Stop Loss Management: Provides the ability to select a take profit and stop loss
API Integration: This feature improves execution flexibility and efficiency by enabling traders to include custom parameters for automated trading.
Notice:
Trading entails risk, and performances in the past do not guarantee future outcomes. Before making any trades with this approach, careful analysis and risk management are necessary.
In summary:
By integrating risk management procedures with technical indicators, the "Big Runner" strategy provides a thorough method for identifying noteworthy market changes and achieving the best possible trading results. Traders can adjust parameters to suit their interests and style of trading, giving them the confidence to traverse volatile market situations.
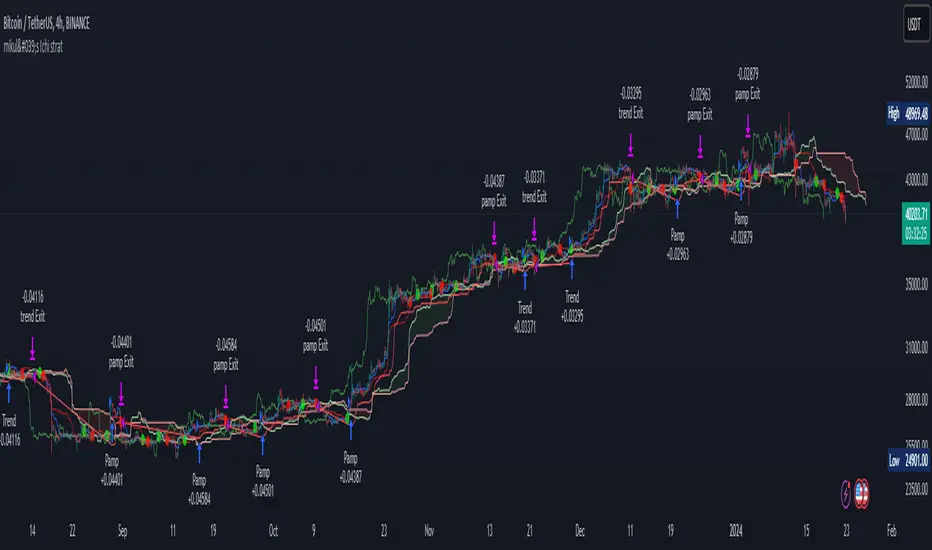
mikul's Ichimoku Cloud Strategy v 2.0This is an Ichimoku cloud (long) strategy with both pump signals and trend signals.
It has both ATR stop loss, trailing percentage stop loss and also ichomoku cloud exit signal.
You can also combine the ATR stop loss and the trailing percentage stop loss with the Ichimoku cloud exit signal and a the take profit percentage.
In this example I use the default ATR stop loss method for taking profit.
10000$ is my initial capital and I risking 10% every trade. Commission is set to 0.075%.
Everything is set to default in this example.
There is also a moving average filter that is available, set to 200 EMA and turned off by default.
Conditions for taking a long position:
Trend Signal:
• Positive cross above the cloud
• Chikou span(lagging span) above price action
• Price above the Cloud
Pump Signal:
• Cloud ahead of you is green
• Price above the cloud
• Positive cross (Doesn’t Matter Where)
• Chikou span(lagging span) above the cloud
Ichimoku cloud exit signals:
• Negative cross
• Chikou span(lagging span) touches the price action
This strategy is totally free as freedom and as in free beer!
I do this for myself, but I like sharing and I want everyone to have the ability to use what I make no matter your economic situation.
If you have any suggestions for this strategy or perhaps any filtering options that could be fun to experiment with, then please leave a comment with your suggestion and maybe I can add it to the next version.
TrailingTakeProfit exampleQuite recently I came upon a concept of Trailing Take Profit and I couldn't find a PineScript which implements it for the fastest possible execution, so here it is :)
Everybody knows Trailing StopLoss - an invisible mechanism follows the price and exits the trade once the price retreats too much from its recent most extended favourable value. Trailing TakeProfit does the similar thing, but at the opposite end - the trade gets closed if a price moves too well, in too favourable extent.
Why close the trade if it is going so good? Well, whatever goes up, must go down and vice versa. It is expected, that after fast rally a market will soon fall and after a dump it will go up. So Trailing TakeProfit's role is to secure profits.
But how does Trailing TakeProfit differ from the standard one? "Trailing" means, the exit level is moving. Its role is to be executed only after a rapid favourable move within 1-2 candles, not more. We never know when a rapid move happens, but when it does, we wanna catch those pips and quickly exit without looking back.
Visually Trailing TakeProfit levels are... bands. In this script example these are ATR multiplied bands (aka Keltner Channel), but they could also be Bollinger Bands or something else.
The code is simple just to focus on this single functionality, so you can quickly copy-paste it into your script. Entries are triggered by default SMA crosses.
P.S. I wouldn't be myself, if I didn't add alert messages compatible with the syntax of recently revamped TradingConnector - both in the code already and in the table showing them.

simple pull back TJlv26This is a very simple strategy for swing trade in stock indexes.
this strategy only trade long position, recommend to use this in day chart of sp500 or nas100.
SPX
NDX
Buy condition:
close price above long term SMA(default period 200),close price under short term SMA(default period 10), RSI is under 30(default period 3)
Sell condition:
1:if close price is above short period SMA and current close price is lower than low price of previous bar
2:hit the take profit target(default value 10%)
3:hit the stop loss target(default value 5%)
from author:
As you can see, it's a very simple logic. You only start trading when the price is above long-term moving average, so you can avoid risk by taking positions only in the uptrend. You also use stop-loss, so even in situations where there is a significant downturn, you can minimize losses.
However, it's important to note that this strategy performs well only in markets where long-term (approximately 10 years) upward movements are expected. It often yields disappointing results during prolonged bear markets. This is where each user's fundamental analysis comes into play, as there is no such thing as a perfect trading logic.
Another noteworthy point is that, as seen in the results of back testing, this strategy tends to underperform buy-and-hold in most cases. As mentioned earlier, it's a strategy focused on risk mitigation and starting trades at the most advantageous prices, so I believe that using leverage of 2-4 times can maximize profits. However, trading with leverage is highly risky, so it should be assessed based on each individual's risk tolerance.

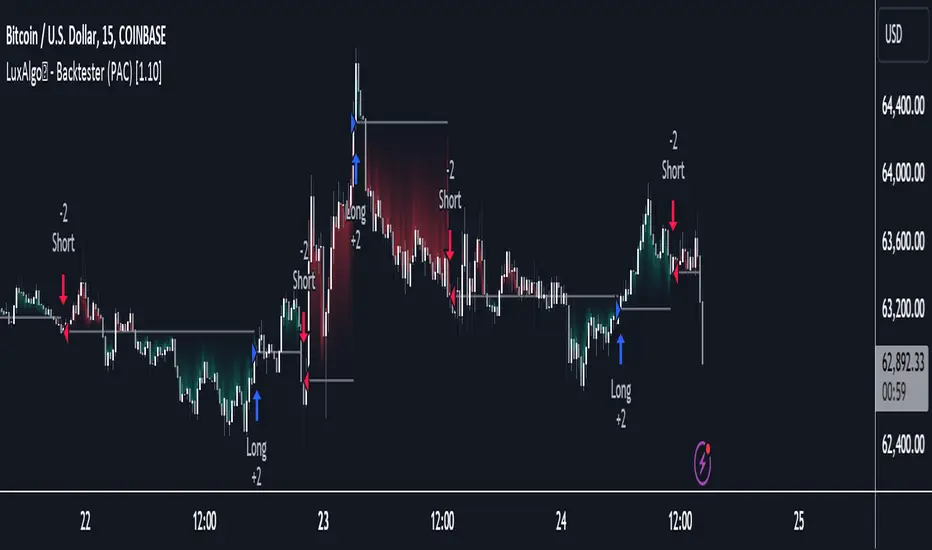
LuxAlgo - Backtester (PAC)The PAC Backtester is an innovative strategy script that allows users to create a wide variety of strategies derived from price action-related concepts for a data-driven approach to discretionary trading strategies.
Thanks to our 'Step' and 'Match' algorithm, users can create custom and complex strategy entries and exits from features such as market structure, order blocks, imbalances, as well as any external indicators, allowing users to create entries from a sequence of conditions and/or multiple matching conditions.
We included a complete alert system that will send a notification for each action taken by the strategy and we also allow users to set custom messages for each action taken by a strategy.
🔶 Features
🔹 Step & Match Algorithm
More complex entry rules can be created by using multiple conditions together, this is done thanks to the Step dropdown setting on the right of each condition.
The Step setting is directly related to the Step & Match algorithm and works in two ways:
When two or more conditions have the same step number, both conditions are evaluated. Used to test matching conditions.
When two or more conditions have different step numbers, each condition will be evaluated in order, testing for the first step and switching to the next step once the previous one is true. When the final step is true the strategy will open a market order. Used to create a sequence of conditions.
This operation is complementary, as you can create a sequence of conditions with one step consisting of two or more matching conditions as long as they have the same step number.
🔹 Fully Customizable Price Action Concepts As Entries
We allow the users to use market structures, order blocks, imbalances, and external sources together to set their custom entry and exit conditions.
Market structures are commonly used to determine trend direction by indicating when prices break prior swing points. Their occurrence can be used as entry conditions.
Order blocks highlight areas where institutional market participants open positions, one can use order blocks to determine confirmation entries or potential targets as we can expect there is a large amount of liquidity at these order blocks. Price entering, being within, or mitigating an order block can be used as an entry condition.
Market imbalances highlight areas where there is a disparity between supply and demand. Price entering, being within, or mitigating an imbalance can be used as an entry condition.
This system also allows the use of external sources to create entry and exit conditions, such as moving averages, bands, trailing stops...etc.
🔹 Complete Alert System
Users can get alerted for any action executed by a strategy, from opening positions to closing them.
The message field in the Alert Messages setting section allows for the strategy to send a custom alert message depending on the action taken by the strategy, if no messages are set the strategy will send default messages.
🔶 Usage
Users can create complete price action strategies from this script, let's see an example using the following entry conditions:
Long: Mitigated bearish order block occurring during the New York session after a mitigated bearish imbalance.
Short: Mitigated bullish order block occurring during the New York session after a mitigated bullish imbalance.
Take Profit: 2 points away from the entry price.
Stop Loss: 1 point away from the entry price.
We can also use features from Price Action Concepts™ to construct custom exit conditions, leading to the following strategy conditions:
Long: Bullish CHoCH and price mitigates bearish FVG.
Short: Bearish CHoCH and price mitigates bullish FVG.
Exit Long: Price mitigates bearish order block.
Exit Short: Price mitigates bullish order block.
Users can achieve a wide variety of results by using external indicators as an input source for entries and exits, combining the best from price action and technical indicators. We might for example be interested in exiting a position when the RSI oscillator is overbought or oversold.
🔶 Strategy Properties (Important)
This script backtest is done on daily EURGBP, using the following backtesting properties:
Balance (default): 10 000 (default base currency)
Order Size: 10% of the equity
Comission: 3.4 pips (average spread for EURGBP)
Slippage: 1 tick
Stop Loss: 0.01 points away from entry price
We use these properties to ensure a realistic preview of the backtesting system, do note that default properties can be different for various reasons described below:
Order Size: 1 contract by default, this is to allow the strategy to run properly on most instruments such as futures.
Comission: Comission can vary depending on the market and instrument, there is no default value that might return realistic results.
We strongly recommend all users to ensure they adjust the Properties within the script settings to be in line with their accounts & trading platforms of choice to ensure results from strategies built are realistic.
🔶 How to access
You can see the Author's Instructions below to learn how to get access.
EUR/USD 45 MIN Strategy - FinexBOTThis strategy uses three indicators:
RSI (Relative Strength Index) - It indicates if a stock is potentially overbought or oversold.
CCI (Commodity Channel Index) - It measures the current price level relative to an average price level over a certain period of time.
Williams %R - It is a momentum indicator that shows whether a stock is at the high or low end of its trading range.
Long (Buy) Trades Open:
When all three indicators suggest that the stock is oversold (RSI is below 25, CCI is below -130, and Williams %R is below -85), the strategy will open a buy position, assuming there is no current open trade.
Short (Sell) Trades Open:
When all three indicators suggest the stock is overbought (RSI is above 75, CCI is above 130, and Williams %R is above -15), the strategy will open a sell position, assuming there is no current open trade.
SL (Stop Loss) and TP (Take Profit):
SL (Stop Loss) is 0.45%.
TP (Take Profit) is 1.2%.
The strategy automatically sets these exit points as a percentage of the entry price for both long and short positions to manage risks and secure profits. You can easily adopt these inputs according to your strategy. However, default settings are recommended.

Risk Management and Positionsize - MACD exampleMastering Risk Management
Risk management is the cornerstone of successful trading, and it's often the difference between turning a profit and suffering a loss. In light of its importance, I share a risk management tool which you can use for your trading strategies. The script not only assists in position sizing but also comes with built-in technical features that help in market timing. Let's delve into the nitty-gritty details.
Input Parameter: MarginFactor
One of the key features of the script is the MarginFactor input parameter. This element lets you control the portion of your equity used for placing each trade. A MarginFactor of -0.5 means 50% of your total equity will be deployed in placing the position size. Although Tradingview has a built-in option to adjust position sizing in a same way, I personally prefer to have the logic in my pinecode script. The main reason is userexperience in managing and testing different settings for different charts, timeframes and instruments (with the same strategy).
Stoploss and MarginFactor
If your strategy has a 4% stop-loss, you can choose to use only 50% of your equity by setting the MarginFactor to -0.5. In this case, you are effectively risking only 2% of your total capital per trade, which aligns well with the widely-accepted rule of thumb suggesting a 1-2% risk per trade. Similar if your stoploss is only 1% you can choose to change the MarginFactor to 1, resulting in a positionsize of 200% of your equity. The total risk would be again 2% per trade if your stoploss is set to 1%.
Max Drawdown and MarginFactor
Your MarginFactor setting can also be aligned with the maximum drawdown of your strategy, seen during a backtested period of 2-3 years. For example, if the max drawdown is 15%, you could calibrate your MarginFactor accordingly to limit your risk exposure.
Option to Toggle Number of Contracts
The script offers the option to toggle between using a percentage of equity for position sizing or specifying a fixed number of contracts. Utilizing a percentage of equity might yield unrealistic backtest results, especially over longer periods. This occurs because as the capital grows, the absolute position size also increases, potentially inflating the accumulated returns generated by the backtester. On the other hand, setting a fixed number of contracts as your position size offers a more stable and realistic ROI over the backtested period, as it removes the compounding effect on position sizes.
Key Features Strategy
MACD High Time Frame Entry and Exit Logic
The strategy employs a high time frame MACD (Moving Average Convergence Divergence) to make entry and exit decisions. You can easily adjust the timeframe settings and MACD settings in the inputsection to trade on lower timeframes. For more information on the HTF MACD with dynamic smoothing see:
Moving Average High Time Frame Filter
To reduce market 'noise', the strategy incorporates a high time frame moving average filter. This ensures that the trades are aligned with the dominant market trend (trading the trend). In the inputsection traders can easily switch between different type of moving averages. For more information about this HTF filter see:
Dynamic Smoothing
The script includes a feature for dynamic smoothing. The script contains The timeframeToMinutes(tf) function to convert any given time frame into its equivalent in minutes. For example, a daily (D) time frame is converted into 1440 minutes, a weekly (W) into 10,080 minutes, and so forth. Next the smoothing factor is calculated by dividing the minutes of the higher time frame by those of the current time frame. Finally, the script applies a Simple Moving Average (SMA) over the MACD, SIGNAL, and HIST values, MA filter using the dynamically calculated smoothing factor.
User Convenience: One of the major benefits is that traders don't need to manually adjust the smoothing factor when switching between different time frames. The script does this dynamically.
Visual Consistency: Dynamic smoothing helps traders to more accurately visualize and interpret HTF indicators when trading on lower time frames.
Time Frame Restriction: It's crucial to note that the operational time frame should always be lower than the time frame selected in the input sections for dynamic smoothing to function as intended.
By incorporating this dynamic smoothing logic, the script offers traders a nuanced yet straightforward way to adapt High Time Frame indicators for lower time frame trading, enhancing both adaptability and user experience.
Limitations: Exit Strategy
It's crucial to note that the script comes with a simplified exit strategy, devoid of features like a stop-loss, trailing stop-loss or multiple take profits. This means that while the script focuses on entries and risk management, it might result in higher losses if market conditions unexpectedly turn unfavorable.
Conclusion
Effective risk management is pivotal for trading success, and this TradingView script is designed to give you a better idea how to implement positions sizing with your preferred strategy. However, it's essential to note that this tool should not be considered financial advice. Always perform your due diligence and consult with financial advisors before making any trading decisions.
Feel free to use this risk management tool as building block in your trading scripts, Happy Trading!

METRIC-TREND-TRADERThis script is a Fully Automated trading script meant to be used with "Oanda" broker and the plug-ins for algorithmic trading automation.( FOREX ONLY)
This script is meant to capture "TREND FOLLOWING " for intraday charts (1hour) preferably and will hold for days / weeks .trading on forex markets.
(The combination of indicators includes a short high and low price channel and a longer term high and low price channel)
This script is original in description as being automated to try and capture dynamic trending markets with both long and short fractal price channels. although trend trading is not an original concept. trend trading with this dynamic indicator allows the user visualize both short term and longer term price action at the same time, helping to make better trading decisions. the channels are designed to buy breakouts in the direction of the longer term trend while trailing stop a built-in stop loss that allows normal market movement while attempting to lock in flexible profits.
The concept of this indicator is be able to quickly visualize trends by high lighting the large green areas beneath price "when trending long" which is the difference between the (user defined) short term lows and the (user defined) Long period price lows.
For "down trending" markets a large red area above price will be displayed and this is the difference between the (user defined) short term highs and the (user defined) long term highs.
This strategy uses a lower than reward profile to jump in direction of market moves for continuation,
(1 risk to 4 reward)
in the likelihood the instrument will continue (example) 200 pips before it reverts 50 pips in the counter direction.
This strategy should only be used in markets that you believe are "TRENDING" at the time of trading otherwise you risk trend trading a range market.
This script uses a (user defined period) of short term high and low price ( green/red color) and (user defined period) Long Term high and low price (green/red) chosen in the indicator settings menu.
The default parameters are 10 with a (minimum of 1 and maximum of 10000) for the short term channel and 50 with a (minimum of 1 and maximum of 10000) for the long term price channel , the default parameters = roughly 2 days "long term" and 10 hours "short term" of price action on the (1 hour) chart.
Strategy entries and exits , for Long trades the trade will be entered if the short term high crosses above the Long Term high and the Short term low is not equal to the Long term low . the trade will exit if profit or stop loss are hit or if the Short term low crosses under the long term low.
For Short trades the trade will enter short if , the short term low crosses under the long term low and the short term high is not equal to the long term high. the trade will exit if profit or stop loss are hit or the short term high crosses over the long term high
"The default parameters should be kept unless you fully understand the complete strategy"
There are two very important inputs to be selected at the user setting menu "Long Only " and "Short Only" if you are looking to place long trades only select "Long Only" or for short trades select " Short Only" it is not recommended to keep both selected as it will trade both sides!
When the trade is entered a red , a blue and green horizontal dotted line will appear on the chart.
the blue line is the strategy entry price , the red line is the stop loss price , and the green line is the take profit price . the colors will invert if the trade is long or short.
(Setting alerts should be done in the indicator settings menu, and the parameters you chose will determine the stop loss/target and the amount of "units = (position size)" you wish to trade for the (forex only) markets. using "alert() function calls only" is the only alert that should be used with this strategy.
(note : when "alert() function calls only" is set two messages will be sent, one closing any open position in the opposite direction and one placing the new order regardless if you are currently in a trade or not)
Trade targets , stoploss and trade position size are a user defined variables entered in the indicator settings menu. (target pips minimum 0 and a maximum of 1000)(stop pips minimum of 0 and maximum of 1000)
Back test date range is included in the script for back testing different data periods.
the back ground will be colored a transparent navy blue if the period you are looking trading is with in the date range( note: to place live trades the end date will need to be in the future)
this is also adjustable in the settings menu
The avoid spread filter is a user defined time in which the spread is typically higher than average, applying this filter avoids trades in the specified time. When this filter is applied there will be a transparent red back ground color in the specified time.
Back test default setting are equivocal to OANDA:USDJPY
at the time of this publication placing trades with the "Oanda" broker are as follows , USD units = 2000 equal 2000 USD position size . "Oanda" current leverage is 20 to 1 for this particular pair and commission is paid in spread (1.4) pips = 0.19 USD per trade , Margin required for the trade is 100.0 USD , Position sizing = 10% of a 1000 USD account.
OANDA:USDJPY

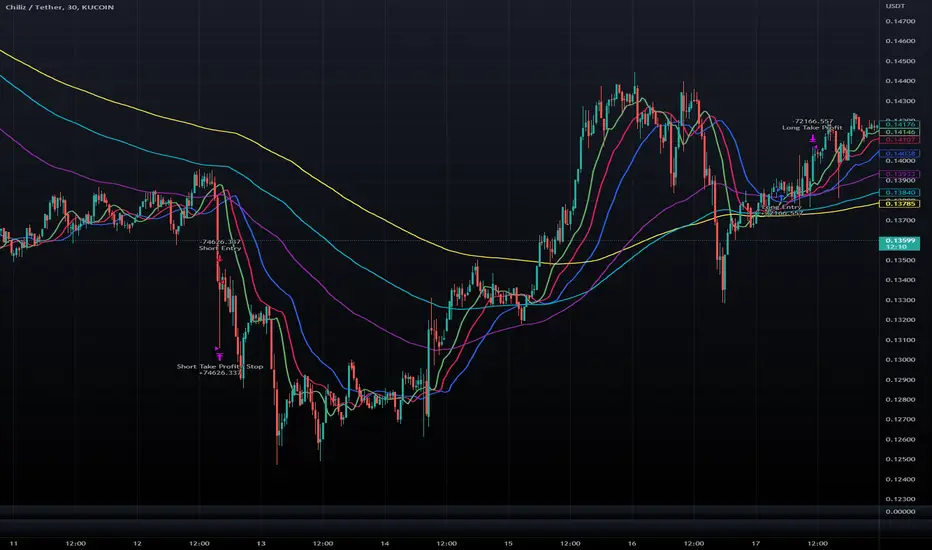
D-BoT Alpha 'Short' SMA and RSI StrategyDostlar selamlar,
İşte son derece basit ama etkili ve hızlı, HTF de çok iyi sonuçlar veren bir strateji daha, hepinize bol kazançlar dilerim ...
Nedir, Nasıl Çalışır:
Strateji, iki ana girdiye dayanır: SMA ve RSI. SMA hesaplama aralığı 200 olarak, RSI ise 14 olarak ayarlanmıştır. Bu değerler, kullanıcı tercihlerine veya geriye dönük test sonuçlarına göre ayarlanabilir.
Strateji, iki koşul karşılandığında bir short sinyali oluşturur: RSI değeri, belirlenen bir giriş seviyesini (burada 51 olarak belirlenmiş) aşar ve kapanış fiyatı SMA değerinin altındadır.
Strateji, kısa pozisyonu üç durumda kapatır: Kapanış fiyatı, takip eden durdurma seviyesinden (pozisyon açıldığından beri en düşük kapanış olarak belirlenmiştir) büyükse, RSI değeri belirlenen bir durdurma seviyesini (bu durumda 54) aşarsa veya RSI değeri belirli bir kar al seviyesinin (bu durumda 32) altına düşerse.
Güçlü Yönleri:
İki farklı gösterge (SMA ve RSI) kullanımı, yalnızca birini kullanmaktan daha sağlam bir sinyal sağlayabilir.
Strateji, karları korumaya ve fiyat dalgalanmalarında kayıpları sınırlamaya yardımcı olabilecek bir iz süren durdurma seviyesi içerir.
Script oldukça anlaşılır ve değiştirmesi nispeten kolaydır.
Zayıf Yönleri:
Strateji, hacim, oynaklık veya daha geniş piyasa eğilimleri gibi diğer potansiyel önemli faktörleri göz önünde bulundurmaz.
RSI seviyeleri ve SMA süresi için belirli parametreler sabittir ve tüm piyasa koşulları veya zaman aralıkları için optimal olmayabilir.
Strateji oldukça basittir. Trade maliyetini (kayma veya komisyonlar gibi) hesaba katmaz, bu da trade performansını önemli ölçüde etkileyebilir.
Bu Stratejiyle Nasıl İşlem Yapılır:
Strateji, short işlemler için tasarlanmıştır. RSI, 51'in üzerine çıktığında ve kapanış fiyatı 200 periyotluk SMA'nın altında olduğunda işleme girer. RSI, 54'ün üzerine çıktığında veya 32'nin altına düştüğünde veya fiyat, pozisyon açıldığından beri en düşük kapanış fiyatının üzerine çıktığında işlemi kapatır.
Lütfen Dikkat, bu strateji veya herhangi bir strateji izole bir şekilde kullanılmamalıdır. Tüm bu çalışmalar eğitsel amaçlıdır. Yatırım tavsiyesi içermez.
This script defines a trading strategy based on Simple Moving Average (SMA) and the Relative Strength Index (RSI) indicators. Here's an overview of how it works, along with its strengths and weaknesses, and how to trade using this strategy:
How it works:
The strategy involves two key inputs: SMA and RSI. The SMA length is set to 200, and the RSI length is set to 14. These values can be adjusted based on user preferences or back-testing results.
The strategy generates a short signal when two conditions are met: The RSI value crosses over a defined entry level (set at 51 here), and the closing price is below the SMA value.
When a short signal is generated, the strategy opens a short position.
The strategy closes the short position under three conditions: If the close price is greater than the trailing stop (which is set as the lowest close since the position opened), if the RSI value exceeds a defined stop level (54 in this case), or if the RSI value drops below a certain take-profit level (32 in this case).
Strengths:
The use of two different indicators (SMA and RSI) can provide a more robust signal than using just one.
The strategy includes a trailing stop, which can help to protect profits and limit losses as the price fluctuates.
The script is straightforward and relatively easy to understand and modify.
Weaknesses:
The strategy doesn't consider other potentially important factors, such as volume, volatility, or broader market trends.
The specific parameters for the RSI levels and SMA length are hard-coded, and may not be optimal for all market conditions or timeframes.
The strategy is very simplistic. It doesn't take into account the cost of trading (like slippage or commissions), which can significantly impact trading performance.
How to trade with this strategy:
The strategy is designed for short trades. It enters a trade when the RSI crosses above 51 and the closing price is below the 200-period SMA. It will exit the trade when the RSI goes above 54 or falls below 32, or when the price rises above the lowest closing price since the position was opened.
Please note, this strategy or any strategy should not be used in isolation. It's important to consider other aspects of trading such as risk management, capital allocation, and combining different strategies to diversify. Back-testing the strategy on historical data and demo trading before going live is also a recommended practice.

Premium Volatility Breakout Strategy [wbburgin]This the premium version of my Volatility Breakout strategy, which improves significantly on the original strategy (publicly available on my profile). Improvements are below. A note about any of my premium scripts: I will continue updating and improving the original (public) versions.
This strategy is not built for any specific asset or timeframe, and has been backtested on crypto, equities, and forex from 1min - 1day. However, I recommend using it on more volatile assets because it is a breakout strategy.
********** My Background
I am an investor, trader, and entrepreneur with 10 years of cryptocurrency and equity trading experience and founder of two fintech startups. I am a graduate of a prestigious university in the United States and carry broad and inclusive interests in mathematical finance, computer science, machine learning / artificial intelligence, as well as other fields.
**********
Improvements over the original Volatility Breakout strategy include:
Faster Trend Detection → The Premium Volatility Breakout strategy will catch trends faster by using adaptive volatility-weighted bands instead of standard-width volatility-weighted bands. This can improve win size and has performed well in my backtesting.
ADX Filter → False breakouts dampen the overall results of the original script, as well as the % profitable,so an ADX filter has been programmed into the script (toggle on/off in settings). This filter will only enter long and short trades when the ADX is above a certain threshold. This is by default toggled off because in most instances it will not be necessary, but in certain environments may be useful.
MA Configuration → Different types of moving averages and weights are now configurable in the settings. These can change the responsiveness of the strategy.
External Trend Filter → I use this strategy as a filter for some of my low-timeframe algorithms. I have added an external trend filter (a plot only displayed in the data window) that will return “1” when the trend is long and “-1” when the trend is short (displayed on-chart with red and green trend curves).
Customizable Alert Messages In-Strategy → In the settings, there will be text boxes where you can create your own alerts. All you will need to do is create an alert in the alert panel on TradingView and leave the message box blank - if you fill out the alert boxes in the settings, these will automatically populate into your alerts. There are in total four different customizable alerts messages: Entry and Exit alerts for both Long and Short sides. If you disable stop loss and/or take profit, these alerts will also be disabled. Similarly, if you disable shorts, all short alerts will be disabled.
About stop losses: This strategy does not come with a stop loss because the moving average acts as a stop loss / trade exit for both long and short entries.
**********
Display
You can turn off highlighting or barcolor in the settings. Additionally, future updates may include a color scheme for users using a light-themed window.
**********
Configuring Alerts
In TradingView desktop, go to the ‘Alerts’ tab on the right panel. Click the “+” button to create a new alert. Select this strategy for the condition and one of the two options that includes alert() function calls. Name the alert what you wish and clear the default message, because your text in the settings will replace this message.
Now that the alert is configured, you can go to the settings of the strategy and fill in your chosen text for the specific alert condition. You will need to check “Long and Short” in the “Trade Direction” setting in order for any Short Alerts to become active.
**********
Disclaimer
Copyright by wbburgin.
The information contained in my Scripts/Indicators/Algorithms does not constitute financial advice or a solicitation to buy or sell any securities of any type. I will not accept liability for any loss or damage, including without limitation any loss of profit, which may arise directly or indirectly from the use of or reliance on such information.
All investments involve risk, and the past performance of a security, industry, sector, market, financial product, trading strategy, backtest, or individual's trading does not guarantee future results or returns. Investors are fully responsible for any investment decisions they make. Such decisions should be based solely on an evaluation of their financial circumstances, investment objectives, risk tolerance, and liquidity needs.

Lorentzian Classification Strategy Based in the model of Machine learning: Lorentzian Classification by @jdehorty, you will be able to get into trending moves and get interesting entries in the market with this strategy. I also put some new features for better backtesting results!
Backtesting context: 2022-07-19 to 2023-04-14 of US500 1H by PEPPERSTONE. Commissions: 0.03% for each entry, 0.03% for each exit. Risk per trade: 2.5% of the total account
For this strategy, 3 indicators are used:
Machine learning: Lorentzian Classification by @jdehorty
One Ema of 200 periods for identifying the trend
Supertrend indicator as a filter for some exits
Atr stop loss from Gatherio
Trade conditions:
For longs:
Close price is above 200 Ema
Lorentzian Classification indicates a buying signal
This gives us our long signal. Stop loss will be determined by atr stop loss (white point), break even(blue point) by a risk/reward ratio of 1:1 and take profit of 3:1 where half position will be closed. This will be showed as buy.
The other half will be closed when the model indicates a selling signal or Supertrend indicator gives a bearish signal. This will be showed as cl buy.
For shorts:
Close price is under 200 Ema
Lorentzian Classification indicates a selling signal
This gives us our short signal. Stop loss will be determined by atr stop loss (white point), break even(blue point) by a risk/reward ratio of 1:1 and take profit of 3:1 where half position will be closed. This will be showed as sell.
The other half will be closed when the model indicates a buying signal or Supertrend indicator gives a bullish signal. This will be showed as cl sell.
Risk management
To calculate the amount of the position you will use just a small percent of your initial capital for the strategy and you will use the atr stop loss or last swing for this.
Example: You have 1000 usd and you just want to risk 2,5% of your account, there is a buy signal at price of 4,000 usd. The stop loss price from atr stop loss or last swing is 3,900. You calculate the distance in percent between 4,000 and 3,900. In this case, that distance would be of 2.50%. Then, you calculate your position by this way: (initial or current capital * risk per trade of your account) / (stop loss distance).
Using these values on the formula: (1000*2,5%)/(2,5%) = 1000usd. It means, you have to use 1000 usd for risking 2.5% of your account.
We will use this risk management for applying compound interest.
> In settings, with position amount calculator, you can enter the amount in usd of your account and the amount in percentage for risking per trade of the account. You will see this value in green color in the upper left corner that shows the amount in usd to use for risking the specific percentage of your account.
> You can also choose a fixed amount, so you will have to activate fixed amount in risk management for trades and set the fixed amount for backtesting.
Script functions
Inside of settings, you will find some utilities for display atr stop loss, break evens, positions, signals, indicators, a table of some stats from backtesting, etc.
You will find the settings for risk management at the end of the script if you want to change something or trying new values for other assets for backtesting.
If you want to change the initial capital for backtest the strategy, go to properties, and also enter the commisions of your exchange and slippage for more realistic results.
In risk managment you can find an option called "Use leverage ?", activate this if you want to backtest using leverage, which means that in case of not having enough money for risking the % determined by you of your account using your initial capital, you will use leverage for using the enough amount for risking that % of your acount in a buy position. Otherwise, the amount will be limited by your initial/current capital
I also added a function for backtesting if you had added or withdrawn money frequently:
Adding money: You can choose how often you want to add money (Monthly, yearly, daily or weekly). Then a fixed amount of money and activate or deactivate this function
Withdraw money: You can choose if you want to withdraw a fixed amount or a percentage of earnings. Then you can choose a fixed amount of money, the period of time and activate or deactivate this function. Also, the percentage of earnings if you choosed this option.
Some other assets where strategy has worked
BTCUSD 4H, 1D
ETHUSD 4H, 1D
BNBUSD 4H
SPX 1D
BANKNIFTY 4H, 15 min
Some things to consider
USE UNDER YOUR OWN RISK. PAST RESULTS DO NOT REPRESENT THE FUTURE.
DEPENDING OF % ACCOUNT RISK PER TRADE, YOU COULD REQUIRE LEVERAGE FOR OPEN SOME POSITIONS, SO PLEASE, BE CAREFULL AND USE CORRECTLY THE RISK MANAGEMENT
Do not forget to change commissions and other parameters related with back testing results!. If you have problems loading the script reduce max bars back number in general settings
Strategies for trending markets use to have more looses than wins and it takes a long time to get profits, so do not forget to be patient and consistent !
Please, visit the post from @jdehorty called Machine Learning: Lorentzian Classification for a better understanding of his script!
Any support and boosts will be well received. If you have any question, do not doubt to ask!

VWAP Breakout Strategy (Momentum, Vol, VWAP, RSI, TrSL)General Description and Unique Features of this Script
Introducing the VWAP Breakout Trading Algorithm for TradingView – the timeless strategy designed to identify the highest probability entries and trades for all financial securities and timeframes.
Unlike other strategies, the VWAP Breakout Strategy considers the buying/selling pressure in the market and supply/demand balance to generate real-time trading signals. The Relative Strength Index (RSI) is used as a technical measure to capture typical breakouts from consolidation periods and pullback entries.
With flexible backtesting options, traders can improve parameter settings depending on their time horizon and the type of financial securities being used. Plus, this pro-version of the VWAP Breakout Strategy offers stop-loss, take-profit, and trailing stop-loss exit strategies for better risk management.
The VWAP Breakout Strategy combines a number of technical indicators, the Moving Average (MA), the Volume Weighted Average Price (VWAP) and the RSI-qualifier to identify potential trend reversals and entry/exit points in the market. The VWAP Breakout Strategy can be used in conjunction with other technical indicators and fundamental analysis to make more informed trading decisions.
To further optimize trading results, this strategy generates trading signals based on real-time price action, rather than relying on the close / open of candles.
The VWAP Breakout Strategy
One important qualifier for generating buy signals is that the stock or other financial security is not in a short-term overbought status (for long-positions), or in a short-term oversold status (for short-positions), respectively.
Additionally, the stock or other financial security needs to go through a consolidation period before buy signals are being generated.
The RSI-indicator is being used as a technical measure in this strategy for that.
• Using moderate parameters for the RSI-qualifier (oversold-level 40 or higher, overbought level 60 or lower) will capture more typical breakouts from consolidation periods.
• Using more extreme parameters for the RSI-qualifier (oversold-level 35 or lower, overbought level 65 or higher) will capture the so-called pullback entries.
Long Entries
When the selling pressure is over and the continuation of the uptrend can be confirmed by the MA / VWAP crossover after reaching a price low, a buy signal is issued by this strategy.
Short Entries
When the byuing pressure is over and the continuation of the downtrend can be confirmed by the MA / VWAP crossover after reaching a price high, a sell signal is issued by this strategy.
Timeless Strategy
The underlying principles of this strategy are based on the buying- / selling pressure in the market as well as the supply and demand balance. The buying / selling volumes are being considered for the generation of trading signals. These sophisticated market principles make this strategy timeless which means it can be applied to 1min-charts, weekly charts as well as anything between those.
Generation of Trading Signals
Real-time process are considered for this pro-version of the VWAP Breakout Strategy. This is another benefit versus many other strategies which only consider the close or open of the canldes for trading signals:
Exit Strategies
This pro-version offers the following exit strategies:
• Stop-Loss
• Take-Profit
• Trailing Stop-Loss
The trailing SL functionality provides another benefit versus most other trading strategies resulting in significantly backtesting- and real-time trading results.
Trades will also be closed when an opposite trading signal is being generated (only applicable for combined long/short strategies).
Flexible Backtesting Option
The strategy offers fully flexible backtesting options to improve the parameter setting strategy, depending on time horizon and type of financial securities being used.
Relative Strength Index (RSI)
The Relative Strength Index (RSI) is a technical indicator developed by Welles Wilder in 1978. The RSI is used to perform a market value analysis and identify the strength of a trend as well as overbought and oversold conditions. The indicator is calculated on a scale from 0 to 100 and shows how much an asset has risen or fallen relative to its own price in recent periods.
The RSI is calculated as the ratio of average profits to average losses over a certain period of time. A high value of the RSI indicates an overbought situation, while a low value indicates an oversold situation. Typically, a value > 70 is considered an overbought threshold and a value < 30 is considered an oversold threshold. A value above 70 signals that a single value may be overvalued and a decrease in price is likely , while a value below 30 signals that a single value may be undervalued and an increase in price is likely.
For example, let's say you're watching a stock XYZ. After a prolonged falling movement, the RSI value of this stock has fallen to 26. This means that the stock is oversold and that it is time for a potential recovery. Therefore, a trader might decide to buy this stock in the hope that it will rise again soon.
The MA / VWAP Crossover Trading Strategy
This strategy combines two popular technical indicators: the Moving Average (MA) and the Volume Weighted Average Price (VWAP). The MA VWAP crossover strategy is used to identify potential trend reversals and entry/exit points in the market.
The VWAP is calculated by taking the average price of an asset for a given period, weighted by the volume traded at each price level. The MA, on the other hand, is calculated by taking the average price of an asset over a specified number of periods. When the MA crosses above the VWAP, it suggests that buying pressure is increasing, and it may be a good time to enter a long position. When the MA crosses below the VWAP, it suggests that selling pressure is increasing, and it may be a good time to exit a long position or enter a short position.
Traders typically use the MA VWAP crossover strategy in conjunction with other technical indicators and fundamental analysis to make more informed trading decisions. As with any trading strategy, it is important to carefully consider the risks and potential rewards before making any trades.
This strategy is applicable to all timeframes and the relevant parameters for the underlying indicators (RSI and MA/VWAP) can be adjusted and optimized as needed.
Backtesting Results
Backtesting gives outstanding results on all timeframes and drawdowns can be reduced to a minimum level. In this example, the hourly chart for MCFT has been used.
Settings for backtesting are:
- Period from April 2020 until April 2021 (1 yr)
- Starting capital 100k USD
- Position size = 25% of equity
- 0.01% commission = USD 2.50.- per Trade
- Slippage = 2 ticks
Other comments
• This strategy has been designed to identify the most promising, highest probability entries and trades for each stock or other financial security.
• The RSI qualifier is highly selective and filters out the most promising swing-trading entries. As a result, you will normally only find a low number of trades for each stock or other financial security per year in case you apply this strategy for the daily charts. Shorter timeframes will result in a higher number of trades / year.
• As a result, traders need to apply this strategy for a full watchlist rather than just one financial security.

SPY 1 Minute Day TraderWhen scalping options, users are looking for where breakouts are going to occur instead of sitting thru areas choppy price action that drain delta and cause them to lose value even if price is up trending. This script tries to identify when a trend reversal is expected based on one minute price action on the SPY. It alerts users to prepare for potential breakout when 5 out of the 6 key optimized parameters are discovered by showing a white L or S. Once all six trigger, it informs the user at the close of that candle with a golden triangle with Pivot Up or Pivot Down. As scalping options is something that is expected to be short in duration, a take profit and stop loss of 30 cents of price actions is established. If five or more parameters occur after the pivot is initiated, then stop losses and take profits are adhered to; however, if there are less, then it waits to take profit or stop the trade, as likely it is just noise and it will finish trend with an additional breakout.
This script has been created to take into account how the following variables impact trend for SPY 1 Minute:
ema vs 13 ema : A cross establishes start of trend
MACD (Line, Signal & Slope) : If you have momentum
ADX : if you are trending
RSI : If the trend has strength
The above has been optimized to determine pivot points in the trend using key values for these 6 indicators
bounce up = ema5 > ema13 and macdLine < .5 and adx > 20 and macdSlope > 0 and signalLine > -.1 and rsiSignal > 40
bounce down = ema5 < ema13 and macdLine > -.5 and adx > 20 and signalLine < 0 and macdSlope < 0 and rsiSignal < 60
White L's indicate that 5 of 6 conditions are met due to impending uptrend w/ missing one in green below it
Yellow L's indicate that 6 of 6 conditions still are met
White S's indicate that 5 of 6 conditions are met due to impending downtrend w/ missing condition in red above it
Yellow S's indicate that 6 of 6 conditions still are met
After a downtrend or uptrend is established, once it closes it can't repeat for 10 minutes
Won't open any trades on last two minutes of any hours to avoid volatility
Will close any open trades going into last minute of hour to avoid large overnight random swings.

Simple_RSI+PA+DCA StrategyThis strategy is a result of a study to understand better the workings of functions, for loops and the use of lines to visualize price levels. The strategy is a complete rewrite of the older RSI+PA+DCA Strategy with the goal to make it dynamic and to simplify the strategy settings to the bare minimum.
In case you are not familiar with the older RSI+PA+DCA Strategy, here is a short explanation of the idea behind the strategy:
The idea behind the strategy based on an RSI strategy of buying low. A position is entered when the RSI and moving average conditions are met. The position is closed when it reaches a specified take profit percentage. As soon as the first the position is opened multiple PA (price average) layers are setup based on a specified percentage of price drop. When the price hits the layer another position with the same position size is is opened. This causes the average cost price (the white line) to decrease. If the price drops more, another position is opened with another price average decrease as result. When the price starts rising again the different positions are separately closed when each reaches the specified take profit. The positions can be re-opened when the price drops again. And so on. When the price rises more and crosses over the average price and reached the specified Stop level (the red line) on top of it, it closes all the positions at once and cancels all orders. From that moment on it waits for another price dip before it opens a new position.
This is the old RSI+PA+DCA Strategy:
The reason to completely rewrite the code for this strategy is to create a more automated, adaptable and dynamic system. The old version is static and because of the linear use of code the amount of DCA levels were fixed to max 6 layers. If you want to add more DCA layers you manually need to change the script and add extra code. The big difference in the new version is that you can specify the amount of DCA layers in the strategy settings. The use of 'for loops' in the code gives the possibility to make this very dynamic and adaptable.
The RSI code is adapted, just like the old version, from the RSI Strategy - Buy The Dips by Coinrule and is used for study purpose. Any other low/dip finding indicator can be used as well
The distance between the DCA layers are calculated exponentially in a function. In the settings you can define the exponential scale to create the distance between the layers. The bigger the scale the bigger the distance. This calculation is not working perfectly yet and needs way more experimentation. Feel free to leave a comment if you have a better idea about this.
The idea behind generating DCA layers with a 'for loop' is inspired by the Backtesting 3commas DCA Bot v2 by rouxam .
The ideas for creating a dynamic position count and for opening and closing different positions separately based on a specified take profit are taken from the Simple_Pyramiding strategy I wrote previously.
This code is a result of a study and not intended for use as a full functioning strategy. To make the code understandable for users that are not so much introduced into pine script (like myself), every step in the code is commented to explain what it does. Hopefully it helps.
Enjoy!

Double Alligator x Donchian Cloud StrategyThis strategy is based on two sets of Williams Alligator indicators, taking crossovers and crossunders of the two pairs of lips as the main entry signal with confluence from the Donchian Cloud. The first Alligator used is set to the standard 13/8/5 lengths found in the standard indicator. The second Alligator is multiplied tenfold (10x) to 130/80/50 with the offset values also being multiplied. This second set is colored yellow, aqua, and purple for the jaw, teeth, and lips, respectively. A strategy similar to a moving average crossover can be created using these sets of Alligator indicators. While there are 6 lines in total, and can be used for discretionary matters outside of the strategy entry/exits, a cross of the lip pairs seems to yield the most optimal results. As a filter for these signals, we have introduced our Donchian Cloud Score code.
The Donchian Cloud Score is derived from a set of 5 Donchian channels (upper, lower, and basis plotted) defaulted to lengths of 25, 50, 100, 150, and 200. A set of conditions associated with the channels aims to determine ranging versus trending markets. Weights are given to these conditions accordingly, then tallied up to determine the "cloud score", ranging between -25 and 25. In general, a ranging market is determined by a cloud score between -10 and 10, while a positive trending market has a score higher than 10 and a negative trending market has a score lower than -10. That said, long and short thresholds similar to the macro score itself are included in the user settings and set to a default of 3 or -3. Trade frequency will increase the closer these numbers are to zero, however, the stronger (yet infrequent) signals come with values approaching +/- 10 or greater. The cloud score is plotted as a line in the underlay with coloration reflecting ranging or trending markets (green color above the long threshold, gray between the thresholds, and red below the short threshold). The cloud score is incorporated into the strategy syntax for long and short positions in that the score must be above or below the set threshold for a trade to be placed. A breakdown for the Donchian scoring is as follows:
- Broke the 25-length DC (DC(25)) upper band in the previous 3 bars - +1 if true, 0 if false
- Broke the DC(50) upper band in the previous 3 bars - +2 if true, 0 if false
- Broke the DC(100) upper band in the previous 3 bars - +3 if true, 0 if false
- Broke the DC(150) upper band in the previous 3 bars - +4 if true, 0 if false
- Broke the DC(200) upper band in the previous 3 bars - +5 if true, 0 if false
- Broke the DC(25) lower band in the previous 3 bars - -1 if true, 0 if false
- Broke the DC(50) lower band in the previous 3 bars - -2 if true, 0 if false
- Broke the DC(100) lower band in the previous 3 bars - -3 if true, 0 if false
- Broke the DC(150) lower band in the previous 3 bars - -4 if true, 0 if false
- Broke the DC(200) lower band in the previous 3 bars - -5 if true, 0 if false
- DC(25) basis line above the DC(50) basis line - +1 if true, -1 if false
- DC(25) basis line above the DC(100) basis line - +1 if true, -1 if false
- DC(25)basis line above the DC(150) basis line - +1 if true, -1 if false
- DC(25) basis line above the DC(200) basis line - +1 if true, -1 if false
- DC(50) basis line above the DC(100) basis line - +1 if true, -1 if false
- DC(50) basis line above the DC(150) basis line - +1 if true, -1 if false
- DC(50) basis line above the DC(200) basis line - +1 if true, -1 if false
- DC(100) basis line above the DC(150) basis line - +1 if true, -1 if false
- DC(100) basis line above the DC(200) basis line - +1 if true, -1 if false
- DC(150) basis line above the DC(200) basis line - +1 if true, -1 if false
Take profit, stop loss, and trailing percentages are also included, found at the bottom of the Input tab under “TT and TTP” as well as “Stop Loss”. Make sure to understand the TP/SL ratio that you desire before use, as the desired hit rate/profitability percentage will be affected accordingly. The option for adding in a trailing stop has also been included, with options to choose between an ATR-based trail or a percentage-based trail. This strategy does NOT guarantee future returns. Apply caution in trading regardless of discretionary or algorithmic. Understand the concepts of risk/reward and the intricacies of each strategy choice before utilizing them in your personal trading.
Profitview/Pineconnector Settings:
If you wish to utilize Profitview’s automation system, find the included “Profitview Settings” under the Input tab of the strategy settings menu. If not, skip this section entirely as it can be left blank. Options will be “OPEN LONG TITLE”, “OPEN SHORT TITLE”, “CLOSE LONG TITLE”, and “CLOSE SHORT TITLE”. If you wished to trade SOL, for example, you would put “SOL LONG”, “SOL SHORT”, “SOL CLOSE LONG”, and “SOL CLOSE SHORT” in these areas. Within your Profitview extension, ensure that your Alerts all match these titles. To set an alert for use with Profitview, go to the “Alerts” tab in TradingView, then create an alert. Make sure that your desired asset and timeframe are currently displayed on your screen when creating the alert. Under the “Condition” option of the alert, select the strategy, then select the expiration time. If using TradingView Premium, this can be open-ended. Otherwise, select your desired expiration time and date. This can be updated whenever desired to ensure the strategy does not expire. Under “Alert actions”, nothing necessarily needs to be selected unless so desired. Leave the “Alert name” option empty. For the “Message”, delete the generated message and replace it with {{strategy.order.alert_message}} and nothing else. If using Pineconnector, follow the same directions for setting up an alert, but use the ",buy,,risk=" syntax as noted in the tooltips.
Macro Score (DFMA) and Donchian Cloud Score StrategyA "macro score", as defined here, is created by giving various weights to different signals and adding them together to get one smooth score. Positive or negative values are assigned to each of the signals depending on if the statement is true or false (e.g. DPO > 0: +1, DPO < 0: -1). This manner of strategy allows for a subset of the available signals to be present at one time as opposed to every technical signal having to be active in order for a long/short signal to trigger.
The DFMA - Democratic Fibonacci Moving Average - is a separate indicator that we have released that takes 10 different Fibonacci MAs (lengths of 3 to 233, at Fibonacci intervals) and averages them to form the DFMA line. This helps by creating a consensus on the trend based on moving averages alone. Crossovers of the DFMA with the various Fib MA lengths as well as a cross of the price source and these lines can provide adequate long and short signals.
This strategy has the signals and weights pre-determined in the code. Heaviest weights have been given to crosses of the DFMA line/Fib MA (233) as well as the crosses of the Fib MA (3)/DFMA. Additionally, there are thresholds for DPO ( Detrended Price Oscillator , above or below 0), CMO ( Chande Momentum Oscillator , above or below 0), Jurik Volatility Bands (above or below 0), and Stoch RSI (above or below 50). These four signals hold a lighter weight than the MA cross signals.
The macro score itself is printed in an underlay as a white line that goes between -10 and 10 for this strategy. In addition to the macro score line, a blue momentum line (sourced by the macro score itself) has been included. A crossover/crossunder of the macro score and the macro momentum line is included into the long/short signal syntax in addition to a threshold for the macro score. Long and short thresholds can be determined by the user in the settings menu.
The Donchian Cloud Score is derived from a set of 5 Donchian channels (upper, lower, and basis plotted) defaulted to lengths of 25, 50, 100, 150, and 200. A set of conditions associated with the channels aims to determine ranging versus trending markets. Weights are given to these conditions accordingly, then tallied up to determine the "cloud score", ranging between -25 and 25. In general, a ranging market is determined by a cloud score between -10 and 10, while a positive trending market has a score higher than 10 and a negative trending market has a score lower than -10. That said, long and short thresholds similar to the macro score itself are included in the user settings and set to a default of 5 or -5. The cloud score is plotted as a line in the underlay with coloration reflecting ranging or trending markets (green color above the long threshold, gray between the thresholds, and red below the short threshold). The cloud score is incorporated into the strategy syntax for long and short positions in that the score must be above or below the set threshold for a trade to be placed. A breakdown for the Donchian scoring is as follows:
- Broke the 25-length DC (DC(25)) upper band in the previous 3 bars - +1 if true, 0 if false
- Broke the DC(50) upper band in the previous 3 bars - +2 if true, 0 if false
- Broke the DC(100) upper band in the previous 3 bars - +3 if true, 0 if false
- Broke the DC(150) upper band in the previous 3 bars - +4 if true, 0 if false
- Broke the DC(200) upper band in the previous 3 bars - +5 if true, 0 if false
- Broke the DC(25) lower band in the previous 3 bars - -1 if true, 0 if false
- Broke the DC(50) lower band in the previous 3 bars - -2 if true, 0 if false
- Broke the DC(100) lower band in the previous 3 bars - -3 if true, 0 if false
- Broke the DC(150) lower band in the previous 3 bars - -4 if true, 0 if false
- Broke the DC(200) lower band in the previous 3 bars - -5 if true, 0 if false
- DC(25) basis line above the DC(50) basis line - +1 if true, -1 if false
- DC(25) basis line above the DC(100) basis line - +1 if true, -1 if false
- DC(25)basis line above the DC(150) basis line - +1 if true, -1 if false
- DC(25) basis line above the DC(200) basis line - +1 if true, -1 if false
- DC(50) basis line above the DC(100) basis line - +1 if true, -1 if false
- DC(50) basis line above the DC(150) basis line - +1 if true, -1 if false
- DC(50) basis line above the DC(200) basis line - +1 if true, -1 if false
- DC(100) basis line above the DC(150) basis line - +1 if true, -1 if false
- DC(100) basis line above the DC(200) basis line - +1 if true, -1 if false
- DC(150) basis line above the DC(200) basis line - +1 if true, -1 if false
Take profit, stop loss, and trailing percentages are also included, found at the bottom of the Input tab under “TT and TTP” as well as “Stop Loss”. Make sure to understand the TP/SL ratio that you desire before use, as the desired hit rate/profitability percentage will be affected accordingly. The option for adding in a trailing stop has also been included, with options to choose between an ATR-based trail or a percentage-based trail. This strategy does NOT guarantee future returns. Apply caution in trading regardless of discretionary or algorithmic. Understand the concepts of risk/reward and the intricacies of each strategy choice before utilizing them in your personal trading.
Profitview/Pineconnector Settings:
If you wish to utilize Profitview’s automation system, find the included “Profitview Settings” under the Input tab of the strategy settings menu. If not, skip this section entirely as it can be left blank. Options will be “OPEN LONG TITLE”, “OPEN SHORT TITLE”, “CLOSE LONG TITLE”, and “CLOSE SHORT TITLE”. If you wished to trade SOL, for example, you would put “SOL LONG”, “SOL SHORT”, “SOL CLOSE LONG”, and “SOL CLOSE SHORT” in these areas. Within your Profitview extension, ensure that your Alerts all match these titles. To set an alert for use with Profitview, go to the “Alerts” tab in TradingView, then create an alert. Make sure that your desired asset and timeframe are currently displayed on your screen when creating the alert. Under the “Condition” option of the alert, select the strategy, then select the expiration time. If using TradingView Premium, this can be open-ended. Otherwise, select your desired expiration time and date. This can be updated whenever desired to ensure the strategy does not expire. Under “Alert actions”, nothing necessarily needs to be selected unless so desired. Leave the “Alert name” option empty. For the “Message”, delete the generated message and replace it with {{strategy.order.alert_message}} and nothing else. If using Pineconnector, follow the same directions for setting up an alert, but use the ",buy,,risk=" syntax as noted in the tooltips.

Macro Score - Dem. Fib. McGinley DynamicsA "macro score", as defined here, is created by giving various weights to different signals and adding them together to get one smooth score. Positive or negative values are assigned to each of the signals depending on if the statement is true or false (e.g. DPO > 0: +1, DPO < 0: -1). This manner of strategy allows for a subset of the available signals to be present at one time as opposed to every technical signal having to be active in order for a long/short signal to trigger.
The DFMG - Democratic Fibonacci McGinley Dynamic - is a separate indicator that we have released that takes 10 different Fibonacci McGinley Dynamics (lengths of 3 to 233, at Fibonacci intervals) and averages them to form the DFMG line. This helps by creating a consensus on the trend based on these dynamic lines alone. Crossovers of the DFMG with the various McGinley lengths as well as a cross of the price source and these lines can provide adequate long and short signals.
This strategy has the signals and weights pre-determined in the code. Heaviest weights have been given to crosses of the DFMG line/McGinley(233) as well as the crosses of the McGinley(3)/DFMG. Additionally, there are thresholds for DPO ( Detrended Price Oscillator , above or below 0), CMO ( Chande Momentum Oscillator , above or below 0), Jurik Volatility Bands (above or below 0), and Stoch RSI (above or below 50). These four signals hold a lighter weight than the McGinley cross signals.
The macro score itself is printed in an underlay as a white line that goes between -10 and 10 for this strategy. In addition to the macro score line, a green momentum line (sourced by the macro score itself) has been included. A crossover/crossunder of the macro score and the macro momentum line is included into the long/short signal syntax in addition to long and short thresholds for the macro score, defaulted to 5 and -5 respectively.
Take profit, stop loss, and trailing percentages are also included, found at the bottom of the Input tab under “TT and TTP” as well as “Stop Loss”. Make sure to understand the TP/SL ratio that you desire before use, as the desired hit rate/profitability percentage will be affected accordingly. The option for adding in a trailing stop has also been included, with options to choose between an ATR-based trail or a percentage-based trail.
This strategy does NOT guarantee future returns. Apply caution in trading regardless of discretionary or algorithmic. Understand the concepts of risk/reward and the intricacies of each strategy choice before utilizing them in your personal trading.
Profitview/Pineconnector Settings:
If you wish to utilize Profitview’s automation system, find the included “Profitview Settings” under the Input tab of the strategy settings menu. If not, skip this section entirely as it can be left blank. Options will be “OPEN LONG TITLE”, “OPEN SHORT TITLE”, “CLOSE LONG TITLE”, and “CLOSE SHORT TITLE”. If you wished to trade SOL, for example, you would put “SOL LONG”, “SOL SHORT”, “SOL CLOSE LONG”, and “SOL CLOSE SHORT” in these areas. Within your Profitview extension, ensure that your Alerts all match these titles. To set an alert for use with Profitview, go to the “Alerts” tab in TradingView, then create an alert. Make sure that your desired asset and timeframe are currently displayed on your screen when creating the alert. Under the “Condition” option of the alert, select the strategy, then select the expiration time. If using TradingView Premium, this can be open-ended. Otherwise, select your desired expiration time and date. This can be updated whenever desired to ensure the strategy does not expire. Under “Alert actions”, nothing necessarily needs to be selected unless so desired. Leave the “Alert name” option empty. For the “Message”, delete the generated message and replace it with {{strategy.order.alert_message}} and nothing else. If using Pineconnector, follow the same directions for setting up an alert, but use the " ,buy, ,risk=" syntax as noted in the tooltips.
Default Properties for AVAX 20M:
DPO - 35 , uncentered
CMO - 25, open
K/D - 3/3
RSI Stoch Length - 3
Stoch Length - 4
Stoch Source - open
JVB Length - 14
JVB Smoothing - 2
DFMG source - close
Macro Length - 14
TP % - 1.5%
TTP % - 0.005%
SL % - 1.8%, no trail

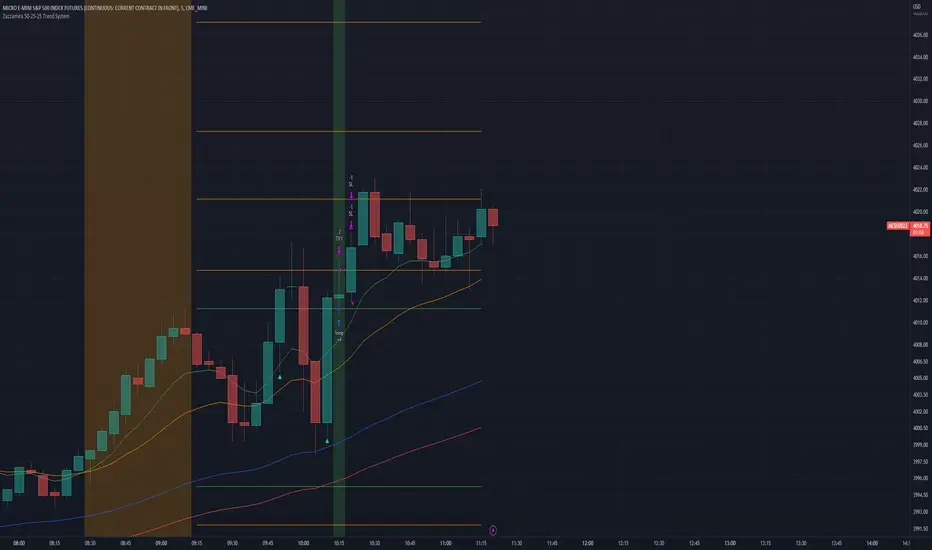
Zazzamira 50-25-25 Trend SystemPublishing my trading system script. It consist of several conditions to happen in order to open a trade. Work best on ES/MES 5 minute timeframe.
I like to use it with this settings:
- UTC -6 (don't tick Exchange Timezone)
and rest as default
To enter a trade, the following conditions must be met: Entry 1: the opening range (8:30AM - 9:15AM UTC-6) must be defined and the price must close above or below the opening range on the 5-minute timeframe. This entry condition defines the trade direction (above = long / below = short). Once the opening range is defined, the Trend-Based Fib Extension is applied from the range high to the range low (and vice versa). Fib levels are required for Exit conditions. Entry 2: the 8 - 27 - 67 - 97 EMAs must be defined. If the EMAs value order is 8 > 27 > 67 > 97, long-only trades are allowed. If the EMAs value order is 8 < 27 < 67 < 97, short-only trades are allowed. This entry condition filters fake breakouts of Entry 1. Entry 3: no trades are allowed after 12:59 UTC-6 (2PM EST). Entry 4: if Entry 1, Entry 2, and Entry 3 conditions are valid and the price hasn't reached the 23.6% Fib line, an entry order can be set at the range high/long with 4 contracts. To exit a trade, the following conditions must be met: Exit 1 (Stop loss): set a trailing stop based on 2.1x ATR (14) from entry. Exit 2: take 50% profits at the 23.6% Fib and leave trailing stop untouched. Exit 3: if Exit 2 triggers, take 50% (25% of total entry) off at 61.8% Fib, leaving Exit 2 trailing stop values valid. Exit 4: exit the full position at the FIB 100% value. Exit 5: all trades must be closed at 3pm UTC-6 (4PM EST). So basically Take Profit are 50%-25%-25% of position.
Code has been written by © Hiubris_Indicators who has been an amazing coder and gave me the possibility to make this script public so a really big shoutout to him.
Super 8 - 30M BTCWelcome to Super 8, the ultimate automatic trading script for Pine!
This bad boy is designed to go both long and short, and it's equipped with all the tools you need to maximize your profits. Whether you're looking to take profit, set a trailing stop, or protect yourself with a stop loss, Super 8 has you covered.
But that's not all! Super 8 is also loaded with 8 powerful indicators to help you make informed decisions. We've got the EMA, ADX, SAR, MACD, VOLUME, BOLLINGER BANDS, DONCHIAN, and ATR all working together to give you the best possible trading experience.
And if you want to take it to the next level, Super 8 also has a feature that lets you use stepped entries in normal mode or incremental 1,2,3,... to improve your average price. Plus, if you're using trailing stop, you can activate the Backtest precision to use lower timeframes.
But what's in a name? Super 8 is called that because it's just that... super! It's tailored specifically for the OKX:BTCUSDT.P pair, so you know you're getting the best possible results. it's highly adjustable and can be used with any other pair. So no matter what market you're trading in, Super 8 has got you covered.
So if you want to level up your trading game, give Super 8 a try. You won't be disappointed.
Certain Risks of Live Algorithmic Trading:
Backtesting Cannot Assure Actual Results.
The relevant market might fail or behave unexpectedly.
Your broker may experience failures in its infrastructure, fail to execute your orders in a correct or timely fashion or reject your orders.
The system you use for generating trading orders, communicating those orders to your broker, and receiving queries and trading results from your broker may fail.
Time lag at various point in live trading might cause unexpected behavior.
The systems of third parties in addition to those of the provider from which we obtain various services, your broker, and the applicable securities market may fail or malfunction.

Macro Score - DFMA-BasedA "macro score", as defined here, is created by giving various weights to different signals and adding them together to get one smooth score. Positive or negative values are assigned to each of the signals depending on if the statement is true or false (e.g. DPO > 0: +1, DPO < 0: -1). This manner of strategy allows for a subset of the available signals to be present at one time as opposed to every technical signal having to be active in order for a long/short signal to trigger.
The DFMA - Democratic Fibonacci Moving Average - is a separate indicator that we have released that takes 10 different Fibonacci MAs (lengths of 3 to 233, at Fibonacci intervals) and averages them to form the DFMA line. This helps by creating a consensus on the trend based on moving averages alone. Crossovers of the DFMA with the various Fib MA lengths as well as a cross of the price source and these lines can provide adequate long and short signals.
This strategy has the signals and weights pre-determined in the code. Heaviest weights have been given to crosses of the DFMA line/Fib MA (233) as well as the crosses of the Fib MA (3)/DFMA. Additionally, there are thresholds for DPO ( Detrended Price Oscillator , above or below 0), CMO ( Chande Momentum Oscillator , above or below 0), Jurik Volatility Bands (above or below 0), and Stoch RSI (above or below 50). These foursignals hold a lighter weight than the MA cross signals.
The macro score itself is printed in an underlay as a white line that goes between -10 and 10 for this strategy. In addition to the macro score line, a blue momentum line (sourced by the macro score itself) has been included. A crossover/crossunder of the macro score and the macro momentum line is included into the long/short signal syntax in addition to a threshold for the macro score (-5/5).
Take profit, stop loss, and trailing percentages are also included, found at the bottom of the Input tab under “TT and TTP” as well as “Stop Loss”. Make sure to understand the TP/SL ratio that you desire before use, as the desired hit rate/profitability percentage will be affected accordingly. This strategy does NOT guarantee future returns. Apply caution in trading regardless of discretionary or algorithmic. Understand the concepts of risk/reward and the intricacies of each strategy choice before utilizing them in your personal trading.
Profitview Settings:
If you wish to utilize Profitview’s automation system, find the included “Profitview Settings” under the Input tab of the strategy settings menu. If not, skip this section entirely as it can be left blank. Options will be “OPEN LONG TITLE”, “OPEN SHORT TITLE”, “CLOSE LONG TITLE”, and “CLOSE SHORT TITLE”. If you wished to trade SOL, for example, you would put “SOL LONG”, “SOL SHORT”, “SOL CLOSE LONG”, and “SOL CLOSE SHORT” in these areas. Within your Profitview extension, ensure that your Alerts all match these titles. To set an alert for use with Profitview, go to the “Alerts” tab in TradingView, then create an alert. Make sure that your desired asset and timeframe are currently displayed on your screen when creating the alert. Under the “Condition” option of the alert, select the strategy, then select the expiration time. If using TradingView Premium, this can be open-ended. Otherwise, select your desired expiration time and date. This can be updated whenever desired to ensure the strategy does not expire. Under “Alert actions”, nothing necessarily needs to be selected unless so desired. Leave the “Alert name” option empty. For the “Message”, delete the generated message and replace it with {{strategy.order.alert_message}} and nothing else.
Default Properties, for AVAX 20M:
DPO - 40, uncentered
CMO - 25, open
K/D - 3/3
RSI Stoch Length - 3
Stoch Length - 4
Stoch Source - open
JVB Length - 25
JVB Smoothing - 2
DFMA source - close
Macro Length - 13
TP % - 1.5%
TTP % - 0.005%
SL % - 2%

Cyatophilum Universal Oscillator TraderAn indicator to backtest and create an infinite number of strategies using any external indicator.
═════════════════════════════════════════════════════════════════════════
█ HOW IT WORKS
The indicator allows you to create your oscillator strategy and get backtest results from the Strategy Tester.
You can also create alerts for each of the strategy events.
█ HOW TO USE
Choose a strategy direction long or short that you want to create.
Always use regular candle type.
Configure your entry condition . To use any other indicator as source, it needs to be added to the chart first.
If you have the basic (free) TradingView plan, you can only have 1 indicator on your chart, and cannot use this external source feature. For this case, the indicator has a list of built-in oscillator (that can be increased upon request).
Then choose your condition: Cross over, Greater than, Pullback, Turning up, etc.
You now have your entry and should already see trades on the chart!
Next you can fine tune your entry condition or move to the risk management and filters.
Configure your stop loss
Use the stop loss feature to exit a trade at a certain loss.
You can also create a trailing stop using price % movement or ATR.
Configure your profit target
Use the Take Profit feature to set a target in percentage of price. You can also make it trail.
Configure your safety orders
This indicator has a safety orders feature to reduce the risk of your trade. See more below.
Check your backtest parameters
Make sure that the initial capital and order size make sense. Since it is a pyramiding strategy with safety orders, the sum of all deals should not be bigger than the initial capital.
If you use % equity as order size, please note that it will create compounding.
Check the fees, by default they are set to 0.1%.
I also recommend to set a slippage that corresponds to your exchange's spread.
█ FEATURES
• Strategy direction
Configure to go long or short.
• Entry Conditions
- External Oscillator source
- Built-in Oscillator (for basic plans)
- Base Condition for entry (Less/Greater than, Crossing Up/Down, Pullback Bull/Bear, Turning Up/Down, etc. More can be added later on)
- Additional Momentum Condition: Oscillator should be rising/falling for x number of bars
- Addition Threshold Condition: Oscillator should be Greater/Lowser than x
• Trend Filter
Filter Trades using 1 or 2 moving averages (MTF), based on Slop Change or Price Cross. Trend line is green = only longs, red = only shorts.
• Entry Filters
- Volume filter to remove low volume entries
- Overbought/Oversold filters
- Flat market Filter
• Stop Loss and Take Profit
Configure your stop loss and take profit for long and short trades.
You can also make a trailing take profit and trailing stop.
• DCA (Safety orders)
Create up to 100 safety orders with configurable options for step and volume scaling, take profit from total volume, base and safety order size.
• Backtest Settings
Choose a backtest period, longs or shorts, wether to use limit orders or not.
Graphics
A Backtest Results panel with additional information from the strategy tester.
A lightweight mode to remove background plots and make the indicator load faster.
█ ALERTS
The indicator is using the alert() calls: it only uses 1 alert slot to send order messages for each event (Long/Short entry, stop loss, take profit, safety order, exit timer). This means basic-free TV plans can create 1 complete strategy.
To set your alert messages, open the indicator settings and scroll to the bottom of the "inputs" tab.
Create your alert after you set the messages in the indicator settings, and make sure "Any alert() function call" is set in the alert option.
Use placeholders to automatically replace values in your alert messages like price, target profit, order size etc. (see the indicator inputs).
█ BACKTEST RESULTS
The backtest settings can be seen in the 'Properties' tab of the backtest report below.
Please read the author instructions below for access.

Macro Score - TSI-BasedA "macro score", as defined here, is created by giving various weights to different signals and adding them together to get one smooth score. Positive or negative values are assigned to each of the signals depending on if the statement is true or false (e.g. DPO > 0: +1, DPO < 0: -1). This manner of strategy allows for a subset of the available signals to be present at one time as opposed to every technical signal having to be active in order for a long/short signal to trigger.
This strategy has the signals and weights pre-determined in the code. Heaviest weights have been given to various TSI (True Strength Index) signals, including a crossover/crossunder of TSI signal and TSI value, a threshold for the TSI Signal (above or below 0), and a crossover/crossunder of the CMO (Chande Momentum Oscillator) and the TSI signal line. Additionally, there are thresholds for DPO (Detrended Price Oscillator, above or below 0), Jurik Volatility Bands (above or below 0), and Stoch RSI (above or below 50). These three signals hold a lighter weight than the three TSI signals.
The macro score itself is printed in an underlay as a white line that goes between -10 and 10 for this strategy. In addition to the macro score line, a red momentum line (sourced by the macro score itself) has been included. A crossover/crossunder of the macro score and the macro momentum line is included into the long/short signal syntax in addition to a threshold for the macro score (-6/6).
Take profit, stop loss, and trailing percentages are also included, found at the bottom of the Input tab under “TT and TTP” as well as “Stop Loss”. Make sure to understand the TP/SL ratio that you desire before use, as the desired hit rate/profitability percentage will be affected accordingly. This strategy does NOT guarantee future returns. Apply caution in trading regardless of discretionary or algorithmic. Understand the concepts of risk/reward and the intricacies of each strategy choice before utilizing them in your personal trading.
Profitview Settings:
If you wish to utilize Profitview’s automation system, find the included “Profitview Settings” under the Input tab of the strategy settings menu. If not, skip this section entirely as it can be left blank. Options will be “OPEN LONG TITLE”, “OPEN SHORT TITLE”, “CLOSE LONG TITLE”, and “CLOSE SHORT TITLE”. If you wished to trade SOL, for example, you would put “SOL LONG”, “SOL SHORT”, “SOL CLOSE LONG”, and “SOL CLOSE SHORT” in these areas. Within your Profitview extension, ensure that your Alerts all match these titles. To set an alert for use with Profitview, go to the “Alerts” tab in TradingView, then create an alert. Make sure that your desired asset and timeframe are currently displayed on your screen when creating the alert. Under the “Condition” option of the alert, select the strategy, then select the expiration time. If using TradingView Premium, this can be open-ended. Otherwise, select your desired expiration time and date. This can be updated whenever desired to ensure the strategy does not expire. Under “Alert actions”, nothing necessarily needs to be selected unless so desired. Leave the “Alert name” option empty. For the “Message”, delete the generated message and replace it with {{strategy.order.alert_message}} and nothing else.