WEBBERISKI TRADESWEBBERISKI Indicator
The WEBBERISKI indicator is a powerful tool designed for traders seeking to capitalize on short-term price movements in volatile markets. It generates buy signals based on a combination of RSI crossovers, EMA breakouts, and VWAP conditions, with customizable filters to restrict signals to prices above or below the anchored VWAP. The indicator tracks both active and ignored trades, providing detailed performance metrics, including win/loss percentages, drop percentages, and time-to-take-profit buckets (<1h, 1-2h, 2-3h, 3-4h, >4h). Visual labels (W, L, IW, IL) mark trade outcomes on the chart, while two tables display drop percentage distributions and comprehensive trade statistics, including VWAP-based win rates. Ideal for day traders and scalpers, WEBBERISKI offers flexible inputs for take-profit, stop-loss, and technical parameters to optimize trading strategies.
The indicator works best and has the highest probability win rates when SL is 5%+ so you need nerves to take trades. But can provide 60%+ win rates with lower SL (1%).
Default TP/SL setting is 0.6% for TP, 5% for SL. Ideally take trades and place your buy order 0.3-0.4% below the signal candle for a TP% of 0.9-1.0%.
Cerca negli script per "take profit"

Bot Analyzer📌 Script Name: Bot Analyzer
This TradingView Pine Script v5 indicator creates a dashboard table on the chart that helps you analyze any asset for running a martingale grid bot on futures.
🔧 User Inputs
TP % (tpPct): Take Profit percentage.
SO step % (soStepPct): Step size between safety orders.
SO n (soCount): Number of safety orders.
M mult (martMult): Martingale multiplier (how much each next order increases in size).
Lev (leverage): Leverage used in futures.
BB len / BB mult: Bollinger Bands settings for measuring channel width.
ATR len: ATR period for volatility.
HV days: Lookback window (days) for Historical Volatility calculation.
📐 Calculations
ATR % (atrPct): Normalized ATR relative to price.
Bollinger Band width % (bbPct): Market channel width as percentage of basis.
Historical Volatility (hvAnn): Annualized volatility, calculated from daily log returns.
Dynamic Step % (dynStepPct): Step size for safety orders, automatically adjusted from ATR and clamped between 0.3% and 5%.
Covered Move % (coveredPct): Total percentage move the bot can withstand before last safety order.
Martingale Size Factor (sizeFactor): Total position size multiplier after all safety orders, based on martingale multiplier.
Risk Score (riskLabel): Simple risk estimate:
Low if risk < 30
Mid if risk < 60
High if risk ≥ 60
📊 Output (Table on Chart)
At the top-right of the chart, the script draws a table with 9 rows:
Metric Value
BB % Bollinger Band width in %
HV % Historical Volatility (annualized %)
TP % Take profit setting
SO step % Safety order step size
SO n Number of safety orders
M mult Martingale multiplier
Dyn step % Dynamic step based on ATR
Size x Total position size factor (e.g., 4.5x)
Risk Risk label (Low / Mid / High)
⚙️ Use Case
Helps choose coins for a martingale bot:
If BB% is wide and HV% is high → the asset is volatile enough.
If Risk shows "High" → parameters are aggressive, you may need to adjust step size, SO count, or leverage.
The dashboard lets you compare assets quickly without switching between multiple indicators.

Marubozu Detector with Dynamic SL/TP
Strategy Overview:
This indicator detects a "Marubozu" bullish pattern or a “Marubozu” bearish pattern to suggest potential buy and sell opportunities. It uses dynamic Stop Loss (SL) and Take Profit (TP) management, based on either market volatility (ATR) or liquidity zones.
This tool is intended for educational and informational purposes only.
Key Features:
Entry: Based on detecting Marubozu bullish or bearish candle pattern.
Exit: Targets are managed through ATR multiples or previous liquidity levels (swing highs or swing lows).
Smart Liquidity: Optionally identify deeper liquidity targets.
Full Alerts: Buy and Sell signals supported with customizable alerts.
Visualized Trades: Entry, SL, and TP levels are plotted on the chart.
User Inputs:
ATR Length, ATR Multipliers
Take Profit Mode (Liquidity/ATR)
Swing Lookback and Strength
Toggleable Buy/Sell alerts
All Time Frames
📖 How to Use:
Add the Indicator:
Apply the script to your chart from the TradingView indicators panel.
Look for Buy Signals:
A buy signal is triggered when the script detects a "Marubozu" bullish pattern.
Entry, Stop Loss, and Take Profit levels are plotted automatically.
Look for Sell Signals:
A Sell signal is triggered when the script detects a "Marubozu" bearish pattern.
Entry, Stop Loss, and Take Profit levels are plotted automatically.
Choose Take Profit Mode:
ATR Mode: TP is based on a volatility target.
Liquidity Mode: TP is based on past swing highs.
Set Alerts (Optional):
Enable Buy/Sell alerts in the settings to receive real-time notifications.
Practice First:
Always backtest and paper trade before live use.
📜 Disclaimer:
This script does not offer financial advice.
No guarantees of profit or performance are made.
Use in demo accounts or backtesting first.
Always practice proper risk management and seek advice from licensed professionals if needed.
✅ Script Compliance:
This script is designed in full accordance with TradingView’s House Rules for educational tools.
No financial advice is provided, no performance is guaranteed, and users are encouraged to backtest thoroughly.

Mikey’s Strategy (AutoEMA+)
⚙️ Core Idea:
A long-only EMA crossover strategy that automatically selects the optimal EMA length (5–25) based on historical performance using a custom scoring system.
🎯 Entry Conditions:
Price crosses above the selected EMA.
(Optional) Price is above HTF EMA200 (higher timeframe trend).
(Optional) ADX is above a minimum threshold.
(Optional) Volume is above average × multiplier.
A cooldown period has passed since the last exit.
❌ Exit Condition:
Price closes fully below the EMA (current candle: high, low, and close all below),
and the previous candle was above or touched the EMA.
🧠 Auto EMA Selection Logic:
Scans EMAs in the range (e.g., 8–21) every N bars.
Scores each EMA based on:
Time price spent above the EMA
Respect for EMA (touches)
Trend consistency
Distance from EMA (when above)
Picks the EMA with the highest valid score, and updates only if it’s significantly better.
🛡️ Risk Management:
No pyramiding (1 position max).
Cooldown period after exit.
No hard stop loss or take profit.
📊 Visuals & Alerts:
Plots the selected EMA and optional HTF EMA200.
Entry markers and info label on the chart.
Alerts for valid entries and filtered signals.

Smart Structure Breaks & Order BlocksOverview (What it does)
The indicator “Smart Structure Breaks & Order Blocks” detects market structure using swing highs and lows, identifies Break of Structure (BOS) events, and automatically draws order blocks (OBs) from the origin candle. These zones extend to the right and change color/outline when mitigated or invalidated. By formalizing and automating part of discretionary analysis, it provides consistent zone recognition.
Main Components
Swing Detection: ta.pivothigh/ta.pivotlow identify confirmed swing points.
BOS Detection: Determines if the recent swing high/low is broken by close (strict mode) or crossover.
OB Creation: After a BOS, the opposite candle (bearish for bullish BOS, bullish for bearish BOS) is used to generate an order block zone.
Zone Management: Limits the number of zones, extends them to the right, and tracks tagged (mitigated) or invalidated states.
Input Parameters
Left/Right Pivot (default 6/6): Number of bars required on each side to confirm a swing. Higher values = smoother swings.
Max Zones (default 4): Maximum zones stored per direction (bull/bear). Oldest zones are overwritten.
Zone Confirmation Lookback (default 3): Ensures OB origin candle validity by checking recent highs/lows.
Show Swing Points (default ON): Displays triangles on swing highs/lows.
Require close for BOS? (default ON): Strict BOS (close required) vs loose BOS (line crossover).
Use candle body for zones (default OFF): Zones drawn from candle body (ON) or wick (OFF).
Signal Definition & Logic
Swing Updates: Latest confirmed pivots update lastHighLevel / lastLowLevel.
BOS (Break of Structure):
Bullish – close breaks last swing high.
Bearish – close breaks last swing low.
Only one valid BOS per swing (avoids duplicates).
OB Detection:
Bullish BOS → previous bearish candle with lowest low forms the OB.
Bearish BOS → previous bullish candle with highest high forms the OB.
Zones: Bull = green, Bear = red, semi-transparent, extended to the right.
Zone States:
Mitigated: Price touches the zone → border highlighted.
Invalidated:
Bull zone → close below → turns red.
Bear zone → close above → turns green.
Chart Appearance
Swing High: red triangle above bar
Swing Low: green triangle below bar
Bull OB: green zone (border highlighted on touch)
Bear OB: red zone (border highlighted on touch)
Invalid Zones: Bull zones turn reddish, Bear zones turn greenish
Practical Use (Trading Assistance)
Trend Following Entries: Buy pullbacks into green OBs in uptrends, sell rallies into red OBs in downtrends.
Focus on First Touch: First mitigation after BOS often has higher reaction probability.
Confluence: Combine with higher timeframe trend, volume, session levels, key price levels (previous highs/lows, VWAP, etc.).
Stops/Targets:
Bull – stop below zone, partial take profit at swing high or resistance.
Bear – stop above zone, partial take profit at swing low or support.
Parameter Tuning (per market/timeframe)
Pivot (6/6 → 4/4/8/8): Lower for scalping (3–5), medium for day trading (5–8), higher for swing trading (8–14). Increase to reduce noise.
Strict Break: ON to reduce false breaks in ranging markets; OFF for earlier signals.
Body Zones: ON for assets with long wicks, OFF for cleaner OBs in liquid instruments.
Zone Confirmation (default 3): Increase for stricter OB origin, fewer zones.
Max Zones (default 4 → 6–10): Increase for higher volatility, decrease to avoid clutter.
Strengths
Standardizes BOS and OB detection that is usually subjective.
Tracks mitigation and invalidation automatically.
Adaptable: allows body/wick zone switching for different instruments.
Limitations
Pivot-based: Signals appear only after pivots confirm (slight lag).
Zones reflect past balance: Can fail after new events (news, earnings, macro data).
Range-heavy markets: More false BOS; consider stricter settings.
Backtesting: This script is for drawing/visual aid; trading rules must be defined separately.
Workflow Example
Identify higher timeframe trend (4H/Daily).
On lower TF (15–60m), wait for BOS and new OB.
Enter on first mitigation with confirmation candle.
Stop beyond zone; targets based on R multiples and swing points.
FAQ
Q: Why are zones invalidated quickly?
A: Flow reversal after BOS. Adjust pivots higher, enable Strict mode, or switch to Body zones to reduce noise.
Q: What does “tagged” mean?
A: Price touched the zone once = mitigated. Implies some orders in that zone may have been filled.
Q: Body or Wick zones?
A: Wick zones are fine in clean markets. For volatile pairs with long wicks, body zones provide more realistic areas.
Customization Tips (Code perspective)
Zone storage: Currently ring buffer ((idx+1) % zoneLimit). Could prioritize keeping unmitigated zones.
Automated testing: Add strategy.entry/exit for rule-based backtests.
Multi-timeframe: Use request.security() for higher timeframe swings/BOS.
Visualization: Add labels for BOS bars, tag zones with IDs, count touches.
Summary
This indicator formalizes the cycle Swing → BOS → OB creation → Mitigation/Invalidation, providing consistent structure analysis and zone tracking. By tuning sensitivity and strictness, and combining with higher timeframe context, it enhances pullback/continuation trading setups. Always combine with proper risk management.

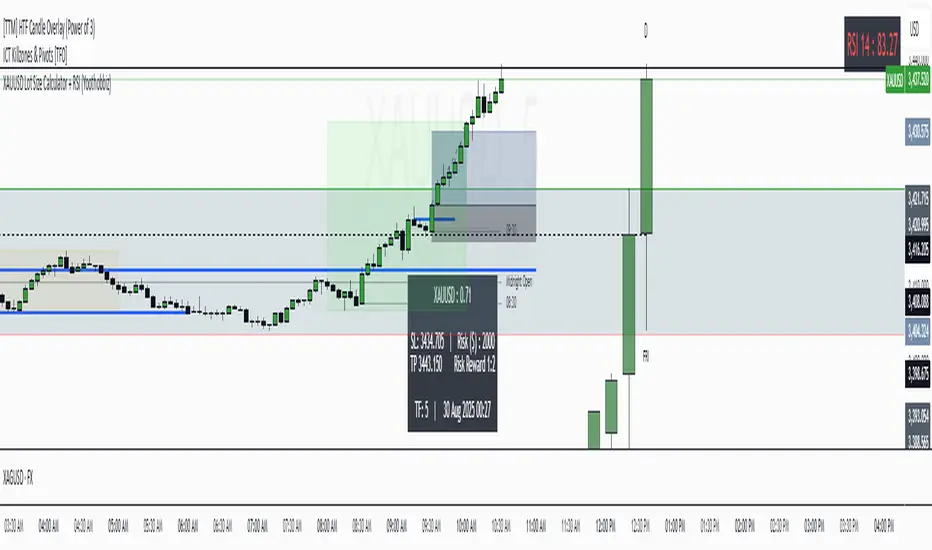
XAUUSD Lot Size Calculator + RSI (Yoothobbiz)This indicator is designed for Gold traders on the 5-minute timeframe (M5) who want a clear and editable lot size, stop loss, and take profit calculator directly on their chart.
✨ Features:
📌 Dynamic Lot Size Calculation – based on account capital, chosen risk %, and stop loss distance.
⚖️ Risk/Reward Management – automatically displays TP level using a customizable risk/reward ratio (e.g., 1:2, 1:3, etc.).
🛑 Stop Loss in Points & Price – calculates SL from recent M5 highs/lows, including spread.
🎯 Take Profit in Price & Points – automatically adjusted to your risk/reward ratio.
💵 Risk in USD – instantly shows how much capital is at risk per trade.
🕒 Custom Time Zone Support – displays the real trading time (default UTC-4 for New York), fully editable for any user.
⏱ Timeframe Label – clearly shows the working timeframe (M5 by default).
🎨 Fully Editable Display Panel:
Position (6 corners available).
Font family, size, style (bold/italic).
Text and background colors.
Adjustable spacing between lines.
🔑 How to Use:
Set your capital and risk % in the settings.
Adjust spread (in points) if needed.
Choose your risk/reward ratio.
The panel will display:
Recommended lot size for XAUUSD
Stop loss (price + points)
Take profit (price + ratio)
Risk in $
Timeframe & real-time clock
📍 Notes:
Optimized for XAUUSD (Gold) and the 5M timeframe.
Works on any asset/timeframe, but SL logic is based on M5 candle highs/lows.
Ideal for traders who want a fast and disciplined risk management tool right on their chart.
Cnagda Liquidit Trading SystemCnagda Liquidit Trading System helps spot where price is likely to trap traders and reverse, then gives simple, actionable Level to entry, place SL, and take profits with confidence. It blends imbalance zones, trend bias, order blocks, liquidity pools, high-probability fake Signal, and context-aware candle patterns into one clean workflow.
🟩🟥 Imbalance boxes: “Crowd rushed, gaps left”
What it is: Green/red boxes mark fast, one-sided moves where price “skipped” orders—think FVG-like zones that often get revisited.
Why it helps: Price frequently pulls back to “fill” these zones, creating clean retest entries with logical stops.
⏩How to use:
Green box = potential demand retest; Red box = potential supply retest. Enter on pullback into box, not on first impulse. Put stop on far side of box and aim first targets at recent swing points.
↕️ Swing bias (HH/HL vs LH/LL): “Which way is the road?”
What it is: Higher-highs/higher-lows = up-bias; Lower-highs/lower-lows = down-bias. system plots Buy/Sell OB levels aligned with that bias.
Why it helps: Trading with the broader flow reduces “hero trades” against institutions. Bias gives clearer entries and cleaner drawdowns.
⏩How to use:
Up-bias: look for long on Buy OB retests. Down-bias: look for short on Sell OB retests. Wait for a small rejection/engulfing to confirm before triggering.
🧱Order blocks: “Where big players remember”
What it is: last opposite-colored candle before an impulsive move—these zones often hold memory and reaction. system plots these as Buy/Sell OB lines.
Why it helps: Many breakouts pull back to the origin. Good entries often happen on retest, not on the breakout chase.
⏩ How to use:
Let price return into the OB, show wick rejection, and decent volume. Enter with stop beyond OB; define risk-reward before entry.
📊Volume coloring: “How Volume is move?”
What it is: Bar color reflects relative volume; inside bars are black. The dashboard also shows Volume and “Volume vs Prev.”
Why it helps: Patterns without volume often fade; volume validates strength and intent of moves.
⏩ How to use:
Favor entries where imbalance/OB/liquidity-grab coincide with higher volume. If volume is weak, reduce size or skip.
🧲 BSL/SSL liquidity pools: “Fishing for stops”
What it is: Equal highs cluster stops above (BSL); equal lows cluster stops below (SSL). system plots these and highlights the nearest one (“magnet”).
Why it helps: Price often sweeps these pools to trigger stops before reversing. This is a prime trap-reversal location.
⏩ How to use:
Watch nearest BSL/SSL. If price wicks through and closes back inside, anticipate a reversal. Trade reaction, not first poke. When price closes beyond, consider that pool mitigated and move on.
🟢🔴 Advanced liquidity grab: “Catch fakeout”
What it is: Bullish grab = makes a new low beyond a prior low but closes back above it, with a long lower wick, small body, and higher volume. Bearish is mirror. Labeled automatically.
Why it helps: It exposes trap moves (stop hunts) and often precedes true direction.
⏩ How to use:
Best when it aligns with a nearby imbalance/OB and supportive volume. Enter on reversal candle break or on retest. Stop goes beyond sweep wick.
🧠 Smart candlestick patterns (only in right place)
What it is: Engulfing, Hammer, Shooting Star, Hanging Man, Doji (with high volume), Morning/Evening Star, Piercing—but marked “effective” only if context (swing/trend/location) agrees.
Why it helps: same pattern in the wrong place is noise; in the right place, it’s signal.
⏩ How to use:
Location first (BSL/SSL/OB/imbalance), then pattern. Treat pattern as trigger/confirmation—one fresh label shows to keep chart clean.
🧭 Dashboard: “Context in a glance”
⏩ Reversal Level: current swing anchor—expect turns or reactions nearby; great for alerts and planning.
⏩ Volume vs Prev + Volume: Strength meter for signal candle—higher adds conviction.
⏩ Nearest Pool: next “magnet” area—look for sweeps/rejections there.
🧩Step-by-step trading flow (with mindset)
⏩ Set bias: HH/HL = long bias, LH/LL = short bias. Counter-trend only on clean sweeps with strong confirmation.
⏩ Find magnet: Check Nearest Pool (BSL/SSL). Focus attention there; it saves screen time.
⏩ Wait for event: Look for a sweep/grab label, or sharp rejection at pool/OB/imbalance. Avoid FOMO.
⏩ Add confluence: Stack 2–3 of these—imbalance box, OB, contextual pattern, supportive volume.
⏩Plan entry: Bullish: trigger above reversal candle high or take retest of FVG/OB. Stop below sweep wick/zone. Target at least 1:1.5–1:2.
Bearish: mirror above.
⏩Manage smartly: Take partials, move to breakeven or trail thoughtfully. Don’t drag stops inside zone out of emotion.
🎛️ Parameter tuning (to reduce human error)
⏩ swingLen: Smaller = faster but noisier; larger = cleaner but slower. Backtest first, then go live.
⏩ Tolerance (ATR or percent): ATR tolerance adapts to volatility (good for fast markets and lower TFs). Start around 0.15–0.30. In calm markets, try percent 0.05–0.15%.
⏩ minBarsGap: Start with 3–5 so equal highs/lows are truly equal—reduces false pools.
❌Common mistakes → ✅ Better habits
⏩Chasing every breakout → Wait for sweep/rejection, then confirm.
⏩Ignoring volume → Validate strength; cut size or skip on weak volume.
⏩Losing history of pools → If reviewing/backtesting, keep mitigated pools visible (dashed/faded).
⏩Over-tight tolerance/too small swingLen → Increases false signals; backtest to find balance.
📝 checklist (before entry)
⏩ Is there a nearby BSL/SSL and did a sweep/grab happen there?
⏩ Is there a close imbalance/OB that price can retest?
⏩ Do we have an effective pattern plus supportive volume?
⏩Is the stop beyond the wick/zone and RR ≥ 1:1.5?
•?((¯°·._.• 🎀 𝐻𝒶𝓅𝓅𝓎 𝒯𝓇𝒶𝒹𝒾𝓃𝑔 🎀 •._.·°¯((?•

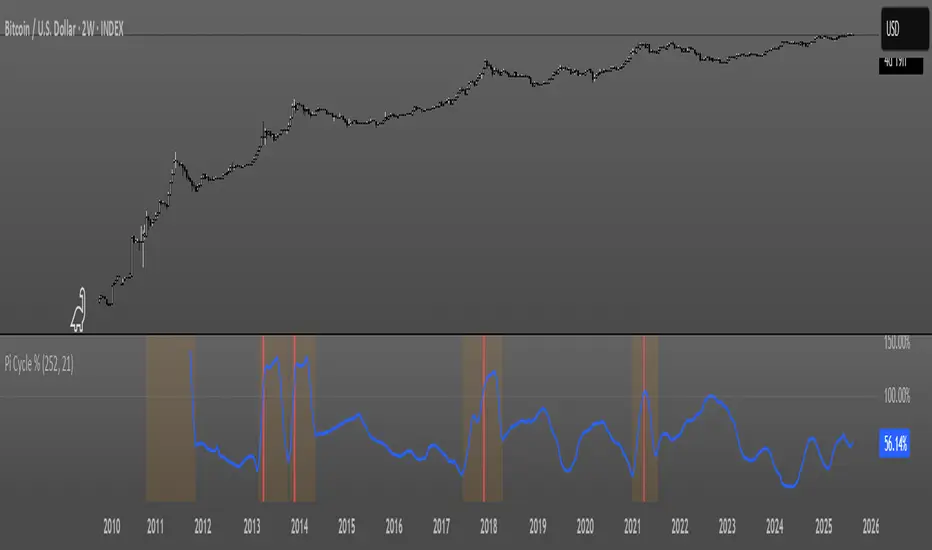
Pi Cycle OscillatorThis oscillator combines the Pi Cycle Top indicator with a percentile-based approach to create a more precise and easy to read market timing tool.
Instead of waiting for moving average crossovers, it shows you exactly how close you are to a potential market top.
Orange background means you should start preparing for a potential top and look into taking profits.
Red background means that the crossover has happened on the original Pi Cycle Indicator and that you should have already sold everything. (Crossover of the gray line aka 100)
Thank you
Bollinger Band Width Percentile - The_Caretaker
Pi Cycle Top - megasyl20
Script_Algo - Fibo Correction Strategy🔹 Core Concept
The strategy is built on combining Fibonacci retracement levels, candlestick pattern confirmation, and trend filtering for trade selection. It performs well on the 1-hour timeframe across many cryptocurrency pairs. Particularly on LINKUSDT over the past year and a half, despite the not very optimal 1:1 risk/reward ratio.
The logic is simple: after a strong impulse move, the price often retraces to key Fibonacci levels (specifically, the 61.8% level). If a confirming candlestick (pattern) appears at this moment, the strategy looks for an entry in the direction of the main trend.
🔹 Indicators Used in the Strategy
ATR (Average True Range) — Used to calculate the stop-loss and take-profit levels.
EMA (9 and 21) — Additional moving averages for assessing the direction of movement (not directly used in entry conditions, but the logic can be expanded to include them).
SMA (Trend Filter, 20 by default) — The trend direction filter. Trades are only opened in its direction.
Fibonacci Levels — The 61.8% retracement level is calculated based on the high and low of the previous candle.
🔹 Entry Conditions
🟢 Long (Buy):
Previous Candle:
Must be green (close higher than open).
Must have a body not smaller than a specified minimum.
The upper wick must not exceed 30% of the body size.
→ This filters out "weak" or "indecisive" candles.
Current Candle:
Price touches or breaches the Fibonacci 61.8% retracement level from the previous range.
Closes above this level.
Closes above the Trend Filter (SMA) line.
A position is opened only if there are no other open trades at the moment.
🔴 Short (Sell):
Previous Candle:
Must be red (close lower than open).
Must have a body not smaller than a specified minimum.
The lower wick must not exceed 30% of the body size.
Current Candle:
Price touches or breaches the Fibonacci 61.8% retracement level from the previous range.
Closes below this level.
Closes below the Trend Filter (SMA) line.
A trade is opened only if there are no other open positions.
🔹 Risk Management
Stop-Loss = ATR × multiplier (default is 5).
Take-Profit = ATR × the same multiplier.
Thus, the default risk/reward ratio is 1:1, but it can be easily adjusted by changing the coefficient. Although, strangely enough, this ratio has shown the best results on some assets on the 1-hour timeframe.
🔹 Chart Visualization
Fibonacci level for Long — Green line with circles.
Fibonacci level for Short — Red line with circles.
Trend Filter line (SMA) — Blue.
🔹 Strengths of the Strategy
✅ Utilizes a proven market pattern — retracement to the 61.8% level.
✅ Further filters entries using trend and candlestick patterns.
✅ Simple, transparent logic that is easy to expand (e.g., adding other Fib levels, an EMA filter, etc.).
🔹 Limitations
⚠️ Performs better in trending markets; can generate false signals during ranging (sideways) conditions.
⚠️ The fixed 1:1 risk/reward ratio is not always optimal and could be refined.
⚠️ Performance depends on the selected timeframe and ATR parameters.
📌 Summary:
The strategy seeks corrective entries in the direction of the trend, confirmed by candlestick patterns. It is versatile and can be applied to forex pairs, cryptocurrencies, and stocks.
⚠️ Not financial advice. Pay close attention to risk management to avoid blowing your account. The strategy is not repainting — I have personally verified it through real testing — but it may not necessarily replicate the same results in the future, as the market is constantly changing. Test it, profit, and good luck to everyone!

MTF RSI + ADX + ATR SL/TP vivekDescription:
This strategy combines the power of multi-timeframe RSI filtering with ADX trend confirmation and ATR-based risk management to capture strong directional moves.
🔑 Entry Rules:
• Daily RSI > 60
• 4H RSI > 60
• 1H RSI > 60
• 10m RSI > 40
• ADX (current timeframe) > 20
When all conditions align, a long entry is triggered.
🛡 Risk Management:
• ATR-based Stop-Loss (customizable multiplier)
• Take-Profit defined as a Risk-Reward multiple of the ATR stop
🎯 Why this Strategy?
• Ensures alignment across higher timeframes before entering a trade
• Uses ADX to avoid choppy/range-bound markets
• Built-in ATR stop-loss & take-profit for disciplined risk control
• Fully customizable parameters
This strategy is designed for trend-following swing entries. It works best on liquid instruments such as indices, forex pairs, and large-cap stocks. Always optimize the parameters based on your preferred asset and timeframe.

MTF RSI + ADX + ATR SL/TPThis strategy combines the power of multi-timeframe RSI filtering with ADX trend confirmation and ATR-based risk management to capture strong directional moves.
🔑 Entry Rules:
• Daily RSI > 60
• 4H RSI > 60
• 1H RSI > 60
• 10m RSI > 40
• ADX (current timeframe) > 20
When all conditions align, a long entry is triggered.
🛡 Risk Management:
• ATR-based Stop-Loss (customizable multiplier)
• Take-Profit defined as a Risk-Reward multiple of the ATR stop
🎯 Why this Strategy?
• Ensures alignment across higher timeframes before entering a trade
• Uses ADX to avoid choppy/range-bound markets
• Built-in ATR stop-loss & take-profit for disciplined risk control
• Fully customizable parameters
This strategy is designed for trend-following swing entries. It works best on liquid instruments such as indices, forex pairs, and large-cap stocks. Always optimize the parameters based on your preferred asset and timeframe.

Ruptura + EMAs + VWAP + Vela Impulsiva Indicator: Breakout + EMAs + VWAP + Impulsive Candle + TP/SL
This indicator is designed to identify breakout trading opportunities by combining price action, moving averages, volume-weighted price, and impulsive candles, with clearly defined Take Profit (TP) and Stop Loss (SL) levels.
⏱️ Timeframe Logic:
The 15-minute chart is used to define the price range.
Entries are made on the 2-minute chart when breakout conditions align with momentum confirmation.
📌 Key Components:
Range Definition:
Calculates a price range based on a customizable number of candles (rangeBars), typically from the 15-minute timeframe.
Displays a shaded box highlighting this range.
Trend Filters:
Uses a fast EMA (9) and a slow EMA (21) to determine short-term and medium-term trends.
Includes VWAP as a dynamic support/resistance and directional filter.
Only allows trades when both EMAs and price confirm alignment above (for long) or below (for short) the VWAP.
Impulsive Candle Detection:
Confirms breakouts using large-bodied candles that engulf the previous candle's range.
The candle must exceed a certain multiple of the average range (minRangeMult) to qualify.
Breakout Entry Conditions:
Long Setup: Price breaks above the range high, with EMAs and VWAP confirming bullish alignment, and confirmed by an impulsive candle.
Short Setup: Price breaks below the range low, with EMAs and VWAP aligned bearishly, confirmed by an impulsive candle.
Trade Management:
Automatically plots Take Profit and Stop Loss levels based on the size of the entry candle and a customizable TP multiplier.
Visual dashed lines indicate TP (green) and SL (red) zones.
Session Filter:
Entry signals are limited to a specific time window (e.g., 9:00 to 10:00 AM New York time), typically during the NY session open.
Visual Aids:
Background color highlights potential entry zones (green for long, red for short).
Icons mark confirmed impulsive candles and entry signals.
Range box is updated periodically to reflect the active breakout zone.
Script de código abierto
Siguiendo fielmente el espíritu de TradingView, el creador de este script lo ha publicado en código abierto, permitiendo que otros traders puedan revisar y verificar su funcionalidad. ¡Enhorabuena al autor! Puede utilizarlo de forma gratuita, pero tenga en cuenta que la publicación de este código está sujeta a nuestras Normas internas.
SuperTrend+ UpdatedSuperTrend+ with SL/TP is a technical analysis tool designed to identify market trends and potential trading opportunities. Based on the SuperTrend indicator, it incorporates additional features including stop loss and take profit level calculations.
The indicator visually displays uptrends and downtrends through colored lines and background highlighting, making trend direction easy to identify. It generates buy and sell signals when trend reversals are detected, with optional volume filtering to reduce false signals.
Key features include customizable ATR parameters, multiple calculation methods for stop loss and take profit levels (ATR-based or fixed percentage), and clear visual markers for entry points and target levels.
Ideal for traders looking to identify trend directions and manage risk with predefined exit levels, this indicator works across various timeframes and financial instruments.
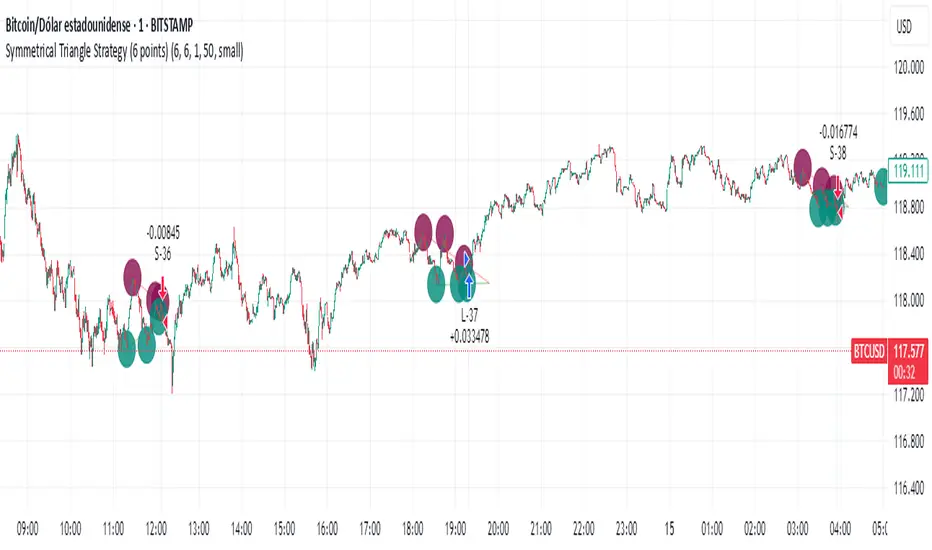
Simple Symmetrical Triangle Strategy (6 points)Overview
This strategy identifies triangle patterns formed by a series of key high and low price points. A trade is triggered when the price breaks out from the pattern's final confirmation points: a buy signal occurs on a close above the last high point, and a sell signal on a close below the last low point. To ensure relevance, any pattern that doesn't break out within 10 bars is automatically discarded.
This helps filter out patterns that lose momentum and focuses only on the most imminent breakouts.
How It Works
1. Pattern Detection: The script continuously scans for a sequence of three declining highs (points H1, H2, H3) and three rising lows (points L1, L2, L3) to form a triangle.
2. Entry Logic: The logic is straightforward and based on breaking the last confirmed pivot:
* Long Entry: A buy order is executed if the price closes above the level of the last high (H3).
* Short Entry: A sell order is executed if the price closes below the level of the last low (L3).
3. Pattern Expiration: A triangle only remains "active" for 10 bars after its formation. If a breakout doesn't occur within this window, the pattern is removed from analysis, avoiding trades on prolonged, unresolved consolidations.
Key Features
* Automatic Detection: Identifies and draws triangles for you.
* Simple Breakout Logic: Easy to understand, trades by following the price action.
* Time Filter: Its main advantage is discarding patterns that do not resolve quickly.
* Customizable: You can adjust the sensitivity of the pivot detection in the settings.
Important Disclaimer
This strategy is designed as an entry system and DOES NOT INCLUDE A STOP LOSS OR TAKE PROFIT.
Automation Ready
Want to automate this or ANY strategy on your broker or MetaTrader (MT4/MT5) without keeping your computer on or needing a VPS? You can use WebhookTrade.
Symmetrical Triangle Strategy (Real and Trap confirmation)Overview
This is an advanced strategy that not only detects symmetrical triangle patterns but also attempts to differentiate between a genuine breakout and a false breakout (a trap) to trade accordingly.
Instead of blindly following every breakout, it analyzes the "quality" of the move using Volume and RSI filters. If the breakout appears weak, it prepares to trade in the opposite direction, capitalizing on the pattern's failure.
How It Works
The strategy employs a dual logic that activates after the price breaks the last pivot (H3 or L3):
1. Scenario A: The Real Breakout
* If the price breaks the triangle AND the breakout is confirmed by a surge in volume and/or a favorable RSI, the strategy considers the move genuine and enters in the direction of the breakout.
2. Scenario B: The False Breakout (Trap)
* If the price breaks the triangle BUT the indicators fail to confirm it (e.g., low volume), the strategy interprets it as a potential trap.
* It waits for the price to return inside the pattern.
* Once the price has re-entered, it opens a trade AGAINST the initial breakout, betting that the first move was a fake-out.
Key Features
* Hybrid Logic: It's not just a simple breakout strategy; it adapts to market conditions.
* Confirmation Filters: Uses Volume and RSI to validate the strength of a breakout (fully configurable).
* Capitalizes on Traps: Its greatest strength is the ability to identify and trade false breakouts, a common market scenario.
* Optional Confirmation: For trap trades, an extra confirmation via an EMA crossover can be enabled for added safety.
* Opportunity Timeout: Potential traps have a time limit to be confirmed, preventing the strategy from getting stuck in an undecided scenario.
Important Disclaimer
This strategy is designed as an entry system and DOES NOT INCLUDE A STOP LOSS OR TAKE PROFIT.
Automation Ready
Want to automate this or ANY strategy on your broker or MetaTrader (MT4/MT5) without keeping your computer on or needing a VPS? You can use WebhookTrade.

Seasonality Monte Carlo Forecaster [BackQuant]Seasonality Monte Carlo Forecaster
Plain-English overview
This tool projects a cone of plausible future prices by combining two ideas that traders already use intuitively: seasonality and uncertainty. It watches how your market typically behaves around this calendar date, turns that seasonal tendency into a small daily “drift,” then runs many randomized price paths forward to estimate where price could land tomorrow, next week, or a month from now. The result is a probability cone with a clear expected path, plus optional overlays that show how past years tended to move from this point on the calendar. It is a planning tool, not a crystal ball: the goal is to quantify ranges and odds so you can size, place stops, set targets, and time entries with more realism.
What Monte Carlo is and why quants rely on it
• Definition . Monte Carlo simulation is a way to answer “what might happen next?” when there is randomness in the system. Instead of producing a single forecast, it generates thousands of alternate futures by repeatedly sampling random shocks and adding them to a model of how prices evolve.
• Why it is used . Markets are noisy. A single point forecast hides risk. Monte Carlo gives a distribution of outcomes so you can reason in probabilities: the median path, the 68% band, the 95% band, tail risks, and the chance of hitting a specific level within a horizon.
• Core strengths in quant finance .
– Path-dependent questions : “What is the probability we touch a stop before a target?” “What is the expected drawdown on the way to my objective?”
– Pricing and risk : Useful for path-dependent options, Value-at-Risk (VaR), expected shortfall (CVaR), stress paths, and scenario analysis when closed-form formulas are unrealistic.
– Planning under uncertainty : Portfolio construction and rebalancing rules can be tested against a cloud of plausible futures rather than a single guess.
• Why it fits trading workflows . It turns gut feel like “seasonality is supportive here” into quantitative ranges: “median path suggests +X% with a 68% band of ±Y%; stop at Z has only ~16% odds of being tagged in N days.”
How this indicator builds its probability cone
1) Seasonal pattern discovery
The script builds two day-of-year maps as new data arrives:
• A return map where each calendar day stores an exponentially smoothed average of that day’s log return (yesterday→today). The smoothing (90% old, 10% new) behaves like an EWMA, letting older seasons matter while adapting to new information.
• A volatility map that tracks the typical absolute return for the same calendar day.
It calculates the day-of-year carefully (with leap-year adjustment) and indexes into a 365-slot seasonal array so “March 18” is compared with past March 18ths. This becomes the seasonal bias that gently nudges simulations up or down on each forecast day.
2) Choice of randomness engine
You can pick how the future shocks are generated:
• Daily mode uses a Gaussian draw with the seasonal bias as the mean and a volatility that comes from realized returns, scaled down to avoid over-fitting. It relies on the Box–Muller transform internally to turn two uniform random numbers into one normal shock.
• Weekly mode uses bootstrap sampling from the seasonal return history (resampling actual historical daily drifts and then blending in a fraction of the seasonal bias). Bootstrapping is robust when the empirical distribution has asymmetry or fatter tails than a normal distribution.
Both modes seed their random draws deterministically per path and day, which makes plots reproducible bar-to-bar and avoids flickering bands.
3) Volatility scaling to current conditions
Markets do not always live in average volatility. The engine computes a simple volatility factor from ATR(20)/price and scales the simulated shocks up or down within sensible bounds (clamped between 0.5× and 2.0×). When the current regime is quiet, the cone narrows; when ranges expand, the cone widens. This prevents the classic mistake of projecting calm markets into a storm or vice versa.
4) Many futures, summarized by percentiles
The model generates a matrix of price paths (capped at 100 runs for performance inside TradingView), each path stepping forward for your selected horizon. For each forecast day it sorts the simulated prices and pulls key percentiles:
• 5th and 95th → approximate 95% band (outer cone).
• 16th and 84th → approximate 68% band (inner cone).
• 50th → the median or “expected path.”
These are drawn as polylines so you can immediately see central tendency and dispersion.
5) A historical overlay (optional)
Turn on the overlay to sketch a dotted path of what a purely seasonal projection would look like for the next ~30 days using only the return map, no randomness. This is not a forecast; it is a visual reminder of the seasonal drift you are biasing toward.
Inputs you control and how to think about them
Monte Carlo Simulation
• Price Series for Calculation . The source series, typically close.
• Enable Probability Forecasts . Master switch for simulation and drawing.
• Simulation Iterations . Requested number of paths to run. Internally capped at 100 to protect performance, which is generally enough to estimate the percentiles for a trading chart. If you need ultra-smooth bands, shorten the horizon.
• Forecast Days Ahead . The length of the cone. Longer horizons dilute seasonal signal and widen uncertainty.
• Probability Bands . Draw all bands, just 95%, just 68%, or a custom level (display logic remains 68/95 internally; the custom number is for labeling and color choice).
• Pattern Resolution . Daily leans on day-of-year effects like “turn-of-month” or holiday patterns. Weekly biases toward day-of-week tendencies and bootstraps from history.
• Volatility Scaling . On by default so the cone respects today’s range context.
Plotting & UI
• Probability Cone . Plots the outer and inner percentile envelopes.
• Expected Path . Plots the median line through the cone.
• Historical Overlay . Dotted seasonal-only projection for context.
• Band Transparency/Colors . Customize primary (outer) and secondary (inner) band colors and the mean path color. Use higher transparency for cleaner charts.
What appears on your chart
• A cone starting at the most recent bar, fanning outward. The outer lines are the ~95% band; the inner lines are the ~68% band.
• A median path (default blue) running through the center of the cone.
• An info panel on the final historical bar that summarizes simulation count, forecast days, number of seasonal patterns learned, the current day-of-year, expected percentage return to the median, and the approximate 95% half-range in percent.
• Optional historical seasonal path drawn as dotted segments for the next 30 bars.
How to use it in trading
1) Position sizing and stop logic
The cone translates “volatility plus seasonality” into distances.
• Put stops outside the inner band if you want only ~16% odds of a stop-out due to noise before your thesis can play.
• Size positions so that a test of the inner band is survivable and a test of the outer band is rare but acceptable.
• If your target sits inside the 68% band at your horizon, the payoff is likely modest; outside the 68% but inside the 95% can justify “one-good-push” trades; beyond the 95% band is a low-probability flyer—consider scaling plans or optionality.
2) Entry timing with seasonal bias
When the median path slopes up from this calendar date and the cone is relatively narrow, a pullback toward the lower inner band can be a high-quality entry with a tight invalidation. If the median slopes down, fade rallies toward the upper band or step aside if it clashes with your system.
3) Target selection
Project your time horizon to N bars ahead, then pick targets around the median or the opposite inner band depending on your style. You can also anchor dynamic take-profits to the moving median as new bars arrive.
4) Scenario planning & “what-ifs”
Before events, glance at the cone: if the 95% band already spans a huge range, trade smaller, expect whips, and avoid placing stops at obvious band edges. If the cone is unusually tight, consider breakout tactics and be ready to add if volatility expands beyond the inner band with follow-through.
5) Options and vol tactics
• When the cone is tight : Prefer long gamma structures (debit spreads) only if you expect a regime shift; otherwise premium selling may dominate.
• When the cone is wide : Debit structures benefit from range; credit spreads need wider wings or smaller size. Align with your separate IV metrics.
Reading the probability cone like a pro
• Cone slope = seasonal drift. Upward slope means the calendar has historically favored positive drift from this date, downward slope the opposite.
• Cone width = regime volatility. A widening fan tells you that uncertainty grows fast; a narrow cone says the market typically stays contained.
• Mean vs. price gap . If spot trades well above the median path and the upper band, mean-reversion risk is high. If spot presses the lower inner band in an up-sloping cone, you are in the “buy fear” zone.
• Touches and pierces . Touching the inner band is common noise; piercing it with momentum signals potential regime change; the outer band should be rare and often brings snap-backs unless there is a structural catalyst.
Methodological notes (what the code actually does)
• Log returns are used for additivity and better statistical behavior: sim_ret is applied via exp(sim_ret) to evolve price.
• Seasonal arrays are updated online with EWMA (90/10) so the model keeps learning as each bar arrives.
• Leap years are handled; indexing still normalizes into a 365-slot map so the seasonal pattern remains stable.
• Gaussian engine (Daily mode) centers shocks on the seasonal bias with a conservative standard deviation.
• Bootstrap engine (Weekly mode) resamples from observed seasonal returns and adds a fraction of the bias, which captures skew and fat tails better.
• Volatility adjustment multiplies each daily shock by a factor derived from ATR(20)/price, clamped between 0.5 and 2.0 to avoid extreme cones.
• Performance guardrails : simulations are capped at 100 paths; the probability cone uses polylines (no heavy fills) and only draws on the last confirmed bar to keep charts responsive.
• Prerequisite data : at least ~30 seasonal entries are required before the model will draw a cone; otherwise it waits for more history.
Strengths and limitations
• Strengths :
– Probabilistic thinking replaces single-point guessing.
– Seasonality adds a small but meaningful directional bias that many markets exhibit.
– Volatility scaling adapts to the current regime so the cone stays realistic.
• Limitations :
– Seasonality can break around structural changes, policy shifts, or one-off events.
– The number of paths is performance-limited; percentile estimates are good for trading, not for academic precision.
– The model assumes tomorrow’s randomness resembles recent randomness; if regime shifts violently, the cone will lag until the EWMA adapts.
– Holidays and missing sessions can thin the seasonal sample for some assets; be cautious with very short histories.
Tuning guide
• Horizon : 10–20 bars for tactical trades; 30+ for swing planning when you care more about broad ranges than precise targets.
• Iterations : The default 100 is enough for stable 5/16/50/84/95 percentiles. If you crave smoother lines, shorten the horizon or run on higher timeframes.
• Daily vs. Weekly : Daily for equities and crypto where month-end and turn-of-month effects matter; Weekly for futures and FX where day-of-week behavior is strong.
• Volatility scaling : Keep it on. Turn off only when you intentionally want a “pure seasonality” cone unaffected by current turbulence.
Workflow examples
• Swing continuation : Cone slopes up, price pulls into the lower inner band, your system fires. Enter near the band, stop just outside the outer line for the next 3–5 bars, target near the median or the opposite inner band.
• Fade extremes : Cone is flat or down, price gaps to the upper outer band on news, then stalls. Favor mean-reversion toward the median, size small if volatility scaling is elevated.
• Event play : Before CPI or earnings on a proxy index, check cone width. If the inner band is already wide, cut size or prefer options structures that benefit from range.
Good habits
• Pair the cone with your entry engine (breakout, pullback, order flow). Let Monte Carlo do range math; let your system do signal quality.
• Do not anchor blindly to the median; recalc after each bar. When the cone’s slope flips or width jumps, the plan should adapt.
• Validate seasonality for your symbol and timeframe; not every market has strong calendar effects.
Summary
The Seasonality Monte Carlo Forecaster wraps institutional risk planning into a single overlay: a data-driven seasonal drift, realistic volatility scaling, and a probabilistic cone that answers “where could we be, with what odds?” within your trading horizon. Use it to place stops where randomness is less likely to take you out, to set targets aligned with realistic travel, and to size positions with confidence born from distributions rather than hunches. It will not predict the future, but it will keep your decisions anchored to probabilities—the language markets actually speak.
