2Mars - MA / BB / SuperTrend
The 2Mars strategy is a trading approach that aims to improve trading efficiency by incorporating several simple order opening tactics. These tactics include moving average crossovers, Bollinger Bands, and SuperTrend.
Entering a Position with the 2Mars Strategy:
Moving Average Crossover: This method considers the crossing of moving averages as a signal to enter a position.
Price Crossing Bollinger Bands: If the price crosses either the upper or lower Bollinger Band, it is seen as a signal to enter a position.
Price Crossing Moving Average: If the price crosses the moving average, it is also considered a signal to enter a position.
SuperTrend and Bars confirm:
The SuperTrend indicator is used to provide additional confirmation for entering positions and setting stop loss levels. "Bars confirm" is used only for entry to positions.
Moving Average Crossover Strategy:
A moving average crossover refers to the point on a chart where there is a crossover of the signal or fast moving average, above or below the basis or slow moving average. This strategy also uses moving averages for additional orders #3.
Basis Moving Average Length: Ratio * Multiplier
Signal Moving Average Length: Multiplier
Bollinger Bands:
Bollinger Bands consist of three bands: an upper band, a lower band, and a basis moving average. However, the 2Mars strategy incorporates multiple upper and lower levels for position entry and take profit.
Basis +/- StdDev * 0.618
Basis +/- StdDev * 1.618
Basis +/- StdDev * 2.618
Additional Orders:
Additional Order #1 and #2: closing price crosses above or below the Bollinger Bands.
Additional Order #3: closing price crosses above or below the basis or signal moving average.
Take Profit:
The strategy includes three levels for taking profits, which are based on the Bollinger Bands. Additionally, a percentage of the position can be chosen to close long or short positions.
Limit Orders:
The strategy allows for entering a position using a limit order. The calculation for the limit order involves the Average True Range (ATR) for a specific period.
For long positions: Low price - ATR * Multiplier
For short positions: High price + ATR * Multiplier
Stop Loss:
To manage risk, the strategy recommends using stop loss options. The stop loss is updated with each entry order and take-profit level 3. When using the SuperTrend Confirmation, the stop loss requires confirmation of a trend change. It allows for flexible adjustment of the stop loss when the trend changes.
There are three options for setting the stop loss:
1. ATR (Average True Range):
For long positions: Low price - ATR * Long multiplier
For short positions: High price + ATR * Short multiplier
2. SuperTrend + ATR:
For long positions: SuperTrend - ATR * Long multiplier
For short positions: SuperTrend + ATR * Short multiplier
3. StdDev:
For long positions: StdDev - ATR * Long multiplier
For short positions: StdDev + ATR * Short multiplier
Flexible Stop Loss:
There is also a flexible stop loss option for the ATR and StdDev methods. It is triggered when the SuperTrend or moving average trend changes unfavorably.
For long positions: Stop-loss price + (ATR * Long multiplier) * Multiplier
For short positions: Stop-loss price - (ATR * Short multiplier) * Multiplier
How configure:
Disable SuperTrend, take profit, stop loss, additional orders and begin setting up a strategy.
Pick soucre data
Number of bars for confirm
Pick up the ratio of the base moving average and the signal moving average.
Set up a SuperTrend
Time for set up of the Bollinger Bands and the take profit
And finaly set up of stop loss and limit orders
All done!
For OKX exchange:
Cerca negli script per "take profit"

The Flash-Strategy (Momentum-RSI, EMA-crossover, ATR)The Flash-Strategy (Momentum-RSI, EMA-crossover, ATR)
Are you tired of manually analyzing charts and trying to find profitable trading opportunities? Look no further! Our algorithmic trading strategy, "Flash," is here to simplify your trading process and maximize your profits.
Flash is an advanced trading algorithm that combines three powerful indicators to generate highly selective and accurate trading signals. The Momentum-RSI, Super-Trend Analysis and EMA-Strategy indicators are used to identify the strength and direction of the underlying trend.
The Momentum-RSI signals the strength of the trend and only generates trading signals in confirmed upward or downward trends. The Super-Trend Analysis confirms the trend direction and generates signals when the price breaks through the super-trend line. The EMA-Strategy is used as a qualifier for the generation of trading signals, where buy signals are generated when the EMA crosses relevant trend lines.
Flash is highly selective, as it only generates trading signals when all three indicators align. This ensures that only the highest probability trades are taken, resulting in maximum profits.
Our trading strategy also comes with two profit management options. Option 1 uses the so-called supertrend-indicator which uses the dynamic ATR as a key input, while option 2 applies pre-defined, fixed SL and TP levels.
The settings for each indicator can be customized, allowing you to adjust the length, limit value, factor, and source value to suit your preferences. You can also set the time period in which you want to run the backtest and how many dollar trades you want to open in each position for fully automated trading.
Choose your preferred trade direction and stop-loss/take-profit settings, and let Flash do the rest. Say goodbye to manual chart analysis and hello to consistent profits with Flash. Try it now!
General Comments
This Flash Strategy has been developed in cooperation between Baby_whale_to_moon and JS-TechTrading. Cudos to Baby_whale_to_moon for doing a great job in transforming sophisticated trading ideas into pine scripts.
Detailed Description
The “Flash” script considers the following indicators for the generation of trading signals:
1. Momentum-RSI
2. ‘Super-Trend’-Analysis
3. EMA-Strategy
1. Momentum-RSI
• This indicator signals the strength of the underlying upward- or downward-trend.
• The signal range of this indicator is from 0 to 100. Values > 60 indicate a confirmed upward- or downward-trend.
• The strategy will only generate trading signals in case the stock (or any other financial security) is in a confirmed upward- (long entry signals) or downward-trend (short entry signals).
• This indicator provides information with regards to the strength of the underlying trend and it does not give any insight with regard to the direction of the trend. Therefore, this strategy also considers other indicators which provide technical confirmation with regards to the direction of the underlying trend.
Graph 1 shows this concept:
• The Momentum-RSI indicator gives lower readings during consolidation phases and no trading signals are generated during these periods.
Example (graph 2):
2. Super-Trend Analysis
• The red line in the graph below represents the so-called super-trend-line. Trading signals are only generated in case the price action breaks through this super-trend-line indicating a new confirmed upward-trend (or downward-trend, respectively).
• If that happens, the super trend-line changes its color from red to green, giving confirmation that the trend changed from bearish to bullish and long-entries can be considered.
• The vice-versa approach can be considered for short entries.
Graph 3 explains this concept:
3. Exponential Moving Average / EMA-Strategy
The functionality of this EMA-element of the strategy has been programmed as follows:
• The exponential moving average and two other trend lines are being used as qualifiers for the generation of trading-signals.
• Buy-signals for long-entries are only considered in case the EMA (yellow line in the graph below) crosses the red line.
• Sell-signals for short-entries are only considered in case the EMA (yellow line in the graph below) crosses the green line.
An example is shown in graph 4 below:
We use this indicator to determine the new trend direction that may occur by using the data of the price's past movement.
4. Bringing it all together
This section describes in detail, how this strategy combines the Momentum-RSI, the super-trend analysis and the EMA-strategy.
The strategy only generates trading-signals in case all of the following conditions and qualifiers are being met:
1. Momentum-RSI is higher than the set value of this strategy. The standard and recommended value is 60 (graph 5):
2. The super-trend analysis needs to indicate a confirmed upward-trend (for long-entry signals) or a confirmed downward-trend (for short-entry signals), respectively.
3. The EMA-strategy needs to indicate that the stock or financial security is in a confirmed upward-trend (long-entries) or downward-trend (short-entries), respectively.
The strategy will only generate trading signals if all three qualifiers are being met. This makes this strategy highly selective and is the key secret for its success.
Example for Long-Entry (graph 6):
When these conditions are met, our Long position is opened.
Example for Short-Entry (graph 7):
Trade Management Options (graph 8)
Option 1
In this dynamic version, the so-called supertrend-indicator is being used for the trade exit management. This supertrend-indicator is a sophisticated and optimized methodology which uses the dynamic ATR as one of its key input parameters.
The following settings of the supertrend-indicator can be changed and optimized (graph 9):
The dynamic SL/TP-lines of the supertrend-indicator are shown in the charts. The ATR-length and the supertrend-factor result in a multiplier value which can be used to fine-tune and optimize this strategy based on the financial security, timeframe and overall market environment.
Option 2 (graph 10):
Option 2 applies pre-defined, fixed SL and TP levels which will appear as straight horizontal lines in the chart.
Settings options (graph 11):
The following settings can be changed for the three elements of this strategy:
1. (Length Mom-Rsi): Length of our Mom-RSI indicator.
2. Mom-RSI Limit Val: the higher this number, the more momentum of the underlying trend is required before the strategy will start creating trading signals.
3. The length and factor values of the super trend indicator can be adjusted:ATR Length SuperTrend and Factor Super Trend
4. You can set the source value used by the ema trend indicator to determine the ema line: Source Ema Ind
5. You can set the EMA length and the percentage value to follow the price: Length Ema Ind and Percent Ema Ind
6. The backtesting period can be adjusted: Start and End time of BackTest
7. Dollar cost per position: this is relevant for 100% fully automated trading.
8. Trade direction can be adjusted: LONG, SHORT or BOTH
9. As we explained above, we can determine our stop-loss and take-profit levels dynamically or statically. (Version 1 or Version 2 )
Display options on the charts graph 12):
1. Show horizontal lines for the Stop-Loss and Take-profit levels on the charts.
2. Display relevant Trend Lines, including color setting options for the supertrend functionality. In the example below, green lines indicate a confirmed uptrend, red lines indicate a confirmed downtrend.
Other comments
• This indicator has been optimized to be applied for 1 hour-charts. However, the underlying principles of this strategy are supply and demand in the financial markets and the strategy can be applied to all timeframes. Daytraders can use the 1min- or 5min charts, swing-traders can use the daily charts.
• This strategy has been designed to identify the most promising, highest probability entries and trades for each stock or other financial security.
• The combination of the qualifiers results in a highly selective strategy which only considers the most promising swing-trading entries. As a result, you will normally only find a low number of trades for each stock or other financial security per year in case you apply this strategy for the daily charts. Shorter timeframes will result in a higher number of trades / year.
• Consequently, traders need to apply this strategy for a full watchlist rather than just one financial security.

Channels Strategy [JoseMetal]============
ENGLISH
============
- Description:
This strategy is based on Bollinger Bands / Keltner Channel price "rebounds" (the idea of price bouncing from one band to another).
The strategy has several customizable options, which allows you to refine the strategy for your asset and timeframe.
You can customize settings for ALL indicators, Bollinger Bands (period and standard deviation), Keltner Channel (period and ATR multiplier) and ATR (period).
- AVAILABLE INDICATORS:
You can pick Bollinger Bands or Keltner Channels for the strategy, the chosen indicator will be plotted as well.
- CUSTOM CONDITIONS TO ENTER A POSITION:
1. Price breaks the band (low below lower band for LONG or high above higher band for SHORT).
2. Same as 1 but THEN (next candle) price closes INSIDE the bands.
3. Price breaks the band AND CLOSES OUT of the band (lower band for LONG and higher band for SHORT).
4. Same as 3 but THEN (next candle) price closes INSIDE the bands.
- STOP LOSS OPTIONS:
1. Previous wick (low of previous candle if LONG and high or previous candle if SHORT).
2. Extended band, you can customize settings for a second indicator with larger values to use it as STOP LOSS, for example, Bollinger Bands with 2 standard deviations to open positions and 3 for STOP LOSS.
3. ATR: you can pick average true ratio from a source (like closing price) with a multiplier to calculate STOP LOSS.
- TAKE PROFIT OPTIONS:
1. Opposite band (top band for LONGs, bottom band for SHORTs).
2. Moving average: Bollinger Bands simple moving average or Keltner Channel exponential moving average .
3. ATR: you can pick average true ratio from a source (like closing price) with a multiplier to calculate TAKE PROFIT.
- OTHER OPTIONS:
You can pick to trade only LONGs, only SHORTs, both or none (just indicator).
You can enable DYNAMIC TAKE PROFIT, which updates TAKE PROFIT on each candle, for example, if you pick "opposite band" as TAKE PROFIT, it'll update the TAKE PROFIT based on that, on every single new candle.
- Visual:
Bands shown will depend on the chosen indicator and it's settings.
ATR is only printed if used as STOP LOSS and/or TAKE PROFIT.
- Recommendations:
Recommended on DAILY timeframe , it works better with Keltner Channels rather than Bollinger Bands .
- Customization:
As you can see, almost everything is customizable, for colors and plotting styles check the "Style" tab.
Enjoy!
============
ESPAÑOL
============
- Descripción:
Esta estrategia se basa en los "rebotes" de precios en las Bandas de Bollinger / Canal de Keltner (la idea de que el precio rebote de una banda a otra).
La estrategia tiene varias opciones personalizables, lo que le permite refinar la estrategia para su activo y temporalidad favoritas.
Puedes personalizar la configuración de TODOS los indicadores, Bandas de Bollinger (periodo y desviación estándar), Canal de Keltner (periodo y multiplicador ATR) y ATR (periodo).
- INDICADORES DISPONIBLES:
Puedes elegir las Bandas de Bollinger o los Canales de Keltner para la estrategia, el indicador elegido será mostrado en pantalla.
- CONDICIONES PERSONALIZADAS PARA ENTRAR EN UNA POSICIÓN:
1. El precio rompe la banda (mínimo por debajo de la banda inferior para LONG o máximo por encima de la banda superior para SHORT).
2. Lo mismo que en el punto 1 pero ADEMÁS (en la siguiente vela) el precio cierra DENTRO de las bandas.
3. El precio rompe la banda Y CIERRA FUERA de la banda (banda inferior para LONG y banda superior para SHORT).
4. Igual que el 3 pero ADEMÁS (siguiente vela) el precio cierra DENTRO de las bandas.
- OPCIONES DE STOP LOSS:
1. Mecha anterior (mínimo de la vela anterior si es LONGy máximo de la vela anterior si es SHORT).
2. Banda extendida, puedes personalizar la configuración de un segundo indicador con valores más extensos para utilizarlo como STOP LOSS, por ejemplo, Bandas de Bollinger con 2 desviaciones estándar para abrir posiciones y 3 para STOP LOSS.
3. ATR: puedes elegir el average true ratio de una fuente (como el precio de cierre) con un multiplicador para calcular el STOP LOSS.
- OPCIONES DE TAKE PROFIT:
1. Banda opuesta (banda superior para LONGs, banda inferior para SHORTs).
2. Media móvil: media móvil simple de las Bandas de Bollinger o media móvil exponencial del Canal de Keltner .
3. ATR: se puede escoger el average true ratio de una fuente (como el precio de cierre) con un multiplicador para calcular el TAKE PROFIT.
- OTRAS OPCIONES:
Puedes elegir operar sólo con LONGs, sólo con SHORTs, ambos o ninguno (sólo el indicador).
Puedes activar el TAKE PROFIT DINÁMICO, que actualiza el TAKE PROFIT en cada vela, por ejemplo, si eliges "banda opuesta" como TAKE PROFIT, actualizará el TAKE PROFIT basado en eso, en cada nueva vela.
- Visual:
Las bandas mostradas dependerán del indicador elegido y de su configuración.
El ATR sólo se muestra si se utiliza como STOP LOSS y/o TAKE PROFIT.
- Recomendaciones:
Recomendada para temporalidad de DIARIO, funciona mejor con los Canales de Keltner que con las Bandas de Bollinger .
- Personalización:
Como puedes ver, casi todo es personalizable, para los colores y estilos de dibujo comprueba la pestaña "Estilo".
¡Que lo disfrutes!

Short Swing Bearish MACD Cross (By Coinrule)This strategy is oriented towards shorting during downside moves, whilst ensuring the asset is trading in a higher timeframe downtrend, and exiting after further downside.
This script can work well on coins you are planning to hodl for long-term and works especially well whilst using an automated bot that can execute your trades for you. It allows you to hedge your investment by allocating a % of your coins to trade with, whilst not risking your entire holding. This mitigates unrealised losses from hodling as it provides additional cash from the profits made. You can then choose to hodl this cash, or use it to reinvest when the market reaches attractive buying levels. Alternatively, you can use this when trading contracts on futures markets where there is no need to already own the underlying asset prior to shorting it.
ENTRY
This script utilises the MACD indicator accompanied by the Exponential Moving Average (EMA) 450 to enter trades. The MACD is a trend following momentum indicator and provides identification of short-term trend direction. In this variation it utilises the 11-period as the fast and 26-period as the slow length EMAs, with signal smoothing set at 9.
The EMA 450 is used as additional confirmation to prevent the script from shorting when price is above this long-term moving average. Once price is above the EMA 450 the script will not open any shorts - preventing the rule from attempting to short uptrends. Due to this, this strategy is ideal for setting and forgetting.
The script will enter trades based on two conditions:
1) When the MACD signals a bearish cross. This occurs when the EMA 11 crosses below the EMA 26 within the MACD signalling the start of a potential downtrend.
2) Price has closed below the EMA 450. Price closing below this long-term EMA signals that the asset is in a sustained downtrend. Price breaking above this could indicate a bullish strength in which shorting would not be profitable.
EXIT
This script utilises a set take-profit and stop-loss from the entry of the trade. The take profit is set at 8% and the stop loss of 4%, providing a risk reward ratio of 2. This indicates the script will be profitable if it has a win ratio greater than 33%.
Take-Profit Exit: -8% price decrease from entry price.
OR
Stop-Loss Exit: +4% price increase from entry price.
Based on backtesting results across a selection of assets, the 45-minute and 1-hour timeframes are the best for this strategy.
The strategy assumes each order is using 30% of the available coins to make the results more realistic and to simulate you only ran this strategy on 30% of your holdings. A trading fee of 0.1% is also taken into account and is aligned to the base fee applied on Binance.
The backtesting data was recorded from December 1st 2021, just as the market was beginning its downtrend. We therefore recommend analysing the market conditions prior to utilising this strategy as it operates best on weak coins during downtrends and bearish conditions, however the EMA 450 condition should mitigate entries during bullish market conditions.

Scalping Dips On Trend (by Coinrule)Coinrule's Community is an excellent source of inspiration for our trading strategies.
In these months of Bull Market, our traders opted mostly on buy-the-dips strategies, which resulted in great returns recently. But there has been an element that turned out to be the cause for deep division among the Community.
Is it advisable or not to use a stop-loss during a Bull Market?
This strategy comes with a large stop-loss to offer a safer alternative for those that are not used to trade with a downside protection.
Entry
The strategy buys only when the price is above the Moving Average 50 , making it less risky to buy the dip, which is set to 2%.
The preferred time frame is 1-hour.
The stop-loss is set to be quite loose to increase the chances of closing the trade in profit, yet protecting from unexpected larger drawdowns that could undermine the allocation's liquidity.
Exit
Stop loss: 10%
Take Profit: 3%
In times of Bull Market, such a trading system has a very high percentage of trades closed in profit (ranging between 70% to 80%), which makes it still overall profitable to have a stop-loss three times larger than the take profit.
Pro tip: use a larger stop-loss only when you expect to close in profit most of the trades!
The strategy assumes each order to trade 30% of the available capital and opens a trade at a time. A trading fee of 0.1% is taken into account.

Low volatility Buy w/ TP & SL (Coinrule)The compression of volatility usually leads to expansion. When the breakout comes, it can ignite strong trends. One way to catch a coin trading in an accumulation area is to spot three moving averages with values close to each other. The strategy uses a combination of Moving Averages to spot the best time to buy a coin before its breakout.
Buy Condition
The MA200 is greater than the MA100
The MA50 is greater than the MA100
According to backtesting results, the 1-hour time frame is the best to run this strategy.
Sell Condition
Take Profit: the price increases 8% from the entry price
Stop Loss: the price drops 4% from the entry price
The strategy has a profitability of 40-60% (depending on the market conditions). Having a ratio of two between Take profit and Stop Loss helps keeping the strategy profitable in the long term.

Stochastic Hash Strat [Hash Capital Research]# Stochastic Hash Strategy by Hash Capital Research
## 🎯 What Is This Strategy?
The **Stochastic Slow Strategy** is a momentum-based trading system that identifies oversold and overbought market conditions to capture mean-reversion opportunities. Think of it as a "buy low, sell high" approach with smart mathematical filters that remove emotion from your trading decisions.
Unlike fast-moving indicators that generate excessive noise, this strategy uses **smoothed stochastic oscillators** to identify only the highest-probability setups when momentum truly shifts.
---
## 💡 Why This Strategy Works
Most traders fail because they:
- **Chase prices** after big moves (buying high, selling low)
- **Overtrade** in choppy, directionless markets
- **Exit too early** or hold losses too long
This strategy solves all three problems:
1. **Entry Discipline**: Only trades when the stochastic oscillator crosses in extreme zones (oversold for longs, overbought for shorts)
2. **Cooldown Filter**: Prevents revenge trading by forcing a waiting period after each trade
3. **Fixed Risk/Reward**: Pre-defined stop-loss and take-profit levels ensure consistent risk management
**The Math Behind It**: The stochastic oscillator measures where the current price sits relative to its recent high-low range. When it's below 25, the market is oversold (time to buy). When above 70, it's overbought (time to sell). The crossover with its moving average confirms momentum is shifting.
---
## 📊 Best Markets & Timeframes
### ⭐ OPTIMAL PERFORMANCE:
**Crude Oil (WTI) - 12H Timeframe**
- **Why it works**: Oil markets have predictable volatility patterns and respect technical levels
**AAVE/USD - 4H to 12H Timeframe**
- **Why it works**: DeFi tokens exhibit strong momentum cycles with clear extremes
### ✅ Also Works Well On:
- **BTC/USD** (12H, Daily) - Lower frequency but high win rate
- **ETH/USD** (8H, 12H) - Balanced volatility and liquidity
- **Gold (XAU/USD)** (Daily) - Classic mean-reversion asset
- **EUR/USD** (4H, 8H) - Lower volatility, requires patience
### ❌ Avoid Using On:
- Timeframes below 4H (too much noise)
- Low-liquidity altcoins (wide spreads kill performance)
- Strongly trending markets without pullbacks (Bitcoin in 2021)
- News-driven instruments during major events
---
## 🎛️ Understanding The Settings
### Core Stochastic Parameters
**Stochastic Length (Default: 16)**
- Controls the lookback period for price comparison
- Lower = faster reactions, more signals (10-14 for volatile markets)
- Higher = smoother signals, fewer trades (16-21 for stable markets)
- **Pro tip**: Use 10 for crypto 4H, 16 for commodities 12H
**Overbought Level (Default: 70)**
- Threshold for short entries
- Lower values (65-70) = more trades, earlier entries
- Higher values (75-80) = fewer but higher-conviction trades
- **Sweet spot**: 70 works for most assets
**Oversold Level (Default: 25)**
- Threshold for long entries
- Higher values (25-30) = more trades, earlier entries
- Lower values (15-20) = fewer but stronger bounce setups
- **Sweet spot**: 20-25 depending on market conditions
**Smooth K & Smooth D (Default: 7 & 3)**
- Additional smoothing to filter out whipsaws
- K=7 makes the indicator slower and more reliable
- D=3 is the signal line that confirms the trend
- **Don't change these unless you know what you're doing**
---
### Risk Management
**Stop Loss % (Default: 2.2%)**
- Automatically exits losing trades
- Should be 1.5x to 2x your average market volatility
- Too tight = death by a thousand cuts
- Too wide = uncontrolled losses
- **Calibration**: Check ATR indicator and set SL slightly above it
**Take Profit % (Default: 7%)**
- Automatically exits winning trades
- Should be 2.5x to 3x your stop loss (reward-to-risk ratio)
- This default gives 7% / 2.2% = 3.18:1 R:R
- **The golden rule**: Never have R:R below 2:1
---
### Trade Filters
**Bar Cooldown Filter (Default: ON, 3 bars)**
- **What it does**: Forces you to wait X bars after closing a trade before entering a new one
- **Why it matters**: Prevents emotional revenge trading and overtrading in choppy markets
- **Settings guide**:
- 3 bars = Standard (good for most cases)
- 5-7 bars = Conservative (oil, slow-moving assets)
- 1-2 bars = Aggressive (only for experienced traders)
**Exit on Opposite Extreme (Default: ON)**
- Closes your long when stochastic hits overbought (and vice versa)
- Acts as an early profit-taking mechanism
- **Leave this ON** unless you're testing other exit strategies
**Divergence Filter (Default: OFF)**
- Looks for price/momentum divergences for additional confirmation
- **When to enable**: Trending markets where you want fewer but higher-quality trades
- **Keep OFF for**: Mean-reverting markets (oil, forex, most of the time)
---
## 🚀 Quick Start Guide
### Step 1: Set Up in TradingView
1. Open TradingView and navigate to your chart
2. Click "Pine Editor" at the bottom
3. Copy and paste the strategy code
4. Click "Add to Chart"
5. The strategy will appear in a separate pane below your price chart
### Step 2: Choose Your Market
**If you're trading Crude Oil:**
- Timeframe: 12H
- Keep all default settings
- Watch for signals during London/NY overlap (8am-11am EST)
**If you're trading AAVE or crypto:**
- Timeframe: 4H or 12H
- Consider these adjustments:
- Stochastic Length: 10-14 (faster)
- Oversold: 20 (more aggressive)
- Take Profit: 8-10% (higher targets)
### Step 3: Wait for Your First Signal
**LONG Entry** (Green circle appears):
- Stochastic crosses up below oversold level (25)
- Price likely near recent lows
- System places limit order at take profit and stop loss
**SHORT Entry** (Red circle appears):
- Stochastic crosses down above overbought level (70)
- Price likely near recent highs
- System places limit order at take profit and stop loss
**EXIT** (Orange circle):
- Position closes either at stop, target, or opposite extreme
- Cooldown period begins
### Step 4: Let It Run
The biggest mistake? **Interfering with the system.**
- Don't close trades early because you're scared
- Don't skip signals because you "have a feeling"
- Don't increase position size after a big win
- Don't revenge trade after a loss
**Follow the system or don't use it at all.**
---
### Important Risks:
1. **Drawdown Pain**: You WILL experience losing streaks of 5-7 trades. This is mathematically normal.
2. **Whipsaw Markets**: Choppy, range-bound conditions can trigger multiple small losses.
3. **Gap Risk**: Overnight gaps can cause your actual fill to be worse than the stop loss.
4. **Slippage**: Real execution prices differ from backtested prices (factor in 0.1-0.2% slippage).
---
## 🔧 Optimization Guide
### When to Adjust Settings:
**Market Volatility Increased?**
- Widen stop loss by 0.5-1%
- Increase take profit proportionally
- Consider increasing cooldown to 5-7 bars
**Getting Too Few Signals?**
- Decrease stochastic length to 10-12
- Increase oversold to 30, decrease overbought to 65
- Reduce cooldown to 2 bars
**Getting Too Many Losses?**
- Increase stochastic length to 18-21 (slower, smoother)
- Enable divergence filter
- Increase cooldown to 5+ bars
- Verify you're on the right timeframe
### A/B Testing Method:
1. **Run default settings for 50 trades** on your chosen market
2. Document: Win rate, profit factor, max drawdown, emotional tolerance
3. **Change ONE variable** (e.g., oversold from 25 to 20)
4. Run another 50 trades
5. Compare results
6. Keep the better version
**Never change multiple settings at once** or you won't know what worked.
---
## 📚 Educational Resources
### Key Concepts to Learn:
**Stochastic Oscillator**
- Developed by George Lane in the 1950s
- Measures momentum by comparing closing price to price range
- Formula: %K = (Close - Low) / (High - Low) × 100
- Similar to RSI but more sensitive to price movements
**Mean Reversion vs. Trend Following**
- This is a **mean reversion** strategy (price returns to average)
- Works best in ranging markets with defined support/resistance
- Fails in strong trending markets (2017 Bitcoin, 2020 Tech stocks)
- Complement with trend filters for better results
**Risk:Reward Ratio**
- The cornerstone of profitable trading
- Winning 40% of trades with 3:1 R:R = profitable
- Winning 60% of trades with 1:1 R:R = breakeven (after fees)
- **This strategy aims for 45% win rate with 2.5-3:1 R:R**
### Recommended Reading:
- *"Trading Systems and Methods"* by Perry Kaufman (Chapter on Oscillators)
- *"Mean Reversion Trading Systems"* by Howard Bandy
- *"The New Trading for a Living"* by Dr. Alexander Elder
---
## 🛠️ Troubleshooting
### "I'm not seeing any signals!"
**Check:**
- Is your timeframe 4H or higher?
- Is the stochastic actually reaching extreme levels (check if your asset is stuck in middle range)?
- Is cooldown still active from a previous trade?
- Are you on a low-liquidity pair?
**Solution**: Switch to a more volatile asset or lower the overbought/oversold thresholds.
---
### "The strategy keeps losing money!"
**Check:**
- What's your win rate? (Below 35% is concerning)
- What's your profit factor? (Below 0.8 means serious issues)
- Are you trading during major news events?
- Is the market in a strong trend?
**Solution**:
1. Verify you're using recommended markets/timeframes
2. Increase cooldown period to avoid choppy markets
3. Reduce position size to 5% while you diagnose
4. Consider switching to daily timeframe for less noise
---
### "My stop losses keep getting hit!"
**Check:**
- Is your stop loss tighter than the average ATR?
- Are you trading during high-volatility sessions?
- Is slippage eating into your buffer?
**Solution**:
1. Calculate the 14-period ATR
2. Set stop loss to 1.5x the ATR value
3. Avoid trading right after market open or major news
4. Factor in 0.2% slippage for crypto, 0.1% for oil
---
## 💪 Pro Tips from the Trenches
### Psychological Discipline
**The Three Deadly Sins:**
1. **Skipping signals** - "This one doesn't feel right"
2. **Early exits** - "I'll just take profit here to be safe"
3. **Revenge trading** - "I need to make back that loss NOW"
**The Solution:** Treat your strategy like a business system. Would McDonald's skip making fries because the cashier "doesn't feel like it today"? No. Systems work because of consistency.
---
### Position Management
**Scaling In/Out** (Advanced)
- Enter 50% position at signal
- Add 50% if stochastic reaches 10 (oversold) or 90 (overbought)
- Exit 50% at 1.5x take profit, let the rest run
**This is NOT for beginners.** Master the basic system first.
---
### Market Awareness
**Oil Traders:**
- OPEC meetings = volatility spikes (avoid or widen stops)
- US inventory reports (Wed 10:30am EST) = avoid trading 2 hours before/after
- Summer driving season = different patterns than winter
**Crypto Traders:**
- Monday-Tuesday = typically lower volatility (fewer signals)
- Thursday-Sunday = higher volatility (more signals)
- Avoid trading during exchange maintenance windows
---
## ⚖️ Legal Disclaimer
This trading strategy is provided for **educational purposes only**.
- Past performance does not guarantee future results
- Trading involves substantial risk of loss
- Only trade with capital you can afford to lose
- No one associated with this strategy is a licensed financial advisor
- You are solely responsible for your trading decisions
**By using this strategy, you acknowledge that you understand and accept these risks.**
---
## 🙏 Acknowledgments
Strategy development inspired by:
- George Lane's original Stochastic Oscillator work
- Modern quantitative trading research
- Community feedback from hundreds of backtests
Built with ❤️ for retail traders who want systematic, disciplined approaches to the markets.
---
**Good luck, stay disciplined, and trade the system, not your emotions.**

ParabolicSAR+EMA[TS_Indie]🚀 EMA + Parabolic SAR Reversal Trading Strategy
This trading system effectively combines the use of Exponential Moving Averages (EMA) with the Parabolic SAR to identify both price trends and key reversal points. The EMA Fast is used to signal the primary short-term trend, while the EMA Slow acts as a filter for the long-term trend direction. The Parabolic SAR then helps to confirm the reversal signals.
🛠️ Tools Used
1. EMA Fast – Primary Short-Term Trend
2. EMA Slow – Long-Term Trend Filter
3. Parabolic SAR – Reversal Confirmation
🎯 Entry Rules
📈 Buy Setup
1. Trend Filter: EMA Fast > EMA Slow → Uptrend
2. Pullback: Price pulls back and closes below the EMA Fast line.
3. Reversal: Price reverses/pulls back up and closes above the EMA Fast line.
4. SAR Confirmation: The previous Parabolic SAR dot is above the high, and the dot in the current candle is below the low → Reversal signal confirmed.
5. Entry: Enter Buy immediately.
📉 Sell Setup
1. Trend Filter: EMA Fast < EMA Slow → Downtrend
2. Pullback: Price pulls back and closes above the EMA Fast line.
3. Reversal: Price reverses/pulls back down and closes below the EMA Fast line.
4. SAR Confirmation: The previous Parabolic SAR dot is below the low, and the dot in the current candle is above the high → Reversal signal confirmed.
5. Entry: Enter Sell immediately.
💰 Exit Management (Entry, Stop Loss, Take Profit)
1. Entry: Enter the order at the closing price of the signal candle.
2. Stop Loss (SL): Set the Stop Loss at the Parabolic SAR dot.
3. Take Profit (TP): Calculated from the Entry and Stop Loss points, multiplied by the Risk Reward Ratio.
⚙️ Optional Parameters
➭ Custom Risk/Reward Ratio for Take Profit.
➭ Option to add an ATR buffer to the Stop Loss.
➭ Adjustable EMA Fast period.
➭ Adjustable EMA Slow period.
➭ Adjustable Parabolic SAR parameters.
➭ Option to enable Long-only / Short-only positions.
➭ Customizable Backtest start and end date.
➭ Customizable trading session time.
🔔 Alert Function
Alerts display:
➭ Entry Price
➭ Stop Loss Price
➭ Take Profit Price
💡 This strategy allows for many parameter adjustments, such as the MA type, adding/subtracting from the Stop Loss using ATR, and selecting specific sessions for backtesting. If you find interesting or profitable results after adjusting the parameters, please share your comments with other traders!
⚠️ Disclaimer
This indicator is designed for educational and research purposes only. It does not guarantee profits and should not be considered financial advice. Trading in financial markets involves significant risk , including the potential loss of capital.

Risk & Position DashboardRisk & Position Dashboard
Overview
The Risk & Position Dashboard is a comprehensive trading tool designed to help traders calculate optimal position sizes, manage risk, and visualize potential profit/loss scenarios before entering trades. This indicator provides real-time calculations for position sizing based on account size, risk percentage, and stop-loss levels, while displaying multiple take-profit targets with customizable risk-reward ratios.
Key Features
Position Sizing & Risk Management:
Automatic position size calculation based on account size and risk percentage
Support for leveraged trading with maximum leverage limits
Fractional shares support for brokers that allow partial share trading
Real-time fee calculation including entry, stop-loss, and take-profit fees
Break-even price calculation including trading fees
Multi-Target Profit Management:
Support for up to 3 take-profit levels with individual portion allocations
Customizable risk-reward ratios for each take-profit target
Visual profit/loss zones displayed as colored boxes on the chart
Individual profit calculations for each take-profit level
Visual Dashboard:
Clean, customizable table display showing all key metrics
Configurable label positioning and styling options
Real-time tracking of whether stop-loss or take-profit levels have been reached
Color-coded visual zones for easy identification of risk and reward areas
Advanced Configuration:
Comprehensive input validation and error handling
Support for different chart timeframes and symbols
Customizable colors, fonts, and display options
Hide/show individual data fields for personalized dashboard views
How to Use
Set Account Parameters: Configure your account size, maximum risk percentage per trade, and trading fees in the "Account Settings" section.
Define Trade Setup: Use the "Entry" time picker to select your entry point on the chart, then input your entry price and stop-loss level.
Configure Take Profits: Set your desired risk-reward ratios and portion allocations for each take-profit level. The script supports 1-3 take-profit targets.
Analyze Results: The dashboard will automatically calculate and display position size, number of shares, potential profits/losses, fees, and break-even levels.
Visual Confirmation: Colored boxes on the chart show profit zones (green) and loss zones (red), with lines extending to current price levels.
Reset Entry and SL:
You can easily reset the entry and stop-loss by clicking the "Reset points..." button from the script's "More" menu.
This is useful if you want to quickly clear your current trade setup and start fresh without manually adjusting the points on the chart.
Calculations
The script performs sophisticated calculations including:
Position size based on risk amount and price difference between entry and stop-loss
Leverage requirements and position amount calculations
Fee-adjusted risk-reward ratios for realistic profit expectations
Break-even price including all trading costs
Individual profit calculations for partial position closures
Detailed Take-Profit Calculation Formula:
The take-profit prices are calculated using the following mathematical formula:
// Core variables:
// risk_amount = account_size * (risk_percentage / 100)
// total_risk_per_share = |entry_price - sl_price| + (entry_price * fee%) + (sl_price * fee%)
// shares = risk_amount / total_risk_per_share
// direction_factor = 1 for long positions, -1 for short positions
// Take-profit calculation:
net_win = total_risk_per_share * shares * RR_ratio
tp_price = (net_win + (direction_factor * entry_price * shares) + (entry_price * fee% * shares)) / (direction_factor * shares - fee% * shares)
Step-by-step example for a long position (based on screenshot):
Account Size: 2,000 USDT, Risk: 2% = 40 USDT
Entry: 102,062.9 USDT, Stop Loss: 102,178.4 USDT, Fee: 0.06%
Risk per share: |102,062.9 - 102,178.4| + (102,062.9 × 0.0006) + (102,178.4 × 0.0006) = 115.5 + 61.24 + 61.31 = 238.05 USDT
Shares: 40 ÷ 238.05 = 0.168 shares (rounded to 0.17 in display)
Position Size: 0.17 × 102,062.9 = 17,350.69 USDT
Position Amount (with 9x leverage): 17,350.69 ÷ 9 = 1,927.85 USDT
For 2:1 RR: Net win = 238.05 × 0.17 × 2 = 80.94 USDT
TP1 price = (80.94 + (1 × 102,062.9 × 0.17) + (102,062.9 × 0.0006 × 0.17)) ÷ (1 × 0.17 - 0.0006 × 0.17) = 101,464.7 USDT
For 3:1 RR: TP2 price = 101,226.7 USDT (following same formula with RR=3)
This ensures that after accounting for all fees, the actual risk-reward ratio matches the specified target ratio.
Risk Management Features
Maximum Trade Amount: Optional setting to limit position size regardless of account size
Leverage Limits: Built-in maximum leverage protection
Fee Integration: All calculations include realistic trading fees for accurate expectations
Validation: Automatic checking that take-profit portions sum to 100%
Historical Tracking: Visual indication when stop-loss or take-profit levels are reached (within last 5000 bars)
Understanding Max Trade Amount - Multiple Simultaneous Trades:
The "Max Trade Amount" feature is designed for traders who want to open multiple positions simultaneously while maintaining proper risk management. Here's how it works:
Key Concept:
- Risk percentage (2%) always applies to your full Account Size
- Max Trade Amount limits the capital allocated per individual trade
- This allows multiple trades with full risk on each trade
Example from Screenshot:
Account Size: 2,000 USDT
Max Trade Amount: 500 USDT
Risk per Trade: 2% × 2,000 = 40 USDT per trade
Stop Loss Distance: 0.11% from entry
Result: Position Size = 17,350.69 USDT with 35x leverage
Total Risk (including fees): 40.46 USDT
Multiple Trades Strategy:
With this setup, you can open:
Trade 1: 40 USDT risk, 495.73 USDT position amount (35x leverage)
Trade 2: 40 USDT risk, 495.73 USDT position amount (35x leverage)
Trade 3: 40 USDT risk, 495.73 USDT position amount (35x leverage)
Trade 4: 40 USDT risk, 495.73 USDT position amount (35x leverage)
Total Portfolio Exposure:
- 4 simultaneous trades = 4 × 495.73 = 1,982.92 USDT position amount
- Total risk exposure = 4 × 40 = 160 USDT (8% of account)

Luxy BIG beautiful Dynamic ORBThis is an advanced Opening Range Breakout (ORB) indicator that tracks price breakouts from the first 5, 15, 30, and 60 minutes of the trading session. It provides complete trade management including entry signals, stop-loss placement, take-profit targets, and position sizing calculations.
The ORB strategy is based on the concept that the opening range of a trading session often acts as support/resistance, and breakouts from this range tend to lead to significant moves.
What Makes This Different?
Most ORB indicators simply draw horizontal lines and leave you to figure out the rest. This indicator goes several steps further:
Multi-Stage Tracking
Instead of just one ORB timeframe, this tracks FOUR simultaneously (5min, 15min, 30min, 60min). Each stage builds on the previous one, giving you multiple trading opportunities throughout the session.
Active Trade Management
When a breakout occurs, the indicator automatically calculates and displays entry price, stop-loss, and multiple take-profit targets. These lines extend forward and update in real-time until the trade completes.
Cycle Detection
Unlike indicators that only show the first breakout, this tracks the complete cycle: Breakout → Retest → Re-breakout. You can see when price returns to test the ORB level after breaking out (potential re-entry).
Failed Breakout Warning
If price breaks out but quickly returns inside the range (within a few bars), the label changes to "FAILED BREAK" - warning you to exit or avoid the trade.
Position Sizing Calculator
Built-in risk management that tells you exactly how many shares to buy based on your account size and risk tolerance. No more guessing or manual calculations.
Advanced Filtering
Optional filters for volume confirmation, trend alignment, and Fair Value Gaps (FVG) to reduce false signals and improve win rate.
Core Features Explained
### 1. Multi-Stage ORB Levels
The indicator builds four separate Opening Range levels:
ORB 5 - First 5 minutes (fastest signals, most volatile)
ORB 15 - First 15 minutes (balanced, most popular)
ORB 30 - First 30 minutes (slower, more reliable)
ORB 60 - First 60 minutes (slowest, most confirmed)
Each level is drawn as a horizontal range on your chart. As time progresses, the ranges expand to include more price action. You can enable or disable any stage and assign custom colors to each.
How it works: During the opening minutes, the indicator tracks the highest high and lowest low. Once the time period completes, those levels become your ORB high and low for that stage.
### 2. Breakout Detection
When price closes outside the ORB range, a label appears:
BREAK UP (green label above price) - Price closed above ORB High
BREAK DOWN (red label below price) - Price closed below ORB Low
The label shows which ORB stage triggered (ORB5, ORB15, etc.) and the cycle number if tracking multiple breakouts.
Important: Signals appear on bar close only - no repainting. What you see is what you get.
### 3. Retest Detection
After price breaks out and moves away, if it returns to test the ORB level, a "RETEST" label appears (orange). This indicates:
The original breakout level is now acting as support/resistance
Potential re-entry opportunity if you missed the first breakout
Confirmation that the level is significant
The indicator requires price to move a minimum distance away before considering it a valid retest (configurable in settings).
### 4. Failed Breakout Detection
If price breaks out but returns inside the ORB range within a few bars (before the breakout is "committed"), the original label changes to "FAILED BREAK" in orange.
This warns you:
The breakout lacked conviction
Consider exiting if already in the trade
Wait for better setup
Committed Breakout: The indicator tracks how many bars price stays outside the range. Only after staying outside for the minimum number of bars does it become a committed breakout that can be retested.
### 5. TP/SL Lines (Trade Management)
When a breakout occurs, colored horizontal lines appear showing:
Entry Line (cyan for long, orange for short) - Your entry price (the ORB level)
Stop Loss Line (red) - Where to exit if trade goes against you
TP1, TP2, TP3 Lines (same color as entry) - Profit targets at 1R, 2R, 3R
These lines extend forward as new bars form, making it easy to track your trade. When a target is hit, the line turns green and the label shows a checkmark.
Lines freeze (stop updating) when:
Stop loss is hit
The final enabled take-profit is hit
End of trading session (optional setting)
### 6. Position Sizing Dashboard
The dashboard (bottom-left corner by default) shows real-time information:
Current ORB stage and range size
Breakout status (Inside Range / Break Up / Break Down)
Volume confirmation (if filter enabled)
Trend alignment (if filter enabled)
Entry and Stop Loss prices
All enabled Take Profit levels with percentages
Risk/Reward ratio
Position sizing: Max shares to buy and total risk amount
Position Sizing Example:
If your account is $25,000 and you risk 1% per trade ($250), and the distance from entry to stop loss is $0.50, the calculator shows you can buy 500 shares (250 / 0.50 = 500).
### 7. FVG Filter (Fair Value Gap)
Fair Value Gaps are price inefficiencies - gaps left by strong momentum where one candle's high doesn't overlap with a previous candle's low (or vice versa).
When enabled, this filter:
Detects bullish and bearish FVGs
Draws semi-transparent boxes around these gaps
Only allows breakout signals if there's an FVG near the breakout level
Why this helps: FVGs indicate institutional activity. Breakouts through FVGs tend to be stronger and more reliable.
Proximity setting: Controls how close the FVG must be to the ORB level. 2.0x means the breakout can be within 2 times the FVG size - a reasonable default.
### 8. Volume & Trend Filters
Volume Filter:
Requires current volume to be above average (customizable multiplier). High volume breakouts are more likely to sustain.
Set minimum multiplier (e.g., 1.5x = 50% above average)
Set "strong volume" multiplier (e.g., 2.5x) that bypasses other filters
Dashboard shows current volume ratio
Trend Filter:
Only shows breakouts aligned with a higher timeframe trend. Choose from:
VWAP - Price above/below volume-weighted average
EMA - Price above/below exponential moving average
SuperTrend - ATR-based trend indicator
Combined modes (VWAP+EMA, VWAP+SuperTrend) for stricter filtering
### 9. Pullback Filter (Advanced)
Purpose:
Waits for price to pull back slightly after initial breakout before confirming the signal.
This reduces false breakouts from immediate reversals.
How it works:
- After breakout is detected, indicator waits for a small pullback (default 2%)
- Once pullback occurs AND price breaks out again, signal is confirmed
- If no pullback within timeout period (5 bars), signal is issued anyway
Settings:
Enable Pullback Filter: Turn this filter on/off
Pullback %: How much price must pull back (2% is balanced)
Timeout (bars): Max bars to wait for pullback (5 is standard)
When to use:
- Choppy markets with many fake breakouts
- When you want higher quality signals
- Combine with Volume filter for maximum confirmation
Trade-off:
- Better signal quality
- May miss some valid fast moves
- Slight entry delay
How to Use This Indicator
### For Beginners - Simple Setup
Add the indicator to your chart (5-minute or 15-minute timeframe recommended)
Leave all default settings - they work well for most stocks
Watch for BREAK UP or BREAK DOWN labels to appear
Check the dashboard for entry, stop loss, and targets
Use the position sizing to determine how many shares to buy
Basic Trading Plan:
Wait for a clear breakout label
Enter at the ORB level (or next candle open if you're late)
Place stop loss where the red line indicates
Take profit at TP1 (50% of position) and TP2 (remaining 50%)
### For Advanced Traders - Customized Setup
Choose which ORB stages to track (you might only want ORB15 and ORB30)
Enable filters: Volume (stocks) or Trend (trending markets)
Enable FVG filter for institutional confirmation
Set "Track Cycles" mode to catch retests and re-breakouts
Customize stop loss method (ATR for volatile stocks, ORB% for stable ones)
Adjust risk per trade and account size for accurate position sizing
Advanced Strategy Example:
Enable ORB15 only (disable others for cleaner chart)
Turn on Volume filter at 1.5x with Strong at 2.5x
Enable Trend filter using VWAP
Set Signal Mode to "Track Cycles" with Max 3 cycles
Wait for aligned breakouts (Volume + Trend + Direction)
Enter on retest if you missed the initial break
### Timeframe Recommendations
5-minute chart: Scalping, very active trading, crypto
15-minute chart: Day trading, balanced approach (most popular)
30-minute chart: Swing entries, less screen time
60-minute chart: Position trading, longer holds
The indicator works on any intraday timeframe, but ORB is fundamentally a day trading strategy. Daily charts don't make sense for ORB.
DEFAULT CONFIGURATION
ON by Default:
• All 4 ORB stages (5/15/30/60)
• Breakout Detection
• Retest Labels
• All TP levels (1/1.5/2/3)
• TP/SL Lines (Detailed mode)
• Dashboard (Bottom Left, Dark theme)
• Position Size Calculator
OFF by Default (Optional Filters):
• FVG Filter
• Pullback Filter
• Volume Filter
• Trend Filter
• HTF Bias Check
• Alerts
Recommended for Beginners:
• Leave all defaults
• Session Mode: Auto-Detect
• Signal Mode: Track Cycles
• Stop Method: ATR
• Add Volume Filter if trading stocks
Recommended for Advanced:
• Enable ORB15 + ORB30 only (disable 5 & 60)
• Enable: Volume + Trend + FVG
• Signal Mode: Track Cycles, Max 3
• Stop Method: ATR or Safer
• Enable HTF Daily bias check
## Settings Guide
The settings are organized into logical groups. Here's what each section controls:
### ORB COLORS Section
Show Edge Labels: Display "ORB 5", "ORB 15" labels at the right edge of the levels
Background: Fill the area between ORB high/low with color
Transparency: How see-through the background is (95% is nearly invisible)
Enable ORB 5/15/30/60: Turn each stage on or off individually
Colors: Assign colors to each ORB stage for easy identification
### SESSION SETTINGS Section
Session Mode: Choose trading session (Auto-Detect works for most instruments)
Custom Session Hours: Define your own hours if needed (format: HHMM-HHMM)
Auto-Detect uses the instrument's natural hours (stocks use exchange hours, crypto uses 24/7).
### BREAKOUT DETECTION Section
Enable Breakout Detection: Master switch for signals
Show Retest Labels: Display retest signals
Label Size: Visual size for all labels (Small recommended)
Enable FVG Filter: Require Fair Value Gap confirmation
Show FVG Boxes: Display the gap boxes on chart
Signal Mode: "First Only" = one signal per direction per day, "Track Cycles" = multiple signals
Max Cycles: How many breakout-retest cycles to track (6 is balanced)
Breakout Buffer: Extra distance required beyond ORB level (0.1-0.2% recommended)
Min Distance for Retest: How far price must move away before retest is valid (2% recommended)
Min Bars Outside ORB: Bars price must stay outside for committed breakout (2 is balanced)
### TARGETS & RISK Section
Enable Targets & Stop-Loss: Calculate and show trade management
TP1/TP2/TP3 checkboxes: Select which profit targets to display
Stop Method: How to calculate stop loss placement
- ATR: Based on volatility (best for most cases)
- ORB %: Fixed % of ORB range
- Swing: Recent swing high/low
- Safer: Widest of all methods
ATR Length & Multiplier: Controls ATR stop distance (14 period, 1.5x is standard)
ORB Stop %: Percentage beyond ORB for stop (20% is balanced)
Swing Bars: Lookback period for swing high/low (3 is recent)
### TP/SL LINES Section
Show TP/SL Lines: Display horizontal lines on chart
Label Format: "Short" = minimal text, "Detailed" = shows prices
Freeze Lines at EOD: Stop extending lines at session close
### DASHBOARD Section
Show Info Panel: Display the metrics dashboard
Theme: Dark or Light colors
Position: Where to place dashboard on chart
Toggle rows: Show/hide specific information rows
Calculate Position Size: Enable the position sizing calculator
Risk Mode: Risk fixed $ amount or % of account
Account Size: Your total trading capital
Risk %: Percentage to risk per trade (0.5-1% recommended)
### VOLUME FILTER Section
Enable Volume Filter: Require volume confirmation
MA Length: Average period (20 is standard)
Min Volume: Required multiplier (1.5x = 50% above average)
Strong Volume: Multiplier that bypasses other filters (2.5x)
### TREND FILTER Section
Enable Trend Filter: Require trend alignment
Trend Mode: Method to determine trend (VWAP is simple and effective)
Custom EMA Length: If using EMA mode (50 for swing, 20 for day trading)
SuperTrend settings: Period and Multiplier if using SuperTrend mode
### HIGHER TIMEFRAME Section
Check Daily Trend: Display higher timeframe bias in dashboard
Timeframe: What TF to check (D = daily, recommended)
Method: Price vs MA (stable) or Candle Direction (reactive)
MA Period: EMA length for Price vs MA method (20 is balanced)
Min Strength %: Minimum strength threshold for HTF bias to be considered
- For "Price vs MA": Minimum distance (%) from moving average
- For "Candle Direction": Minimum candle body size (%)
- 0.5% is balanced - increase for stricter filtering
- Lower values = more signals, higher values = only strong trends
### ALERTS Section
Enable Alerts: Master switch (must be ON to use any alerts)
Breakout Alerts: Notify on ORB breakouts
Retest Alerts: Notify when price retests after breakout
Failed Break Alerts: Notify on failed breakouts
Stage Complete Alerts: Notify when each ORB stage finishes forming
After enabling desired alert types, click "Create Alert" button, select this indicator, choose "Any alert() function call".
## Tips & Best Practices
### General Trading Tips
ORB works best on liquid instruments (stocks with good volume, major crypto pairs)
First hour of the session is most important - that's when ORB is forming
Breakouts WITH the trend have higher success rates - use the trend filter
Failed breakouts are common - use the "Min Bars Outside" setting to filter weak moves
Not every day produces good ORB setups - be patient and selective
### Position Sizing Best Practices
Never risk more than 1-2% of your account on a single trade
Use the built-in calculator - don't guess your position size
Update your account size monthly as it grows
Smaller accounts: use $ Amount mode for simplicity
Larger accounts: use % of Account mode for scaling
### Take Profit Strategy
Most traders use: 50% at TP1, 50% at TP2
Aggressive: Hold through TP1 for TP2 or TP3
Conservative: Full exit at TP1 (1:1 risk/reward)
After TP1 hits, consider moving stop to breakeven
TP3 rarely hits - only on strong trending days
### Filter Combinations
Maximum Quality: Volume + Trend + FVG (fewest signals, highest quality)
Balanced: Volume + Trend (good quality, reasonable frequency)
Active Trading: No filters or Volume only (many signals, lower quality)
Trending Markets: Trend filter essential (indices, crypto)
Range-Bound: Volume + FVG (avoid trend filter)
### Common Mistakes to Avoid
Chasing breakouts - wait for the bar to close, don't FOMO into wicks
Ignoring the stop loss - always use it, move it manually if needed
Over-leveraging - the calculator shows MAX shares, you can buy less
Trading every signal - quality > quantity, use filters
Not tracking results - keep a journal to see what works for YOU
## Pros and Cons
### Advantages
Complete all-in-one solution - from signal to position sizing
Multiple timeframes tracked simultaneously
Visual clarity - easy to see what's happening
Cycle tracking catches opportunities others miss
Built-in risk management eliminates guesswork
Customizable filters for different trading styles
No repainting - what you see is locked in
Works across multiple markets (stocks, forex, crypto)
### Limitations
Intraday strategy only - doesn't work on daily charts
Requires active monitoring during first 1-2 hours of session
Not suitable for after-hours or extended sessions by default
Can produce many signals in choppy markets (use filters)
Dashboard can be overwhelming for complete beginners
Performance depends on market conditions (trends vs ranges)
Requires understanding of risk management concepts
### Best For
Day traders who can watch the first 1-2 hours of market open
Traders who want systematic entry/exit rules
Those learning proper position sizing and risk management
Active traders comfortable with multiple signals per day
Anyone trading liquid instruments with clear sessions
### Not Ideal For
Swing traders holding multi-day positions
Set-and-forget / passive investors
Traders who can't watch market open
Complete beginners unfamiliar with trading concepts
Low volume / illiquid instruments
## Frequently Asked Questions
Q: Why are no signals appearing?
A: Check that you're on an intraday timeframe (5min, 15min, etc.) and that the current time is within your session hours. Also verify that "Enable Breakout Detection" is ON and at least one ORB stage is enabled. If using filters, they might be blocking signals - try disabling them temporarily.
Q: What's the best ORB stage to use?
A: ORB15 (15 minutes) is most popular and balanced. ORB5 gives faster signals but more noise. ORB30 and ORB60 are slower but more reliable. Many traders use ORB15 + ORB30 together.
Q: Should I enable all the filters?
A: Start with no filters to see all signals. If too many false signals, add Volume filter first (stocks) or Trend filter (trending markets). FVG filter is most restrictive - use for maximum quality but fewer signals.
Q: How do I know which stop loss method to use?
A: ATR works for most cases - it adapts to volatility. Use ORB% if you want predictable stop placement. Swing is for respecting chart structure. Safer gives you the most room but largest risk.
Q: Can I use this for swing trading?
A: Not really - ORB is fundamentally an intraday strategy. The ranges reset each day. For swing trading, look at weekly support/resistance or moving averages instead.
Q: Why do TP/SL lines disappear sometimes?
A: Lines freeze (stop extending) when: stop loss is hit, the last enabled take-profit is hit, or end of session arrives (if "Freeze at EOD" is enabled). This is intentional - the trade is complete.
Q: What's the difference between "First Only" and "Track Cycles"?
A: "First Only" shows one breakout UP and one DOWN per day maximum - clean but might miss opportunities. "Track Cycles" shows breakout-retest-rebreak sequences - more signals but busier chart.
Q: Is position sizing accurate for options/forex?
A: The calculator is designed for shares (stocks). For options, ignore the share count and use the risk amount. For forex, you'll need to adapt the lot size calculation manually.
Q: How much capital do I need to use this?
A: The indicator works for any account size, but practical day trading typically requires $25,000 in the US due to Pattern Day Trader rules. Adjust the "Account Size" setting to match your capital.
Q: Can I backtest this strategy?
A: This is an indicator, not a strategy script, so it doesn't have built-in backtesting. You can visually review historical signals or code a strategy script using similar logic.
Q: Why does the dashboard show different entry price than the breakout label?
A: If you're looking at an old breakout, the ORB levels may have changed when the next stage completed. The dashboard always shows the CURRENT active range and trade setup.
Q: What's a good win rate to expect?
A: ORB strategies typically see 40-60% win rate depending on market conditions and filters used. The strategy relies on positive risk/reward ratios (2:1 or better) to be profitable even with moderate win rates.
Q: Does this work on crypto?
A: Yes, but crypto trades 24/7 so you need to define what "session start" means. Use Session Mode = Custom and set your preferred daily reset time (e.g., 0000-2359 UTC).
## Credits & Transparency
### Development
This indicator was developed with the assistance of AI technology to implement complex ORB trading logic.
The strategy concept, feature specifications, and trading logic were designed by the publisher. The implementation leverages modern development tools to ensure:
Clean, efficient, and maintainable code
Comprehensive error handling and input validation
Detailed documentation and user guidance
Performance optimization
### Trading Concepts
This indicator implements several public domain trading concepts:
Opening Range Breakout (ORB): Trading strategy popularized by Toby Crabel, Mark Fisher and many more talanted traders.
Fair Value Gap (FVG): Price imbalance concept from ICT methodology
SuperTrend: ATR-based trend indicator using public formula
Risk/Reward Ratio: Standard risk management principle
All mathematical formulas and technical concepts used are in the public domain.
### Pine Script
Uses standard TradingView built-in functions:
ta.ema(), ta.atr(), ta.vwap(), ta.highest(), ta.lowest(), request.security()
No external libraries or proprietary code from other authors.
## Disclaimer
This indicator is provided for educational and informational purposes only. It is not financial advice.
Trading involves substantial risk of loss and is not suitable for every investor. Past performance shown in examples is not indicative of future results.
The indicator provides signals and calculations, but trading decisions are solely your responsibility. Always:
Test strategies on paper before using real money
Never risk more than you can afford to lose
Understand that all trading involves risk
Consider seeking advice from a licensed financial advisor
The publisher makes no guarantees regarding accuracy, profitability, or performance. Use at your own risk.
---
Version: 3.0
Pine Script Version: v6
Last Updated: October 2024
For support, questions, or suggestions, please comment below or send a private message.
---
Happy trading, and remember: consistent risk management beats perfect entry timing every time.

Adaptive Trend 1m ### Overview
The "Adaptive Trend Impulse Parallel SL/TP 1m Realistic" strategy is a sophisticated trading system designed specifically for high-volatility markets like cryptocurrencies on 1-minute timeframes. It combines trend-following with momentum filters and adaptive parameters to dynamically adjust to market conditions, ensuring more reliable entries and risk management. This strategy uses SuperTrend for primary trend detection, enhanced by MACD, RSI, Bollinger Bands, and optional volume spikes. It incorporates parallel stop-loss (SL) and multiple take-profit (TP) levels based on ATR, with options for breakeven and trailing stops after the first TP. Optimized for realistic backtesting on short timeframes, it avoids over-optimization by adapting indicators to market speed and efficiency.
### Principles of Operation
The strategy operates on the principle of adaptive impulse trading, where entry signals are generated only when multiple conditions align to confirm a strong trend reversal or continuation:
1. **Trend Detection (SuperTrend)**: The core signal comes from an adaptive SuperTrend indicator. It calculates upper and lower bands using ATR (Average True Range) with dynamic periods and multipliers. A buy signal occurs when the price crosses above the lower band (from a downtrend), and a sell signal when it crosses below the upper band (from an uptrend). Adaptation is based on Rate of Change (ROC) to measure market speed, shortening periods in fast markets for quicker responses.
2. **Momentum and Trend Filters**:
- **MACD**: Uses adaptive fast and slow lengths. In "Trend Filter" mode (default when "Use MACD Cross" is false), it checks if the MACD line is above/below the signal for long/short. In cross mode, it requires a crossover/crossunder.
- **RSI**: Adaptive period RSI must be above 50 for longs and below 50 for shorts, confirming overbought/oversold conditions dynamically.
- **Bollinger Bands (BB)**: Depending on the mode ("Midline" by default), it requires the price to be above/below the BB midline for longs/shorts, or a breakout in "Breakout" mode. Deviation adapts to market efficiency.
- **Volume Spike Filter** (optional): Entries require volume to exceed an adaptive multiple of its SMA, signaling strong impulse.
3. **Volatility Filter**: Entries are only allowed if current ATR percentage exceeds a historical minimum (adaptive), preventing trades in low-volatility ranges.
4. **Risk Management (Parallel SL/TP)**:
- **Stop-Loss**: Set at an adaptive ATR multiple below/above entry for long/short.
- **Take-Profits**: Three levels at adaptive ATR multiples, with partial position closures (e.g., 51% at TP1, 25% at TP2, remainder at TP3).
- **Post-TP1 Features**: Optional breakeven moves SL to entry after TP1. Trailing SL uses BB midline as a dynamic trail.
- All levels are calculated per trade using the ATR at entry, making them "realistic" for 1m charts by widening SL and tightening initial TPs.
The strategy enters long on buy signals with all filters met, and short on sell signals. It uses pyramid margin (100% long/short) for full position sizing.
Adaptation is driven by:
- **Market Speed (normSpeed)**: Based on ROC, tightens multipliers in volatile periods.
- **Efficiency Ratio (ER)**: Measures trend strength, adjusting periods for trending vs. ranging markets.
This ensures the strategy "adapts" without manual tweaks, reducing false signals in varying conditions.
### Main Advantages
- **Adaptability**: Unlike static strategies, parameters dynamically adjust to market volatility and trend strength, improving performance across ranging and trending phases without over-optimization.
- **Realistic Risk Management for 1m**: Wider SL and tiered TPs prevent premature stops in noisy short-term charts, while partial profits lock in gains early. Breakeven/trailing options protect profits in extended moves.
- **Multi-Filter Confirmation**: Combines trend, momentum, and volume for high-probability entries, reducing whipsaws. The volatility filter avoids flat markets.
- **Debug Visualization**: Built-in plots for signals, levels, and component checks (when "Show Debug" is enabled) help users verify logic on charts.
- **Efficiency**: Low computational load, suitable for real-time trading on TradingView with alerts.
Backtesting shows robust results on volatile assets, with a focus on sustainable risk (e.g., SL at 3x ATR avoids excessive drawdowns).
### Uniqueness
What sets this strategy apart is its **fully adaptive framework** integrating multiple indicators with real-time market metrics (ROC for speed, ER for efficiency). Most trend strategies use fixed parameters, leading to poor adaptation; here, every key input (periods, multipliers, deviations) scales dynamically within bounds, creating a "self-tuning" system. The "parallel SL/TP with 1m realism" adds custom handling for micro-timeframes: tightened initial TPs for quick wins and adaptive min-ATR filter to skip low-vol bars. Unlike generic mashups, it justifies the combination—SuperTrend for trend, MACD/RSI/BB for impulse confirmation, volume for conviction—working synergistically to capture "trend impulses" while filtering noise. The post-TP1 breakeven/trailing tied to BB adds a unique profit-locking mechanism not common in open-source scripts.
### Recommended Settings
These settings are optimized and recommended for trading ASTER/USDT on Bybit, with 1-minute chart, x10 leverage, and cross margin mode. They provide a balanced risk-reward for this volatile pair:
- **Base Inputs**:
- Base ATR Period: 10
- Base SuperTrend ATR Multiplier: 2.5
- Base MACD Fast: 8
- Base MACD Slow: 17
- Base MACD Signal: 6
- Base RSI Period: 9
- Base Bollinger Period: 12
- Bollinger Deviation: 1.8
- Base Volume SMA Period: 19
- Base Volume Spike Multiplier: 1.8
- Adaptation Window: 54
- ROC Length: 10
- **TP/SL Settings**:
- Use Stop Loss: True
- Base SL Multiplier (ATR): 3
- Use Take Profits: True
- Base TP1 Multiplier (ATR): 5.5
- Base TP2 Multiplier (ATR): 10.5
- Base TP3 Multiplier (ATR): 19
- TP1 % Position: 51
- TP2 % Position: 25
- Breakeven after TP1: False
- Trailing SL after TP1: False
- Base Min ATR Filter: 0.001
- Use Volume Spike Filter: True
- BB Condition: Midline
- Use MACD Cross (false=Trend Filter): True
- Show Debug: True
For backtesting, use initial capital of 30 USD, base currency USDT, order size 100 USDT, pyramiding 1, commission 0.1%, slippage 0 ticks, long/short margin 0%.
Always backtest on your platform and use risk management—risk no more than 1-2% per trade. This is not financial advice; trade at your own risk.

🚀 Ultimate Trading Tool + Strat Method🚀 Ultimate Trading Tool + Strat Method - Complete Breakdown
Let me give you a comprehensive overview of this powerful indicator!
🎯 What This Indicator Does:
This is a professional-grade, all-in-one trading system that combines two proven methodologies:
1️⃣ Technical Analysis System (Original)
Advanced trend detection using multiple EMAs
Momentum analysis with MACD
RSI multi-timeframe analysis
Volume surge detection
Automated trendline drawing
2️⃣ Strat Method (Pattern Recognition)
Inside bars, outside bars, directional bars
Classic patterns: 2-2, 1-2-2
Advanced patterns: 3-1-2, 2-1-2, F2→3
Timeframe continuity filters
📊 How It Generates Signals:
Technical Analysis Signals (Green/Red Triangles):
Buy Signal Triggers When:
✅ Price above EMA 21 & 50 (uptrend)
✅ MACD histogram rising (momentum)
✅ RSI between 30-70 (not overbought/oversold)
✅ Volume surge above 20-period average
✅ Price breaks above resistance trendline
Scoring System:
Trend alignment: +1 point
Momentum: +1 point
RSI favorable: +1 point
Trendline breakout: +2 points
Minimum score required based on sensitivity setting
Strat Method Signals (Blue/Orange Labels):
Pattern Recognition:
2-2 Setup: Down bar → Up bar (or reverse)
1-2-2 Setup: Inside bar → Down bar → Up bar
3-1-2 Setup: Outside bar → Inside bar → Up bar
2-1-2 Setup: Down bar → Inside bar → Up bar
F2→3 Setup: Failed directional bar becomes outside bar
Confirmation Required:
Must break previous bar's high (buy) or low (sell)
Optional timeframe continuity (daily & weekly aligned)
💰 Risk Management Features:
Dynamic Stop Loss & Take Profit:
ATR-Based: Adapts to market volatility
Stop Loss: Entry - (ATR × 1.5) by default
Take Profit: Entry + (ATR × 3.0) by default
Risk:Reward: Customizable 1:2 to 1:5 ratios
Visual Risk Zones:
Colored boxes show risk/reward area
Dark, bold lines for easy identification
Clear entry, stop, and target levels
🎨 What You See On Screen:
Main Signals:
🟢 Green Triangle "BUY" - Technical analysis long signal
🔴 Red Triangle "SELL" - Technical analysis short signal
🎯 Blue Label "STRAT" - Strat method long signal
🎯 Orange Label "STRAT" - Strat method short signal
Trendlines:
Green lines - Support trendlines (bullish)
Red lines - Resistance trendlines (bearish)
Automatically drawn from pivot points
Extended forward to predict future levels
Stop/Target Levels:
Bold crosses at stop loss levels (red color)
Bold crosses at take profit levels (green color)
Line width = 3 for maximum visibility
Trade Zones:
Light green boxes - Long trade risk/reward zone
Light red boxes - Short trade risk/reward zone
Shows potential profit vs risk visually
📊 Information Dashboard (Top Right):
Shows real-time market conditions:
Main Signal: Current technical signal status
Strat Method: Active Strat pattern
Trend: Bullish/Bearish/Neutral
Momentum: Strong/Weak based on MACD
Volume: High/Normal compared to average
TF Continuity: Daily/Weekly alignment
RSI: Current RSI value with color coding
Support/Resistance: Current trendline levels
🔔 Alert System:
Entry Alerts:
Technical Signals:
🚀 BUY SIGNAL TRIGGERED!
Type: Technical Analysis
Entry: 45.23
Stop: 43.87
Target: 48.95
```
**Strat Signals:**
```
🎯 STRAT BUY TRIGGER!
Pattern: 3-1-2
Entry: 45.23
Trigger Level: 44.56
Exit Alerts:
Target hit notifications
Stop loss hit warnings
Helps maintain discipline
⚙️ Customization Options:
Signal Settings:
Sensitivity: High/Medium/Low (controls how many signals)
Volume Filter: Require volume surge or not
Momentum Filter: Require momentum confirmation
Strat Settings:
TF Continuity: Require daily/weekly alignment
Pattern Selection: Enable/disable specific patterns
Confirmation Mode: Show only confirmed triggers
Risk Settings:
ATR Multiplier: Adjust stop/target distance
Risk:Reward: Set preferred ratio
Visual Elements: Show/hide any component
Visual Settings:
Colors: Customize all signal colors
Display Options: Toggle signals, levels, zones
Trendline Length: Adjust pivot detection period
🎯 Best Use Cases:
Day Trading:
Use low sensitivity setting
Enable all Strat patterns
Watch for high volume signals
Quick in/out trades
Swing Trading:
Use medium sensitivity
Require timeframe continuity
Focus on trendline breakouts
Hold for target levels
Position Trading:
Use high sensitivity (fewer signals)
Require strong momentum
Focus on weekly/daily alignment
Larger ATR multipliers
💡 Trading Strategy Tips:
High-Probability Setups:
Double Confirmation: Technical + Strat signal together
Trend Alignment: All timeframes agree
Volume Surge: Institutional participation
Trendline Break: Clear level breakout
Risk Management:
Always use stops - System provides them
Position sizing - Risk 1-2% per trade
Don't chase - Wait for signal confirmation
Take profits - System provides targets
What Makes Signals Strong:
✅ Both technical AND Strat signals fire together
✅ Timeframe continuity (daily & weekly aligned)
✅ Volume surge confirms institutional interest
✅ Multiple indicators align (trend + momentum + RSI)
✅ Clean trendline breakout with no resistance above (or support below)
⚠️ Common Mistakes to Avoid:
Don't ignore stops - System calculates them for a reason
Don't overtrade - Wait for quality setups
Don't disable volume filter - Unless you know what you're doing
Don't use max sensitivity - You'll get too many signals
Don't ignore timeframe continuity - It filters bad trades
🚀 Why This Indicator is Powerful:
Combines Multiple Edge Sources:
Technical analysis (trend, momentum, volume)
Pattern recognition (Strat method)
Risk management (dynamic stops/targets)
Market structure (trendlines, support/resistance)
Professional Features:
No repainting - signals are final when bar closes
Clear risk/reward before entry
Multiple confirmation layers
Adaptable to any market or timeframe
Beginner Friendly:
Clear visual signals
Automatic calculations
Built-in risk management
Comprehensive dashboard
This indicator essentially gives you everything a professional trader uses - trend analysis, momentum, patterns, volume, risk management - all in one clean package!
Any specific aspect you'd like me to explain in more detail? 🎯RetryClaude can make mistakes. Please double-check responses. Sonnet 4.5

Pump-Smart Shorting StrategyThis strategy is built to keep your portfolio hedged as much as possible while maximizing profitability. Shorts are opened after pumps cool off and on new highs (when safe), and closed quickly during strong upward moves or if stop loss/profit targets are hit. It uses visual overlays to clearly show when hedging is on, off, or blocked due to momentum, ensuring you’re protected in most market conditions but never short against the pump. Fast re-entry keeps the hedge active with minimal downtime.
Pump Detection:
RSI (Relative Strength Index): Calculated over a custom period (default 14 bars). If RSI rises above a threshold (default 70), the strategy considers the market to be in a pump (strong upward momentum).
Volume Spike: The current volume is compared to a 20-bar simple moving average of volume. If it exceeds the average by 1.5× and price increases at least 5% in one bar, pump conditions are triggered.
Price Jump: Measured by (close - close ) / close . A single-bar change > 5% helps confirm rapid momentum.
Pump Zone (No Short): If any of these conditions is true, an orange or red background is shown and shorts are blocked.
Cooldown and Re-Entry:
Cooldown Detection: After the pump ends, RSI must fall below a set value (default ≤ 60), and either volume returns towards average or price momentum is less than half the original spike (oneBarUp <= pctUp/2).
barsWait Parameter: You can specify a waiting period after cooldown before a short is allowed.
Short Entry After Pump/Cooldown: When these cooldown conditions are met, and no short is active, a blue background is shown and a short position is opened at the next signal.
New High Entry:
Lookback New High: If the current high is greater than the highest high in the last N bars (default 20), and pump is NOT active, a short can be opened.
Take Profit (TP) & Stop Loss (SL):
Take Profit: Short is closed if price falls to a threshold below the entry (minProfitPerc, default 2%).
Stop Loss: Short is closed if price rises to a threshold above the entry (stopLossPerc, default 6%).
Preemptive Exit:
Any time a pump is detected while a short position is open, the strategy closes the short immediately to avoid losses.
Visual Feedback:
Orange Background: Market is pumping, do not short.
Red Background: Other conditions block shorts (cooldown or waiting).
Blue Background: Shorts allowed.
Triangles/Circles: Mark entries, pump start/end, for clear trading signals.

GRG/RGR Signal, MA, Ranges and PivotsThis indicator is a combination of several indicators.
It is a combination of two of my indicators which I solely use for trading
1. EMA 10-20-50-200, Pivots and Previous Day/Week/Month range
2. 3/4-Bar GRG / RGR Pattern (Conditional 4th Candle)
You can use them individually if you already have some of them or just use this one. Belive me when I say, this is all you need, along with market structure knowlege and even if you don’t have that, this indicator has been doing wonders for me. This is all I use. I do not use anything else.
**Note - Do checkout the indicators individually as I have added valuable information in the comment section.
It contains the following,
1. 10 EMA/SMA - configurable
2. 20 EMA/SMA - configurable
3. 50 EMA/SMA - configurable
4. 200 EMA/SMA - configurable
5. Previous Day's Range - configurable
6. Previous Week's Range - configurable
7. Previous Month's Range - configurable
8. Pivots - configurable
9. Buy Sell Signal - configurable
The Moving Averages
It is a very important combination and using it correctly with price action will strengthen your entries and exits.
The ema's or sma's added are the most powerful ones and they do definitely act as support and resistance.
The Daily/Weekly/Monthly Ranges
The Daily/Weekly/Monthly ranges are extremely important for any trader and should be used for targets and reversals.
Pivots
Pivots can provide support and resistance level. R5 and S5 can be used to check for over stretched conditions. You can customise them however you like. It is a full pivot indicator.
It is defaulted to show R5 and S5 only to reduce noise in the chart but it can be customised.
The 3/4 RGR or GRG Signal Generator
Combined with a 3/4 RGR or GRG setup can be all a trader needs.
You don't need complex strategies and SMC concepts to trade. Simple EMAs, ranges and RGR/GRG setup is the most winning combination.
This indicator can be used to identify the Green-Red-Green or Red-Green-Red pattern.
It is a price action indicator where a price action which identifies the defeat of buyers and sellers.
If the buyers comprehensively defeat the sellers then the price moves up and if the sellers defeat the buyers then the price moves down.
In my trading experience this is what defines the price movement.
It is a 3 or 4 candle pattern, beyond that i.e, 5 or more candles could mean a very sideways market and unnecessary signal generation.
How does it work?
Upside/Green signal
1. Say candle 1 is Green, which means buyers stepped in, then candle 2 is Red or a Doji, that means sellers brought the price down. Then if candle 3 is forming to be Green and breaks the closing of the 1st candle and opening of the 2nd candle, then a green arrow will appear and that is the place where you want to take your trade.
2. Here the buyers defeated the sellers.
3. Sometimes candle 3 falls short but candle 4 breaks candle 1's closing and candle 2's opening price. We can enter on candle 4.
4. Important - We need to enter the trade as soon as the price moves above the candle 1 and 2's body and should not wait for the 3rd or 4th candle to close. Ignore wicks.
5. But for a more optimised entry I have added an option to use candle’s highs and lows instead of open and close. This reduces lot of noise and provides us with more precise entry. This setting is turned on by default.
6. I have restricted it to 4 candles and that is all that is needed. More than that is a longer sideways market.
7. I call it the +-+ or GRG pattern or Green-Red-Green or Buyer-Seller-Buyer or Seller defeated or just Buyer pattern.
8. Stop loss can be candle 2's mid for safe traders (that includes me) or candle 2's body low for risky traders.
9. Back testing suggests that body low will be useless and result in more points in loss because for the bigger move this point will not be touched, so why not get out faster.
Downside/Red signal
1. Say candle 1 is Red, which means sellers stepped in, then candle 2 is Green or a Doji, that means buyers took the price up. Then if candle 3 is forming to be Red and breaks the closing of the 1st candle and opening of the 2nd candle then a Red arrow will appear and that is the place where you want to take your trade.
2. Sometimes candle 3 falls short but candle 4 breaks candle 1's closing and candle 2's opening price. We can enter on candle 4.
3. We need to enter the trade as soon as the price moves below the candle 1 and 2's body and should not wait for the 3rd or 4th candle to close.
4. But for a more optimised entry I have added an option to use candle’s highs and lows instead of open and close. This reduces lot of noise and provides us with more precise entry. This setting is turned on by default.
5. I have restricted it to 4 candles and that is all that is needed. More than that is a longer sideways market.
6. I call it the -+- or RGR pattern or Red-Green-Red or Seller-Buyer-Seller or Buyer defeated or just Seller pattern.
7. Stop loss can be candle 2's mid for safe traders ( that includes me) or candle 2's body high for risky traders.
8. Back testing suggests that body high will be useless and result in more points in loss because for the bigger move this point will not be touched, so why not get out faster.
Combining Indicators and Signal
Combining these indicators with GRG/RGR signal can be very powerful and can provide big moves.
1. MA crossover and Signal - This is very powerful and provides a very big move. Trades can be held for longer. If after taking the trade we notice that the MA crossover has happened then trades can be held for higher targets.
2. Pivots and Signal - Pivots and add a support or resistance point. Take profits on these points. R5/S5 are over streched conditions so we can start looking for reversal signals and ignore other signals
3. Intraday Range - first 1, 5, 15 min of the day - Sideways days is when price will stay in these ranges. You can take profits at these ranges or if the range is broken and we get a signal, then it can mean that the direction will be sustained.
4. Previous Day/Week/Month Ranges - These can be used as Take Profit points if the price is moving towards them after getting the signal. If the range is broken and we get a signal then it can be a strong signal. They can also be used as reversal points if a strong signal is generated.
Important Settings
1. Include 4th Candle Confirmation - You can enable or disable the 4th candle signal to avoid the noise, but at times I have noticed that the 4th candle gives a very strong signal or I can say that the strong signal falls on the 4th candle. This is mostly a coincidence.
2. Bars to check (default 10) - You can also configure how many previous bars should the signal be generated for. 10 to 30 is good enough. To backtest increase it to 2000 or 5000 for example.
3. Use Candle High/Low for confirmation instead of Candle Open/Close - More optimized entry and noise reduction. This option is now defaulted to false.
4. Show Green-Red-Green (bull) signals - Show only bull entries. Useful when I have a predefined view i.e, I know market is going to go up today.
5. Show Red-Green-Red (bear) signals - Show only bear entries. Useful when I have a predefined view i.e, I know market is going to go down today.
6. 3rd candle should be a Strong candle before considering 4th candle - This will enforce additional logic in 4 candle setup that the 3rd candle is the candle in our direction of breakout. This means something like GRGG is mandatory, which is still the default behaviour. If disabled, the 3rd candle can be any candle and 4th candle will act as our breakout candle. This behaviour has led to breakouts and breakdowns as times, hence I added this as a separate feature. Vice-versa for a RGGR.
For a 4 candle setup till now we were expecting GRGG or RGRR but we can let the system ignore the 3rd candle completely if needed.
This will result in additional signals.
7. Three intraday ranges added for index and stock traders - 1 min, 5 min and 15 min ranges will be displayed. These are disabled by default except 15 min. These are very important ranges and in sideways days the price will usually move within the 15 min. A breakout of this range and a positive signal can be a very powerful setup.
Safe traders can avoid taking a trade in this range as it can lead to fakeouts.
The line style, width, color and opacity are configurable.
Pointers/Golden Rules
1. If after taking the trade, the next candle moves in your direction and closes strong bullish or bearish, then move SL to break even and after that you can trail it.
2. If a upside trade hits SL and immediately a down side trade signal is generated on the next candle then take it. Vice versa is true.
3. Trades need to be taken on previous 2 candle's body high or low combined and not the wicks.
4. The most losses a trader takes is on a sideways day and because in our strategy the stop loss is so small that even on a sideways day we'll get out with a little profit or worst break even.
5. Hold trades for longer targets and don't panic.
6. If last 3-4 days have been sideways then there is a good probability that today will be trending so we can hold our trade for longer targets. Inverse is true when the market has been trending for 2-3 days then volatility followed by sideways is coming (DOW theory). Target to hold the trade for whole day and not exit till the day closes.
7. In general avoid trading in the middle of the day for index and stocks. Divide the day into 3 parts and avoid the middle.
8. Use Support/Resistance, 10, 20, 50, 200 EMA/SMA, Gaps, Whole/Round numbers(very imp) for identifying targets.
9. Trail your SL.
10. For indexes I would use 5 min and 15 min timeframe and at times 10 mins.
11. For commodities and crypto we can use higher timeframe as well. Look for signals during volatile time durations and avoid trading the whole day. Signal usually gives good targets on those times.
12. If a GRG or RGR pattern appears on a daily timeframe then this is our time to go big.
13. Minimum Risk to Reward should be 1:2 and for longer targets can be 1:4 to 1:10.
14. Trade with small lot size. Money management will happen automatically.
15. With small lot size and correct Risk-Reward we can be very profitable. Don't trade with big lot size.
16. Stay in the market for longer and collect points not money.
17. Very imp - Watch market and learn to generate a market view.
18. Very imp - Only 3 type of candles are needed in trading -
Strong Bullish (Big Green candle), Strong Bearish (Big Red candle),
Hammer (it is Strong Bullish), Inverse Hammer (it is Strong Bearish)
and Doji (indecision or confusion).
If on daily timeframe I see Strong Bullish candle previous day then I am biased to the upside the next day, if I see Strong Bearish candle the previous day then I am biased to the downside the next day, if I see Doji on the previous day then I am cautious the next day, if there are back to back Dojis forming in daily or weekly then I am preparing for big move so time to go big once I get the signal.
19. Most Important Candlestick pattern - Bullish and Bearish Engulfing
20. The only Chart patterns I need -
a) Falling Wedge/Channel Bullish Pattern Uptrend or Bull Flag - Buying - Forming over a couple days for intraday and forming over a couple of weeks for swing
b) Falling Wedge/Channel Bullish Pattern Downtrend or Falling Channel - Buying
c) Rising Wedge Bearish Pattern Uptrend or Rising Channel - Selling
d) Rising Wedge Bearish Pattern Downtrend or Bear flag - Selling
e) Head and Shoulder - Over a longer period not for intraday. In 15 min takes few days and for swing 1hr or 4h or daily can take few days
f) M and W pattern - Reversal Patterns - They form within the above 4 patterns, usually resulting in the break of trend line
21. How Gaps work -
a) Small Gap up in Uptrend - Market can fill the gap and reverse. The perception is that people are buying. If previous day candle was Strong Bullish then market view is up.
b) Big Gap up in Uptrend - Not news driven - Profit booking will come but may not fill the entire gap
c) Big Gap up in Uptrend - News driven, war related, tax, interest rate - Market can keep going up without stopping.
c) Flat opening in Uptrend - Big chance of market going up. If previous day candle was Strong Bullish then view is upwards, if it was Doji then still upwards.
d) Gap down in Uptrend - Market is surprised. After going down initially it can go up
e) Small Gap down in Downtrend - Market can fill the gap and keep moving down. If previous day candle was Strong Bearish then view is still down.
f) Flat opening in Downtrend - View is down, short today.
g) Big Gap down in Downtrend - Profit booking and foolish buying will come but market view is still down.
h) Gap down with News - Volatility, sideways then down.
i) Gap Up in Downtrend - Can move up - Price can move up during 2/3rd of the day and End of the day revert and close in red.
22. Go big on bearish days for option traders. Puts are better bought and Calls are better sold.
23. Cluster of green signals can lead to bigger move on the upside and vice versa for red signals.
24. Most of this is what I learned from successful traders (from the top 2%) only the indicator is mine.

BOCS Channel Scalper Strategy - Automated Mean Reversion System# BOCS Channel Scalper Strategy - Automated Mean Reversion System
## WHAT THIS STRATEGY DOES:
This is an automated mean reversion trading strategy that identifies consolidation channels through volatility analysis and executes scalp trades when price enters entry zones near channel boundaries. Unlike breakout strategies, this system assumes price will revert to the channel mean, taking profits as price bounces back from extremes. Position sizing is fully customizable with three methods: fixed contracts, percentage of equity, or fixed dollar amount. Stop losses are placed just outside channel boundaries with take profits calculated either as fixed points or as a percentage of channel range.
## KEY DIFFERENCE FROM ORIGINAL BOCS:
**This strategy is designed for traders seeking higher trade frequency.** The original BOCS indicator trades breakouts OUTSIDE channels, waiting for price to escape consolidation before entering. This scalper version trades mean reversion INSIDE channels, entering when price reaches channel extremes and betting on a bounce back to center. The result is significantly more trading opportunities:
- **Original BOCS**: 1-3 signals per channel (only on breakout)
- **Scalper Version**: 5-15+ signals per channel (every touch of entry zones)
- **Trade Style**: Mean reversion vs trend following
- **Hold Time**: Seconds to minutes vs minutes to hours
- **Best Markets**: Ranging/choppy conditions vs trending breakouts
This makes the scalper ideal for active day traders who want continuous opportunities within consolidation zones rather than waiting for breakout confirmation. However, increased trade frequency also means higher commission costs and requires tighter risk management.
## TECHNICAL METHODOLOGY:
### Price Normalization Process:
The strategy normalizes price data to create consistent volatility measurements across different instruments and price levels. It calculates the highest high and lowest low over a user-defined lookback period (default 100 bars). Current close price is normalized using: (close - lowest_low) / (highest_high - lowest_low), producing values between 0 and 1 for standardized volatility analysis.
### Volatility Detection:
A 14-period standard deviation is applied to the normalized price series to measure price deviation from the mean. Higher standard deviation values indicate volatility expansion; lower values indicate consolidation. The strategy uses ta.highestbars() and ta.lowestbars() to identify when volatility peaks and troughs occur over the detection period (default 14 bars).
### Channel Formation Logic:
When volatility crosses from a high level to a low level (ta.crossover(upper, lower)), a consolidation phase begins. The strategy tracks the highest and lowest prices during this period, which become the channel boundaries. Minimum duration of 10+ bars is required to filter out brief volatility spikes. Channels are rendered as box objects with defined upper and lower boundaries, with colored zones indicating entry areas.
### Entry Signal Generation:
The strategy uses immediate touch-based entry logic. Entry zones are defined as a percentage from channel edges (default 20%):
- **Long Entry Zone**: Bottom 20% of channel (bottomBound + channelRange × 0.2)
- **Short Entry Zone**: Top 20% of channel (topBound - channelRange × 0.2)
Long signals trigger when candle low touches or enters the long entry zone. Short signals trigger when candle high touches or enters the short entry zone. This captures mean reversion opportunities as price reaches channel extremes.
### Cooldown Filter:
An optional cooldown period (measured in bars) prevents signal spam by enforcing minimum spacing between consecutive signals. If cooldown is set to 3 bars, no new long signal will fire until 3 bars after the previous long signal. Long and short cooldowns are tracked independently, allowing both directions to signal within the same period.
### ATR Volatility Filter:
The strategy includes a multi-timeframe ATR filter to avoid trading during low-volatility conditions. Using request.security(), it fetches ATR values from a specified timeframe (e.g., 1-minute ATR while trading on 5-minute charts). The filter compares current ATR to a user-defined minimum threshold:
- If ATR ≥ threshold: Trading enabled
- If ATR < threshold: No signals fire
This prevents entries during dead zones where mean reversion is unreliable due to insufficient price movement.
### Take Profit Calculation:
Two TP methods are available:
**Fixed Points Mode**:
- Long TP = Entry + (TP_Ticks × syminfo.mintick)
- Short TP = Entry - (TP_Ticks × syminfo.mintick)
**Channel Percentage Mode**:
- Long TP = Entry + (ChannelRange × TP_Percent)
- Short TP = Entry - (ChannelRange × TP_Percent)
Default 50% targets the channel midline, a natural mean reversion target. Larger percentages aim for opposite channel edge.
### Stop Loss Placement:
Stop losses are placed just outside the channel boundary by a user-defined tick offset:
- Long SL = ChannelBottom - (SL_Offset_Ticks × syminfo.mintick)
- Short SL = ChannelTop + (SL_Offset_Ticks × syminfo.mintick)
This logic assumes channel breaks invalidate the mean reversion thesis. If price breaks through, the range is no longer valid and position exits.
### Trade Execution Logic:
When entry conditions are met (price in zone, cooldown satisfied, ATR filter passed, no existing position):
1. Calculate entry price at zone boundary
2. Calculate TP and SL based on selected method
3. Execute strategy.entry() with calculated position size
4. Place strategy.exit() with TP limit and SL stop orders
5. Update info table with active trade details
The strategy enforces one position at a time by checking strategy.position_size == 0 before entry.
### Channel Breakout Management:
Channels are removed when price closes more than 10 ticks outside boundaries. This tolerance prevents premature channel deletion from minor breaks or wicks, allowing the mean reversion setup to persist through small boundary violations.
### Position Sizing System:
Three methods calculate position size:
**Fixed Contracts**:
- Uses exact contract quantity specified in settings
- Best for futures traders (e.g., "trade 2 NQ contracts")
**Percentage of Equity**:
- position_size = (strategy.equity × equity_pct / 100) / close
- Dynamically scales with account growth
**Cash Amount**:
- position_size = cash_amount / close
- Maintains consistent dollar exposure regardless of price
## INPUT PARAMETERS:
### Position Sizing:
- **Position Size Type**: Choose Fixed Contracts, % of Equity, or Cash Amount
- **Number of Contracts**: Fixed quantity per trade (1-1000)
- **% of Equity**: Percentage of account to allocate (1-100%)
- **Cash Amount**: Dollar value per position ($100+)
### Channel Settings:
- **Nested Channels**: Allow multiple overlapping channels vs single channel
- **Normalization Length**: Lookback for high/low calculation (1-500, default 100)
- **Box Detection Length**: Period for volatility detection (1-100, default 14)
### Scalping Settings:
- **Enable Long Scalps**: Toggle long entries on/off
- **Enable Short Scalps**: Toggle short entries on/off
- **Entry Zone % from Edge**: Size of entry zone (5-50%, default 20%)
- **SL Offset (Ticks)**: Distance beyond channel for stop (1+, default 5)
- **Cooldown Period (Bars)**: Minimum spacing between signals (0 = no cooldown)
### ATR Filter:
- **Enable ATR Filter**: Toggle volatility filter on/off
- **ATR Timeframe**: Source timeframe for ATR (1, 5, 15, 60 min, etc.)
- **ATR Length**: Smoothing period (1-100, default 14)
- **Min ATR Value**: Threshold for trade enablement (0.1+, default 10.0)
### Take Profit Settings:
- **TP Method**: Choose Fixed Points or % of Channel
- **TP Fixed (Ticks)**: Static distance in ticks (1+, default 30)
- **TP % of Channel**: Dynamic target as channel percentage (10-100%, default 50%)
### Appearance:
- **Show Entry Zones**: Toggle zone labels on channels
- **Show Info Table**: Display real-time strategy status
- **Table Position**: Corner placement (Top Left/Right, Bottom Left/Right)
- **Color Settings**: Customize long/short/TP/SL colors
## VISUAL INDICATORS:
- **Channel boxes** with semi-transparent fill showing consolidation zones
- **Colored entry zones** labeled "LONG ZONE ▲" and "SHORT ZONE ▼"
- **Entry signal arrows** below/above bars marking long/short entries
- **Active TP/SL lines** with emoji labels (⊕ Entry, 🎯 TP, 🛑 SL)
- **Info table** showing position status, channel state, last signal, entry/TP/SL prices, and ATR status
## HOW TO USE:
### For 1-3 Minute Scalping (NQ/ES):
- ATR Timeframe: "1" (1-minute)
- ATR Min Value: 10.0 (for NQ), adjust per instrument
- Entry Zone %: 20-25%
- TP Method: Fixed Points, 20-40 ticks
- SL Offset: 5-10 ticks
- Cooldown: 2-3 bars
- Position Size: 1-2 contracts
### For 5-15 Minute Day Trading:
- ATR Timeframe: "5" or match chart
- ATR Min Value: Adjust to instrument (test 8-15 for NQ)
- Entry Zone %: 20-30%
- TP Method: % of Channel, 40-60%
- SL Offset: 5-10 ticks
- Cooldown: 3-5 bars
- Position Size: Fixed contracts or 5-10% equity
### For 30-60 Minute Swing Scalping:
- ATR Timeframe: "15" or "30"
- ATR Min Value: Lower threshold for broader market
- Entry Zone %: 25-35%
- TP Method: % of Channel, 50-70%
- SL Offset: 10-15 ticks
- Cooldown: 5+ bars or disable
- Position Size: % of equity recommended
## BACKTEST CONSIDERATIONS:
- Strategy performs best in ranging, mean-reverting markets
- Strong trending markets produce more stop losses as price breaks channels
- ATR filter significantly reduces trade count but improves quality during low volatility
- Cooldown period trades signal quantity for signal quality
- Commission and slippage materially impact sub-5-minute timeframe performance
- Shorter timeframes require tighter entry zones (15-20%) to catch quick reversions
- % of Channel TP adapts better to varying channel sizes than fixed points
- Fixed contract sizing recommended for consistent risk per trade in futures
**Backtesting Parameters Used**: This strategy was developed and tested using realistic commission and slippage values to provide accurate performance expectations. Recommended settings: Commission of $1.40 per side (typical for NQ futures through discount brokers), slippage of 2 ticks to account for execution delays on fast-moving scalp entries. These values reflect real-world trading costs that active scalpers will encounter. Backtest results without proper cost simulation will significantly overstate profitability.
## COMPATIBLE MARKETS:
Works on any instrument with price data including stock indices (NQ, ES, YM, RTY), individual stocks, forex pairs (EUR/USD, GBP/USD), cryptocurrency (BTC, ETH), and commodities. Volume-based features require data feed with volume information but are optional for core functionality.
## KNOWN LIMITATIONS:
- Immediate touch entry can fire multiple times in choppy zones without adequate cooldown
- Channel deletion at 10-tick breaks may be too aggressive or lenient depending on instrument tick size
- ATR filter from lower timeframes requires higher-tier TradingView subscription (request.security limitation)
- Mean reversion logic fails in strong breakout scenarios leading to stop loss hits
- Position sizing via % of equity or cash amount calculates based on close price, may differ from actual fill price
- No partial closing capability - full position exits at TP or SL only
- Strategy does not account for gap openings or overnight holds
## RISK DISCLOSURE:
Trading involves substantial risk of loss. Past performance does not guarantee future results. This strategy is for educational purposes and backtesting only. Mean reversion strategies can experience extended drawdowns during trending markets. Stop losses may not fill at intended levels during extreme volatility or gaps. Thoroughly test on historical data and paper trade before risking real capital. Use appropriate position sizing and never risk more than you can afford to lose. Consider consulting a licensed financial advisor before making trading decisions. Automated trading systems can malfunction - monitor all live positions actively.
## ACKNOWLEDGMENT & CREDITS:
This strategy is built upon the channel detection methodology created by **AlgoAlpha** in the "Smart Money Breakout Channels" indicator. Full credit and appreciation to AlgoAlpha for pioneering the normalized volatility approach to identifying consolidation patterns. The core channel formation logic using normalized price standard deviation is AlgoAlpha's original contribution to the TradingView community.
Enhancements to the original concept include: mean reversion entry logic (vs breakout), immediate touch-based signals, multi-timeframe ATR volatility filtering, flexible position sizing (fixed/percentage/cash), cooldown period filtering, dual TP methods (fixed points vs channel percentage), automated strategy execution with exit management, and real-time position monitoring table.

Katz Calypso Indicator (Refactored)Overview
The Katz Calypso Indicator is a comprehensive momentum oscillator designed to identify potential entry and exit points in the market. At its core, it uses the True Strength Index (TSI) to gauge the strength and direction of a trend. To enhance signal accuracy and reduce false positives, the indicator integrates several optional filters, including the Waddah Attar Explosion, an EMA filter, and an ATR filter. It also provides an optional RVGI-based exit signal system.
This tool is designed to provide a clear, visual representation of market momentum, with customizable filters to adapt to various trading styles and market conditions.
How to Use the Indicator
The indicator is displayed in a separate pane below the main price chart.
TSI Line (Blue): This is the main oscillator line. Its position relative to the zero line indicates the overall trend bias (above 0 is bullish, below is bearish).
Signal Line (Red): A moving average of the TSI line. Crossovers between the TSI and Signal Line are the primary triggers for trade signals.
Zero Line: The centerline of the oscillator. A cross of the Zero Line can indicate a significant shift in momentum.
Overbought/Oversold Levels: These user-defined levels (defaulting to 65 and -65) help identify potential exhaustion points in a trend, which can be used for taking profits.
On-Chart Signals: The indicator plots shapes directly on the chart to make signals easy to spot:
Green Triangles (Up): Indicate long entry or continuation signals.
Red Triangles (Down): Indicate short entry or continuation signals.
Yellow Triangles: Suggest taking profits.
Maroon/Lime Triangles: Indicate an exit based on a signal cross (like RVGI or the Zero Line).
Trading Rules
Long Trade Rules
Entry: A long trade is signaled when ALL of the following conditions are met:
The blue TSI Line crosses above the red Signal Line.
The blue TSI Line is above the 0 Zero Line.
All enabled filters (Waddah Attar, EMA, ATR) confirm bullish conditions.
A green triangle labeled "Long" will appear below the price.
Exit (Take Profit): A take-profit signal for a long trade is generated when either of these occurs:
The TSI Line crosses below the Overbought level.
The TSI Line crosses back below the Signal Line while still above zero.
A yellow triangle labeled "TPL" (Take Profit Long) will appear above the price.
Exit (Stop/Reverse): A signal to exit a long trade is generated when either of these occurs:
The TSI Line crosses below the 0 Zero Line.
The RVGI Exit filter is enabled and generates a bearish crossover signal.
A maroon triangle labeled "Exit Long" will appear above the price.
Short Trade Rules
Entry: A short trade is signaled when ALL of the following conditions are met:
The blue TSI Line crosses below the red Signal Line.
The blue TSI Line is below the 0 Zero Line.
All enabled filters (Waddah Attar, EMA, ATR) confirm bearish conditions.
A red triangle labeled "Short" will appear above the price.
Exit (Take Profit): A take-profit signal for a short trade is generated when either of these occurs:
The TSI Line crosses above the Oversold level.
The TSI Line crosses back above the Signal Line while still below zero.
A yellow triangle labeled "TPS" (Take Profit Short) will appear below the price.
Exit (Stop/Reverse): A signal to exit a short trade is generated when either of these occurs:
The TSI Line crosses above the 0 Zero Line.
The RVGI Exit filter is enabled and generates a bullish crossover signal.
A lime green triangle labeled "Exit Short" will appear below the price.
Optional Filters
You can enable or disable these filters in the indicator's settings to fine-tune its sensitivity.
Waddah Attar Explosion Filter: This filter measures trend strength and volatility. When enabled, it ensures that entries are only taken during periods of strong, confirmed momentum, helping to avoid sideways or choppy markets.
EMA Price Filter: A classic trend filter. When enabled, it will only allow long entries if the price is above the specified Exponential Moving Average and short entries only if the price is below it.
ATR Filter: This acts as a volatility-based filter to prevent chasing a move. It helps ensure that you are not entering a long trade when the price has already moved too far above its EMA, or vice-versa for a short trade.
RVGI Exit Filter: The Relative Vigor Index (RVGI) is used here exclusively as an exit signal. When enabled, a crossover of the RVGI and its signal line can provide an earlier exit signal before the TSI crosses the zero line, potentially locking in profits sooner.
Disclaimer: This indicator is provided for educational and informational purposes only. It is not financial advice. Trading carries a high level of risk, and you can lose more than your initial investment. You should use this indicator at your own risk and discretion. Always conduct your own research and consider your risk tolerance before making any trading decisions.

ApicodeLibrary "Apicode"
percentToTicks(percent, from)
Converts a percentage of the average entry price or a specified price to ticks when the
strategy has an open position.
Parameters:
percent (float) : (series int/float) The percentage of the `from` price to express in ticks, e.g.,
a value of 50 represents 50% (half) of the price.
from (float) : (series int/float) Optional. The price from which to calculate a percentage and convert
to ticks. The default is `strategy.position_avg_price`.
Returns: (float) The number of ticks within the specified percentage of the `from` price if
the strategy has an open position. Otherwise, it returns `na`.
percentToPrice(percent, from)
Calculates the price value that is a specific percentage distance away from the average
entry price or a specified price when the strategy has an open position.
Parameters:
percent (float) : (series int/float) The percentage of the `from` price to use as the distance. If the value
is positive, the calculated price is above the `from` price. If negative, the result is
below the `from` price. For example, a value of 10 calculates the price 10% higher than
the `from` price.
from (float) : (series int/float) Optional. The price from which to calculate a percentage distance.
The default is `strategy.position_avg_price`.
Returns: (float) The price value at the specified `percentage` distance away from the `from` price
if the strategy has an open position. Otherwise, it returns `na`.
percentToCurrency(price, percent)
Parameters:
price (float) : (series int/float) The price from which to calculate the percentage.
percent (float) : (series int/float) The percentage of the `price` to calculate.
Returns: (float) The amount of the symbol's currency represented by the percentage of the specified
`price`.
percentProfit(exitPrice)
Calculates the expected profit/loss of the open position if it were to close at the
specified `exitPrice`, expressed as a percentage of the average entry price.
NOTE: This function may not return precise values for positions with multiple open trades
because it only uses the average entry price.
Parameters:
exitPrice (float) : (series int/float) The position's hypothetical closing price.
Returns: (float) The expected profit percentage from exiting the position at the `exitPrice`. If
there is no open position, it returns `na`.
priceToTicks(price)
Converts a price value to ticks.
Parameters:
price (float) : (series int/float) The price to convert.
Returns: (float) The value of the `price`, expressed in ticks.
ticksToPrice(ticks, from)
Calculates the price value at the specified number of ticks away from the average entry
price or a specified price when the strategy has an open position.
Parameters:
ticks (float) : (series int/float) The number of ticks away from the `from` price. If the value is positive,
the calculated price is above the `from` price. If negative, the result is below the `from`
price.
from (float) : (series int/float) Optional. The price to evaluate the tick distance from. The default is
`strategy.position_avg_price`.
Returns: (float) The price value at the specified number of ticks away from the `from` price if
the strategy has an open position. Otherwise, it returns `na`.
ticksToCurrency(ticks)
Converts a specified number of ticks to an amount of the symbol's currency.
Parameters:
ticks (float) : (series int/float) The number of ticks to convert.
Returns: (float) The amount of the symbol's currency represented by the tick distance.
ticksToStopLevel(ticks)
Calculates a stop-loss level using a specified tick distance from the position's average
entry price. A script can plot the returned value and use it as the `stop` argument in a
`strategy.exit()` call.
Parameters:
ticks (float) : (series int/float) The number of ticks from the position's average entry price to the
stop-loss level. If the position is long, the value represents the number of ticks *below*
the average entry price. If short, it represents the number of ticks *above* the price.
Returns: (float) The calculated stop-loss value for the open position. If there is no open position,
it returns `na`.
ticksToTpLevel(ticks)
Calculates a take-profit level using a specified tick distance from the position's average
entry price. A script can plot the returned value and use it as the `limit` argument in a
`strategy.exit()` call.
Parameters:
ticks (float) : (series int/float) The number of ticks from the position's average entry price to the
take-profit level. If the position is long, the value represents the number of ticks *above*
the average entry price. If short, it represents the number of ticks *below* the price.
Returns: (float) The calculated take-profit value for the open position. If there is no open
position, it returns `na`.
calcPositionSizeByStopLossTicks(stopLossTicks, riskPercent)
Calculates the entry quantity required to risk a specified percentage of the strategy's
current equity at a tick-based stop-loss level.
Parameters:
stopLossTicks (float) : (series int/float) The number of ticks in the stop-loss distance.
riskPercent (float) : (series int/float) The percentage of the strategy's equity to risk if a trade moves
`stopLossTicks` away from the entry price in the unfavorable direction.
Returns: (int) The number of contracts/shares/lots/units to use as the entry quantity to risk the
specified percentage of equity at the stop-loss level.
calcPositionSizeByStopLossPercent(stopLossPercent, riskPercent, entryPrice)
Calculates the entry quantity required to risk a specified percentage of the strategy's
current equity at a percent-based stop-loss level.
Parameters:
stopLossPercent (float) : (series int/float) The percentage of the `entryPrice` to use as the stop-loss distance.
riskPercent (float) : (series int/float) The percentage of the strategy's equity to risk if a trade moves
`stopLossPercent` of the `entryPrice` in the unfavorable direction.
entryPrice (float) : (series int/float) Optional. The entry price to use in the calculation. The default is
`close`.
Returns: (int) The number of contracts/shares/lots/units to use as the entry quantity to risk the
specified percentage of equity at the stop-loss level.
exitPercent(id, lossPercent, profitPercent, qty, qtyPercent, comment, alertMessage)
A wrapper for the `strategy.exit()` function designed for creating stop-loss and
take-profit orders at percentage distances away from the position's average entry price.
NOTE: This function calls `strategy.exit()` without a `from_entry` ID, so it creates exit
orders for *every* entry in an open position until the position closes. Therefore, using
this function when the strategy has a pyramiding value greater than 1 can lead to
unexpected results. See the "Exits for multiple entries" section of our User Manual's
"Strategies" page to learn more about this behavior.
Parameters:
id (string) : (series string) Optional. The identifier of the stop-loss/take-profit orders, which
corresponds to an exit ID in the strategy's trades after an order fills. The default is
`"Exit"`.
lossPercent (float) : (series int/float) The percentage of the position's average entry price to use as the
stop-loss distance. The function does not create a stop-loss order if the value is `na`.
profitPercent (float) : (series int/float) The percentage of the position's average entry price to use as the
take-profit distance. The function does not create a take-profit order if the value is `na`.
qty (float) : (series int/float) Optional. The number of contracts/lots/shares/units to close when an
exit order fills. If specified, the call uses this value instead of `qtyPercent` to
determine the order size. The exit orders reserve this quantity from the position, meaning
other orders from `strategy.exit()` cannot close this portion until the strategy fills or
cancels those orders. The default is `na`, which means the order size depends on the
`qtyPercent` value.
qtyPercent (float) : (series int/float) Optional. A value between 0 and 100 representing the percentage of the
open trade quantity to close when an exit order fills. The exit orders reserve this
percentage from the open trades, meaning other calls to this command cannot close this
portion until the strategy fills or cancels those orders. The percentage calculation
depends on the total size of the applicable open trades without considering the reserved
amount from other `strategy.exit()` calls. The call ignores this parameter if the `qty`
value is not `na`. The default is 100.
comment (string) : (series string) Optional. Additional notes on the filled order. If the value is specified
and not an empty "string", the Strategy Tester and the chart show this text for the order
instead of the specified `id`. The default is `na`.
alertMessage (string) : (series string) Optional. Custom text for the alert that fires when an order fills. If the
value is specified and not an empty "string", and the "Message" field of the "Create Alert"
dialog box contains the `{{strategy.order.alert_message}}` placeholder, the alert message
replaces the placeholder with this text. The default is `na`.
Returns: (void) The function does not return a usable value.
closeAllAtEndOfSession(comment, alertMessage)
A wrapper for the `strategy.close_all()` function designed to close all open trades with a
market order when the last bar in the current day's session closes. It uses the command's
`immediately` parameter to exit all trades at the last bar's `close` instead of the `open`
of the next session's first bar.
Parameters:
comment (string) : (series string) Optional. Additional notes on the filled order. If the value is specified
and not an empty "string", the Strategy Tester and the chart show this text for the order
instead of the automatically generated exit identifier. The default is `na`.
alertMessage (string) : (series string) Optional. Custom text for the alert that fires when an order fills. If the
value is specified and not an empty "string", and the "Message" field of the "Create Alert"
dialog box contains the `{{strategy.order.alert_message}}` placeholder, the alert message
replaces the placeholder with this text. The default is `na`.
Returns: (void) The function does not return a usable value.
closeAtEndOfSession(entryId, comment, alertMessage)
A wrapper for the `strategy.close()` function designed to close specific open trades with a
market order when the last bar in the current day's session closes. It uses the command's
`immediately` parameter to exit the trades at the last bar's `close` instead of the `open`
of the next session's first bar.
Parameters:
entryId (string)
comment (string) : (series string) Optional. Additional notes on the filled order. If the value is specified
and not an empty "string", the Strategy Tester and the chart show this text for the order
instead of the automatically generated exit identifier. The default is `na`.
alertMessage (string) : (series string) Optional. Custom text for the alert that fires when an order fills. If the
value is specified and not an empty "string", and the "Message" field of the "Create Alert"
dialog box contains the `{{strategy.order.alert_message}}` placeholder, the alert message
replaces the placeholder with this text. The default is `na`.
Returns: (void) The function does not return a usable value.
sortinoRatio(interestRate, forceCalc)
Calculates the Sortino ratio of the strategy based on realized monthly returns.
Parameters:
interestRate (simple float) : (simple int/float) Optional. The *annual* "risk-free" return percentage to compare against
strategy returns. The default is 2, meaning it uses an annual benchmark of 2%.
forceCalc (bool) : (series bool) Optional. A value of `true` forces the function to calculate the ratio on the
current bar. If the value is `false`, the function calculates the ratio only on the latest
available bar for efficiency. The default is `false`.
Returns: (float) The Sortino ratio, which estimates the strategy's excess return per unit of
downside volatility.
sharpeRatio(interestRate, forceCalc)
Calculates the Sharpe ratio of the strategy based on realized monthly returns.
Parameters:
interestRate (simple float) : (simple int/float) Optional. The *annual* "risk-free" return percentage to compare against
strategy returns. The default is 2, meaning it uses an annual benchmark of 2%.
forceCalc (bool) : (series bool) Optional. A value of `true` forces the function to calculate the ratio on the
current bar. If the value is `false`, the function calculates the ratio only on the latest
available bar for efficiency. The default is `false`.
Returns: (float) The Sortino ratio, which estimates the strategy's excess return per unit of
total volatility.

Hilly's Advanced Crypto Scalping Strategy - 5 Min ChartTo determine the "best" input parameters for the Advanced Crypto Scalping Strategy on a 5-minute chart, we need to consider the goals of optimizing for profitability, minimizing false signals, and adapting to the volatile nature of cryptocurrencies. The default parameters in the script are a starting point, but the optimal values depend on the specific cryptocurrency pair, market conditions, and your risk tolerance. Below, I'll provide recommended input values based on common practices in crypto scalping, along with reasoning for each parameter. I’ll also suggest how to fine-tune them using TradingView’s backtesting and optimization tools.
Recommended Input Parameters
These values are tailored for a 5-minute chart for liquid cryptocurrencies like BTC/USD or ETH/USD on exchanges like Binance or Coinbase. They aim to balance signal frequency and accuracy for day trading.
Fast EMA Length (emaFastLen): 9
Reasoning: A 9-period EMA is commonly used in scalping to capture short-term price movements while remaining sensitive to recent price action. It reacts faster than the default 10, aligning with the 5-minute timeframe.
Slow EMA Length (emaSlowLen): 21
Reasoning: A 21-period EMA provides a good balance for identifying the broader trend on a 5-minute chart. It’s slightly longer than the default 20 to reduce noise while confirming the trend direction.
RSI Length (rsiLen): 14
Reasoning: The default 14-period RSI is a standard choice for momentum analysis. It works well for detecting overbought/oversold conditions without being too sensitive on short timeframes.
RSI Overbought (rsiOverbought): 75
Reasoning: Raising the overbought threshold to 75 (from 70) reduces false sell signals in strong bullish trends, which are common in crypto markets.
RSI Oversold (rsiOversold): 25
Reasoning: Lowering the oversold threshold to 25 (from 30) filters out weaker buy signals, ensuring entries occur during stronger reversals.
MACD Fast Length (macdFast): 12
Reasoning: The default 12-period fast EMA for MACD is effective for capturing short-term momentum shifts in crypto, aligning with scalping goals.
MACD Slow Length (macdSlow): 26
Reasoning: The default 26-period slow EMA is a standard setting that works well for confirming momentum trends without lagging too much.
MACD Signal Smoothing (macdSignal): 9
Reasoning: The default 9-period signal line is widely used and provides a good balance for smoothing MACD crossovers on a 5-minute chart.
Bollinger Bands Length (bbLen): 20
Reasoning: The default 20-period Bollinger Bands are effective for identifying volatility breakouts, which are key for scalping in crypto markets.
Bollinger Bands Multiplier (bbMult): 2.0
Reasoning: A 2.0 multiplier is standard and captures most price action within the bands. Increasing it to 2.5 could reduce signals but improve accuracy in highly volatile markets.
Stop Loss % (slPerc): 0.8%
Reasoning: A tighter stop loss of 0.8% (from 1.0%) suits the high volatility of crypto, helping to limit losses on false breakouts while keeping risk manageable.
Take Profit % (tpPerc): 1.5%
Reasoning: A 1.5% take-profit target (from 2.0%) aligns with scalping’s goal of capturing small, frequent gains. Crypto markets often see quick reversals, so a smaller target increases the likelihood of hitting profits.
Use Candlestick Patterns (useCandlePatterns): True
Reasoning: Enabling candlestick patterns (e.g., engulfing, hammer) adds confirmation to signals, reducing false entries in choppy markets.
Use Volume Filter (useVolumeFilter): True
Reasoning: The volume filter ensures signals occur during high-volume breakouts, which are more likely to sustain in crypto markets.
Signal Arrow Size (signalSize): 2.0
Reasoning: Increasing the arrow size to 2.0 (from 1.5) makes buy/sell signals more visible on the chart, especially on smaller screens or volatile price action.
Background Highlight Transparency (bgTransparency): 85
Reasoning: A slightly higher transparency (85 from 80) keeps the background highlights subtle but visible, avoiding chart clutter.
How to Apply These Parameters
Copy the Script: Use the Pine Script provided in the previous response.
Paste in TradingView: Open TradingView, go to the Pine Editor, paste the code, and click "Add to Chart."
Set Parameters: In the strategy settings, manually input the recommended values above or adjust them via the input fields.
Test on a 5-Minute Chart: Apply the strategy to a liquid crypto pair (e.g., BTC/USDT, ETH/USDT) on a 5-minute chart.
Fine-Tuning for Optimal Performance
To find the absolute best parameters for your specific trading pair and market conditions, use TradingView’s Strategy Tester and optimization features:
Backtesting:
Run the strategy on historical data for your chosen pair (e.g., BTC/USDT on Binance).
Check metrics like Net Profit, Profit Factor, Win Rate, and Max Drawdown in the Strategy Tester.
Focus on a sample period of at least 1–3 months to capture various market conditions (bull, bear, sideways).
Parameter Optimization:
In the Strategy Tester, click the settings gear next to the strategy name.
Enable optimization for key inputs like emaFastLen (test range: 7–12), emaSlowLen (15–25), slPerc (0.5–1.5), and tpPerc (1.0–3.0).
Run the optimization to find the combination with the highest net profit or best Sharpe ratio, but avoid over-optimization (curve-fitting) by testing on out-of-sample data.
Market-Specific Adjustments:
Volatile Pairs (e.g., DOGE/USDT): Use tighter stop losses (e.g., 0.5–0.7%) and smaller take-profit targets (e.g., 1.0–1.2%) to account for rapid price swings.
Stable Pairs (e.g., BTC/USDT): Slightly wider stop losses (e.g., 1.0–1.2%) and take-profit targets (e.g., 1.8–2.5%) may work better.
Trending Markets: Increase emaSlowLen (e.g., to 25–30) to follow stronger trends.
Choppy Markets: Tighten bbMult (e.g., to 1.8) and lower rsiOverbought/rsiOversold (e.g., to 70/30) to filter noise.
Forward Testing:
After backtesting, run the strategy in real-time on a demo account for 1–2 weeks to validate performance under current market conditions.
Important Notes
No Universal "Best" Numbers: Optimal parameters vary by crypto pair, exchange, and market conditions (e.g., bull vs. bear market). The suggested values are a starting point based on common scalping practices.
Risk Management: Never risk more than 1–2% of your account per trade. Adjust position sizing in TradingView’s strategy settings to align with your risk tolerance.
Market Volatility: Crypto markets are highly volatile. Test the strategy on your specific pair and adjust parameters if signals are too frequent or too rare.
Not Financial Advice: This is an educational tool. Backtest thoroughly and use a demo account before trading with real funds.
If you want me to generate a chart showing backtest performance for specific parameters or to tweak the script further (e.g., adding more indicators or adjusting signal logic), let me know!can you add clear buy ans sell signs above the candles in this codeTo add clear buy and sell signals above the candles in the provided Pine Script, I'll modify the existing code to include prominent text labels directly above (for sell signals) and below (for buy signals) the candles. These labels will be larger, color-coded, and positioned to avoid clutter, ensuring they are easily visible on the chart. The core strategy logic (EMA, RSI, MACD, Bollinger Bands, candlestick patterns, and volume filter) will remain unchanged, and I'll reuse the same artifact_id since this is an update to the previous script.AdvancedCryptoScalpingStrategy.pinex-pine

Calculator - AOC📊 Calculator - AOC Indicator 🚀
The Calculator - AOC indicator is a powerful and user-friendly tool designed for TradingView to help traders plan and visualize trades with precision. It calculates key trade metrics, displays entry, take-profit (TP), stop-loss (SL), and liquidation levels, and provides a clear overview of risk management and potential profits. Perfect for both novice and experienced traders! 💡
✨ Features
📈 Trade Planning: Input your Entry Price, Take Profit (TP), Stop Loss (SL), and Trade Direction (Long/Short) to visualize your trade setup on the chart.
💰 Risk Management: Set your Initial Capital and Risk per Trade (%) to calculate the optimal Position Size and Risk Amount for each trade.
⚖️ Leverage Support: Define your Leverage to compute the Required Margin and Liquidation Price, ensuring you stay aware of potential risks.
📊 Risk/Reward Ratio: Automatically calculates the Risk-to-Reward Ratio to evaluate trade profitability.
🎨 Visuals: Displays Entry, TP, SL, and Liquidation levels as lines and boxes on the chart, with customizable Line Width, Line Style, and Label Size.
✅ Trade Validation: Checks if your trade setup is valid (e.g., correct TP/SL placement) and highlights issues like potential liquidation risks with color-coded statuses (Correct ✅, Incorrect ❌, or Liquidation ⚠️).
📋 Summary Table: A clean, top-right table summarizes key metrics: Capital, Risk %, Risk Amount, Position Size, Potential Profit, Risk/Reward, Margin, Liquidation Price, Trade Status, and % to TP/SL.
🖌️ Customization: Adjust Line Extension (Bars) for how far lines extend, and choose from Solid, Dashed, or Dotted line styles for a personalized chart experience.
🛠️ How to Use
Add to Chart: Apply the indicator to your TradingView chart.
Configure Inputs:
Accountability: Set your Initial Capital and Risk per Trade (%).
Target: Enter Entry Price, TP, and SL prices.
Leverage: Specify your leverage (e.g., 10x).
Direction: Choose Long or Short.
Display Settings: Customize Line Width, Line Style, Label Size, and Line Extension.
Analyze: The indicator plots Entry, TP, SL, and Liquidation levels on the chart and displays a table with all trade metrics.
Validate: Check the Trade Status in the table to ensure your setup is valid or if adjustments are needed.
🎯 Why Use It?
Plan Smarter: Visualize your trade setup and understand your risk/reward profile instantly.
Stay Disciplined: Precise position sizing and risk calculations help you stick to your trading plan.
Avoid Mistakes: Clear validation warnings prevent costly errors like incorrect TP/SL placement or liquidation risks.
User-Friendly: Intuitive visuals and a summary table make trade analysis quick and easy.
📝 Notes
Ensure Entry, TP, and SL prices align with your trade direction to avoid "Incorrect" or "Liquidation" statuses.
The indicator updates dynamically on the latest bar, ensuring real-time visuals.
Best used with proper risk management to maximize trading success! 💪
Happy trading! 🚀📈
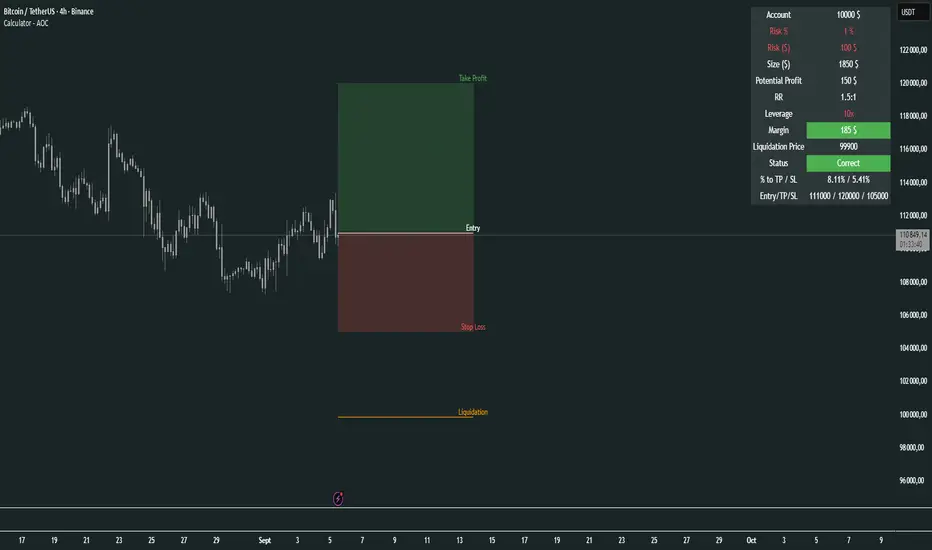
Crypto Perp Calc v1Advanced Perpetual Position Calculator for TradingView
Description
A comprehensive position sizing and risk management tool designed specifically for perpetual futures trading. This indicator eliminates the confusion of calculating leveraged positions by providing real-time position metrics directly on your chart.
Key Features:
Interactive Price Selection: Click directly on chart to set entry, stop loss, and take profit levels
Accurate Lot Size Calculation: Instantly calculates the exact position size needed for your margin and leverage
Multiple Entry Support: DCA into positions with up to 3 entry points with customizable allocation
Multiple Take Profit Levels: Scale out of positions with up to 3 TP targets
Comprehensive Risk Metrics: Shows dollar P&L, account risk percentage, and liquidation price
Visual Risk/Reward: Color-coded boxes and lines display your trade setup clearly
Real-time Info Table: All critical position data in one organized panel
Perfect for traders using perpetual futures who need precise position sizing with leverage.
---------
How to Use
Quick Start (3 Clicks)
1. Add the indicator to your chart
2. Click three times when prompted:
First click: Set your entry price
Second click: Set your stop loss
Third click: Set your take profit
3. Read the TOTAL LOTS value from the info table (highlighted in yellow)
4. Use this lot size in your exchange when placing the trade
Detailed Setup
Step 1: Configure Your Account
Enter your account balance (total USDT in account)
Set your margin amount (how much USDT to risk on this trade)
Choose your leverage (1x to 125x)
Select Long or Short position
Step 2: Set Price Levels
Main levels use interactive clicking (Entry, SL, TP)
For multiple entries or TPs, use the settings panel to manually input prices and percentages
Step 3: Read the Results
The info table shows:
TOTAL LOTS - The position size to enter on your exchange
Margin Used - Your actual capital at risk
Notional - Total position value (margin × leverage)
Max Risk - Dollar amount you'll lose at stop loss
Total Profit - Dollar amount you'll gain at take profit
R:R Ratio - Risk to reward ratio
Account Risk - Percentage of account at risk
Liquidation - Price where position gets liquidated
Step 4: Advanced Features (Optional)
Multiple Entries (DCA):
Enable "Use Multiple Entries"
Set up to 3 entry prices
Allocate percentage for each (must total 100%)
See individual lot sizes for each entry
Multiple Take Profits:
Enable "Use Multiple TPs"
Set up to 3 TP levels
Allocate percentage to close at each level (must total 100%)
View profit at each target
Visual Elements
Blue lines/labels: Entry points
Red lines/labels: Stop loss
Green lines/labels: Take profit targets
Colored boxes: Visual risk (red) and reward (green) zones
Info table: Can be positioned anywhere on screen
Alerts
Set price alerts for:
Entry zones reached
Stop loss approached
Take profit levels hit
Works with TradingView's alert system
Tips for Best Results
Always verify the lot size matches your intended risk
Check the liquidation price stays far from your stop loss
Monitor the account risk percentage (recommended: keep under 2-3%)
Use the warning indicators if risk exceeds margin
For quick trades, use single entry/TP; for complex strategies, use multiple levels
Example Workflow
Find your trade setup using your analysis
Add this indicator and click to set levels
Check risk metrics in the table
Copy the TOTAL LOTS value
Enter this exact position size on your exchange
Set alerts for key levels if desired
This tool bridges the gap between TradingView charting and exchange execution, ensuring your position sizing is always accurate when trading with leverage.
Disclaimer, this was coded with help of AI, double check calculations if they are off.

Game Theory Trading StrategyGame Theory Trading Strategy: Explanation and Working Logic
This Pine Script (version 5) code implements a trading strategy named "Game Theory Trading Strategy" in TradingView. Unlike the previous indicator, this is a full-fledged strategy with automated entry/exit rules, risk management, and backtesting capabilities. It uses Game Theory principles to analyze market behavior, focusing on herd behavior, institutional flows, liquidity traps, and Nash equilibrium to generate buy (long) and sell (short) signals. Below, I'll explain the strategy's purpose, working logic, key components, and usage tips in detail.
1. General Description
Purpose: The strategy identifies high-probability trading opportunities by combining Game Theory concepts (herd behavior, contrarian signals, Nash equilibrium) with technical analysis (RSI, volume, momentum). It aims to exploit market inefficiencies caused by retail herd behavior, institutional flows, and liquidity traps. The strategy is designed for automated trading with defined risk management (stop-loss/take-profit) and position sizing based on market conditions.
Key Features:
Herd Behavior Detection: Identifies retail panic buying/selling using RSI and volume spikes.
Liquidity Traps: Detects stop-loss hunting zones where price breaks recent highs/lows but reverses.
Institutional Flow Analysis: Tracks high-volume institutional activity via Accumulation/Distribution and volume spikes.
Nash Equilibrium: Uses statistical price bands to assess whether the market is in equilibrium or deviated (overbought/oversold).
Risk Management: Configurable stop-loss (SL) and take-profit (TP) percentages, dynamic position sizing based on Game Theory (minimax principle).
Visualization: Displays Nash bands, signals, background colors, and two tables (Game Theory status and backtest results).
Backtesting: Tracks performance metrics like win rate, profit factor, max drawdown, and Sharpe ratio.
Strategy Settings:
Initial capital: $10,000.
Pyramiding: Up to 3 positions.
Position size: 10% of equity (default_qty_value=10).
Configurable inputs for RSI, volume, liquidity, institutional flow, Nash equilibrium, and risk management.
Warning: This is a strategy, not just an indicator. It executes trades automatically in TradingView's Strategy Tester. Always backtest thoroughly and use proper risk management before live trading.
2. Working Logic (Step by Step)
The strategy processes each bar (candle) to generate signals, manage positions, and update performance metrics. Here's how it works:
a. Input Parameters
The inputs are grouped for clarity:
Herd Behavior (🐑):
RSI Period (14): For overbought/oversold detection.
Volume MA Period (20): To calculate average volume for spike detection.
Herd Threshold (2.0): Volume multiplier for detecting herd activity.
Liquidity Analysis (💧):
Liquidity Lookback (50): Bars to check for recent highs/lows.
Liquidity Sensitivity (1.5): Volume multiplier for trap detection.
Institutional Flow (🏦):
Institutional Volume Multiplier (2.5): For detecting large volume spikes.
Institutional MA Period (21): For Accumulation/Distribution smoothing.
Nash Equilibrium (⚖️):
Nash Period (100): For calculating price mean and standard deviation.
Nash Deviation (0.02): Multiplier for equilibrium bands.
Risk Management (🛡️):
Use Stop-Loss (true): Enables SL at 2% below/above entry price.
Use Take-Profit (true): Enables TP at 5% above/below entry price.
b. Herd Behavior Detection
RSI (14): Checks for extreme conditions:
Overbought: RSI > 70 (potential herd buying).
Oversold: RSI < 30 (potential herd selling).
Volume Spike: Volume > SMA(20) x 2.0 (herd_threshold).
Momentum: Price change over 10 bars (close - close ) compared to its SMA(20).
Herd Signals:
Herd Buying: RSI > 70 + volume spike + positive momentum = Retail buying frenzy (red background).
Herd Selling: RSI < 30 + volume spike + negative momentum = Retail selling panic (green background).
c. Liquidity Trap Detection
Recent Highs/Lows: Calculated over 50 bars (liquidity_lookback).
Psychological Levels: Nearest round numbers (e.g., $100, $110) as potential stop-loss zones.
Trap Conditions:
Up Trap: Price breaks recent high, closes below it, with a volume spike (volume > SMA x 1.5).
Down Trap: Price breaks recent low, closes above it, with a volume spike.
Visualization: Traps are marked with small red/green crosses above/below bars.
d. Institutional Flow Analysis
Volume Check: Volume > SMA(20) x 2.5 (inst_volume_mult) = Institutional activity.
Accumulation/Distribution (AD):
Formula: ((close - low) - (high - close)) / (high - low) * volume, cumulated over time.
Smoothed with SMA(21) (inst_ma_length).
Accumulation: AD > MA + high volume = Institutions buying.
Distribution: AD < MA + high volume = Institutions selling.
Smart Money Index: (close - open) / (high - low) * volume, smoothed with SMA(20). Positive = Smart money buying.
e. Nash Equilibrium
Calculation:
Price mean: SMA(100) (nash_period).
Standard deviation: stdev(100).
Upper Nash: Mean + StdDev x 0.02 (nash_deviation).
Lower Nash: Mean - StdDev x 0.02.
Conditions:
Near Equilibrium: Price between upper and lower Nash bands (stable market).
Above Nash: Price > upper band (overbought, sell potential).
Below Nash: Price < lower band (oversold, buy potential).
Visualization: Orange line (mean), red/green lines (upper/lower bands).
f. Game Theory Signals
The strategy generates three types of signals, combined into long/short triggers:
Contrarian Signals:
Buy: Herd selling + (accumulation or down trap) = Go against retail panic.
Sell: Herd buying + (distribution or up trap).
Momentum Signals:
Buy: Below Nash + positive smart money + no herd buying.
Sell: Above Nash + negative smart money + no herd selling.
Nash Reversion Signals:
Buy: Below Nash + rising close (close > close ) + volume > MA.
Sell: Above Nash + falling close + volume > MA.
Final Signals:
Long Signal: Contrarian buy OR momentum buy OR Nash reversion buy.
Short Signal: Contrarian sell OR momentum sell OR Nash reversion sell.
g. Position Management
Position Sizing (Minimax Principle):
Default: 1.0 (10% of equity).
In Nash equilibrium: Reduced to 0.5 (conservative).
During institutional volume: Increased to 1.5 (aggressive).
Entries:
Long: If long_signal is true and no existing long position (strategy.position_size <= 0).
Short: If short_signal is true and no existing short position (strategy.position_size >= 0).
Exits:
Stop-Loss: If use_sl=true, set at 2% below/above entry price.
Take-Profit: If use_tp=true, set at 5% above/below entry price.
Pyramiding: Up to 3 concurrent positions allowed.
h. Visualization
Nash Bands: Orange (mean), red (upper), green (lower).
Background Colors:
Herd buying: Red (90% transparency).
Herd selling: Green.
Institutional volume: Blue.
Signals:
Contrarian buy/sell: Green/red triangles below/above bars.
Liquidity traps: Red/green crosses above/below bars.
Tables:
Game Theory Table (Top-Right):
Herd Behavior: Buying frenzy, selling panic, or normal.
Institutional Flow: Accumulation, distribution, or neutral.
Nash Equilibrium: In equilibrium, above, or below.
Liquidity Status: Trap detected or safe.
Position Suggestion: Long (green), Short (red), or Wait (gray).
Backtest Table (Bottom-Right):
Total Trades: Number of closed trades.
Win Rate: Percentage of winning trades.
Net Profit/Loss: In USD, colored green/red.
Profit Factor: Gross profit / gross loss.
Max Drawdown: Peak-to-trough equity drop (%).
Win/Loss Trades: Number of winning/losing trades.
Risk/Reward Ratio: Simplified Sharpe ratio (returns / drawdown).
Avg Win/Loss Ratio: Average win per trade / average loss per trade.
Last Update: Current time.
i. Backtesting Metrics
Tracks:
Total trades, winning/losing trades.
Win rate (%).
Net profit ($).
Profit factor (gross profit / gross loss).
Max drawdown (%).
Simplified Sharpe ratio (returns / drawdown).
Average win/loss ratio.
Updates metrics on each closed trade.
Displays a label on the last bar with backtest period, total trades, win rate, and net profit.
j. Alerts
No explicit alertconditions defined, but you can add them for long_signal and short_signal (e.g., alertcondition(long_signal, "GT Long Entry", "Long Signal Detected!")).
Use TradingView's alert system with Strategy Tester outputs.
3. Usage Tips
Timeframe: Best for H1-D1 timeframes. Shorter frames (M1-M15) may produce noisy signals.
Settings:
Risk Management: Adjust sl_percent (e.g., 1% for volatile markets) and tp_percent (e.g., 3% for scalping).
Herd Threshold: Increase to 2.5 for stricter herd detection in choppy markets.
Liquidity Lookback: Reduce to 20 for faster markets (e.g., crypto).
Nash Period: Increase to 200 for longer-term analysis.
Backtesting:
Use TradingView's Strategy Tester to evaluate performance.
Check win rate (>50%), profit factor (>1.5), and max drawdown (<20%) for viability.
Test on different assets/timeframes to ensure robustness.
Live Trading:
Start with a demo account.
Combine with other indicators (e.g., EMAs, support/resistance) for confirmation.
Monitor liquidity traps and institutional flow for context.
Risk Management:
Always use SL/TP to limit losses.
Adjust position_size for risk tolerance (e.g., 5% of equity for conservative trading).
Avoid over-leveraging (pyramiding=3 can amplify risk).
Troubleshooting:
If no trades are executed, check signal conditions (e.g., lower herd_threshold or liquidity_sensitivity).
Ensure sufficient historical data for Nash and liquidity calculations.
If tables overlap, adjust position.top_right/bottom_right coordinates.
4. Key Differences from the Previous Indicator
Indicator vs. Strategy: The previous code was an indicator (VP + Game Theory Integrated Strategy) focused on visualization and alerts. This is a strategy with automated entries/exits and backtesting.
Volume Profile: Absent in this strategy, making it lighter but less focused on high-volume zones.
Wick Analysis: Not included here, unlike the previous indicator's heavy reliance on wick patterns.
Backtesting: This strategy includes detailed performance metrics and a backtest table, absent in the indicator.
Simpler Signals: Focuses on Game Theory signals (contrarian, momentum, Nash reversion) without the "Power/Ultra Power" hierarchy.
Risk Management: Explicit SL/TP and dynamic position sizing, not present in the indicator.
5. Conclusion
The "Game Theory Trading Strategy" is a sophisticated system leveraging herd behavior, institutional flows, liquidity traps, and Nash equilibrium to trade market inefficiencies. It’s designed for traders who understand Game Theory principles and want automated execution with robust risk management. However, it requires thorough backtesting and parameter optimization for specific markets (e.g., forex, crypto, stocks). The backtest table and visual aids make it easy to monitor performance, but always combine with other analysis tools and proper capital management.
If you need help with backtesting, adding alerts, or optimizing parameters, let me know!

Canuck Trading Trader StrategyCanuck Trading Trader Strategy
Overview
The Canuck Trading Trader Strategy is a high-performance, trend-following trading system designed for NASDAQ:TSLA on a 15-minute timeframe. Optimized for precision and profitability, this strategy leverages short-term price trends to capture consistent gains while maintaining robust risk management. Ideal for traders seeking an automated, data-driven approach to trading Tesla’s volatile market, it delivers strong returns with controlled drawdowns.
Key Features
Trend-Based Entries: Identifies short-term trends using a 2-candle lookback period and a minimum trend strength of 0.2%, ensuring responsive trade signals.
Risk Management: Includes a configurable 3.0% stop-loss to cap losses and a 2.0% take-profit to lock in gains, balancing risk and reward.
High Precision: Utilizes bar magnification for accurate backtesting, reflecting realistic trade execution with 1-tick slippage and 0.1 commission.
Clean Interface: No on-chart indicators, providing a distraction-free trading experience focused on performance.
Flexible Sizing: Allocates 10% of equity per trade with support for up to 2 simultaneous positions (pyramiding).
Performance Highlights
Backtested from March 1, 2024, to June 20, 2025, on NASDAQ:TSLA (15-minute timeframe) with $1,000,000 initial capital:
Net Profit: $2,279,888.08 (227.99%)
Win Rate: 52.94% (3,039 winning trades out of 5,741)
Profit Factor: 3.495
Max Drawdown: 2.20%
Average Winning Trade: $1,050.91 (0.55%)
Average Losing Trade: $338.20 (0.18%)
Sharpe Ratio: 2.468
Note: Past performance is not indicative of future results. Always validate with your own backtesting and forward testing.
Usage Instructions
Setup:
Apply the strategy to a NASDAQ:TSLA 15-minute chart.
Ensure your TradingView account supports bar magnification for accurate results.
Configuration:
Lookback Candles: Default is 2 (recommended).
Min Trend Strength: Set to 0.2% for optimal trade frequency.
Stop Loss: Default 3.0% to cap losses.
Take Profit: Default 2.0% to secure gains.
Order Size: 10% of equity per trade.
Pyramiding: Allows up to 2 orders.
Commission: Set to 0.1.
Slippage: Set to 1 tick.
Enable "Recalculate After Order is Filled" and "Recalculate on Every Tick" in backtest settings.
Backtesting:
Run backtests over March 1, 2024, to June 20, 2025, to verify performance.
Adjust stop-loss (e.g., 2.5%) or take-profit (e.g., 1–3%) to suit your risk tolerance.
Live Trading:
Use with a compatible broker or TradingView alerts for automated execution.
Monitor execution for slippage or latency, especially given the high trade frequency (5,741 trades).
Validate in a demo account before deploying with real capital.
Risk Disclosure
Trading involves significant risk and may result in losses exceeding your initial capital. The Canuck Trading Trader Strategy is provided for educational and informational purposes only. Users are responsible for their own trading decisions and should conduct thorough testing before using in live markets. The strategy’s high trade frequency requires reliable execution infrastructure to minimize slippage and latency.

Money Risk Management with Trade Tracking
Overview
The Money Risk Management with Trade Tracking indicator is a powerful tool designed for traders on TradingView to simplify trade simulation and risk management. Unlike the TradingView Strategy Tester, which can be complex for beginners, this indicator provides an intuitive, beginner-friendly interface to evaluate trading strategies in a realistic manner, mirroring real-world trading conditions.
Built on the foundation of open-source contributions from LuxAlgo and TCP, this indicator integrates external indicator signals, overlays take-profit (TP) and stop-loss (SL) levels, and provides detailed money management analytics. It empowers traders to visualize potential profits, losses, and risk-reward ratios, making it easier to understand the financial outcomes of their strategies.
Key Features
Signal Integration: Seamlessly integrates with external long and short signals from other indicators, allowing traders to overlay TP/SL levels based on their preferred strategies.
Realistic Trade Simulation: Simulates trades as they would occur in real-world scenarios, accounting for initial capital, risk percentage, leverage, and compounding effects.
Money Management Dashboard: Displays critical metrics such as current capital, unrealized P&L, risk amount, potential profit, risk-reward ratio, and trade status in a customizable, beginner-friendly table.
TP/SL Visualization: Plots TP and SL levels on the chart with customizable styles (solid, dashed, dotted) and colors, along with optional labels for clarity.
Performance Tracking: Tracks total trades, win/loss counts, win rate, and profit factor, providing a clear overview of strategy performance.
Liquidation Risk Alerts: Warns traders if stop-loss levels risk liquidation based on leverage settings, enhancing risk awareness.
Benefits for Traders
Beginner-Friendly: Simplifies the complexities of the TradingView Strategy Tester, offering an intuitive interface for new traders to simulate and evaluate trades without confusion.
Real-World Insights: Helps traders understand the actual profit or loss potential of their strategies by factoring in capital, risk, and leverage, bridging the gap between theoretical backtesting and real-world execution.
Enhanced Decision-Making: Provides clear, real-time analytics on risk-reward ratios, unrealized P&L, and trade performance, enabling informed trading decisions.
Customizable and Flexible: Allows customization of TP/SL settings, table positions, colors, and sizes, catering to individual trader preferences.
Risk Management Focus: Encourages disciplined trading by highlighting risk amounts, potential profits, and liquidation risks, fostering better financial planning.
Why This Indicator Stands Out
Many traders struggle to translate backtested strategy results into real-world outcomes due to the abstract nature of percentage-based profitability metrics. This indicator addresses that challenge by providing a practical, user-friendly tool that simulates trades with real-world parameters like capital, leverage, and compounding. Its open-source nature ensures accessibility, while its integration with other indicators makes it versatile for various trading styles.
How to Use
Add to TradingView: Copy the Pine Script code into TradingView’s Pine Editor and add it to your chart.
Configure Inputs: Set your initial capital, risk percentage, leverage, and TP/SL values in the indicator settings. Select external long/short signal sources if integrating with other indicators.
Monitor Dashboards: Use the Money Management and Target Dashboard tables to track trade performance and risk metrics in real time.
Analyze Results: Review win rates, profit factors, and P&L to refine your trading strategy.
Credits
This indicator builds upon the open-source contributions of LuxAlgo and TCP , whose efforts in sharing their code have made this tool possible. Their dedication to the trading community is deeply appreciated.
