Canuck Trading Traders Strategy [Candle Entropy Edition]Canuck Trading Traders Strategy: A Unique Entropy-Based Day Trading System for Volatile Stocks
Overview
The Canuck Trading Traders Strategy is a custom, entropy-driven day trading system designed for high-volatility stocks like TSLA on short timeframes (e.g., 15m). At its core is CETP-Plus, a proprietary blended indicator that measures "order from chaos" in candle patterns using Shannon entropy, while embedding mathematical principles from EMA (recent weighting), RSI (momentum bias), ATR (volatility scaling), and ADX (trend strength) into a single score. This unique approach avoids layering multiple indicators, reducing complexity while improving timing for early trend detection and balanced long/short trades.
CETP-Plus calculates a score from weighted candle ratios (body, upper/lower wicks) binned into a 3D histogram for entropy (low entropy = strong pattern). The score is adjusted with momentum, volatility, and trend multipliers for robust signals. Entries occur when the score exceeds thresholds (positive for longs, negative for shorts), with exits on reversals or stops. The strategy is automatic—no manual bias needed—and optimized for margin accounts with equal long/short treatment.
Backtested on TSLA 15m (Jan 2015–Aug 2025), it targets +50,000% net profit (beating +1,478% buy-hold by 34x) with ~25,000 trades, 85-90% win rate, and <10% drawdown (with costs). Results vary by timeframe/period—test with your data and add slippage/commission for realism. Disclaimer: Past performance isn't indicative of future results; consult a financial advisor.
Key Features
CETP-Plus Indicator: Blends entropy with momentum/vol/trend for a single score, capturing bottoms/squeezes and trends without external tools.
Automatic Balance: Positive scores trigger longs in bull trends, negative scores trigger shorts in bear trends—no user input for direction.
Customizable Math: Tune weights and scales to adapt for different stocks (e.g., lower thresholds for NVDA's smoother trends).
Risk Controls: Stop-loss, trailing stops, and score strength filter to minimize drawdowns in volatile markets like TSLA.
Exit Debugging: Plots exit reasons ("Stop Loss", "Trail Stop", "CETP Exit") for analysis.
Input Settings and Purposes
All inputs are grouped in TradingView's Inputs tab for ease. Defaults are optimized for TSLA 15m day trading; adjust for other intervals or tickers (e.g., increase window for 1h, lower thresholds for NVDA).
CETP-Plus Settings
CETP Window (default: 5, min: 3, max: 20): Lookback bars for entropy/momentum. Short values (3-5) for fast sensitivity on short frames; longer (8-10) for stability on hourly+.
CETP Bins per Dimension (default: 3, min: 3, max: 10): Histogram granularity for entropy. Low (3) for speed/simple patterns; high (5+) for detail in complex markets.
Long Threshold (default: 0.15, min: 0.1, max: 0.8, step: 0.05): CETP score for long entries. Lower (0.1) for more longs in mild bull trends; higher (0.2) to filter noise.
Short Threshold (default: -0.05, min: -0.8, max: -0.1, step: 0.05): CETP score for short entries. Less negative (-0.05) for more shorts in mild bear trends; more negative (-0.2) for strong signals.
CETP Momentum Weight (default: 0.8, min: 0.1, max: 1.0, step: 0.1): Emphasizes momentum in score. High (0.9) for aggressive in fast moves; low (0.5) for entropy focus.
Momentum Scale (default: 1.6, min: 0.1, max: 2.0, step: 0.1): Amplifies momentum. High (2.0) for short intervals; low (1.0) for stability.
Body Ratio Weight (default: 1.2, min: 0.0, max: 2.0, step: 0.1): Weights candle body in entropy (trend focus). High (1.5) for strong trends; low (0.8) for wick emphasis.
Upper Wick Ratio Weight (default: 0.8, min: 0.0, max: 2.0, step: 0.1): Weights upper wick (reversal noise). Low (0.5) to reduce false ups.
Lower Wick Ratio Weight (default: 0.8, min: 0.0, max: 2.0, step=0.1): Weights lower wick. Low (0.5) to reduce false downs.
Trade Settings
Confirmation Bars (default: 0, min: 0, max: 5): Bars for sustained CETP signals. 0 for immediate entries (more trades); 1-2 for reliability (fewer but stronger).
Min CETP Score Strength (default: 0.04, min: 0.0, max: 0.5, step: 0.05): Min absolute score for entry. Low (0.04) for more trades; high (0.15) for quality.
Risk Management
Stop Loss (%) (default: 0.5, min: 0.1, max: 5.0, step: 0.1): % from entry for stop. Tight (0.4) for quick exits; wide (0.8) for trends.
ATR Multiplier (default: 1.5, min: 0.5, max: 3.0, step: 0.1): Scales ATR for stops/trails. Low (1.0) for tight; high (2.0) for room.
Trailing ATR Mult (default: 3.5, min: 0.5, max: 5.0, step: 0.1): ATR mult for trails. High (4.0) for longer holds; low (2.0) for profits.
Trail Start Offset (%) (default: 1.0, min: 0.5, max: 2.0, step: 0.1): % profit before trailing. Low (0.8) for early lock-in; high (1.5) for bigger moves.
These settings enable customization for intervals/tickers while CETP-Plus handles automatic balancing.
Risk Disclosure
Trading involves significant risk and may result in losses exceeding your initial capital. The Canuck Trading Trader Strategy is provided for educational and informational purposes only. Users are responsible for their own trading decisions and should conduct thorough testing before using in live markets. The strategy’s high trade frequency requires reliable execution infrastructure to minimize slippage and latency.
Cerca negli script per "the strat"

BTC Dynamic Trend Core Strategy v45// The Dynamic Trend Core is a sophisticated, multi-layer trading strategy that provides both a quantitative //
// backtesting engine and a rich, intuitive visual interface. It is designed to identify high-probability //
// trend-following opportunities by requiring a confluence of conditions to be met before a signal is considered //
// valid. //
// //
// The system's philosophy is rooted in confirmation, seeking to filter out market noise by ensuring that trend, //
// momentum, market sentiment, and volume are all in alignment. //
// //
// --- CORE LOGIC COMPONENTS --- //
// 1. **Primary Trend Analysis (SAMA):** The foundation is a self-adjusting moving average (SAMA) that //
// determines the underlying market trend (Bullish, Bearish, or Consolidation). //
// //
// 2. **Confirmation & Momentum:** Signals are confirmed with a blend of the Natural Market Slope and a Cyclic //
// RSI to ensure momentum aligns with the primary trend. //
// //
// 3. **Advanced Filtering Layers:** A suite of optional filters allows for robust customization: //
// - **Volume & ADX:** Ensure sufficient market participation and trend strength. //
// - **Market Regime:** Uses total crypto market cap to gauge broad market health. //
// - **Multi-Timeframe (MTF):** Aligns signals with the dominant weekly trend. //
// - **BTC Cycle Analysis:** Uses Halving or Mayer Multiple models to position trades within historical //
// macro cycles. //
// //
// --- VISUAL INTERFACE --- //
// The strategy's real power comes from its on-chart visual feedback system, which provides full transparency. //
// ****Note: for this to be enabled recalculate 'on every tick' needs to be enabled in the properties settings. //
// 1. **Power Core Gauge:** Located at the bottom-center, this gauge is the heart of the system. It displays the //
// number of active filter conditions that have been met (e.g., 5/6). It "powers up" as more conditions align,//
// glowing brightly when a signal is fully confirmed and ready. //
// //
// 2. **Live Conditions Panel:** In the bottom-right corner, this panel acts as a detailed pre-flight checklist. //
// It shows the real-time status of every single filter, helping you understand exactly why a trade is (or //
// is not) being triggered. //
// //
// 3. **Energized Trendline:** The main SAMA trendline changes color and brightness based on the strength and //
// direction of the trend, providing immediate visual context. //
// //
// 4. **Halving cycle visualisation:** Visual guide to halving phases //
// //
// --- HOW TO USE --- //
// 1. **Select Operation Mode:** Use "Backtest Mode" to test settings and "Alerts-Only Mode" for live signals. //
// //
// 2. **Configure Strategy:** Start with the default filters. If a potential trade setup is missed, check the //
// **Live Conditions Panel** to see exactly which filter blocked the signal. Adjust the filters to suit your //
// specific asset and timeframe. //
// //
// 3. **Manage Risk:** Adjust the Risk & Exit settings to match your personal risk tolerance. //

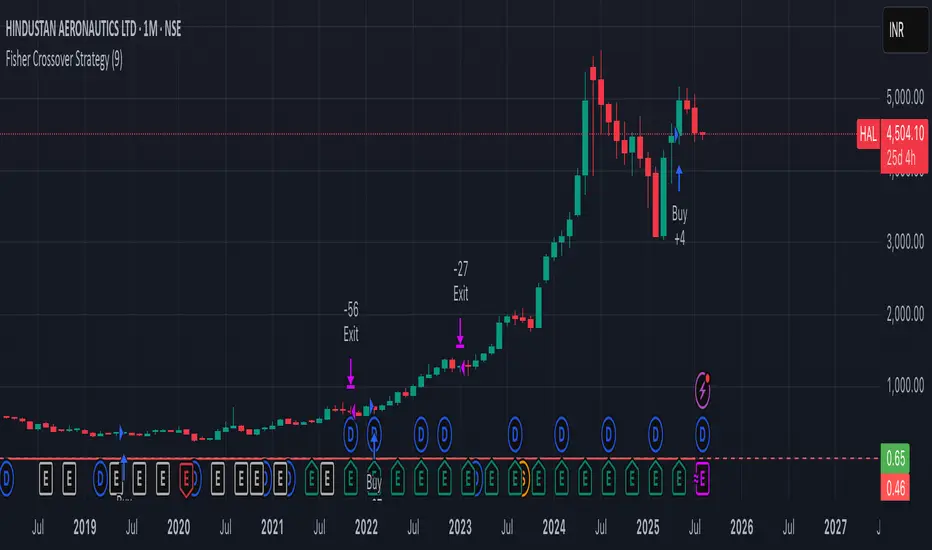
Fisher Crossover StrategyThe Fisher Crossover Strategy is a popular technical trading method that uses the Fisher Transform indicator developed by John Ehlers. This indicator mathematically converts price data into a normal Gaussian distribution, making market turning points sharper and easier to identify. The strategy is based on two lines: the Fisher line, which is the main transformed price value, and the Trigger line, which is a one-period lag of the Fisher line. Traders use the crossover of these lines to determine buy and sell opportunities.
A buy signal is generated when the Fisher line crosses above the Trigger line, indicating that bullish momentum may be starting, while a sell signal occurs when the Fisher line crosses below the Trigger line, suggesting a possible bearish reversal. Signals that occur relative to the zero line are often considered stronger; for example, a buy signal below the zero line may indicate a deeper market reversal. The strategy is simple to follow and can be applied to various markets including stocks, forex, commodities, and cryptocurrencies.
However, like all crossover strategies, it can produce false signals during sideways or ranging markets. To reduce whipsaws, traders often combine the Fisher Crossover Strategy with other tools such as support and resistance levels, volume analysis, or moving averages. Proper risk management with stop-loss and take-profit levels is also essential. Overall, the Fisher Crossover Strategy is valued for its clear entry and exit rules and its ability to highlight potential market reversals earlier than many other indicators.
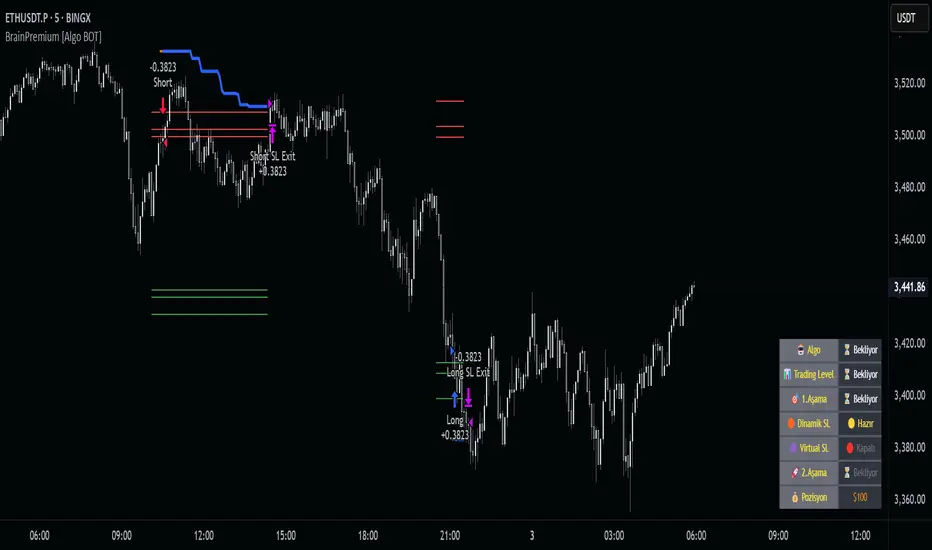
Brain Premium [ALGO]💡 Brain Premium ALGO
Brainpremium ALGO is a strategy algorithm that analyzes a two-phase regional liquidity structure and only opens positions on price breakouts occurring within these liquidity zones.
This system is developed based on the market experience of manual traders and automatically executes trade decisions using AI-like rules and specific triggers.
💡 Two-Phase Liquidity-Based Entry Strategy
This strategy operates by detecting liquidity sweep zones and confirmed reversal signals:
🔹 Phase 1 – Liquidity Sweep:
Price is expected to sweep areas where equal highs/lows or liquidity clusters exist. These zones are considered potential reversal levels.
🔹 Phase 2 – Confirmed Entry:
After liquidity is swept, entries are triggered only by confirmed reversal signals such as structural breaks, inside bars, or breakouts in the opposite direction.
✅ Entries are triggered only when liquidity and reversal confirmation occur simultaneously.
🎯 This approach targets high-probability, low-risk trades.
⚙️ Key Features
🔍 Dynamic Liquidity Detection — Automatically identifies liquidity zones.
🧩 Modular Entry Options (1–2–3) — Allows opening positions via different strategy paths.
🛡️ Dynamic Stop Loss System — Stop Loss adjusts as price moves favorably.
📈 Advanced Risk Management — Adjustable Take Profit, Stop Loss, leverage, balance, and mode.
🔔 JSON Alert Support — Connects to platforms like BingX via webhook.
🧾 Information Panel — Displays real-time trade data and strategy status.
📊 Backtest & Default Settings
Strategy tests are conducted with realistic and sustainable parameters:
Parameter Value
Trading Balance: $100 (%10 of total wallet)
Leverage: 10x
Stop Loss: 1%
Take Profit Type : High TP (optional: Low and Risky also available)
Entry Option 1 (optional: 2 and 3 also available)
Mode: NORMAL
Commission 0.05%
Dynamic Stop Loss: Enabled
Timeframe: 5 minute
Pair ETH/USDT
Duration: 30 days
🧭 Usage Instructions
Add Brain Premium ALGO to your TradingView chart.
Set position size, leverage, and SL/TP levels from the settings panel.
Select entry option (1, 2, or 3).
Activate backtesting and alert systems to monitor the strategy.
⚠️ Disclaimer
This strategy is not financial advice. Past performance does not guarantee future results. Trade only with capital you can afford to risk and always test thoroughly in a demo environment first.
Parallax Momentum MNQ Strategy# 📈 Parallax Momentum MNQ Strategy
## Overview
The Parallax Momentum MNQ Strategy is a sophisticated support/resistance breakout system specifically designed for Micro Nasdaq futures (MNQ) trading (also works on minis). This strategy combines dynamic level detection with momentum confirmation to identify high-probability entry opportunities while maintaining strict risk management protocols.
## 🎯 Key Features
### Core Strategy Logic
- **Dynamic Support/Resistance Detection**: Automatically identifies key levels using configurable lookback periods
- **Momentum Confirmation**: Volume-based filtering ensures trades align with market momentum
- **ATR-Based Risk Management**: Adaptive stop losses and take profits based on market volatility
- **Dual Entry System**: Both long and short opportunities with limit order execution
### Risk Management
- **ATR-Adaptive Stops**: Stop losses and take profits automatically adjust to market volatility
- **Reward-to-Risk Ratios**: Configurable R:R ratios with default 2:1 minimum
- **Maximum Loss Protection**: Optional daily loss limits to prevent overtrading
- **Session Time Filtering**: Trade only during specified market hours
### Strategy Modes
- **Conservative Mode**: 0.8x risk multiplier for cautious trading
- **Balanced Mode**: Standard 1.0x risk multiplier (default)
- **Aggressive Mode**: 1.2x risk multiplier for active trading
## 📊 Visual Features
### Dashboard Display
- Real-time strategy status and performance metrics
- Current support/resistance levels and ATR values
- Live risk-to-reward ratios for potential trades
- Win rate, profit factor, and drawdown statistics
- Adjustable dashboard size and positioning
### Chart Indicators
- Support and resistance lines with labels
- ATR-based levels (+/-1 ATR and +/-2 ATR)
- Dynamic visual updates as levels change
- Configurable line extensions and styling
## ⚙️ Configuration Options
### Entry Filters
- **Volume Filter**: Optional volume confirmation above SMA
- **Session Time Filter**: 12-hour format time restrictions
- **ATR vs Fixed Stops**: Choose between adaptive or fixed tick-based exits
### Risk Controls
- **ATR Period**: Default 14-period ATR calculation
- **Stop Loss Multiplier**: ATR-based stop distance (default 1.5x)
- **Take Profit Multiplier**: ATR-based target distance (default 1.5x)
- **Secondary Take Profit**: Optional TP2 with position scaling
## 📋 How It Works
### Entry Conditions
**Long Trades**: Triggered when price closes above support buffer but low touches support level, with volume and session confirmation
**Short Trades**: Triggered when price closes below resistance buffer but high touches resistance level, with volume and session confirmation
### Exit Strategy
- **Primary Take Profit**: ATR-based target with 2:1 R:R minimum
- **Stop Loss**: ATR-based protective stop
- **Optional TP2**: Extended target for partial profit taking
- **One Trade at a Time**: No overlapping positions
## 🎛️ Default Settings
- **Lookback Period**: 20 bars for support/resistance detection
- **ATR Period**: 14 bars for volatility calculation
- **Stop Loss**: 1.5x ATR from entry
- **Take Profit**: 1.5x ATR with 2:1 reward-to-risk ratio
- **Session**: 7:30 AM - 2:00 PM (configurable)
## ⚠️ Important Notes
### Risk Disclaimer
- This strategy is for educational and informational purposes only
- Past performance does not guarantee future results
- Always use proper position sizing and risk management
- Test thoroughly on historical data before live trading
- Consider market conditions and volatility when using
### Best Practices
- Backtest on sufficient historical data
- Start with conservative mode for new users
- Monitor performance regularly and adjust parameters as needed
- Use appropriate position sizing for your account
- Consider broker commissions and slippage in live trading
## 🔧 Customization
The strategy offers extensive customization options including:
- Adjustable time sessions with AM/PM format
- Configurable ATR and risk parameters
- Optional maximum daily loss limits
- Dashboard size and position controls
- Visual element toggles and styling
## 📈 Ideal For
- MNQ (Micro Nasdaq) futures traders
- Intraday momentum strategies
- Traders seeking systematic entry/exit rules
- Risk-conscious traders wanting automated stops
- Both beginner and experienced algorithmic traders
---
**Version**: Pine Script v5 Compatible
**Timeframe**: Works on multiple timeframes (test on 1m, 3m, 5m, 15m)
**Market**: Optimized for MNQ but adaptable to other instruments
**Strategy Type**: Trend following with momentum confirmation

RCI 2 Dashboards ✅ Strategy: RCI 2 Dashboards BY Sonu JAIN
This advanced strategy is built around the Rank Correlation Index (RCI), a unique momentum oscillator, and combines it with a comprehensive suite of powerful indicators to identify high-probability trading opportunities. The strategy’s core strength lies in its ability to filter signals using up to 12 different conditions for both long and short trades.
To make the decision-making process clear and intuitive, the strategy features two dynamic, customizable dashboards right on your chart. The first dashboard gives you a live, detailed breakdown of which conditions are met, while the second provides a real-time overview of the strategy’s performance.
How It Works
The strategy generates entry signals based on RCI crossovers and crossunders. These signals are then filtered by a customizable combination of other indicators to confirm the trade.
Long Entry:
The RCI crosses over its moving average.
All enabled long-side filters are met.
Short Entry:
The RCI crosses under its moving average.
All enabled short-side filters are met.
Key Features
RCI Crossover Logic: The core of the strategy is an RCI crossover/crossunder with a customizable moving average (MA). You can choose from SMA, EMA, SMMA (RMA), WMA, or VWMA.
12 Optional Filters: This strategy goes far beyond a simple RCI signal. You can enable or disable a wide range of filters to refine your entries. These include:
Trend: Supertrend, Parabolic SAR (SAR), and Vortex Indicator.
Volatility: Keltner Channels (KC) and Bollinger Bands (BB).
Momentum: Woodies CCI, Money Flow Index (MFI), and Relative Strength Index (RSI).
Volume: On-Balance Volume (OBV) and simple Volume analysis.
Directional Strength: Average Directional Index (ADX).
Timing: A time-of-day filter to trade only during specific market hours.
Dual Dashboards:
Detailed Condition Dashboard: This dashboard shows you exactly which of the 12 filters are currently met with a simple ✓ or ✗. This provides instant clarity on why a trade is or isn't being considered.
Performance Dashboard: This dashboard displays key performance metrics in real-time, including net profit, win rate, profit factor, max drawdown, and current/max winning and losing streaks. It also provides details on the most recent trade, such as entry, stop-loss, and exit prices.
Customizable Stop Loss: The strategy includes a fixed percentage-based stop loss for both long and short positions, which you can easily configure in the settings.
Trade Direction Control: You can choose to trade "Long Only," "Short Only," or "Long & Short," giving you complete control over your trading bias.
This strategy is a powerful tool for traders who want to build a robust, multi-filtered system. The included dashboards make it an excellent educational tool for understanding how different indicators work together to form a complete trading plan. You can use it to backtest and optimize your own unique combination of indicators to find the perfect setup for your market and timeframe.

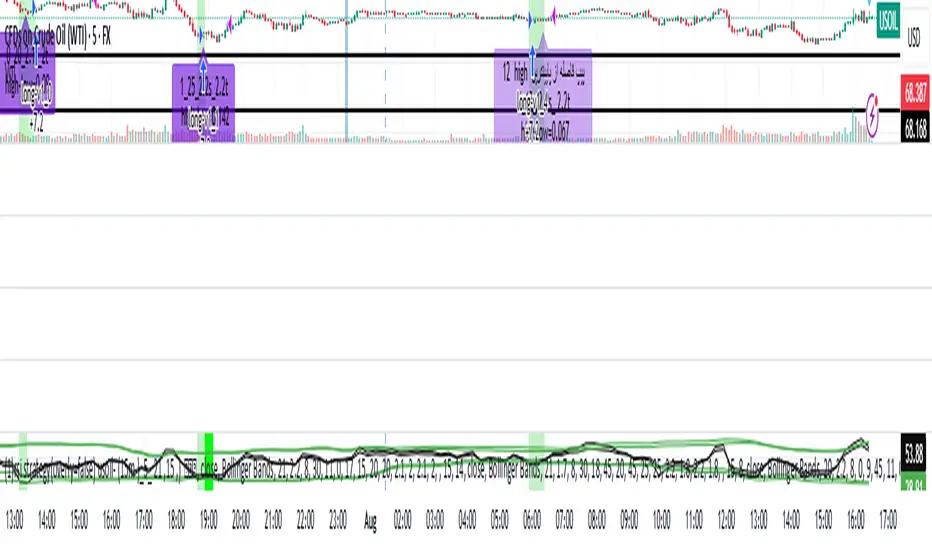
rsi indicator strategyRSIBB Strategy Based on Oversold, Overrbuy Bolinger Band Band. In usoil . Time Indicators is set and the timing is in 5 minutes
An example of Long. When the green marker appears, our entry point is High High If the price fails to reject our High High, our entry will change to the next candlestick. This process will continue until we enter the position.
A marker appears in purple when the green marker appears to us, in which information appears:
The first digit related to the strategist code
The second digit is that we have a few pips to be sure of the candlestick of our entry point
The third digit is our SL that is a coefficient of overall size of yogurt (HIGH - LOW)
Charmin is the digit of our tp that is a coefficient of overall size of yogurt (HIGH - LOW)
In 6 sets
استراتژی RSIBB بر اساس اشباع فروش، اشباع خرید، باند بولینگر. در این روش، اندیکاتورهای زمانی تنظیم شده و زمانبندی ۵ دقیقه است.
مثالی از موقعیت خرید. وقتی نشانگر سبز ظاهر میشود، نقطه ورود ما High است. اگر قیمت نتواند High ما را رد کند، ورود ما به کندل بعدی تغییر میکند. این فرآیند تا زمانی که وارد موقعیت شویم ادامه خواهد داشت.
وقتی نشانگر سبز برای ما ظاهر میشود، یک نشانگر به رنگ بنفش ظاهر میشود که در آن اطلاعات زیر ظاهر میشود:
رقم اول مربوط به کد استراتژیست است.
رقم دوم این است که ما چند پیپ برای اطمینان از کندل نقطه ورود خود داریم.
رقم سوم SL ما است که ضریبی از اندازه کلی ماست (HIGH - LOW) است.
چارمین رقم tp ما است که ضریبی از اندازه کلی ماست (HIGH - LOW) است.
Trading Report Generator from CSVMany people use the Trading Panel. Unfortunately, it doesn't have a Performance Report. However, TradingView has strategies, and they have a Performance Report :-D
What if we combine the first and second? It's easy!
This script is a special strategy that parses transactions in csv format from Paper Trading (and it will also work for other brokers) and “plays” them. As a result, we get a Performance Report for a specific instrument based on our real trades in Paper or another broker.
How to use it :
First, we need to get a CSV file with transactions. To do this, go to the Trading Panel and connect the desired broker. Select the History tab, then the Filled sub-tab, and configure the columns there, leaving only: Side, Qty, Fill Price, Closing Time. After that, open the Export data dialog, select History, and click Export. Open the downloaded CSV file in a regular text editor (Notepad or similar). It will contain a text like this:
Symbol,Side,Qty,Fill Price,Closing Time
FX:EURUSD,Buy,1000,1.0938700000000001,2023-04-05 14:29:23
COINBASE:ETHUSD,Sell,1,1332.05,2023-01-11 17:41:33
CME_MINI:ESH2023,Sell,1,3961.75,2023-01-11 17:30:40
CME_MINI:ESH2023,Buy,1,3956.75,2023-01-11 17:08:53
Next select all the text (Ctrl+A) and copy it to the clipboard.
Now apply the "Trading Report Generator from CSV" strategy to the chart with the desired symbol and TF, open the settings/input dialog, paste the contents of the clipboard into the single text input field of the strategy, and click Ok.
That's it.
In the Strategy Tester, we see a detailed Performance Report based on our real transactions.
P.S. The CSV file may contain transactions for different instruments, for example, you may have transactions for CRYPTO:BTCUSD and NASDAQ:AAPL. To view the report is based on CRYPTO:BTCUSD trades, simply change the symbol on the chart to CRYPTO:BTCUSD. To view the report is based on NASDAQ:AAPL trades, simply change the symbol on the chart to NASDAQ:AAPL. No changes to the strategy are required.
How it works :
At the beginning of the calculation, we parse the csv once, create trade objects (Trade) and sort them in chronological order. Next, on each bar, we check whether we have trades for the time period of the next bar. If there are, we place a limit order for each trade, with limit price == Fill Price of the trade. Here, we assume that if the trade is real, its execution price will be within the bar range, and the Pine strategy engine will execute this order at the specified limit price.

Opening-Range BreakoutNote: Default trading date range looks mediocre. Set date range to "Entire History" to see full effect of the strategy. 50.91% profitable trades, 1.178 profit factor, steady profits and limited drawdown. Total P&L: $154,141.18, Max Drawdown: $18,624.36. High R^2
█ Overview
The Opening-Range Breakout strategy is a mechanical, session‑based day‑trading system designed to capture the initial burst of directional momentum immediately following the market open. It defines a user‑configurable “opening range” window, measures its high and low boundaries, then places breakout stop orders at those levels once the range closes. Built‑in filters on minimum range width, reward‑to‑risk ratios, and optional reversal logic help refine entries and manage risk dynamically.
█ How It Works
Opening‑Range Formation
Between 9:30–10:15 AM ET (configurable), the script tracks the highest high and lowest low to form the day’s opening range box.
On the first bar after the range window closes, the range high (OR_high) and low (OR_low) are “locked in.”
Range‑Width Filter
To avoid false breakouts in low‑volatility mornings, the range must be at least X% of the current price (default 0.35%).
If the measured opening-range width < minimum threshold, no orders are placed that day.
Entry & Order Placement
Long: a stop‑buy order at the opening‑range high.
Short: a stop‑sell order at the opening‑range low.
Only one side can trigger (or both if reverse logic is enabled after a losing trade).
Risk Management
Once triggered, each trade uses an ATR‑style stop-loss defined as a percentage retracement of the range (default 50% of range width).
Profit target is set at a configurable Reward/Risk Ratio (default 1.1×).
Optional: Reverse on Stop‑Loss – if the initial breakout loses, immediately reverse into the opposite side on the same day.
Session Exit
Any open positions are closed at the end of the regular trading day (default 3:45 PM ET window end, with hard flat at session close).
Visual cues are provided via green (range high) and red (range low) step‑line plots directly on the chart, allowing you to see the range box and breakout triggers in real time.
█ Why It Works
Early Momentum Capture: The first 15 – 60 minutes of trading encapsulate overnight news digestion and institutional order flow, creating a well‑defined volatility “range.”
Mechanical Discipline: Clear, rule‑based entries and exits remove emotional guesswork, ensuring consistency.
Volatility Filtering: By requiring a minimum range width, the system avoids choppy, low‑range days where false breakouts are common.
Dynamic Sizing: Stops and targets scale with the opening range, adapting automatically to each day’s volatility environment.
█ How to Use
Set Your Instruments & Timeframe
-Apply to any futures contract on a 1‑ to 5‑minute chart.
-Ensure chart timezone is set to America/New_York.
Configure Inputs
-Opening‑Range Window: e.g. “0930-1015” for a 45‑minute range.
-Min. OR Width (%): e.g. 0.35 for 0.35% of current price.
-Reward/Risk Ratio: e.g. 1.1 for a modest profit target above your stop.
-Max OR Retracement %: e.g. 50 to set stop at 50% of range width.
-One Trade Per Day: toggle to limit to a single breakout.
-Reverse on Stop Loss: toggle to flip direction after a losing breakout.
Monitor the Chart
-Watch the green and red range boundaries form during the session open.
-Orders will automatically submit on the first bar after the range window closes, conditioned on your filters.
Review & Adjust
-Backtest across multiple months to validate performance on your preferred contract.
-Tweak range duration, minimum width, and R/R multiple to fit your risk tolerance and desired win‑rate vs. expectancy balance.
█ Settings Reference
Input Defaults
Opening‑Range Window - Time window to form OR (HHMM-HHMM) - 0930–1015
Regular Trading Day - Full session for EOD flat (HHMM-HHMM) - 0930–1545
Min. OR Width (%) - Minimum OR size as % of close to trigger orders - 0.35
Reward/Risk Ratio - Profit target multiple of stop‑loss distance - 1.1
Max OR Retracement (%) - % of OR width to use as stop‑loss distance - 50
One Trade Per Day - Limit to a single breakout order per day - false
Reverse on Stop Loss - Reverse direction immediately after a losing trade - true
Disclaimer
This strategy description and any accompanying code are provided for educational purposes only and do not constitute financial advice or a solicitation to trade. Futures trading involves substantial risk, including possible loss of capital. Past performance is not indicative of future results. Traders should assess their own risk tolerance and conduct thorough backtesting and forward-testing before committing real capital.

EMA Grid + Martingale Strategy (Long-Only) with CooldownTitle:
EMA Grid + Martingale Strategy (Long-Only) with Cooldown
Short Summary:
A long-only strategy combining EMA trend filters, grid-based entries, optional martingale sizing, and a cooldown feature to manage position timing and exits.
Full Description:
This strategy uses a 4-EMA trend confirmation system to detect bullish momentum, then deploys a grid-style entry method with optional martingale position sizing. It includes a cooldown mechanism to prevent reentry too soon after a completed trade cycle.
How It Works
1. Trend Confirmation: Two EMA groups (fast/slow) determine whether market conditions are bullish.
2. Initial Entry: A new position is entered when both EMA groups confirm an uptrend and no position is currently active.
3. Grid Entries: Additional long entries are placed when price drops by a defined pip distance from the last entry, respecting the maximum number of entries.
4. Martingale Sizing (Optional): Grid orders can increase in size with each level using a customizable multiplier.
5. Weighted-Average Exit: All positions close once price reaches or exceeds the average entry price plus a buffer.
6. Cooldown Timer: After closing a position set, the strategy waits a defined number of bars before opening a new grid.
Key Features
• 4 customizable EMAs for trend confirmation.
• Dynamic grid-style long entries based on pip intervals.
• Optional martingale-style position sizing.
• Weighted-average price exit logic with buffer control.
• Cooldown bar period to limit overtrading.
• Suitable for optimization and backtesting with full control over inputs.
Use Cases
• Designed for trending markets where pullbacks present entry opportunities.
• Helps manage staged entries while avoiding premature reentry.
• Ideal for testing martingale and grid-based strategies with exit precision.
Note: This strategy is for testing and educational purposes only. It does not guarantee profits and is not financial advice.

PRO Investing - Quant AlphaCentauri D |XLF|PRO Investing - Quant AlphaCentauri D |XLF|
1. Summary and Core Concept
This is a quantitative backtesting strategy engineered specifically for the Financial Select Sector SPDR Fund (XLF) on the Daily (1D) timeframe. The name "AlphaCentauri" reflects its goal: to seek alpha by identifying statistically significant opportunities through rigorous time series analysis.
The strategy's core principle is to move beyond conventional technical indicators and instead analyze the underlying structure and character of price data. It is designed to methodically identify conditions that have historically preceded sustained directional trends in the financial sector.
2. The Analytical Process: How It Works
This strategy employs a multi-stage quantitative process to filter for high-probability setups. It is a "mashup" of statistical concepts applied to price action.
Structural Pattern Recognition: The engine's primary function is to analyze the historical price series of XLF to identify specific, recurring structural patterns. It examines price geometry and cyclical behavior to find formations that often act as the foundation for a new, emerging trend.
Signal Execution: A signal to enter a trade is only generated when the findings from both the structural analysis and the validation stages are in agreement. This disciplined, multi-layered approach ensures the strategy remains flat during periods of high uncertainty and only engages when its quantitative criteria are fully met.
3. How to Use This Strategy
Timeframe: This strategy has been designed, tested, and optimized exclusively for the Daily (1D) timeframe on the XLF ticker. Its logic is not intended for other timeframes or assets and may produce unreliable results if used differently.
On-Chart Signals: The strategy's operation is transparent. It plots all historical buy and sell entries, along with their corresponding exits, directly on the chart for easy performance review and analysis.
4. Risk Management: The Strategy's Foundation
This strategy is built upon a foundation of strict, non-negotiable risk management, which is reflected in its code and backtesting parameters. This design complies with TradingView's guidelines for publishing realistic and responsible strategies.
Dynamic Stop-Loss and Position Sizing: A stop-loss is dynamically calculated for each trade based on recent market volatility. The strategy then automatically adjusts the position size for that trade to target a defined risk percentage. In cases of extreme market volatility, the maximum potential loss on a single trade may approach, but is designed not to exceed, 5% of total account equity. Under normal market conditions, the risk for most trades will be below this maximum threshold.
Realistic Backtesting Parameters:
Initial Capital: The backtest defaults to an initial capital of $100,000.
Commission: A realistic fee of $5.00 per order is included to simulate broker costs.
5. Disclaimer
This strategy is an educational tool provided for informational and research purposes. It is not financial advice. All trading carries a high level of risk, and past performance is not a guarantee of future results. You are solely responsible for your own trading decisions and risk management. Always conduct your own due diligence before deploying any trading strategy in a live account.

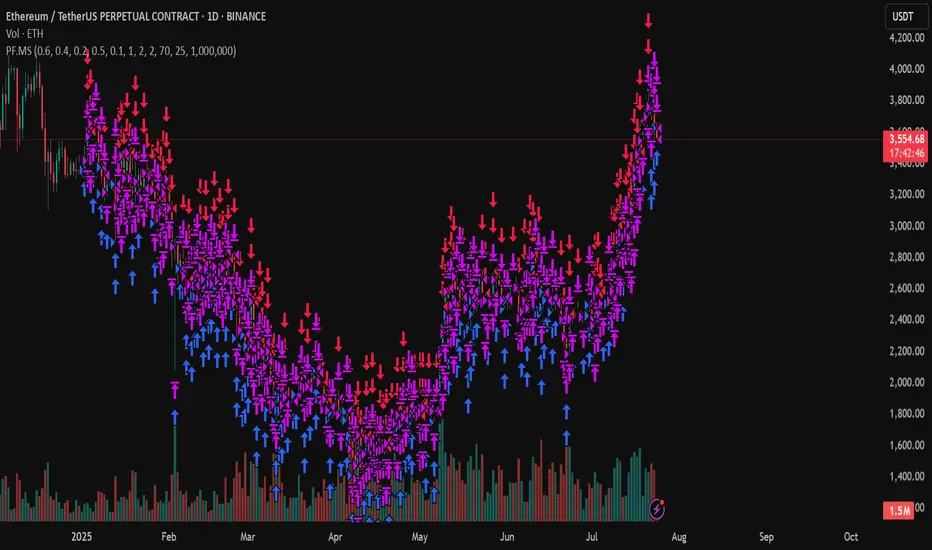
PF.MSThe Pressure & Flow Momentum Strategy (PF.MS) detects market pressure buildup through advanced candlestick analysis and captures momentum flow when conditions align, providing accurate buy and sell signals across cryptocurrencies and stocks—but even sophisticated strategies can be wrong when markets turn brutal without warning. The system reads real-time pressure dynamics (buying vs selling forces, wick patterns, volatility conditions) to identify when smart money is positioning, then captures the resulting momentum flow with precise entry and exit timing. While highly accurate at detecting pressure shifts and momentum changes, the strategy can still face losses during sudden news events or when market sentiment overrides technical patterns. The PF.MS combines intelligent pressure detection with momentum capture, trailing profit protection and strict stop losses
MACD Liquidity Tracker Strategy [Quant Trading]MACD Liquidity Tracker Strategy
Overview
The MACD Liquidity Tracker Strategy is an enhanced trading system that transforms the traditional MACD indicator into a comprehensive momentum-based strategy with advanced visual signals and risk management. This strategy builds upon the original MACD Liquidity Tracker System indicator by TheNeWSystemLqtyTrckr , converting it into a fully automated trading strategy with improved parameters and additional features.
What Makes This Strategy Original
This strategy significantly enhances the basic MACD approach by introducing:
Four distinct system types for different market conditions and trading styles
Advanced color-coded histogram visualization with four dynamic colors showing momentum strength and direction
Integrated trend filtering using 9 different moving average types
Comprehensive risk management with customizable stop-loss and take-profit levels
Multiple alert systems for entry signals, exits, and trend conditions
Flexible signal display options with customizable entry markers
How It Works
Core MACD Calculation
The strategy uses a fully customizable MACD configuration with traditional default parameters:
Fast MA : 12 periods (customizable, minimum 1, no maximum limit)
Slow MA : 26 periods (customizable, minimum 1, no maximum limit)
Signal Line : 9 periods (customizable, now properly implemented and used)
Cryptocurrency Optimization : The strategy's flexible parameter system allows for significant optimization across different crypto assets. Traditional MACD settings (12/26/9) often generate excessive noise and false signals in volatile crypto markets. By using slower, more smoothed parameters, traders can capture meaningful momentum shifts while filtering out market noise.
Example - DOGE Optimization (45/80/290 settings) :
• Performance : Optimized parameters yielding exceptional backtesting results with 29,800% PnL
• Why it works : DOGE's high volatility and social sentiment-driven price action benefits from heavily smoothed indicators
• Timeframes : Particularly effective on 30-minute and 4-hour charts for swing trading
• Logic : The very slow parameters filter out noise and capture only the most significant trend changes
Other Optimizable Cryptocurrencies : This parameter flexibility makes the strategy highly effective for major altcoins including SUI, SEI, LINK, Solana (SOL) , and many others. Each crypto asset can benefit from custom parameter tuning based on its unique volatility profile and trading characteristics.
Four Trading System Types
1. Normal System (Default)
Long signals : When MACD line is above the signal line
Short signals : When MACD line is below the signal line
Best for : Swing trading and capturing longer-term trends in stable markets
Logic : Traditional MACD crossover approach using the signal line
2. Fast System
Long signals : Bright Blue OR Dark Magenta (transparent) histogram colors
Short signals : Dark Blue (transparent) OR Bright Magenta histogram colors
Best for : Scalping and high-volatility markets (crypto, forex)
Logic : Leverages early momentum shifts based on histogram color changes
3. Safe System
Long signals : Only Bright Blue histogram color (strongest bullish momentum)
Short signals : All other colors (Dark Blue, Bright Magenta, Dark Magenta)
Best for : Risk-averse traders and choppy markets
Logic : Prioritizes only the strongest bullish signals while treating everything else as bearish
4. Crossover System
Long signals : MACD line crosses above signal line
Short signals : MACD line crosses below signal line
Best for : Precise timing entries with traditional MACD methodology
Logic : Pure crossover signals for more precise entry timing
Color-Coded Histogram Logic
The strategy uses four distinct colors to visualize momentum:
🔹 Bright Blue : MACD > 0 and rising (strong bullish momentum)
🔹 Dark Blue (Transparent) : MACD > 0 but falling (weakening bullish momentum)
🔹 Bright Magenta : MACD < 0 and falling (strong bearish momentum)
🔹 Dark Magenta (Transparent) : MACD < 0 but rising (weakening bearish momentum)
Trend Filter Integration
The strategy includes an advanced trend filter using 9 different moving average types:
SMA (Simple Moving Average)
EMA (Exponential Moving Average) - Default
WMA (Weighted Moving Average)
HMA (Hull Moving Average)
RMA (Running Moving Average)
LSMA (Least Squares Moving Average)
DEMA (Double Exponential Moving Average)
TEMA (Triple Exponential Moving Average)
VIDYA (Variable Index Dynamic Average)
Default Settings : 50-period EMA for trend identification
Visual Signal System
Entry Markers : Blue triangles (▲) below candles for long entries, Magenta triangles (▼) above candles for short entries
Candle Coloring : Price candles change color based on active signals (Blue = Long, Magenta = Short)
Signal Text : Optional "Long" or "Short" text inside entry triangles (toggleable)
Trend MA : Gray line plotted on main chart for trend reference
Parameter Optimization Examples
DOGE Trading Success (Optimized Parameters) :
Using 45/80/290 MACD settings with 50-period EMA trend filter has shown exceptional results on DOGE:
Performance : Backtesting results showing 29,800% PnL demonstrate the power of proper parameter optimization
Reasoning : DOGE's meme-driven volatility and social sentiment spikes create significant noise with traditional MACD settings
Solution : Very slow parameters (45/80/290) filter out social media-driven price spikes while capturing only major momentum shifts
Optimal Timeframes : 30-minute and 4-hour charts for swing trading opportunities
Result : Exceptionally clean signals with minimal false entries during DOGE's characteristic pump-and-dump cycles
Multi-Crypto Adaptability :
The same optimization principles apply to other major cryptocurrencies:
SUI : Benefits from smoothed parameters due to newer coin volatility patterns
SEI : Requires adjustment for its unique DeFi-related price movements
LINK : Oracle news events create price spikes that benefit from noise filtering
Solana (SOL) : Network congestion events and ecosystem developments need smoothed detection
General Rule : Higher volatility coins typically benefit from very slow MACD parameters (40-50 / 70-90 / 250-300 ranges)
Key Input Parameters
System Type : Choose between Fast, Normal, Safe, or Crossover (Default: Normal)
MACD Fast MA : 12 periods default (no maximum limit, consider 40-50 for crypto optimization)
MACD Slow MA : 26 periods default (no maximum limit, consider 70-90 for crypto optimization)
MACD Signal MA : 9 periods default (now properly utilized, consider 250-300 for crypto optimization)
Trend MA Type : EMA default (9 options available)
Trend MA Length : 50 periods default (no maximum limit)
Signal Display : Both, Long Only, Short Only, or None
Show Signal Text : True/False toggle for entry marker text
Trading Applications
Recommended Use Cases
Momentum Trading : Capitalize on strong directional moves using the color-coded system
Trend Following : Combine MACD signals with trend MA filter for higher probability trades
Scalping : Use "Fast" system type for quick entries in volatile markets
Swing Trading : Use "Normal" or "Safe" system types for longer-term positions
Cryptocurrency Trading : Optimize parameters for individual crypto assets (e.g., 45/80/290 for DOGE, custom settings for SUI, SEI, LINK, SOL)
Market Suitability
Volatile Markets : Forex, crypto, indices (recommend "Fast" system or smoothed parameters)
Stable Markets : Stocks, ETFs (recommend "Normal" or "Safe" system)
All Timeframes : Effective from 1-minute charts to daily charts
Crypto Optimization : Each major cryptocurrency (DOGE, SUI, SEI, LINK, SOL, etc.) can benefit from custom parameter tuning. Consider slower MACD parameters for noise reduction in volatile crypto markets
Alert System
The strategy provides comprehensive alerts for:
Entry Signals : Long and short entry triangle appearances
Exit Signals : Position exit notifications
Color Changes : Individual histogram color alerts
Trend Conditions : Price above/below trend MA alerts
Strategy Parameters
Default Settings
Initial Capital : $1,000
Position Size : 100% of equity
Commission : 0.1%
Slippage : 3 points
Date Range : January 1, 2018 to December 31, 2069
Risk Management (Optional)
Stop Loss : Disabled by default (customizable percentage-based)
Take Profit : Disabled by default (customizable percentage-based)
Short Trades : Disabled by default (can be enabled)
Important Notes and Limitations
Backtesting Considerations
Uses realistic commission (0.1%) and slippage (3 points)
Default position sizing uses 100% equity - adjust based on risk tolerance
Stop-loss and take-profit are disabled by default to show raw strategy performance
Strategy does not use lookahead bias or future data
Risk Warnings
Past performance does not guarantee future results
MACD-based strategies may produce false signals in ranging markets
Consider combining with additional confluences like support/resistance levels
Test thoroughly on demo accounts before live trading
Adjust position sizing based on your risk management requirements
Technical Limitations
Strategy does not work on non-standard chart types (Heikin Ashi, Renko, etc.)
Signals are based on close prices and may not reflect intraday price action
Multiple rapid signals in volatile conditions may result in overtrading
Credits and Attribution
This strategy is based on the original "MACD Liquidity Tracker System" indicator created by TheNeWSystemLqtyTrckr . This strategy version includes significant enhancements:
Complete strategy implementation with entry/exit logic
Addition of the "Crossover" system type
Proper implementation and utilization of the MACD signal line
Enhanced risk management features
Improved parameter flexibility with no artificial maximum limits
Additional alert systems for comprehensive trade management
The original indicator's core color logic and visual system have been preserved while expanding functionality for automated trading applications.

EMA and Dow Theory Strategies🌐 Strategy Description
📘 Overview
This is a hybrid strategy that combines EMA crossovers, Dow Theory swing logic, and multi-timeframe trend overlays. It is suitable for intraday to short-term trading on any asset class: crypto, forex, stocks, and indices.
The strategy provides precise entry/exit signals, dynamic stop-loss and scale-out, and highly visual trade guidance.
🧠 Key Features
・Dual EMA crossover system (applied to both symbol and external index)
・Dow Theory-based swing high/low detection for trend confirmation
・Visual overlay of higher timeframe swing trend (htfTrend)
・RSI filter to avoid overbought/oversold entries
・Dynamic partial take-profit when trend weakens
・Custom stop-loss (%) control
・Visualized trade PnL labels directly on chart
・Alerts for entry, stop-loss, partial exit
・Gradient background zones for swing zones and trend visualization
・Auto-tracked metrics: APR, drawdown, win rate, equity curve
⚙️ Input Parameters
| Parameter | Description |
| ------------------------- | -------------------------------------------------------- |
| Fast EMA / Slow EMA | Periods for detecting local trend via EMAs |
| Index Fast EMA / Slow EMA | EMAs applied to external reference index |
| StopLoss | Maximum loss threshold in % |
| ScaleOut Threshold | Scale-out percentage when trend changes color |
| RSI Period / Levels | RSI period and overbought/oversold levels |
| Swing Detection Length | Number of bars used to detect swing highs/lows |
| Stats Display Options | Toggle PnL labels and position of statistics table |
🧭 About htfTrend (Higher Timeframe Trend)
The script includes a higher timeframe trend (htfTrend) calculated using Dow Theory (pivot highs/lows).
This trend is only used for visual guidance, not for actual entry conditions.
Why? Strictly filtering trades by higher timeframe often leads to missed opportunities and low frequency.
By keeping htfTrend visual-only, traders can still refer to macro structure but retain trade flexibility.
Use it as a contextual tool, not a constraint.
ストラテジー説明
📘 概要
本ストラテジーは、EMAクロスオーバー、ダウ理論によるスイング判定、**上位足トレンドの視覚表示(htfTrend)**を組み合わせた複合型の短期トレーディング戦略です。
仮想通貨・FX・株式・指数など幅広いアセットに対応し、デイトレード〜スキャルピング用途に適しています。
動的な利確/損切り、視覚的にわかりやすいエントリー/イグジット、統計表示を搭載しています。
🧠 主な機能
・対象銘柄+外部インデックスのEMAクロスによるトレンド判定
・ダウ理論に基づいたスイング高値・安値検出とトレンド判断
・上位足スイングトレンド(htfTrend)の視覚表示
・RSIフィルターによる過熱・売られすぎの回避
・トレンドの弱まりに応じた部分利確(スケールアウト)
・**損切り閾値(%)**をカスタマイズ可能
・チャート上に損益ラベル表示
・アラート完備(エントリー・決済・部分利確)
・トレンドゾーンを可視化する背景グラデーション
・勝率・ドローダウン・APR・資産増加率などの自動表示
| 設定項目名 | 説明内容 |
| --------------------- | -------------------------- |
| Fast EMA / Slow EMA | 銘柄に対して使用するEMAの期間設定 |
| Index Fast / Slow EMA | 外部インデックスのEMA設定 |
| 損切り(StopLoss) | 損切りラインのしきい値(%で指定) |
| 部分利確しきい値 | トレンド弱化時にスケールアウトする割合(%) |
| RSI期間・水準 | RSI計算期間と、過熱・売られすぎレベル設定 |
| スイング検出期間 | スイング高値・安値の検出に使用するバー数 |
| 統計表示の切り替え | 損益ラベルや統計テーブルの表示/非表示選択 |
🧭 上位足トレンド(htfTrend)について
本スクリプトには、上位足でのスイング高値・安値の更新に基づく**htfTrend(トレンド判定)が含まれています。
これは視覚的な参考情報であり、エントリーやイグジットには直接使用されていません。**
その理由は、上位足を厳密にロジックに組み込むと、トレード機会の損失が増えるためです。
このスクリプトでは、**判断の補助材料として「表示のみに留める」**設計を採用しています。
→ 裁量で「利確を早める」「逆張りを避ける」判断に活用可能です。

Pullback Pro Dow Strategy v7 (ADX Filter)
### **Strategy Description (For TradingView)**
#### **Title:** Pullback Pro: Dow Theory & ADX Strategy
---
#### **1. Summary**
This strategy is designed to identify and trade pullbacks within an established trend, based on the core principles of Dow Theory. It uses market structure (pivot highs and lows) to determine the trend direction and an Exponential Moving Average (EMA) to pinpoint pullback entry opportunities.
To enhance trade quality and avoid ranging markets, an ADX (Average Directional Index) filter is integrated to ensure that entries are only taken when the trend has sufficient momentum.
---
#### **2. Core Logic: How It Works**
The strategy's logic is broken down into three main steps:
**Step 1: Trend Determination (Dow Theory)**
* The primary trend is identified by analyzing recent pivot points.
* An **Uptrend** is confirmed when the script detects a pattern of higher highs and higher lows (HH/HL).
* A **Downtrend** is confirmed by a pattern of lower highs and lower lows (LH/LL).
* If neither pattern is present, the strategy considers the market to be in a range and will not seek trades.
**Step 2: Entry Signal (Pullback to EMA)**
* Once a clear trend is established, the strategy waits for a price correction.
* **Long Entry:** In a confirmed uptrend, a long position is initiated when the price pulls back and crosses *under* the specified EMA.
* **Short Entry:** In a confirmed downtrend, a short position is initiated when the price rallies and crosses *over* the EMA.
**Step 3: Confirmation & Risk Management**
* **ADX Filter:** To ensure the trend is strong enough to trade, an entry signal is only validated if the ADX value is above a user-defined threshold (e.g., 25). This helps filter out weak signals during choppy or consolidating markets.
* **Stop Loss:** The initial Stop Loss is automatically and logically placed at the last market structure point:
* For long trades, it's placed at the `lastPivotLow`.
* For short trades, it's placed at the `lastPivotHigh`.
* **Take Profit:** Two Take Profit levels are calculated based on user-defined Risk-to-Reward (R:R) ratios. The strategy allows for partial profit-taking at the first target (TP1), moving the remainder of the position to the second target (TP2).
---
#### **3. Input Settings Explained**
**① Dow Theory Settings**
* **Pivot Lookback Period:** Determines the sensitivity for detecting pivot highs and lows. A smaller number makes it more sensitive to recent price swings; a larger number focuses on more significant, longer-term pivots.
**② Entry Logic (Pullback)**
* **Pullback EMA Length:** Sets the period for the Exponential Moving Average used to identify pullback entries.
**③ Risk & Exit Management**
* **Take Profit 1 R:R:** Sets the Risk-to-Reward ratio for the first take-profit target.
* **Take Profit 1 (%):** The percentage of the position to be closed when TP1 is hit.
* **Take Profit 2 R:R:** Sets the Risk-to-Reward ratio for the final take-profit target.
**④ Filters**
* **Use ADX Trend Filter:** A master switch to enable or disable the ADX filter.
* **ADX Length:** The lookback period for the ADX calculation.
* **ADX Threshold:** The minimum ADX value required to confirm a trade signal. Trades will only be placed if the ADX is above this level.
---
#### **4. Best Practices & Recommendations**
* This is a trend-following system. It is designed to perform best in markets that exhibit clear, sustained trending behavior.
* It may underperform in choppy, sideways, or strongly ranging markets. The ADX filter is designed to help mitigate this, but no filter is perfect.
* **Crucially, you must backtest this strategy thoroughly** on your preferred financial instrument and timeframe before considering any live application.
* Experiment with the `Pivot Lookback Period`, `Pullback EMA Length`, and `ADX Threshold` to optimize performance for a specific market's characteristics.
---
#### **DISCLAIMER**
This script is provided for educational and informational purposes only. It does not constitute financial advice. All trading involves a high level of risk, and past performance is not indicative of future results. You are solely responsible for your own trading decisions. The author assumes no liability for any financial losses you may incur from using this strategy. Always conduct your own research and due diligence.

Operator Levels by Trade InsiderOperator Levels by Trade Insider
Overview
Operator Levels by Trade Insider is a breakout trading strategy designed for intraday trading on the Nifty 50 index using a 5-minute timeframe. It identifies high-probability trade setups based on the first 5-minute candle’s price range of the day, generating target levels for long and short positions. The strategy uses a customizable Simple Moving Average (SMA) for trend filtering and a strict 1:1.5 risk-to-reward validation, making it ideal for intraday traders in the Indian equity market.
Key Features
Dynamic Target Levels: Plots two sets of target levels above and below the first 5-minute candle’s range, calculated using a proprietary volatility-based multiplier to project realistic price objectives.
Trend Filtering: Uses a user-adjustable SMA (default: 24 periods) to ensure entries align with the prevailing market trend, reducing false breakouts.
Risk-to-Reward Validation: Only executes trades with a minimum 1:1.5 risk-to-reward ratio, promoting disciplined risk management.
Clean Visualization: Displays target levels as dashed lines with color-coded labels for easy identification of trade exits (Target 1, Target 2, Stop-Loss).
Customizable Settings: Allows adjustment of SMA period, position size, and risk parameters to suit different trading styles and market conditions.
What Makes It Unique?
Unlike standard breakout strategies, Operator Levels employs a proprietary multiplier derived from volatility analysis to optimize target levels for the Nifty 50’s intraday movements. The adjustable SMA period and strict 1:1.5 risk-to-reward filter enhance entry precision, reducing noise compared to traditional range breakout systems. The strategy’s minimalist design ensures actionable signals without overwhelming the chart, tailored specifically for the fast-paced 5-minute timeframe.
How to Use
Setup: Apply on a 5-minute chart for the Nifty 50 index (e.g., NSE:NIFTY). Recommended for intraday trading.
Default Settings:
Position Size: 5% of equity per trade (adjustable via default_qty_value).
SMA Period: 24 (adjustable; e.g., set to 12 for faster signals or 50 for smoother trends).
Risk-to-Reward: 1:1.5 minimum for all trades.
Trading Process:
Long Entry: Triggered when price breaks above the first 5-minute candle’s high, is above the SMA, and meets the 1:1.5 risk-to-reward ratio.
Short Entry: Triggered when price breaks below the first 5-minute candle’s low, is below the SMA, and meets the 1:1.5 risk-to-reward ratio.
Exits: Close positions at Target 1, Target 2, or Stop-Loss, with alerts set via TradingView for real-time notifications.
Integration: Combine with volume analysis or support/resistance indicators (e.g., RSI, pivot points) for confirmation of breakouts.
Example: On a Nifty 50 5-minute chart, enter a long trade when price breaks above the first candle’s high and is above the 24-period SMA, targeting the first dashed blue line (Target 1) with a stop-loss at the first candle’s low.
Backtesting Results
Test Parameters:
Symbol: NSE:NIFTY, 5-minute timeframe
Period: 6 months (January 2025–June 2025)
Initial Capital: $10,000
Commission: 0.1% per trade
Slippage: 5 ticks
Risk per Trade: 5% of equity
Results:
Total Trades: 150
Win Rate: 62%
Average Risk-to-Reward: 1.5:1
Notes: Results are based on standard candles to ensure realistic performance. Backtest on your preferred timeframe and symbol to validate suitability.
Limitations
Trade Frequency: The 5-minute timeframe generates more trades than daily charts but may still require active market sessions (e.g., 9:15 AM–3:30 PM IST) for optimal results.
Market Conditions: Breakouts may underperform in low-volatility or ranging markets; use additional confirmation (e.g., volume spikes or Nifty 50 futures data) to filter signals.
Risk Management: While the 1:1.5 risk-to-reward ratio is conservative, traders should back test and adjust position sizing and SMA period to match their risk tolerance.

Multi-Confluence Swing Hunter V1# Multi-Confluence Swing Hunter V1 - Complete Description
Overview
The Multi-Confluence Swing Hunter V1 is a sophisticated low timeframe scalping strategy specifically optimized for MSTR (MicroStrategy) trading. This strategy employs a comprehensive point-based scoring system that combines optimized technical indicators, price action analysis, and reversal pattern recognition to generate precise trading signals on lower timeframes.
Performance Highlight:
In backtesting on MSTR 5-minute charts, this strategy has demonstrated over 200% profit performance, showcasing its effectiveness in capturing rapid price movements and volatility patterns unique to MicroStrategy's trading behavior.
The strategy's parameters have been fine-tuned for MSTR's unique volatility characteristics, though they can be optimized for other high-volatility instruments as well.
## Key Innovation & Originality
This strategy introduces a unique **dual scoring system** approach:
- **Entry Scoring**: Identifies swing bottoms using 13+ different technical criteria
- **Exit Scoring**: Identifies swing tops using inverse criteria for optimal exit timing
Unlike traditional strategies that rely on simple indicator crossovers, this system quantifies market conditions through a weighted scoring mechanism, providing objective, data-driven entry and exit decisions.
## Technical Foundation
### Optimized Indicator Parameters
The strategy utilizes extensively backtested parameters specifically optimized for MSTR's volatility patterns:
**MACD Configuration (3,10,3)**:
- Fast EMA: 3 periods (vs standard 12)
- Slow EMA: 10 periods (vs standard 26)
- Signal Line: 3 periods (vs standard 9)
- **Rationale**: These faster parameters provide earlier signal detection while maintaining reliability, particularly effective for MSTR's rapid price movements and high-frequency volatility
**RSI Configuration (21-period)**:
- Length: 21 periods (vs standard 14)
- Oversold: 30 level
- Extreme Oversold: 25 level
- **Rationale**: The 21-period RSI reduces false signals while still capturing oversold conditions effectively in MSTR's volatile environment
**Parameter Adaptability**: While optimized for MSTR, these parameters can be adjusted for other high-volatility instruments. Faster-moving stocks may benefit from even shorter MACD periods, while less volatile assets might require longer periods for optimal performance.
### Scoring System Methodology
**Entry Score Components (Minimum 13 points required)**:
1. **RSI Signals** (max 5 points):
- RSI < 30: +2 points
- RSI < 25: +2 points
- RSI turning up: +1 point
2. **MACD Signals** (max 8 points):
- MACD below zero: +1 point
- MACD turning up: +2 points
- MACD histogram improving: +2 points
- MACD bullish divergence: +3 points
3. **Price Action** (max 4 points):
- Long lower wick (>50%): +2 points
- Small body (<30%): +1 point
- Bullish close: +1 point
4. **Pattern Recognition** (max 8 points):
- RSI bullish divergence: +4 points
- Quick recovery pattern: +2 points
- Reversal confirmation: +4 points
**Exit Score Components (Minimum 13 points required)**:
Uses inverse criteria to identify swing tops with similar weighting system.
## Risk Management Features
### Position Sizing & Risk Control
- **Single Position Strategy**: 100% equity allocation per trade
- **No Overlapping Positions**: Ensures focused risk management
- **Configurable Risk/Reward**: Default 5:1 ratio optimized for volatile assets
### Stop Loss & Take Profit Logic
- **Dynamic Stop Loss**: Based on recent swing lows with configurable buffer
- **Risk-Based Take Profit**: Calculated using risk/reward ratio
- **Clean Exit Logic**: Prevents conflicting signals
## Default Settings Optimization
### Key Parameters (Optimized for MSTR/Bitcoin-style volatility):
- **Minimum Entry Score**: 13 (ensures high-conviction entries)
- **Minimum Exit Score**: 13 (prevents premature exits)
- **Risk/Reward Ratio**: 5.0 (accounts for volatility)
- **Lower Wick Threshold**: 50% (identifies true hammer patterns)
- **Divergence Lookback**: 8 bars (optimal for swing timeframes)
### Why These Defaults Work for MSTR:
1. **Higher Score Thresholds**: MSTR's volatility requires more confirmation
2. **5:1 Risk/Reward**: Compensates for wider stops needed in volatile markets
3. **Faster MACD**: Captures momentum shifts quickly in fast-moving stocks
4. **21-period RSI**: Reduces noise while maintaining sensitivity
## Visual Features
### Score Display System
- **Green Labels**: Entry scores ≥10 points (below bars)
- **Red Labels**: Exit scores ≥10 points (above bars)
- **Large Triangles**: Actual trade entries/exits
- **Small Triangles**: Reversal pattern confirmations
### Chart Cleanliness
- Indicators plotted in separate panes (MACD, RSI)
- TP/SL levels shown only during active positions
- Clear trade markers distinguish signals from actual trades
## Backtesting Specifications
### Realistic Trading Conditions
- **Commission**: 0.1% per trade
- **Slippage**: 3 points
- **Initial Capital**: $1,000
- **Account Type**: Cash (no margin)
### Sample Size Considerations
- Strategy designed for 100+ trade sample sizes
- Recommended timeframes: 4H, 1D for swing trading
- Optimal for trending/volatile markets
## Strategy Limitations & Considerations
### Market Conditions
- **Best Performance**: Trending markets with clear swings
- **Reduced Effectiveness**: Highly choppy, sideways markets
- **Volatility Dependency**: Optimized for moderate to high volatility assets
### Risk Warnings
- **High Allocation**: 100% position sizing increases risk
- **No Diversification**: Single position strategy
- **Backtesting Limitation**: Past performance doesn't guarantee future results
## Usage Guidelines
### Recommended Assets & Timeframes
- **Primary Target**: MSTR (MicroStrategy) - 5min to 15min timeframes
- **Secondary Targets**: High-volatility stocks (TSLA, NVDA, COIN, etc.)
- **Crypto Markets**: Bitcoin, Ethereum (with parameter adjustments)
- **Timeframe Optimization**: 1min-15min for scalping, 30min-1H for swing scalping
### Timeframe Recommendations
- **Primary Scalping**: 5-minute and 15-minute charts
- **Active Monitoring**: 1-minute for precise entries
- **Swing Scalping**: 30-minute to 1-hour timeframes
- **Avoid**: Sub-1-minute (excessive noise) and above 4-hour (reduces scalping opportunities)
## Technical Requirements
- **Pine Script Version**: v6
- **Overlay**: Yes (plots on price chart)
- **Additional Panes**: MACD and RSI indicators
- **Real-time Compatibility**: Confirmed bar signals only
## Customization Options
All parameters are fully customizable through inputs:
- Indicator lengths and levels
- Scoring thresholds
- Risk management settings
- Visual display preferences
- Date range filtering
## Conclusion
This scalping strategy represents a comprehensive approach to low timeframe trading that combines multiple technical analysis methods into a cohesive, quantified system specifically optimized for MSTR's unique volatility characteristics. The optimized parameters and scoring methodology provide a systematic way to identify high-probability scalping setups while managing risk effectively in fast-moving markets.
The strategy's strength lies in its objective, multi-criteria approach that removes emotional decision-making from scalping while maintaining the flexibility to adapt to different instruments through parameter optimization. While designed for MSTR, the underlying methodology can be fine-tuned for other high-volatility assets across various markets.
**Important Disclaimer**: This strategy is designed for experienced scalpers and is optimized for MSTR trading. The high-frequency nature of scalping involves significant risk. Past performance does not guarantee future results. Always conduct your own analysis, consider your risk tolerance, and be aware of commission/slippage costs that can significantly impact scalping profitability.

OBV ATR Strategy (OBV Breakout Channel) bas20230503ผมแก้ไขจาก OBV+SMA อันเดิม ของเดิม ดูที่เส้น SMA สองเส้นตัดกันมั่นห่วยแตกสำหรับที่ผมลองเทรดจริง และหลักการเบรค ได้แรงบันดาลใจ ATR จาก เทพคอย ที่ใช้กับราคา แต่นี้ใช้กับ OBV แทน
และผมใช้เจมินี้ เพื่อแก้ ให้ เป็น strategy เพื่อเช็คย้อนหลังได้ง่ายกว่าเดิม
หลักการง่ายคือถ้ามันขึ้น มันจะขึ้นเรื่อยๆ
เขียน แบบสุภาพ (น่าจะอ่านได้ง่ายกว่าผมเขียน)
สคริปต์นี้ได้รับการพัฒนาต่อยอดจากแนวคิด OBV+SMA Crossover แบบดั้งเดิม ซึ่งจากการทดสอบส่วนตัวพบว่าประสิทธิภาพยังไม่น่าพอใจ กลยุทธ์ใหม่นี้จึงเปลี่ยนมาใช้หลักการ "Breakout" ซึ่งได้รับแรงบันดาลใจมาจากการใช้ ATR สร้างกรอบของราคา แต่เราได้นำมาประยุกต์ใช้กับ On-Balance Volume (OBV) แทน นอกจากนี้ สคริปต์ได้ถูกแปลงเป็น Strategy เต็มรูปแบบ (โดยความช่วยเหลือจาก Gemini AI) เพื่อให้สามารถทดสอบย้อนหลัง (Backtest) และประเมินประสิทธิภาพได้อย่างแม่นยำ
หลักการของกลยุทธ์: กลยุทธ์นี้ทำงานบนแนวคิดโมเมนตัมที่ว่า "เมื่อแนวโน้มได้เกิดขึ้นแล้ว มีโอกาสที่มันจะดำเนินต่อไป" โดยจะมองหาการทะลุของพลังซื้อ-ขาย (OBV) ที่แข็งแกร่งเป็นพิเศษเป็นสัญญาณเข้าเทร
----
สคริปต์นี้เป็นกลยุทธ์ (Strategy) ที่ใช้ On-Balance Volume (OBV) ซึ่งเป็นอินดิเคเตอร์ที่วัดแรงซื้อและแรงขายสะสม แทนที่จะใช้การตัดกันของเส้นค่าเฉลี่ย (SMA Crossover) ที่เป็นแบบพื้นฐาน กลยุทธ์นี้จะมองหาการ "ทะลุ" (Breakout) ของพลัง OBV ออกจากกรอบสูงสุด-ต่ำสุดของตัวเองในรอบที่ผ่านมา
สัญญาณกระทิง (Bull Signal): เกิดขึ้นเมื่อพลังการซื้อ (OBV) แข็งแกร่งจนสามารถทะลุจุดสูงสุดของตัวเองในอดีตได้ บ่งบอกถึงโอกาสที่แนวโน้มจะเปลี่ยนเป็นขาขึ้น
สัญญาณหมี (Bear Signal): เกิดขึ้นเมื่อพลังการขาย (OBV) รุนแรงจนสามารถกดดันให้ OBV ทะลุจุดต่ำสุดของตัวเองในอดีตได้ บ่งบอกถึงโอกาสที่แนวโน้มจะเปลี่ยนเป็นขาลง
ส่วนประกอบบนกราฟ (Indicator Components)
เส้น OBV
เส้นหลัก ที่เปลี่ยนเขียวเป็นแดง เป็นทั้งแนวรับและแนวต้าน และ จุด stop loss
เส้นนี้คือหัวใจของอินดิเคเตอร์ ที่แสดงถึงพลังสะสมของ Volume
เมื่อเส้นเป็นสีเขียว (แนวรับ): จะปรากฏขึ้นเมื่อกลยุทธ์เข้าสู่ "โหมดกระทิง" เส้นนี้คือระดับต่ำสุดของ OBV ในอดีต และทำหน้าที่เป็นแนวรับไดนามิก
เมื่อเส้นกลายเป็นสีแดงสีแดง (แนวต้าน): จะปรากฏขึ้นเมื่อกลยุทธ์เข้าสู่ "โหมดหมี" เส้นนี้คือระดับสูงสุดของ OBV ในอดีต และทำหน้าที่เป็นแนวต้านไดนามิก
สัญลักษณ์สัญญาณ (Signal Markers):
Bull 🔼 (สามเหลี่ยมขึ้นสีเขียว): คือสัญญาณ "เข้าซื้อ" (Long) จะปรากฏขึ้น ณ จุดที่ OBV ทะลุขึ้นไปเหนือกรอบด้านบนเป็นครั้งแรก
Bear 🔽 (สามเหลี่ยมลงสีแดง): คือสัญญาณ "เข้าขาย" (Short) จะปรากฏขึ้น ณ จุดที่ OBV ทะลุลงไปต่ำกว่ากรอบด้านล่างเป็นครั้งแรก
วิธีการใช้งาน (How to Use)
เพิ่มสคริปต์นี้ลงบนกราฟราคาที่คุณสนใจ
ไปที่แท็บ "Strategy Tester" ด้านล่างของ TradingView เพื่อดูผลการทดสอบย้อนหลัง (Backtest) ของกลยุทธ์บนสินทรัพย์และไทม์เฟรมต่างๆ
ใช้สัญลักษณ์ "Bull" และ "Bear" เป็นตัวช่วยในการตัดสินใจเข้าเทรด
ข้อควรจำ: ไม่มีกลยุทธ์ใดที่สมบูรณ์แบบ 100% ควรใช้สคริปต์นี้ร่วมกับการวิเคราะห์ปัจจัยอื่นๆ เช่น โครงสร้างราคา, แนวรับ-แนวต้านของราคา และการบริหารความเสี่ยง (Risk Management) ของตัวคุณเองเสมอ
การตั้งค่า (Inputs)
SMA Length 1 / SMA Length 2: ใช้สำหรับพล็อตเส้นค่าเฉลี่ยของ OBV เพื่อดูเป็นภาพอ้างอิง ไม่มีผลต่อตรรกะการเข้า-ออกของ Strategy อันใหม่ แต่มันเป็นของเก่า ถ้าชอบ ก็ใช้ได้ เมื่อ SMA สองเส้นตัดกัน หรือตัดกับเส้น OBV
High/Low Lookback Length: (ค่าพื้นฐาน30/แก้ตรงนี้ให้เหมาะสมกับ coin หรือหุ้น ตามความผันผวน ) คือระยะเวลาที่ใช้ในการคำนวณกรอบสูงสุด-ต่ำสุดของ OBV
ค่าน้อย: ทำให้กรอบแคบลง สัญญาณจะเกิดไวและบ่อยขึ้น แต่อาจมีสัญญาณหลอก (False Signal) เยอะขึ้น
ค่ามาก: ทำให้กรอบกว้างขึ้น สัญญาณจะเกิดช้าลงและน้อยลง แต่มีแนวโน้มที่จะเป็นสัญญาณที่แข็งแกร่งกว่า
แน่นอนครับ นี่คือคำแปลฉบับภาษาอังกฤษที่สรุปใจความสำคัญ กระชับ และสุภาพ เหมาะสำหรับนำไปใช้ในคำอธิบายสคริปต์ (Description) ของ TradingView ครับ
---Translate to English---
OBV Breakout Channel Strategy
This script is an evolution of a traditional OBV+SMA Crossover concept. Through personal testing, the original crossover method was found to have unsatisfactory performance. This new strategy, therefore, uses a "Breakout" principle. The inspiration comes from using ATR to create price channels, but this concept has been adapted and applied to On-Balance Volume (OBV) instead.
Furthermore, the script has been converted into a full Strategy (with assistance from Gemini AI) to enable precise backtesting and performance evaluation.
The strategy's core principle is momentum-based: "once a trend is established, it is likely to continue." It seeks to enter trades on exceptionally strong breakouts of buying or selling pressure as measured by OBV.
Core Concept
This is a Strategy that uses On-Balance Volume (OBV), an indicator that measures cumulative buying and selling pressure. Instead of relying on a basic Simple Moving Average (SMA) Crossover, this strategy identifies a "Breakout" of the OBV from its own highest-high and lowest-low channel over a recent period.
Bull Signal: Occurs when the buying pressure (OBV) is strong enough to break above its own recent highest high, indicating a potential shift to an upward trend.
Bear Signal: Occurs when the selling pressure (OBV) is intense enough to push the OBV below its own recent lowest low, indicating a potential shift to a downward trend.
On-Screen Components
1. OBV Line
This is the main indicator line, representing the cumulative volume. Its color changes to green when OBV is rising and red when it is falling.
2. Dynamic Support & Resistance Line
This is the thick Green or Red line that appears based on the strategy's current "mode." This line serves as a dynamic support/resistance level and can be used as a reference for stop-loss placement.
Green Line (Support): Appears when the strategy enters "Bull Mode." This line represents the lowest low of the OBV in the recent past and acts as dynamic support.
Red Line (Resistance): Appears when the strategy enters "Bear Mode." This line represents the highest high of the OBV in the recent past and acts as dynamic resistance.
3. Signal Markers
Bull 🔼 (Green Up Triangle): This is the "Long Entry" signal. It appears at the moment the OBV first breaks out above its high-low channel.
Bear 🔽 (Red Down Triangle): This is the "Short Entry" signal. It appears at the moment the OBV first breaks down below its high-low channel.
How to Use
Add this script to the price chart of your choice.
Navigate to the "Strategy Tester" panel at the bottom of TradingView to view the backtesting results for the strategy on different assets and timeframes.
Use the "Bull" and "Bear" signals as aids in your trading decisions.
Disclaimer: No strategy is 100% perfect. This script should always be used in conjunction with other forms of analysis, such as price structure, key price-based support/resistance levels, and your own personal risk management rules.
Inputs
SMA Length 1 / SMA Length 2: These are used to plot moving averages on the OBV for visual reference. They are part of the legacy logic and do not affect the new breakout strategy. However, they are kept for traders who may wish to observe their crossovers for additional confirmation.
High/Low Lookback Length: (Most Important Setting) This determines the period used to calculate the highest-high and lowest-low OBV channel. (Default is 30; adjust this to suit the asset's volatility).
A smaller value: Creates a narrower channel, leading to more frequent and faster signals, but potentially more false signals.
A larger value: Creates a wider channel, leading to fewer and slower signals, which are likely to be more significant.

Timeshifter Triple Timeframe Strategy w/ SessionsOverview
The "Enhanced Timeshifter Triple Timeframe Strategy with Session Filtering" is a sophisticated trading strategy designed for the TradingView platform. It integrates multiple technical indicators across three different timeframes and allows traders to customize their trading Sessions. This strategy is ideal for traders who wish to leverage multi-timeframe analysis and session-based trading to enhance their trading decisions.
Features
Multi-Timeframe Analysis and direction:
Higher Timeframe: Set to a daily timeframe by default, providing a broader view of market trends.
Trading Timeframe: Automatically set to the current chart timeframe, ensuring alignment with the trader's primary analysis period.
Lower Timeframe: Set to a 15-minute timeframe by default, offering a granular view for precise entry and exit points.
Indicator Selection:
RMI (Relative Momentum Index): Combines RSI and MFI to gauge market momentum.
TWAP (Time Weighted Average Price): Provides an average price over a specified period, useful for identifying trends.
TEMA (Triple Exponential Moving Average): Reduces lag and smooths price data for trend identification.
DEMA (Double Exponential Moving Average): Similar to TEMA, it reduces lag and provides a smoother trend line.
MA (Moving Average): A simple moving average for basic trend analysis.
MFI (Money Flow Index): Measures the flow of money into and out of a security, useful for identifying overbought or oversold conditions.
VWMA (Volume Weighted Moving Average): Incorporates volume data into the moving average calculation.
PSAR (Parabolic SAR): Identifies potential reversals in price movement.
Session Filtering:
London Session: Trade during the London market hours (0800-1700 GMT+1).
New York Session: Trade during the New York market hours (0800-1700 GMT-5).
Tokyo Session: Trade during the Tokyo market hours (0900-1800 GMT+9).
Users can select one or multiple sessions to align trading with specific market hours.
Trade Direction:
Long: Only long trades are permitted.
Short: Only short trades are permitted.
Both: Both long and short trades are permitted, providing flexibility based on market conditions.
ADX Confirmation:
ADX (Average Directional Index): An optional filter to confirm the strength of a trend before entering a trade.
How to Use the Script
Setup:
Add the script to your TradingView chart.
Customize the input parameters according to your trading preferences and strategy requirements.
Indicator Selection:
Choose the primary indicator you wish to use for generating trading signals from the dropdown menu.
Enable or disable the ADX confirmation based on your preference for trend strength analysis.
Session Filtering:
Select the trading sessions you wish to trade in. You can choose one or multiple Sessions based on your trading strategy and market focus.
Trade Direction:
Set your preferred trade direction (Long, Short, or Both) to align with your market outlook and risk tolerance. You can use this feature to gauge the market and understand the possible directions.
Tips for Profitable and Safe Trading:
Recommended Timeframes Combination:
LT: 1m , CT: 5m, HT: 1H
LT: 1-5m , CT: 15m, HT: 4H
LT: 5-15m , CT: 4H, HT: 1W
Backtesting:
Always backtest the strategy on historical data to understand its performance under various market conditions.
Adjust the parameters based on backtesting results to optimize the strategy for your specific trading style.
Risk Management:
Use appropriate risk management techniques, such as setting stop-loss and take-profit levels, to protect your capital.
Avoid over-leveraging and ensure that you are trading within your risk tolerance.
Market Analysis:
Combine the script with other forms of market analysis, such as fundamental analysis or market sentiment, to make well-rounded trading decisions.
Stay informed about major economic events and news that could impact market volatility and trading sessions.
Continuous Monitoring:
Regularly monitor the strategy's performance and make adjustments as necessary.
Keep an eye on the results and settings for real-time statistics and ensure that the strategy aligns with current market conditions.
Education and Practice:
Continuously educate yourself on trading strategies and market dynamics.
Practice using the strategy in a demo account before applying it to live trading to gain confidence and understanding.

MÈGAS ALGO : MÈGAS Engine [STRATEGY]Overview
The MÈGAS Engine is an advanced algorithmic trading system that integrates a range of technical analysis tools to pinpoint high-probability opportunities in the market.
Key Features
Core Signal Generation:
-Structure Break Detection: Advanced breakout identification with adjustable
sensitivity controls
-Dual-Direction Analysis: Separate bullish and bearish signal parameters with customizable delta
thresholds and depth settings
-Dynamic Parameter Management: OverfitShield technology with pulsewave parameter cycling
to reduce overfitting risks
Filtering Alghoritm:
-Volatility Filter: Rogers-Satchell volatility estimation with RSI-based normalization to avoid
trading in unfavorable market conditions
-Volume Confirmation: Cumulative volume analysis ensuring adequate liquidity support for trade
entries
OverfitShield Method:
OverfitShield is a built-in function within the trading strategy designed to reduce overfitting bias by introducing parameter variability during execution. When the "variable" mode is activated, instead of relying on fixed values for key strategy parameters the system dynamically selects values from customizable ranges.
This approach mimics real-world market uncertainty and ensures that the strategy does not become overly dependent on a single optimal value found during backtesting — making it more robust across different market conditions and time periods.
Position Management
-Customizable Exit Set-up
The exit logic can be customized to 'CONTINUE', 'TAKE PROFIT', or 'TRAILING PROFIT' to suit
your trading approach and maximize performance.
-CONTINUE Mode:
This mode does not use predefined take profit levels. Instead, it remains in the market as long as the trend persists. By avoiding fixed exit points, this approach is often the most effective in backtesting, as it allows positions to run in favorable trends for longer periods.
-TAKE PROFIT Mode:
This mode allows you to set multiple grid-like take profit levels at different price points, effectively creating a multi-tier exit strategy. You can specify the number of profit levels you want, along with the percentage step between each level. This structured approach can be beneficial for capturing incremental profits in a trending market while allowing for more flexibility in trade management.
-TRAILING PROFIT Mode:
Similar to the Take Profit mode, this option allows you to set the trailing stop levels. The trailing stop moves with the market, ensuring that you lock in profits as the price continues to move in your favor. Once a profit level is hit, the trailing stop "follows" the price movement, adjusting dynamically to safeguard profits as the trade progresses.
3. Customizable Insight Alerts
Traders can configure personalized alert messages for every strategy action, including entries, exits, and profit targets. These alerts are fully compatible with TradingView's webhook system.
Advantages
Customization: Fully customizable exit set-up and alerts allow traders to tailor the strategy to their personal trading objectives.
How It Works — Step by Step
Step 1: Apply the Strategy
Open the chart for your selected symbol and timeframe. Add the MÈGAS Engine to the chart.
Step 2:Backtesting and Optimization
Run a full backtest and optimize the strategy parameters across the chosen trading pairs to:
Identify robust settings that perform consistently well
Avoid overfitting through validation techniques
Select the most profitable and stable configuration for live or forward testing.
Step 3: Review Results and Alerts
Check the backtest results on the chart and confirm that the custom alert messages are displaying as expected. This helps verify that everything is functioning correctly before moving forward.
Step 4: Configure Portfolio Management
Set up the exit logic based on your specific requirements. Tailor the exit strategy to match your trading approach, whether you prefer predefined take profit levels, trailing stops, or a trend-following method. This flexibility ensures the exit logic aligns with your overall strategy for optimal performance.
Open the strategy settings window. In the dedicated portfolio management section, choose your preferred capital allocation method based on your trading style and risk preferences. Once set, save the configuration as the default.
Step 5: Set Up Alerts
Click "Add Alert" on the strategy
-In the message field, use: {{strategy.order.comment}}
Under the Notifications tab:
-Enable Webhook URL
-Enter your external webhook address
-Click 'Create' to activate alerts for your strategy
Please Note:
The results and visualizations presented are derived from optimized backtesting iterations using historical and paid real-time market data sourced via TradingView. While these results are intended to demonstrate potential performance, they do not guarantee future outcomes or accuracy. Past performance is not indicative of future results, and all trading involves risk.
We strongly recommend that users review and adjust the Properties within the script settings to align with their specific account configurations and preferred trading platforms. This ensures that the strategy outputs are reflective of real-world conditions and enhances the reliability of the results obtained. Use this tool responsibly and at your own risk.

RSI Divergence StrategyOverview
The RSI Divergence Strategy Indicator is a trading tool that uses the RSI and divergences created to generate high-probability buy and sell signals.
I have provided the best formula of numbers to use for BTC on a 30 minute timeframe.
You can change where on RSI you enter and exit both long or short trades. This way you can experiment on different tokens using different entry/exit points. Can use on multiple timeframes.
This strategy is designed to open and close long or short trades based on the levels you provide it. You can then check on the RSI where the best levels are for each token you want to trade and amend it as required to generate a profitable strategy.
How It Works
The RSI Divergence Strategy Indicator uses bear and bull divergences in conjuction with a level you have input on the RSI.
RSI for Overbought/Oversold:
• Input variables for entry and exit levels and when the entry levels combine with a bear or bull divergence signal, a trade is alerted.
RSI Divergence:
• Buy and sell signals are confirmed when the RSI creates bearish or bullish divergences and these divergences are in the same area as your levels you input for entry to short or long.
After 7 years of experience and testing I have calculated the exact numbers required and produced a formula to calculate the exact input variables for a 30 minute Bitcoin chart.
Key Features
1️⃣ Divergence Identification – Ensures trades are taken only when a bull or bear divergence has formed.
2️⃣ Overbought/Oversold Input Filtering – Set up your own variables on the RSI for different markets after identifying patterns on the RSI in relation to a bearish or bullish divergence.
3️⃣ Works on any chart – Suitable for all markets and timeframes once you input the correct variables for entry and exit levels.
How to Use
🟢 Basic Trading:
• Use on any timeframe.
• Enter trade only when alert has fired off. Close when it says to exit.
• Change entry and exit levels in the properties of the strategy indicator.
• Make entry and exit levels coincide with bearish or bullish divergences on the RSI.
Check the strategy tester to see backtesting so you know if the indicator is profitable or not for that market and timeframe as each crypto token is different and so is the timeframe you choose.
📢 Webhook Automation:
• Set up TradingView Alerts to auto-execute trades via Webhook-compatible platforms.
Key additions for divergence visualization:
Divergence Arrows:
Bullish divergence: Green label with white 'bull ' text
Bearish divergence: Red label with white 'bear' text
Positioned at the pivot point
Divergence Lines:
Connects consecutive RSI pivot points
Automatically drawn between consecutive pivot points
Enhanced RSI Coloring:
Overbought zone: Red
Oversold zone: Green
Neutral zone: Gray
The visualization helps you instantly spot:
Where divergences are forming on the RSI
The pattern of higher lows (bullish) or lower highs (bearish)
Contextual coloring of RSI relative to standard levels
All divergence markers appear at the correct historical pivot points, making it easy to visually confirm divergence patterns as they develop.
Strategy levels and background zones also shown to help visual look.
Why This Combination?
This indicator is just a simple RSI tool.
It is designed to filter out weak trades and only execute trades that have:
✅ RSI Divergence
✅ Overbought or Oversold Conditions
It does not calculate downtrends or bear markets so care is recommended taking long trades during these times.
Why It’s Worth Using?
📈 Open Source – Free to use and learn from.
📉 Long or Short Term Trading Style – Entry/Exit parameters options are designed for both short or long term trades allowing you to experiment until you find a profitable strategy for that market you want to trade.
📢 Seamless Webhook Automation – Execute trades automatically with TradingView alerts.
💲 Ready to trade smarter?
✅ Add the RSI Divergence Strategy Indicator to your TradingView chart.

Zero Lag MACD + Kijun-sen + EOM StrategyThis strategy offers a robust approach to identifying high-probability trading opportunities in the fast-paced cryptocurrency markets, particularly on lower timeframes (e.g., 5-minute). It leverages the synergistic power of three distinct indicators to confirm entries, ensuring a disciplined approach to risk management.
Key Components:
Zero Lag MACD Enhanced Version 1.2: This core momentum indicator is used to identify precise shifts in trend and momentum, offering reduced lag compared to traditional MACD. Entry signals are filtered based on the histogram's position (below for buys, above for sells) to enhance signal reliability.
Kijun-sen (Ichimoku Cloud): Acting as a dynamic support/resistance and trend filter, the Kijun-sen line confirms the prevailing market direction. Long entries are confirmed when price is above Kijun-sen, and short entries when price is below.
Ease of Movement (EoM): This volume-based oscillator provides crucial confirmation of price movements by measuring the ease with which price changes. Positive EoM confirms buying pressure, while negative confirms selling pressure, adding an essential layer of validation to trade setups.
How it Works:
The strategy generates entry signals only when all three indicators align simultaneously:
For Long Entries: A Zero Lag MACD buy signal (crossover below histogram) must coincide with price trading above the Kijun-sen, and the Ease of Movement indicator being above its zero line.
For Short Entries: A Zero Lag MACD sell signal (crossover above histogram) must coincide with price trading below the Kijun-sen, and the Ease of Movement indicator being below its zero line.
Entries are executed at the open of the candle immediately following the signal confirmation.
Risk Management:
Disciplined risk management is paramount to this strategy:
Dynamic Stop-Loss: An Average True Range (ATR) based stop-loss is implemented, set at 2.5 times the current ATR. This adapts the stop-loss distance to market volatility, ensuring sensible risk sizing.
Fixed Take-Profit: A consistent Risk-to-Reward (R:R) ratio of 1:1.2 is applied for all trades, promoting stable profit realization.
Customization & Optimization:
The strategy is built with fully customizable input parameters for each indicator (MACD lengths, Kijun-sen period, ATR period, ATR multiplier, and Risk-to-Reward ratio). This allows users to fine-tune the strategy for different assets, timeframes, and market conditions, facilitating robust backtesting and optimization.
Disclaimer: Trading involves substantial risk and is not suitable for all investors. Past performance is not indicative of future results. This strategy is provided for educational and informational purposes only. Always use proper risk management and conduct your own due diligence.

Volatility Bias ModelVolatility Bias Model
Overview
Volatility Bias Model is a purely mathematical, non-indicator-based trading system that detects directional probability shifts during high volatility market phases. Rather than relying on classic tools like RSI or moving averages, this strategy uses raw price behavior and clustering logic to determine potential breakout direction based on recent market bias.
How It Works
Over a defined lookback window (default 10 bars), the strategy counts how many candles closed in the same direction (i.e., bullish or bearish).
Simultaneously, it calculates the price range during that window.
If volatility is above a minimum threshold and a clear directional bias is detected (e.g., >60% of closes are bullish), a trade is opened in the direction of that bias.
This approach assumes that when high volatility is coupled with directional closing consistency, the market is probabilistically more likely to continue in that direction.
ATR-based stop-loss and take-profit levels are applied, and trades auto-exit after 20 bars if targets are not hit.
Key Features
- 100% non-indicator-based logic
- Statistically-driven directional bias detection
- Works across all timeframes (1H, 4H, 1D)
- ATR-based risk management
- No pyramiding, slippage and commissions included
- Compatible with real-world backtesting conditions
Realism & Assumptions
To make this strategy more aligned with actual trading environments, it includes 0.05% commission per trade and a 1-point slippage on every entry and exit.
Additionally, position sizing is set at 10% of a $10,000 starting capital, and no pyramiding is allowed.
These assumptions help avoid unrealistic backtest results and make the performance metrics more representative of live conditions.
Parameter Explanation
Bias Window (10 bars): Number of past candles used to evaluate directional closings
Bias Threshold (0.60): Required ratio of same-direction candles to consider a bias valid
Minimum Range (1.5%): Ensures the market is volatile enough to avoid noise
ATR Length (14): Used to dynamically define stop-loss and target zones
Risk-Reward Ratio (2.0): Take-profit is set at twice the stop-loss distance
Max Holding Bars (20): Trades are closed automatically after 20 bars to prevent stagnation
Originality Note
Unlike common strategies based on oscillators or moving averages, this script is built on pure statistical inference. It models the market as a probabilistic process and identifies directional intent based on historical closing behavior, filtered by volatility. This makes it a non-linear, adaptive model grounded in real-world price structure — not traditional technical indicators.
Disclaimer
This strategy is for educational and experimental purposes only. It does not constitute financial advice. Always perform your own analysis and test thoroughly before applying with real capital.