Buying Climax + Spring [Darwinian]Buying Climax + Spring Indicator
Overview
Advanced Wyckoff-based indicator that identifies potential market reversals through **Buying Climax** patterns (exhaustion tops) and **Spring** patterns (accumulation bottoms). Designed for traders seeking high-probability reversal signals with strict uptrend validation.
---
Method
🔴 Buying Climax Detection
Identifies exhaustion patterns at market tops using multi-condition analysis:
**Base Buying Climax (Red Triangle)**
- Volume spike > 1.8x average
- Range expansion > 1.8x average
- New 20-bar high reached
- Close finishes in lower 30% of bar range
- **Strict uptrend validation**: Price must be 30%+ above 20-day low
**Enhanced Buying Climax (Maroon Triangle)**
- All Base BC conditions PLUS:
- Gap up from previous high
- Intraday fade (close < open and below midpoint)
- **Higher confidence reversal signal**
🟢 Wyckoff Spring Detection
Identifies accumulation patterns at support levels:
- Price breaks below recent pivot low (false breakdown)
- Close recovers above pivot level (rejection)
- Occurs at trading range low
- Optional volume confirmation (1.5x+ average)
- Limited to 3 attempts per pivot (prevents over-signaling)
✅ Uptrend Validation Filter
**Four-condition composite filter** prevents false signals in sideways/downtrending markets:
1. Close-to-close rise ≥ 5% over lookback period
2. Price structure: Close > MA(10) > MA(20)
3. Swing low significantly below current price
4. **Primary requirement**: Current high ≥ 30% above 20-day low
---
Input Tuning Guide
Buying Climax Settings:
**Volume & Range Thresholds**
- `Volume Spike Threshold`: Default 1.8x
- Lower (1.5x) = More signals, more noise
- Higher (2.0-2.5x) = Fewer but stronger exhaustion signals
- `Range Spike Threshold`: Default 1.8x
- Adjust parallel to volume threshold
- Higher values = extreme volatility required
**Pattern Detection**
- `New High Lookback`: Default 20 bars
- Shorter (10-15) = Recent highs only
- Longer (30-50) = Major breakout detection
- `Close Off High Fraction`: Default 0.3 (30%)
- Lower (0.2) = Stricter rejection requirement
- Higher (0.4-0.5) = Allow weaker intraday fades
- `Gap Threshold`: Default 0.002 (0.2%)
- Increase (0.005-0.01) for stocks with wider spreads
- Decrease (0.001) for tight-spread instruments
- `Confirmation Window`: Default 5 bars
- Shorter (3) = Faster confirmation, more false positives
- Longer (7-10) = Wait for deeper automatic reaction
Uptrend Filter Settings
**Critical for Signal Quality**
- `Minimum Rise from 20-day Low`: Default 0.30 (30%)
- **Most important parameter**
- Lower (0.20-0.25) = More signals in moderate uptrends
- Higher (0.40-0.50) = Only extreme parabolic moves
- `Pole Lookback`: Default 30 bars
- Shorter (20) = Recent momentum focus
- Longer (40-50) = Longer-term trend validation
- `Minimum Rise % for Pole`: Default 0.05 (5%)
- Adjust based on market volatility
- Higher in strong bull markets (7-10%)
Wyckoff Spring Settings
- `Pivot Length`: Default 6 bars
- Shorter (3-4) = More frequent pivots, more signals
- Longer (8-10) = Major support/resistance only
- `Volume Threshold`: Default 1.5x
- Higher (1.8-2.0x) = Stronger conviction required
- Disable volume requirement for low-volume stocks
- `Trading Range Period`: Default 20 bars
- Match to consolidation timeframe being traded
- Shorter (10-15) for intraday patterns
- Longer (30-40) for weekly consolidations
---
Recommended Workflow
1. **Start with defaults** on daily timeframe
2. **Adjust uptrend filter** first (30% rise parameter)
- Too many signals? Increase to 35-40%
- Too few? Decrease to 25%
3. **Fine-tune volume/range multipliers** based on instrument volatility
4. **Enable alerts** for real-time monitoring:
- Base BC → Initial warning
- Enhanced BC → High-priority reversal
- Confirmed BC (AR) → Strong follow-through
- Spring → Accumulation opportunity
---
Alert System
- **Base Buying Climax**: Standard exhaustion pattern detected
- **Enhanced BC (Gap+Fade)**: Higher confidence reversal setup
- **Confirmed BC (AR)**: Automatic reaction validated (price drops below BC midline)
- **Wyckoff Spring**: Accumulation pattern at support
---
Best Practices
- Combine with support/resistance analysis
- Watch for BC clusters (multiple timeframes)
- Spring patterns work best after Buying Climax distribution
- Backtest parameters on your specific instruments
- Higher timeframes (daily/weekly) = higher reliability
---
Technical Notes
- Built with Pine Script v6
- No repainting (signals finalize on bar close)
- Minimal CPU usage (optimized calculations)
- Works on all timeframes and instruments
- Overlay indicator (displays on price chart)
---
*Indicator follows classical Wyckoff methodology with modern volatility filters*
Cerca negli script per "top"

N Order EMAThe exponential moving average is one of the most fundamental tools in technical analysis, but its implementation is almost always locked to a single mathematical approach. I've always wanted to extend the EMA into an n-order filter, and after some time working through the digital signal processing mathematics, I finally managed to do it. This indicator takes the familiar EMA concept and opens it up to four different discretization methods, each representing a valid way to transform a continuous-time exponential smoother into a discrete-time recursive filter. On top of that, it includes adjustable filter order, which fundamentally changes the frequency response characteristics in ways that simply changing the period length cannot achieve.
The four discretization styles are impulse-matched, all-pole, matched z-transform, and bilinear (Tustin). The all-pole version is exactly like stacking multiple EMAs together but implemented in a single function with proper coefficient calculation. It uses a canonical form where you get one gain coefficient and the rest are zeros, with the feedback coefficients derived from the binomial expansion of the pole polynomial. The other three methods are attempts at making generalizations of the EMA in different ways. Impulse-matched creates the filter by matching the discrete-time impulse response to what the continuous EMA would produce. Matched z-transform directly maps the continuous poles to the z-domain using the exponential relationship. Bilinear uses the Tustin transformation with frequency prewarping to ensure the cutoff frequency is preserved despite the inherent warping of the mapping.
Honestly, they're all mostly the same in practice, which is exactly what you'd expect since they're all valid discretizations of the same underlying filter. The differences show up in subtle ways during volatile market conditions or in the exact phase characteristics, but for most trading applications the outputs will track each other closely. That said, the bilinear version works particularly well at low periods like 2, where other methods can sometimes produce numerical artifacts. I personally like the z-match for its clean frequency-domain properties, but the real point here is demonstrating that you can tackle the same problem from multiple mathematical angles and end up with slightly different but equally valid implementations.
The order parameter is where things get interesting. A first-order EMA is the standard single-pole recursive filter everyone knows. When you move to second-order, you're essentially cascading two filter sections, which steepens the roll-off in the frequency domain and changes how the filter responds to sudden price movements. Higher orders continue this progression. The all-pole style makes this particularly clear since it's literally stacking EMA operations, but all four discretization methods support arbitrary order. This gives you control over the aggressiveness of the smoothing that goes beyond just adjusting the period length.
On top of the core EMA calculation, I've included all the standard variants that people use for reducing lag. DEMA applies the EMA twice and combines the results to get faster response. TEMA takes it further with three applications. HEMA uses a Hull-style calculation with fractional periods, applying the EMA to the difference between a half-period EMA and a full-period EMA, then smoothing that result with the square root of the period. These are all implemented using whichever discretization method you select, so you're not mixing different mathematical approaches. Everything stays consistent within the chosen framework.
The practical upside of this indicator is flexibility for people building trading systems. If you need a moving average with specific frequency response characteristics, you can tune the order parameter instead of hunting for the right period length. If you want to test whether different discretization methods affect your strategy's performance, you can swap between them without changing any other code. For most users, the impulse-matched style at order 1 will behave almost identically to a standard EMA, which gives you a familiar baseline to work from. From there you can experiment with higher orders or different styles to see if they provide any edge in your particular market or timeframe.
What this really highlights is that even something as seemingly simple as an exponential moving average involves mathematical choices that usually stay hidden. The standard EMA formula you see in textbooks is already a discretized version of a continuous exponential decay, and there are multiple valid ways to perform that discretization. By exposing these options, this indicator lets you explore a parameter space that most traders never even know exists. Whether that exploration leads to better trading results is an empirical question that depends on your strategy and market, but at minimum it's a useful reminder that the tools we take for granted are built on arbitrary but reasonable mathematical decisions.

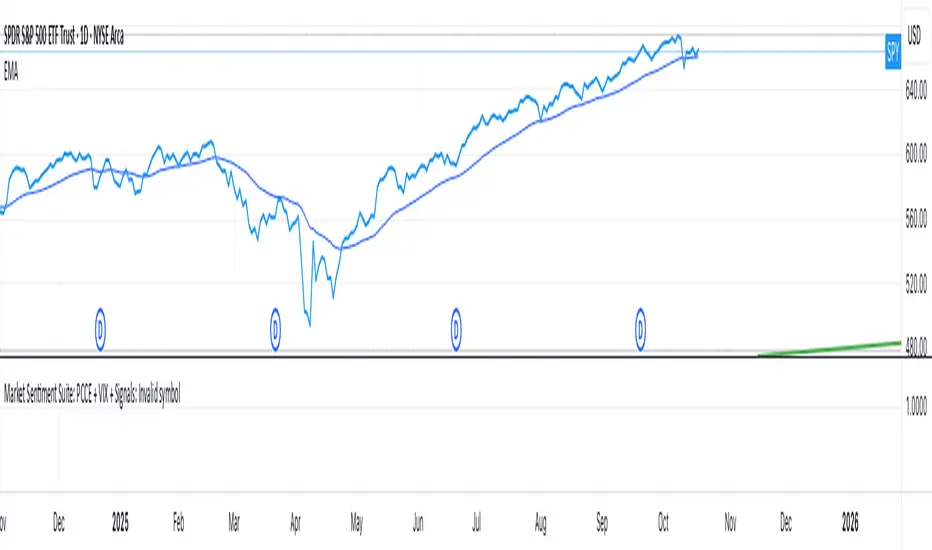
Market Sentiment Suite: PCCE + VIX + Signals📊 Market Sentiment Suite: PCCE + VIX + Signals
Identify fear, greed, and turning points in the market.
This script combines the CBOE Put/Call Ratio (PCCE) with the VIX volatility index percentile to visualize crowd sentiment and highlight potential market tops and bottoms.
🔍 Key Features
Dual-indicator design: PCCE + normalized VIX percentile
Color-coded zones for Greed (<0.6) and Fear (>1.2)
Automatic alert signals when sentiment reaches extremes
Live sentiment table displaying real-time PCCE and VIX data
Works seamlessly on SPX, SPY, QQQ, or any major index
🧠 How to Use
When PCCE > 1.2 and VIX percentile > 80%, fear is extreme → possible market bottom
When PCCE < 0.6 and VIX percentile < 20%, greed is extreme → possible market top
Perfect for contrarian traders, sentiment analysts, and swing traders
✨ Best Timeframe: Daily
⚙️ Markets: SPX / SPY / QQQ / Global Indexes
📈 Type: Contrarian Sentiment Indicator
Tristan's Devil Mark (Short / Long, with W%R)The Devil’s Mark indicator is a visual tool designed to help traders identify potential short and long opportunities based on candle structure and market momentum. It combines price action analysis with the Williams %R (W%R) oscillator to highlight candles with high potential for reversal or continuation.
Can be used on any timeline, from scalping day trades to swing trades on daily and higher timelines. Know that the higher the timeline the less likely the indicator will show. (Asia and London sessions tend to show many indicators. I find this more useful for NY session.)
How the script works
Candle Structure Conditions
Short (Sell) Wedge: Plotted above green candles that have no bottom wick, indicating that inside that candle there was strong upward momentum without downside hesitation .
Long (Buy) Wedge: Plotted below red candles that have no top wick, indicating that inside that candle there was strong downward momentum without upside hesitation .
These candles are visually emphasized as wedges to mark potential turning points.
Williams %R Filter
The indicator uses Williams %R to measure overbought and oversold conditions:
Proximity to 0 (nearZeroThresh): Determines how close W%R must be to 0 (overbought) to trigger a Sell Wedge. This acts as a “Sell sensitivity” filter.
Proximity to -100 (nearHundredThresh): Determines how close W%R must be to -100 (oversold) to trigger a Buy Wedge. This acts as a “Buy sensitivity” filter.
When the candle meets both the candle structure and the W%R condition, the wedge is plotted in purple (“Within W%R Range”).
When the "ignore W%R filter" toggle is on, all eligible candles are plotted regardless of W%R. Wedges that normally would not meet W%R criteria are plotted in light purple (“Outside W%R Range”) to distinguish them. #YOLO (🚫 I recommend leaving "Ignore W%R Filter" OFF)
Settings Explained
Williams %R Length: The number of bars used to calculate the W%R oscillator. Shorter lengths make it more sensitive; longer lengths smooth the readings.
Proximity to 0 / 100: Controls how “strict” the indicator is in requiring overbought or oversold W%R conditions to trigger. Lower values mean closer to extreme zones, higher values are more permissive.
Ignore W%R Toggle: Option to show Devil’s Marks on every eligible candle regardless of W%R. Useful for visualizing purely price-action-based signals.
What the trader sees
Purple wedges: Candles meeting both candle structure and W%R conditions.
Light purple wedges: Candles meeting candle structure but ignored W%R (when toggle is on). #YOLO (🚫 I recommend leaving "Ignore W%R Filter" OFF)
Short opportunities are wedges above bars (green candles with no bottom wick).
Long opportunities are wedges below bars (red candles with no top wick).
Trading Insight
The Devil’s Mark is a momentum and reversal alert tool:
Look for purple downward-pointing wedges when W%R is near overbought. This is a potential shorting opportunity. Buying at the close of that candle may improve your short trades.
Look for purple upward-pointing wedges when W%R is near oversold. This is a potential
long opportunity. Buying at the close of that candle may improve your long trades.
Light purple wedges show the same price-action cues without W%R confirmation—useful for aggressive traders who want every potential setup. #YOLO #YMMV #noFullPort
Settings / Security
The “Output values” checkbox appears for each plotted series (like a plot or plotshape) and controls whether the series will also be exposed numerically in the Data Window or used by other indicators/scripts.
Here’s what it means in practice:
1. Checked (true)
The series values (like candle high, low, or any computed value) are exported to the Data Window and can be read by other scripts using request.security() or ta functions.
Example: You can see the exact numerical value of each plotted point in the Data Window when you hover over the chart.
Useful if you want to backtest or reference these plotted values programmatically.
2. Unchecked (false)
The series is plotted visually only.
The numeric values are hidden from the Data Window and cannot be accessed by other scripts.
Makes the chart cleaner if you don’t need the numeric outputs.

BTC Flow Dashboard : Spot Premium + OI + Funding + Cycle SignalsSpot Premium vs Perpetual Basket (%):
Tracks how aggressively perps are trading relative to spot, a leading indicator of speculative activity and leverage buildup.
Aggregated Open Interest Z-Score:
A normalized view of OI expansion/contraction across major exchanges (Binance, BitMEX, Bybit, Kraken, etc.), highlighting when leverage enters overheated zones.
Composite Funding Rate Analysis:
Calculates a TWAP-smoothed funding composite across major venues, with optional APR scaling, showing where perpetual markets are paying for long or short exposure.
Confluence Signal Engine:
Dynamically flags bullish or bearish market conditions based on premium behavior and leverage environment — including over-leverage warnings that often precede volatility spikes.
Extreme Cycle Tops & Bottoms (Experimental):
Optional signal module that highlights historically significant extremes (e.g., 2020 bottom or 2021 top) based on statistical Z-score thresholds across the three core metrics.
Notes & Tips
Works best on weekly or monthly timeframes for macro cycle analysis.
Daily and 3D views provide short-term leverage context but may produce more frequent signals.
The Extreme Signal Engine is experimental — not a trading signal on its own, but a contextual tool to support macro decision-making.

MACD-V Adaptive FluxProMACD-V Adaptive FluxPro
Type: Multi-Factor Volatility-Normalized Momentum & Regime Framework
Overlay: ✅ Yes (on price chart)
Purpose: Detect high-probability trend continuation or reversal zones through volatility-adjusted momentum, VWAP structure, and adaptive filters.
🧩 Concept Overview
MACD-V Adaptive FluxPro is a next-generation, multi-factor analytical framework that merges the principles of Linda Raschke’s 3-10-16 MACD with modern volatility normalization and adaptive filtering.
Instead of generating raw buy/sell signals, it builds a probability-driven environment model — showing when price action, volatility, and structure align for high-confidence trades.
The “V” in MACD-V stands for Volatility Normalization: every MACD component is divided by ATR to stabilize amplitude across fast or slow markets.
This enables the indicator to remain consistent across timeframes, instruments, and volatility regimes.
⚙️ Core Components
1️⃣ Volatility-Normalized MACD (MACD-V)
A traditional MACD built on Linda Raschke’s 3-10-16 structure, but adjusted by ATR to create a volatility-invariant momentum profile.
You can toggle to alternative presets (Scalp / Swing / Trend) for faster or slower environments.
2️⃣ Dynamic Regime Detection
A slope-based classifier that identifies whether the market is:
Trend Up 🟢
Trend Down 🔴
Compression / Squeeze 🟧
Transition / Neutral ⚫
The background color updates dynamically as momentum, volatility, and slope shift between these states.
3️⃣ VWAP Structure Bands
Adaptive VWAP with inner and outer ATR-scaled envelopes.
These act as short-term mean-reversion and breakout zones.
The indicator can optionally gate entries to occur only within defined VWAP proximity.
4️⃣ EMAs for Micro-Trend Confirmation
Includes 9-EMA and 21-EMA, color-configurable for visual crossovers and short-term momentum bias.
5️⃣ Multi-Timeframe Confirmation Tiles
Top-center dashboard tiles display directional bias from higher timeframes (e.g., 15m / 1h / 4h).
When all align, it confirms multi-frame trend coherence.
6️⃣ Adaptive Probability Engine
All subsystems — MACD-V, slope, compression, volume z-score, and VWAP distance — feed into a logistic scoring model that outputs a real-time AOI Probability (0-100%).
When conditions align, probabilities rise above 60% (long bias) or drop below 40% (short bias).
These are your high-probability “Areas of Interest.”
7️⃣ Dashboard HUD
The top-right status console provides a one-glance view of system state:
Field Meaning
AOI Prob Long Real-time probability of bullish bias
Regime Market state (Trend, Transition, Compression)
Risk Gate ATR-based volatility filter
News Mute Manual toggle for event-risk suppression
ATR (≈ risk) Real-time volatility readout
Status ✅ Trading OK / 🧱 Risk Gate / 🔇 News Mute / 🟧 Compression
🎯 Interpretation Guide
Visual Meaning
🟢 Green background Confirmed uptrend regime
🔴 Red background Confirmed downtrend regime
🟧 Orange background Volatility compression (squeeze forming)
⚫ Gray background Transitional / indecisive structure
Teal % (AOI Prob Long) Bullish probability > 60%
Arrows Optional: appear only when all gates align (rare, filtered signals)
🧮 Mathematical Notes
MACD-V = (EMA_fast(src) − EMA_slow(src)) / ATR(n)
Normalized score is smoothed, scaled 0–100 via logistic curve
Slope = Δ(EMA(src, n)) / ATR(n)
Probabilities gated by:
Minimum slope magnitude (minAbsSlope)
VWAP proximity (maxVWAPDistATR)
Multi-TF agreement
Cooldown interval (cooldownBars)
ATR-based risk gate
No repainting — all calculations use barstate.isconfirmed.
⚡ Use Cases
✅ Identify trend regime changes before major expansions
✅ Filter breakout vs. compression setups
✅ Quantify volatility conditions before entries
✅ Confirm multi-timeframe alignment
✅ Serve as a visual regime map for automated systems or discretionary traders
🧠 Recommended Presets
Market Type Setting Preset Behavior
Index Futures (ES/NQ) LBR 3-10-16 SMA (default) Classic swing/momentum balance
Scalping (1m–5m) Fast Adaptive Higher frequency, shorter cooldown
Swing Trading (1h–4h) Smooth ATR Broader, trend-only signals
Trend-Following Futures Wide ATR Bands Filters noise, favors strong continuation
⚠️ Notes
Non-repainting, bar-confirmed calculations
Signal arrows are optional and rare — intended for precision setups
ATR and slope thresholds should be tuned per instrument
Compatible with all TradingView markets and resolutions
🏁 Summary
“MACD-V Adaptive FluxPro” is not a simple MACD — it’s a volatility-normalized market state engine that adapts to changing conditions.
It fuses Linda Raschke’s timeless MACD logic with modern volatility, slope, and multi-timeframe analytics — giving you a live market dashboard that tells you when not to trade just as clearly as when you should.

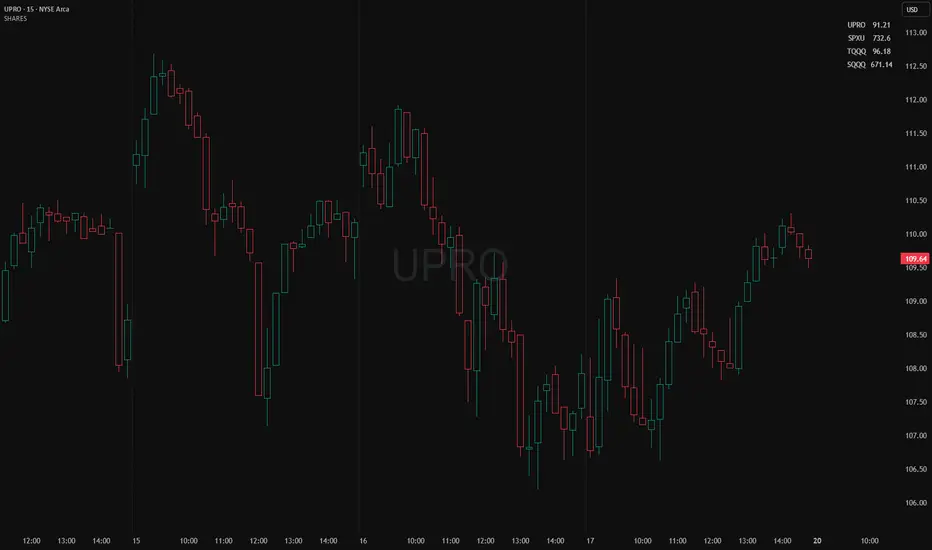
Position Size ToolPosition Size Tool
What it does:
Shows a small on-chart table that converts per-ticker dollar amounts into share counts (shares = amount ÷ current price) for up to 4 configurable tickers.
Inputs (indicator settings)
Ticker 1–4 — select the symbol (TradingView will show the exchange-qualified form like BATS:TQQQ in the settings).
Ticker N $ Amount — dollar amount to convert into shares for that ticker.
Show Ticker N — toggle each row on/off.
Table Text Color — color of the table text.
Table Position — screen location (Top/ Middle/ Bottom × Left/Center/Right).
Font Size — Small / Medium / Large.
Show Empty Top Row — optional spacer row.
What the table displays
Left column: the ticker symbol only (the script strips the exchange prefix for display, so BATS:TQQQ appears as TQQQ in the table).
Right column: the calculated share count, formatted to two decimal places (or "—" if price is not available or zero).
Table updates on the chart’s timeframe using live/last bar prices.
How to use
Add the indicator to a chart.
Open the indicator’s settings panel.
In Ticker 1–4, type/select the symbols you want (you may see the exchange prefix there; that’s TradingView’s UI).
Enter the dollar amounts for each ticker.
Use Show Ticker N to hide/show rows.
Adjust text color, font size, and table position as desired.
Notes
The settings field will always show the exchange-qualified symbol (TradingView behavior); the script strips the exchange only for the on-chart display.
If the selected symbol has no price data on the chart/timeframe, the table shows "—".
Shares are computed as amt ÷ current close from the requested symbol and timeframe.
Example of how to use this tool:
Monitor an index and execute trades on leveraged derivative products. This tool will determine the quantity of shares that can be purchased with a pre-determined dollar amount. Ex: Monitor SPX for entry/exit signals and execute trades on UPRO/SPXU/SPXL/SPXS.
Input a ticker and a dollar amount for position size, shares that can be purchased will be calculated based on the current asset price.
This tool can be helpful for those that use multiple platforms simultaneously to monitor and execute trades.
Jensen Alpha RS🧠 Jensen Alpha RS (J-Alpha RS)
Jensen Alpha RS is a quantitative performance evaluation tool designed to compare multiple assets against a benchmark using Jensen’s Alpha — a classic risk-adjusted return metric from modern portfolio theory.
It helps identify which assets have outperformed their benchmark on a risk-adjusted basis and ranks them in real time, with optional gating and visual tools. 📊
✨ Key Features
• 🧩 Multi-Asset Comparison: Evaluate up to four assets simultaneously.
• 🔀 Adaptive Benchmarking: TOTALES mode uses CRYPTOCAP:TOTALES (total crypto market cap ex-stablecoins). Dynamic mode automatically selects the strongest benchmark among BTC, ETH, and TOTALES based on rolling momentum.
• 📐 Jensen’s Alpha Calculation: Uses rolling covariance, variance, and beta to estimate α, showing how much each asset outperformed its benchmark.
• 📈 Z-Score & Consistency Metrics: Z-Score highlights statistical deviations in alpha; Consistency % shows how often α has been positive over a chosen window.
• 🚦 Trend & Zero Gates: Optional filters that require assets to be above EMA (trend) and/or have α > 0 for confirmation.
• 🏆 Leaders Board Table: Displays α, Z, Rank, Consistency %, and Gate ✓/✗ for all assets in a clear visual layout.
• 🔔 Dynamic Alerts: Get notified whenever the top alpha leader changes on confirmed (non-repainting) data.
• 🎨 Visual Enhancements: Smooth α with an SMA or color bars by the current top-performing asset.
🧭 Typical Use Cases
• 🔄 Portfolio Rotation & Relative Strength: Identify which assets consistently outperform their benchmark to optimize capital allocation.
• 🧮 Alpha Persistence Analysis: Gauge whether a trend’s performance advantage is statistically sustainable.
• 🌐 Market Regime Insight: Observe how asset leadership rotates as benchmarks shift across market cycles.
⚙️ Inputs Overview
• 📝 Assets (1–4): Select up to four tickers for evaluation.
• 🧭 Benchmark Mode: Choose between static TOTALES or Dynamic auto-selection.
• 📏 Alpha Settings: Adjustable lookback, smoothing, and consistency windows.
• 🚦 Gates: Optional trend and alpha filters to refine results.
• 🖥️ Display: Enable/disable table and customize colors.
• 🔔 Alerts: Toggle notifications on leadership changes.
🔎 Formula Basis
Jensen’s Alpha (α) is estimated as:
α = E − β × E
where β = Cov(Ra, Rb) / Var(Rb), and Ra/Rb represent asset and benchmark returns, respectively.
A positive α indicates outperformance relative to the risk-adjusted benchmark expectation. ✅
⚠️ Disclaimer
This script is for educational and analytical purposes only.
It is NOT a signal. 🚫📉
It does not constitute financial advice, trading signals, or investment recommendations. 💬
The author is not responsible for any financial losses or trading decisions made based on this indicator. 🙏
Always perform your own analysis and use proper risk management. 🛡️

Ripster Labels + Air Gaps (v6)What it shows (on one chart)
EMA Clouds (current timeframe)
Plots EMA 8/12/21/34/50/200 with three cloud fills:
12–21 = “fast” cloud
34–50 = “mid” cloud
50–200 = “base” cloud
Cloud color: green when the faster EMA is above the slower (bullish), red/maroon/orange when below (bearish).
Toggle lines vs. clouds via A) EMA Clouds settings.
MTF Rails (higher-TF EMAs)
For three higher timeframes (defaults 30m / 60m / 240m), draws two EMAs each (defaults 34 & 50).
These are stepline-like rails you can visually use as higher-TF supports/resistances.
Configure in B) MTF Rails (turn on/off, change TFs/lengths/colors).
Relative Volume Box (RVol)
Small table (top-center) showing:
Candle Vol (formatted K/M/B if enabled)
RVol = current bar volume / SMA 20 of volume (as a %)
Color scale: blue (<100%), yellow (100–150%), red (>150%).
Settings in C) RVol Box.
DTR vs ATR Box
Daily True Range (DTR = day high − day low) vs ATR(14) on the daily timeframe, with DTR as % of ATR.
Placed at top-right; toggle in D) DTR/ATR Box.
Ripster Trend Label (10m 12/50)
Looks at a separate timeframe (default 10m): EMA 12 vs EMA 50.
Bottom-right table cell shows “10m Trend ↑/↓/Sideways” (green/red/gray).
Configure in E) Ripster Trend Labels (TF and lengths).
Air Gaps (single EMA per TF)
Three horizontal, auto-extending lines showing an EMA from 30m / 60m / 240m (default length 12).
“Air gaps” are the price spaces between these lines—often lighter-resistance zones for price.
Start point logic:
All Bars = draw from the chart’s left
Start of Day = draw from today’s first bar
Bars Offset = draw from N bars back (default 100)
Settings in F) Air Gaps (TFs, length, draw-from, bars-back).
Inputs & where to tweak
A) EMA Clouds
Show EMA Clouds: master toggle
Source: close (default)
Lengths: 8/12/21/34/50/200
Show EMA lines: toggle plotted lines (clouds remain)
B) MTF Rails
Show MTF Rails
TF1/TF2/TF3 (defaults 30/60/240)
EMA A/B (defaults 34/50)
C) RVol Box
Show box
Format as K/M/B: K=1e3, M=1e6, B=1e9
D) DTR/ATR Box
Show DTR/ATR
ATR len: default 14 (daily)
E) Ripster Trend Labels
Show labels
Trend TF: default 10 (10-minute)
Trend EMA Fast/Slow: default 12/50
F) Air Gaps
Show Air Gap lines
TF1/TF2/TF3 (30/60/240)
EMA length: default 12
Draw from: All Bars | Start of Day | Bars Offset
Bars back: used if Draw from = Bars Offset
How it makes decisions
Cloud bias = sign of (faster EMA − slower EMA) for each cloud pair.
Example: 12>21 → fast cloud is bullish (green); 34>50 → mid cloud bullish (teal).
10m trend label = sign of (EMA12−EMA50) on the Trend TF (default 10m).
RVol = volume / sma(volume, 20); formatted as a percent and color-coded.
Practical read of the screen
Fast cloud flips (12/21) often mark short-term momentum changes; mid cloud flips (34/50) reflect swing bias.
Air Gap lines from higher TFs frequently act as support/resistance. Larger spaces between lines = “air gaps” where price can move with less friction.
RVol color tells you how “real” a move is: red/yellow often confirms momentum; blue warns of thin/liquidy bars.
DTR vs ATR shows if today’s range is stretched vs recent norm.
Design choices (why your prior errors are gone)
Removed multiline ?: chains → replaced by if/else (Pine v6 is picky about line continuations).
Moved fill() calls outside of local if blocks (Pine limitation).
ta.change(time("D")) != 0 makes the if condition boolean.
Declared G_drawFrom / G_barsBack before startX() so identifiers exist.

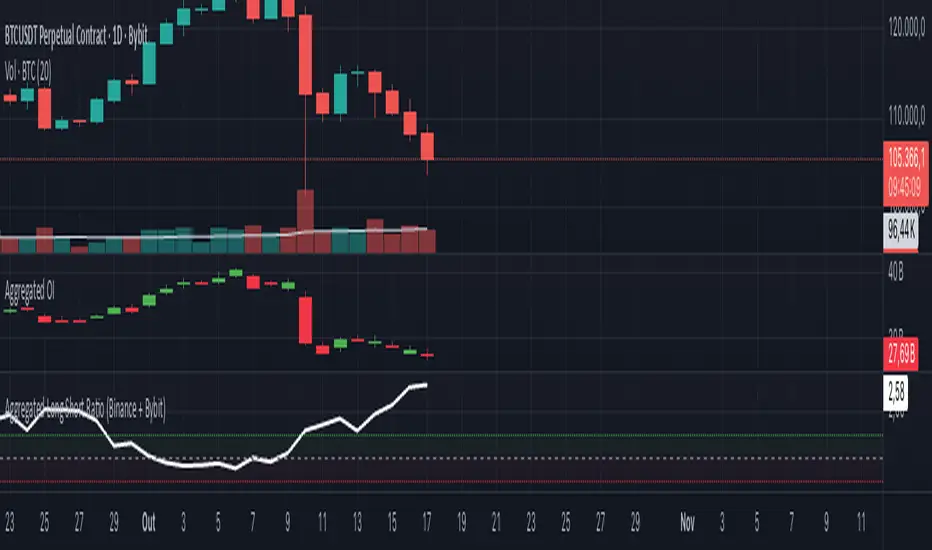
Aggregated Long Short Ratio (Binance + Bybit)This indicator displays the Long/Short Ratio (LSR) from Binance and Bybit exchanges, plus an aggregated average. LSR shows the ratio between traders holding long positions vs short positions.
Settings AvailableExchanges Group:
☑️Show Binance - Display Binance LSR line
☑️ Show Bybit - Display Bybit LSR line
☑️ Show Aggregated LSR - Display combined average
Timeframe - Choose data timeframe (leave empty for chart timeframe)
Visualization Group:
🎨 Binance Color - Default: Yellow
🎨 Bybit Color - Default: Orange
🎨 Aggregated Color - Default: White
📖 How to Read the Indicator
⚠️ CRITICAL: Always analyze LSR together with Open Interest (OI)
Key Levels:
LSR = 1.0 (gray dashed line) = Balance - Equal longs and shorts
LSR > 1.0 = More longs than shorts (bullish sentiment)
LSR < 1.0 = More shorts than longs (bearish sentiment)
Extreme Zones:
LSR > 1.5 (green zone) = Very bullish - Possible market top
LSR < 0.5 (red zone) = Very bearish - Possible market bottom
Why Open Interest Matters:
LSR alone doesn't tell the full story. You MUST check Open Interest:
Rising OI + High LSR (>1.5) = New longs opening → Strong momentum OR potential trap
Rising OI + Low LSR (<0.5) = New shorts opening → Strong momentum OR potential trap
Falling OI + Extreme LSR = Positions closing → Weak signal, avoid trading
Stable OI + Extreme LSR = No new positions → Less reliable signal
💡 Trading Interpretation
⚠️ ALWAYS combine LSR with Open Interest analysis!
Contrarian Strategy (High Leverage Zones):
High LSR (>1.5) + Rising OI → Many new longs → Potential short squeeze OR reversal down
Low LSR (<0.5) + Rising OI → Many new shorts → Potential long squeeze OR reversal up
Trend Confirmation:
Rising LSR + Rising price + Rising OI = Strong bullish trend with new positions
Falling LSR + Falling price + Rising OI = Strong bearish trend with new positions
Weak Signals (Avoid):
Extreme LSR + Falling OI = Positions closing → Low conviction
Extreme LSR + Stable OI = No new money → Wait for confirmation
Divergences:
Price higher highs but LSR falling + Rising OI = Bearish divergence (shorts accumulating)
Price lower lows but LSR rising + Rising OI = Bullish divergence (longs accumulating)
Best Setups:
Reversal: Extreme LSR (>1.5 or <0.5) + Rising OI + Price rejection
Trend: LSR trending with price + Steadily rising OI
Caution: Extreme LSR + Falling OI = Ignore signal
Built-in Alerts
The indicator includes 4 preset alerts:
LSR Crossed Above 1.0 - Market turned bullish
LSR Crossed Below 1.0 - Market turned bearish
LSR Very High - Above 1.5 (possible top)
LSR Very Low - Below 0.5 (possible bottom)
To Set Up Alerts:
Click the "..." on the indicator
Select "Add Alert"
Choose the condition you want
Configure notification method
Best Practices
MANDATORY: Always add Open Interest indicator to your chart alongside LSR
To add OI: Click Indicators → Search "Open Interest" → Add official TradingView OI
Use on perpetual futures charts (symbols ending in .P)
Works best on USDT pairs (BTCUSDT, ETHUSDT, etc.)
Combine LSR + OI + price action + support/resistance levels
Higher timeframes (4h, 1D) give more reliable signals
Don't trade LSR extremes without confirming OI direction
Golden Rule: Rising OI = Strong signal | Falling OI = Weak signal
⚠️ Important Notes
Indicator requires TradingView Premium or above (uses Request library)
Only works on crypto perpetual futures
Data availability depends on exchange API
NA values mean data is not available for that exchange/symbol
Never use LSR without Open Interest context
Wyckoff Stage Approximator (MTF Alerts)Wyckoff Stage Approximator (MTF Context)
This indicator is a powerful tool designed for traders who use a top-down, multi-timeframe approach based on Wyckoff principles. Its primary function is to identify the market's current stage—consolidation (Stage 1) or trend (Stage 2)—on a higher Context (C) timeframe and project that analysis onto your lower Validation (V) and Entry (E) charts.
This ensures you are always trading in alignment with the "big picture" trend, preventing you from taking low-probability trades based on lower-timeframe noise.
Core Concept: Top-Down Analysis
The script solves a common problem for multi-timeframe traders: losing sight of the primary trend. By locking the background color to your chosen Context timeframe (e.g., 15-minute), you are constantly reminded of the market's true state.
🟡 Yellow Background (Stage 1): The Context timeframe is in consolidation. This is a time to be patient and wait for a clear directional bias to emerge.
🟢 Green Background (Stage 2 - Markup): The Context timeframe is in a confirmed uptrend. This is your green light to look for bullish pullback opportunities on your lower timeframes.
🔴 Red Background (Stage 2 - Markdown): The Context timeframe is in a confirmed downtrend. This is your signal to look for bearish rally opportunities.
How It Works
The indicator uses a combination of moving averages and trend strength to objectively define each stage:
Trend Alignment: It checks if the 5 EMA, 10 EMA, and 20 EMA are properly stacked above or below the 50 SMA to determine the potential trend direction.
Trend Strength: It uses the ADX to measure the strength of the trend. A trend is only confirmed as Stage 2 if the ADX is above a user-defined threshold (default is 23), filtering out weak or choppy moves.
Stage Definition: Any period that is not a confirmed, strong Stage 2 Markup or Markdown is classified as a Stage 1 consolidation phase.
Key Features
Multi-Timeframe (MTF) Projection: Select your master "Context" timeframe, and its analysis will be displayed on any chart you view.
Customizable Inputs: Easily adjust the moving average lengths and ADX threshold to fit your specific strategy and the asset you are trading.
Clear Visual Cues: The intuitive background coloring makes it easy to assess the market environment at a glance.
Stage Transition Alerts: Set up specific alerts to be notified the moment your Context timeframe shifts from a Stage 1 consolidation to a Stage 2 trend, ensuring you never miss a potential setup.
How to Use This Indicator
Add the indicator to your chart.
In the settings, set the "Context Timeframe" to your highest timeframe (e.g., "15" for 15-minute).
Create alerts for the "Stage 1 -> Stage 2" conditions.
When you receive an alert, it signals that a potential trend is beginning on your Context chart.
Switch to your lower Validation and Entry timeframes. The background color will confirm the higher-timeframe trend, giving you the confidence to look for your specific entry patterns.
Disclaimer: This tool is designed for confluence and environmental analysis. It is not a standalone signal generator. It should be used in conjunction with your own price action, volume, or order flow analysis to validate trade entries.
3D Candles (Zeiierman)█ Overview
3D Candles (Zeiierman) is a unique 3D take on classic candlesticks, offering a fresh, high-clarity way to visualize price action directly on your chart. Visualizing price in alternative ways can help traders interpret the same data differently and potentially gain a new perspective.
█ How It Works
⚪ 3D Body Construction
For each bar, the script computes the candle body (open/close bounds), then projects a top face offset by a depth amount. The depth is proportional to that candle’s high–low range, so it looks consistent across symbols with different prices/precisions.
rng = math.max(1e-10, high - low ) // candle range
depthMag = rng * depthPct * factorMag // % of range, shaped by tilt amount
depth = depthMag * factorSign // direction from dev (up/down)
depthPct → how “thick” the 3D effect is, as a % of each candle’s own range.
factorMag → scales the effect based on your tilt input (dev), with a smooth curve so small tilts still show.
factorSign → applies the direction of the tilt (up or down).
⚪ Tilt & Perspective
Tilt is controlled by dev and translated into a gentle perspective factor:
slope = (4.0 * math.abs(dev)) / width
factorMag = math.pow(math.min(1.0, slope), 0.5) // sqrt softens response
factorSign = dev == 0 ? 0.0 : math.sign(dev) // direction (up/down)
Larger dev → stronger 3D presence (up to a cap).
The square-root curve makes small dev values noticeable without overdoing it.
█ How to Use
Traders can use 3D Candles just like regular candlesticks. The difference is the 3D visualization, which can broaden your view and help you notice price behavior from a fresh perspective.
⚪ Quick setup (dual-view):
Split your TradingView layout into two synchronized charts.
Right pane: keep your standard candlestick or bar chart for live execution.
Left pane: add 3D Candles (Zeiierman) to compare the same symbol/timeframe.
Observe differences: the 3D rendering can make expansion/contraction and body emphasis easier to spot at a glance.
█ Go Full 3D
Take the experience further by pairing 3D Candles (Zeiierman) with Volume Profile 3D (Zeiierman) , a perfect complement that shows where activity is concentrated, while your 3D candles show how the price unfolded.
█ Settings
Candles — How many 3D candles to draw. Higher values draw more shapes and may impact performance on slower machines.
Block Width (bars) — Visual thickness of each 3D candle along the x-axis. Larger values look chunkier but can overlap more.
Up/Down — Controls the tilt and strength of the 3D top face.
3D depth (% of range) — Thickness of the 3D effect as a percentage of each candle’s own high–low range. Larger values exaggerate the depth.
-----------------
Disclaimer
The content provided in my scripts, indicators, ideas, algorithms, and systems is for educational and informational purposes only. It does not constitute financial advice, investment recommendations, or a solicitation to buy or sell any financial instruments. I will not accept liability for any loss or damage, including without limitation any loss of profit, which may arise directly or indirectly from the use of or reliance on such information.
All investments involve risk, and the past performance of a security, industry, sector, market, financial product, trading strategy, backtest, or individual's trading does not guarantee future results or returns. Investors are fully responsible for any investment decisions they make. Such decisions should be based solely on an evaluation of their financial circumstances, investment objectives, risk tolerance, and liquidity needs.

X Feigenbaumplots forward “projection zones” derived from a user-defined Feigenbaum Deterministic Range (FDR). Starting from two anchor prices (p01a, p01b) that define the initial condition, the tool computes successive expansion zones above and below that range using fixed scale factors. Each zone is rendered as a shaded box with optional edge outlines, an auto-midline, and an optional label—giving you an at-a-glance map of where price may propagate next.
This indicator is a visual framework, not a signal generator. It’s meant to be combined with your existing structure/flow reads (order flow, VWAPs, ORs, HTF levels, etc.) to plan scenarios, targets, and invalidation.
Key ideas (context)
Initial condition → expansions: You define a deterministic base range (FDR) from which the script projects outward “echoes.”
Bidirectional mapping: Zones are drawn symmetrically as +1, +2, +3, +4 (above) and −1, −2, −3, −4 (below) to reflect potential propagation in either direction.
Diminishing confidence with distance: Farther zones are for scenario planning/targets; nearer zones are more actionable for risk placement and management.
How the levels are built
Feigenbaum Deterministic Range (FDR):
Inputs p01a and p01b define the initial range (FDR = p01a − p01b).
Category “F Range” draws that base box.
Projection Zones:
The script computes zone pairs by offsetting from the initial range using fixed multipliers of FDR. In code, these are the pre-set coefficients:
±1: 0.6714 and 1.5029
±2: 2.5699 and 3.6692
±3: 6.1398 and 8.3384
±4: 13.2796 and 17.6768
Each zone is two prices (a, b) forming a band; the same logic mirrors below the range for the negative side.
Rendering & midlines:
Each enabled category draws a filled box from the anchor bar to the right edge (current bar + extend_len).
Optional outlines (solid/dashed/dotted) for top/bottom/left/right edges.
Optional midline (always dashed) bisects each zone for quick reference.
Anchoring & timeframe logic
Anchor refresh: interval1 sets an HTF “clock” (e.g., Daily). On each new HTF bar, all categories re-anchor at that bar’s index so new projections start cleanly with the fresh session/period.
Extend control: extend_len nudges the right boundary beyond the latest bar for label/edge clarity.
Inputs & styling
Settings group:
Anchor 1 Timeframe (e.g., D) defines the refresh cadence.
Label toggles: show/hide, size, text color, and background.
Feigenbaum DR group:
Enable the base F range, set p01a/p01b, choose fill/line colors, outline style, and the mid toggle.
Ranger Factors groups (Zones ±1…±4):
Each zone can be enabled/disabled, inherits its computed prices, and has independent fill/line color, outline style, and mid toggle.
Practical usage
Scenario mapping: Use +/−1 zones for near-term impulse tracking and intraday targets; treat +/−3 and +/−4 as stretch objectives or “if trend persists” waypoints.
Confluence first: Prioritize trades when a Feigenbaum zone aligns with a known liquidity pool, session level (e.g., OR, ETH/RTH AVWAP), HTF pivot, or key option-derived levels.
Risk & invalidation: The base FDR and nearest zone edges provide clean invalidation references and partial-take structures.
Notes & limitations
The coefficients are fixed in this version (you can expose them as inputs if you want to calibrate per market).
Projections are descriptive, not predictive; treat farther zones as lower-confidence context.
Because anchors reset on the selected HTF, choose interval1 consistent with your playbook (e.g., Daily for RTH framing, Weekly for swing maps).
Output summary
Boxes: FDR (base), Zones +1/−1, +2/−2, +3/−3, +4/−4
Edges: Optional top/bottom/left/right per zone (styleable)
Midlines: Optional dashed mid per zone
Labels: Optional, style-controlled, positioned just beyond the right edge

LEGEND IsoPulse Fusion Universal Volume Trend Buy Sell RadarLEGEND IsoPulse Fusion • Universal Volume Trend Buy Sell Radar
One line summary
LEGEND IsoPulse Fusion reads intent from price and volume together, learns which features matter most on your symbol, blends them into a single signed Fusion line in a stable unit range, and emits clear Buy Sell Close events with a structure gate and a liquidity safety gate so you act only when the tape is favorable.
What this script is and why it exists
Many traders keep separate windows for trend, volume, volatility, and regime filters. The result can feel fragmented. This script merges two complementary engines into one consistent view that is easy to read and simple to act on.
LEGEND Tensor estimates directional quality from five causally computed features that are normalized for stationarity. The features are Flow, Tail Pressure with Volume Mix, Path Curvature, Streak Persistence, and Entropy Order.
IsoPulse transforms raw volume into two decaying reservoirs for buy effort and sell effort using body location and wick geometry, then measures price travel per unit volume for efficiency, and detects volume bursts with a recency memory.
Both engines are mapped into the same unit range and fused by a regime aware mixer. When the tape is orderly the mixer leans toward trend features. When the tape is messy but a true push appears in volume efficiency with bursts the mixer allows IsoPulse to speak louder. The outcome is a single Fusion line that lives in a familiar range with calm behavior in quiet periods and expressive pushes when energy concentrates.
What makes it original and useful
Two reservoir volume split . The script assigns a portion of the bar volume to up effort and down effort using body location and wick geometry together. Effort decays through time using a forgetting factor so memory is present without becoming sticky.
Efficiency of move . Price travel per unit volume is often more informative than raw volume or raw range. The script normalizes both sides and centers the efficiency so it becomes signed fuel when multiplied by flow skew.
Burst detection with recency memory . Percent rank of volume highlights bursts. An exponential memory of how recently bursts clustered converts isolated blips into useful context.
Causal adaptive weighting . The LEGEND features do not receive static weights. The script learns, causally, which features have correlated with future returns on your symbol over a rolling window. Only positive contributions are allowed and weights are normalized for interpretability.
Regime aware fusion . Entropy based order and persistence create a mixer that blends IsoPulse with LEGEND. You see a single line rather than two competing panels, which reduces decision conflict.
How to read the screen in seconds
Fusion area . The pane fills above and below zero with a soft gradient. Deeper fill means stronger conviction. The white Fusion line sits on top for precise crossings.
Entry guides and exit guides . Two entry guides draw symmetrically at the active fused entry level. Two exit guides sit inside at a fraction of the entry. Think of them as an adaptive envelope.
Letters . B prints once when the script flips from flat to long. S prints once when the script flips from flat to short. C prints when a held position ends on the appropriate side. T prints when the structure gate first opens. A prints when the liquidity safety flag first appears.
Price bar paint . Bars tint green while long and red while short on the chart to mirror your virtual position.
HUD . A compact dashboard in the corner shows Fusion, IsoPulse, LEGEND, active entry and exit levels, regime status, current virtual position, and the vacuum z value with its avoid threshold.
What signals actually mean
Buy . A Buy prints when the Fusion line crosses above the active entry level while gates are open and the previous state was flat.
Sell . A Sell prints when the Fusion line crosses below the negative entry level while gates are open and the previous state was flat.
Close . A Close prints when Fusion cools back inside the exit envelope or when an opposite cross would occur or when a gate forces a stop, and the previous state was a hold.
Gates . The Trend gate requires sufficient entropy order or significant persistence. The Avoid gate uses a liquidity vacuum z score. Gates exist to protect you from weak tape and poor liquidity.
Inputs and practical tuning
Every input has a tooltip in the script. This section provides a concise reference that you can keep in mind while you work.
Setup
Core window . Controls statistics across features. Scalping often prefers the thirties or low fifties. Intraday often prefers the fifties to eighties. Swing often prefers the eighties to low hundreds. Smaller responds faster with more noise. Larger is calmer.
Smoothing . Short EMA on noisy features. A small value catches micro shifts. A larger value reduces whipsaw.
Fusion and thresholds
Weight lookback . Sample size for weight learning. Use at least five times the horizon. Larger is slower and more confident. Smaller is nimble and more reactive.
Weight horizon . How far ahead return is measured to assess feature value. Smaller favors quick reversion impulses. Larger favors continuation.
Adaptive thresholds . Entry and exit levels from rolling percentiles of the absolute LEGEND score. This self scales across assets and timeframes.
Entry percentile . Eighty selects the top quintile of pushes. Lower to seventy five for more signals. Raise for cleanliness.
Exit percentile . Mid fifties keeps trades honest without overstaying. Sixty holds longer with wider give back.
Order threshold . Minimum structure to trade. Zero point fifteen is a reasonable start. Lower to trade more. Raise to filter chop.
Avoid if Vac z . Liquidity safety level. One point two five is a good default on liquid markets. Thin markets may prefer a slightly higher setting to avoid permanent avoid mode.
IsoPulse
Iso forgetting per bar . Memory for the two reservoirs. Values near zero point nine eight to zero point nine nine five work across many symbols.
Wick weight in effort split . Balance between body location and wick geometry. Values near zero point three to zero point six capture useful behavior.
Efficiency window . Travel per volume window. Lower for snappy symbols. Higher for stability.
Burst percent rank window . Window for percent rank of volume. Around one hundred to three hundred covers most use cases.
Burst recency half life . How long burst clusters matter. Lower for quick fades. Higher for cluster memory.
IsoPulse gain . Pre compression gain before the atan mapping. Tune until the Fusion line lives inside a calm band most of the time with expressive spikes on true pushes.
Continuation and Reversal guides . Visual rails for IsoPulse that help you sense continuation or exhaustion zones. They do not force events.
Entry sensitivity and exit fraction
Entry sensitivity . Loose multiplies the fused entry level by a smaller factor which prints more trades. Strict multiplies by a larger factor which selects fewer and cleaner trades. Balanced is neutral.
Exit fraction . Exit level relative to the entry level in fused unit space. Values around one half to two thirds fit most symbols.
Visuals and UX
Columns and line . Use both to see context and precise crossings. If you present a very clean chart you can turn columns off and keep the line.
HUD . Keep it on while you learn the script. It teaches you how the gates and thresholds respond to your market.
Letters . B S C T A are informative and compact. For screenshots you can toggle them off.
Debug triggers . Show raw crosses even when gates block entries. This is useful when you tune the gates. Turn them off for normal use.
Quick start recipes
Scalping one to five minutes
Core window in the thirties to low fifties.
Horizon around five to eight.
Entry percentile around seventy five.
Exit fraction around zero point five five.
Order threshold around zero point one zero.
Avoid level around one point three zero.
Tune IsoPulse gain until normal Fusion sits inside a calm band and true squeezes push outside.
Intraday five to thirty minutes
Core window around fifty to eighty.
Horizon around ten to twelve.
Entry percentile around eighty.
Exit fraction around zero point five five to zero point six zero.
Order threshold around zero point one five.
Avoid level around one point two five.
Swing one hour to daily
Core window around eighty to one hundred twenty.
Horizon around twelve to twenty.
Entry percentile around eighty to eighty five.
Exit fraction around zero point six zero to zero point seven zero.
Order threshold around zero point two zero.
Avoid level around one point two zero.
How to connect signals to your risk plan
This is an indicator. You remain in control of orders and risk.
Stops . A simple choice is an ATR multiple measured on your chart timeframe. Intraday often prefers one point two five to one point five ATR. Swing often prefers one point five to two ATR. Adjust to symbol behavior and personal risk tolerance.
Exits . The script already prints a Close when Fusion cools inside the exit envelope. If you prefer targets you can mirror the entry envelope distance and convert that to points or percent in your own plan.
Position size . Fixed fractional or fixed risk per trade remains a sound baseline. One percent or less per trade is a common starting point for testing.
Sessions and news . Even with self scaling, some traders prefer to skip the first minutes after an open or scheduled news. Gate with your own session logic if needed.
Limitations and honest notes
No look ahead . The script is causal. The adaptive learner uses a shifted correlation, crosses are evaluated without peeking into the future, and no lookahead security calls are used. If you enable intrabar calculations a letter may appear then disappear before the close if the condition fails. This is normal for any cross based logic in real time.
No performance promises . Markets change. This is a decision aid, not a prediction machine. It will not win every sequence and it cannot guarantee statistical outcomes.
No dependence on other indicators . The chart should remain clean. You can add personal tools in private use but publications should keep the example chart readable.
Standard candles only for public signals . Non standard chart types can change event timing and produce unrealistic sequences. Use regular candles for demonstrations and publications.
Internal logic walkthrough
LEGEND feature block
Flow . Current return normalized by ATR then smoothed by a short EMA. This gives directional intent scaled to recent volatility.
Tail pressure with volume mix . The relative sizes of upper and lower wicks inside the high to low range produce a tail asymmetry. A volume based mix can emphasize wick information when volume is meaningful.
Path curvature . Second difference of close normalized by ATR and smoothed. This captures changes in impulse shape that can precede pushes or fades.
Streak persistence . Up and down close streaks are counted and netted. The result is normalized for the window length to keep behavior stable across symbols.
Entropy order . Shannon entropy of the probability of an up close. Lower entropy means more order. The value is oriented by Flow to preserve sign.
Causal weights . Each feature becomes a z score. A shifted correlation against future returns over the horizon produces a positive weight per feature. Weights are normalized so they sum to one for clarity. The result is angle mapped into a compact unit.
IsoPulse block
Effort split . The script estimates up effort and down effort per bar using both body location and wick geometry. Effort is integrated through time into two reservoirs using a forgetting factor.
Skew . The reservoir difference over the sum yields a stable skew in a known range. A short EMA smooths it.
Efficiency . Move size divided by average volume produces travel per unit volume. Normalization and centering around zero produce a symmetric measure.
Bursts and recency . Percent rank of volume highlights bursts. An exponential function of bars since last burst adds the notion of cluster memory.
IsoPulse unit . Skew multiplied by centered efficiency then scaled by the burst factor produces the raw IsoPulse that is angle mapped into the unit range.
Fusion and events
Regime factor . Entropy order and streak persistence form a mixer. Low structure favors IsoPulse. Higher structure favors LEGEND. The blend is convex so it remains interpretable.
Blended guides . Entry and exit guides are blended in the same way as the line so they stay consistent when regimes change. The envelope does not jump unexpectedly.
Virtual position . The script maintains state. Buy and Sell require a cross while flat and gates open. Close requires an exit or force condition while holding. Letters print once at the state change.
Disclosures
This script and description are educational. They do not constitute investment advice. Markets involve risk. You are responsible for your own decisions and for compliance with local rules. The logic is causal and does not look ahead. Signals on non standard chart types can be misleading and are not recommended for publication. When you test a strategy wrapper, use realistic commission and slippage, moderate risk per trade, and enough trades to form a meaningful sample, then document those assumptions if you share results.
Closing thoughts
Clarity builds confidence. The Fusion line gives a single view of intent. The letters communicate action without clutter. The HUD confirms context at a glance. The gates protect you from weak tape and poor liquidity. Tune it to your instrument, observe it across regimes, and use it as a consistent lens rather than a prediction oracle. The goal is not to trade every wiggle. The goal is to pick your spots with a calm process and to stand aside when the tape is not inviting.

Free Stock ScreenerMissing great trade opportunities is annoying, and unless you have 12 screens or only trade one market, you are missing a lot of trades. To fix that, we created this free stock screener so you get notified instantly of potential great trading conditions in real time, right on your chart.
You get notified of trading benchmarks being met by the value being displayed on the scanner as well as a color change so that it grabs your attention and makes you aware that you should take a look at the other market and look for a potential trade. It also has built in alerts so you can have an alert notification go off when any of your trading conditions are met instead of needing to watch the scanner for color changes.
The screener will change the ticker symbol background color to red green when price is above or below the previous daily range and above or below both VWAPs. This signals that the ticker is trending, which typically means it is a great time to trade that market and follow the trend.
This free stock screener allows you to scan up to 10 different markets at the same time for various different conditions so you always know what is going on with your favorite trading symbols. If you want to scan more tickers, just add the indicator to your chart again and change the table position to the other side of the screen and update the tickers on the 2nd screener, allowing you to have 20 tickers at a time.
The scanner can be fully customized by changing the markets that it screens and turning on or off as many of them as you would like. You can also turn on or off any of the different data sets so that you only get information about trading conditions that matter to you.
The screener can provide data on any type of market, such as stocks, crypto, futures, forex and more. Each ticker can be adjusted to whatever market you would like it to scan for data in the settings panel, the only limitation is that it will not provide data for the VWAP and volume trend score if the ticker you are screening does not provide volume data.
Screener Features
The scanner will provide the following types of data for each ticker that is turned on:
Volume - Provides a volume score compared to the average volume and notifies you of higher than normal volume and volume spikes on individual bars by changing colors.
Volatility - Provides a volatility score compared to the average volatility and notifies you of higher than normal volatility by changing colors.
Oscillator - Choose between the RSI or CCI. The value of that oscillator will be displayed and will notify you when values are in extreme ranges such as overbought or oversold conditions according to the threshold values you enter in the settings panel. When those thresholds have been breached, you will be notified by it changing color.
Big Candles - Compares the current candle to average previous candle sizes, and changes color to notify you of big candles including a big top wick, big bottom wick, big candle body and big candle high to low range.
Daily Level Touches & Trends - Calculates and displays various daily candle and intraday open price levels that act as support and resistance. Notifies you when price is touching any of the daily levels that are turned on. The levels you can have on are as follows: previous day high, previous day low or previous day open. It also will notify you when price is touching the current day’s open, NY 930am open, Asia 8pm open, London 2am open and NY midnight 12am open. It will also say “Above” if price is above the previous day’s high or it will say “Below” if price is below the previous day’s low. The color of the cell will also change when a level touch is happening or price is above the previous day high or below the previous day low.
VWAP - Choose from 2 different VWAP lengths, default settings are daily and weekly VWAPs. You will get notified if price touches either of the VWAPs and they will also say “Above” or “Below” if price is currently above or below each VWAP.
How To Use The Screener To Help You Trade
The main purpose of the screener is to scan other markets and notify you of potential good trading opportunities such as price bouncing off of the daily levels or VWAPs. It can also be used to know when price is trending according to the VWAPs and daily levels. Lastly, you can use it to know how the volume and volatility trends are currently which gives you more confidence in taking a trade with this data when volume and volatility are present.
Volume Score
When volume is high, this represents a good time to trade because there are many market participants and price is likely to be volatile while there is high volume which can present a lot of good trade setups for you to take.
The volume score shown on the screener measures the current volume trend compared to previous volume trends and calculates that into a score based on 100 being the same as the previous volume trend. So any value above 100 means it is high volume and any value less than 100 means it is lower volume than normal.
In the settings panel, you can adjust the volume threshold that needs to be met for a volume notification to show up. The default setting is at 120, so you will get notified when the current volume trend score is 120 or higher or you can adjust that threshold value to whatever value you prefer.
It also will notify you when there is a volume spike on the current bar. This is determined by calculating an average of the recent volume totals and then checking to see if the current bar is greater than or equal to that average multiplied by 3. So if a single bar has volume that is greater than 3 times what the average volume is, then you will get a notification that says “Spike” to make you aware of that volume spike.
The volume trend threshold, volume spike multiplier and lookback length for the average volume used in volume spike calculations can all be adjusted in the settings panel to fit your desired preferences.
Volatility Score
High volatility can mean it is a great time to trade because the market is moving quickly and providing large enough movements that you can get in and out in a short amount of time, while still accruing decent sized trade PnL.
The volatility score will calculate the current volatility for each market compared to previous conditions and then divide the current volatility by the average volatility to give you a volatility score. Anything over 100 means the market is decently volatile and you should look at that market to find potential trade setups to execute on. Anything below 100 means the market is not very volatile and it is usually best to just wait until volatility returns before you start trading again.
The screener will notify you when the volatility score is above the threshold you set. The default value is set to 90, but can be adjusted to your preference. Pay attention to any market that shows an alert and take a look at that chart because the high volatility may present a good trade setup for you in the near future.
Oscillator Score
The oscillator data can be switched between Relative Strength Index(RSI) and Commodity Channel Index(CCI).
The RSI provides a value between 0 and 100 that indicates the momentum and strength of the recent price action. Many traders use the extremes of the 0-100 range to signal overbought or oversold conditions and use that as a sign to look for price to reverse in the near future. The typical values used for this and the default settings to provide notifications are: 70 for overbought and 30 for oversold. The scanner will notify you when the RSI value is considered overbought or oversold so you know to take a look at the chart and analyze if it is ready for a trade to be taken.
The CCI provides a value that can be used to determine the trend strength of the underlying asset when the oscillator moves above 100 or below -100. These extreme values are outside of the normal accumulation range and signify that price is moving strongly in that direction so it may be a good time to take a trade in the direction of the trend. The scanner will show you the value of the CCI for each market and notify you if that value is above 100 or below -100.
Both RSI and CCI settings can be adjusted in the settings panel to your desired settings so you have the exact oscillator settings you prefer to use as well as the exact values that you want to use for being notified.
Big Candles
Big candles can mean that many traders are buying or selling at the same time and many times indicate a good signal to trade in that same direction. That is why we included this calculation in the screener, so you are always aware when a large candle prints.
It calculates the average size of the recent candles and then uses that average as the benchmark to determine if the current candle is considered big and worthy of notifying you to take a look at that chart.
You can adjust the multiplier used for the big candle threshold to whatever you desire, but the default setting is 3 which means the candle will be considered big and notify you if it is 3 times as large as an average candle.
The big candles data will track the following candle values and notify you with these labels:
High to Low candle size = HL
Candle Body from open to close candle size = OC
Top Wick size = TW
Bottom Wick size = BW
Daily Level Touches & Trend
Daily level touches are excellent levels to watch for price to bounce because they often act as support and resistance levels for intraday trading. The scanner will track each market and notify you when the current candle is touching any of the daily levels that you have turned on in the settings panel.
The main levels that are turned on by default and are useful for all markets and how they will be labeled on the scanner are as follows:
Previous Day High = High
Previous Day Low = Low
Previous Day Open = < Open
Previous Day Close = Close
Current Day Open = Open
We also included some extra levels that are useful for futures traders. They are as follows:
NY 930am Open = 930am
NY 12am Midnight Open = 12am
Asia Open at 8pm NY time = Asia
London Open at 2am NY Time = London
Watch how price reacts to these levels and then trade the bounces off of these levels if the price action confirms that it is going to respect that level.
When price is currently above the previous day high, the scanner will say “Above” and show a green color, indicating a bullish trend and that price is above the previous daily candle’s high.
When price is currently below the previous day low, the scanner will say “Below” and show a red color, indicating a bearish trend and that price is below the previous daily candle’s low.
Pay attention to when price is trending above or below the previous daily candle as those trends can provide excellent trend trading opportunities.
The daily levels that you have turned on in the settings will also show as lines on the chart and include a label next to them, identifying each level so you know what each line represents. You can turn on or off all of the lines shown on the chart in the main settings or turn them off one by one in the style panel of the settings. Labels can also be turned on or off for all of the lines in the main settings panel. You can adjust the label positioning in the Label Offset section of the settings panel.
VWAP Touches & Trend
VWAP stands for volume weighted average price and is a very popular tool that traders use to determine trend direction based on volume as well as an excellent level to trade price bounces off of.
The typical VWAP time period used is Daily, which means the volume weighted average price will reset at the beginning of a new day. We set the first VWAP to be the daily VWAP by default and the second one to be the weekly VWAP. You can adjust both of the time periods to be any of the provided time lengths that you choose.
The screener will show “Above” with a green background color when price is above the VWAP, indicating a bullish trend. It will show “Below” with a red background color when price is below the VWAP, indicating a bearish trend. When both VWAPs are showing Above or Below, you can expect price to trend in that direction, so look for pullbacks you can trade in the direction of the trend. If the VWAPs are showing different directions, then you should expect to bounce back and forth between the VWAPs, but be careful and watch out for price to break beyond either one and start a trend.
When the current candle is touching the VWAP, the scanner will change colors and say VWAP to notify you that price is touching the VWAP and you should look at that chart and analyze the market for a potential bounce off of the VWAP to trade.
Trending Market Signals
Strong trends are excellent markets to trade and can many times provide excellent trading opportunities that don’t require expert price action reading skills to be able to take winning trades from. That is why we included a signal to notify you of a strong trending market.
The strong trending market will show up as a green or red background color for the ticker name. If the color of the ticker name is green, it is notifying you that the price is above the previous daily high, above VWAP 1 and above VWAP 2 and is a good market to look for bullish trend trades. If the color of the ticker name is red, it is notifying you that the price is below the previous daily low, below VWAP 1 and below VWAP 2 and is a good market to look for bearish trend trades.
Changing The Tickers It Scans
To change the tickers that the indicator scans, scroll near the bottom of the settings panel and select the ticker symbol you want to update and then search for the exact symbol you want to use. If you want to scan less tickers, then just turn some of the tickers off that you don’t need.
Scanning More Than 10 Tickers
If you want to scan more than 10 tickers, you can add the scanner to your chart again and then just change the table position to the other side of the screen. This will allow you to scan 10 more tickers that will show up separately. Then if you want even more, just add the indicator to your chart again and update the table position until you have as many markets as you want. The table position setting can be found at the bottom of the main settings panel.
Alerts
The screener has alerts that can be used to notify you when any of the data set thresholds have been met or if price is touching one of the levels. You can set alerts for the following events:
Bullish Trend Alert - Price is above the previous daily high and above both VWAPs.
Bearish Trend Alert - Price is below the previous daily low and below both VWAPs.
High Volume Alert - Volume is higher than the threshold or a volume spike is detected.
High Volatility Alert - Volatility is higher than the threshold.
Oscillator Is Extended Alert - Oscillator value has exceeded the upper or lower threshold.
Big Candle Alert - A big candle has been detected.
Daily Level Touch Alert - One of the daily levels that is turned on is being touched.
VWAP Touch Alert - One of the 2 VWAPs are being touched.
An alert will trigger when any one of tickers on your scanner meets the alert conditions, so when you see the alert, you will need to go to your chart and look at the scanner to see which ticker it was and then navigate to that chart to look for potential trade setups.
The alerts will use the exact same settings you have configured in the settings panel to send you alert notifications. With normal settings, this could give you a lot of alerts, so if you only want alerts to fire when abnormal conditions are being met, try setting up a second screener on your chart that has very high threshold values and only has the most important level touches on. Then turn the setting "Do Not Show The Screener On The Chart" to off so the calculations will still run and fire alerts, but won't clog up your charts. This way you can only get alert notifications when major events happen but still have your normal screener settings available on your chart.
Markets This Can Be Used On
This screener uses the price action and volume data so you can use it to scan any type of market you would like as long as the ticker you are scanning has price and volume data feeds. If a market does not have volume data, then it will just show NaN in the volume row and the VWAP rows will not show anything.

FVG Volume Profile [ChartPrime]⯁ OVERVIEW
FVG Volume Profile is a smart volume analysis tool that identifies Fair Value Gaps (FVGs) and overlays a volume profile inside each gap using data from lower timeframes. The indicator automatically selects the best time resolution or allows for manual control, giving traders deeper insight into the volume structure within each imbalance. POC levels and total volumes gives a full microstructure view inside every FVG.
⯁ KEY FEATURES
Fair Value Gap Detection (Bullish & Bearish)
Detects price gaps where inefficiency exists using a 3-bar structure.
-Bullish Gaps: Low > High with confirming middle bar.
-Bearish Gaps: High < Low with confirming middle bar.
Only significant gaps (filtered by standard deviation) are plotted to avoid noise.
Multi-Timeframe Volume Profiling
Pulls granular candle and volume data from a lower timeframe —
In Auto Mode, uses a resolution ~10x lower than the current chart.
In Manual Mode, lets the user select a custom timeframe.
This ensures accurate intra-gap volume distribution.
Dynamic Volume Binning
Each FVG is divided into vertical volume bins based on the Resolution input.
Each bin displays relative volume intensity as a horizontal box, scaled by percentage of the max bin volume.
Point of Control (PoC) Line & Label
The bin with the maximum volume inside each FVG is marked with:
A horizontal line (PoC) extending from the left to right side.
A label showing the absolute volume of that bin.
Color-coded to match bullish or bearish FVGs.
Total Volume Label Inside FVG
Each FVG displays the total volume sum from its profile:
For bullish FVGs , shown in the bottom-right corner.
For bearish FVGs , shown in the top-right corner.
Auto-Removal of Invalid Gaps
If price fully closes the gap (crosses its bounds), the FVG, profile, and PoC are deleted automatically.
This keeps the chart clean and focused only on active zones.
Toggleable Volume Profile Display
User can show or hide the volume profiles within FVGs using the "Display" toggle under the "FVG Volume Profile" group.
Only the PoC and FVG boxes remain visible if toggled off.
Volume Resolution Customization
Control the number of bins used for each FVG profile.
Higher resolution = more bins and finer volume analysis. (default 15)
Auto Timeframe Validation Warning
If the selected lower timeframe isn’t actually lower than the chart's, the script shows a visible warning label prompting adjustment.
Helps prevent calculation errors.
⯁ USAGE
Use this tool to identify active imbalance zones (FVGs) with embedded volume context.
Look for PoC positioning inside gaps — near top may indicate absorption or reversal zones.
Combine with price action at the PoC level for precision entries.
Hide volume profile for a cleaner view while retaining key POC and FVG boxes.
Use resolution controls to zoom into fine-grained profiles inside large gaps.
Consider Auto mode for seamless multi-timeframe analysis, or switch to Manual for full control.
⯁ CONCLUSION
FVG Volume Profile transforms raw imbalance detection into actionable insight by embedding lower-timeframe volume structure inside each Fair Value Gap. With PoC highlights, total volume labels, and customizable bin resolution, this indicator is essential for traders who want to understand not just where the gap is — but what volume did inside it .

Volume Sampled Supertrend [BackQuant]Volume Sampled Supertrend
A Supertrend that runs on a volume sampled price series instead of fixed time. New synthetic bars are only created after sufficient traded activity, which filters out low participation noise and makes the trend much easier to read and model.
Original Script Link
This indicator is built on top of my volume sampling engine. See the base implementation here:
Why Volume Sampling
Traditional charts print a bar every N minutes regardless of how active the tape is. During quiet periods you accumulate many small, low information bars that add noise and whipsaws to downstream signals.
Volume sampling replaces the clock with participation. A new synthetic bar is created only when a pre-set amount of volume accumulates (or, in Dollar Bars mode, when pricevolume reaches a dollar threshold). The result is a non-uniform time series that stretches in busy regimes and compresses in quiet regimes. This naturally:
filters dead time by skipping low volume chop;
standardizes the information content per bar, improving comparability across regimes;
stabilizes volatility estimates used inside banded indicators;
gives trend and breakout logic cleaner state transitions with fewer micro flips.
What this tool does
It builds a synthetic OHLCV stream from volume based buckets and then applies a Supertrend to that synthetic price. You are effectively running Supertrend on a participation clock rather than a wall clock.
Core Features
Sampling Engine - Choose Volume buckets or Dollar Bars . Thresholds can be dynamic from a rolling mean or median, or fixed by the user.
Synthetic Candles - Plots the volume sampled OHLC candles so you can visually compare against regular time candles.
Supertrend on Synthetic Price - ATR bands and direction are computed on the sampled series, not on time bars.
Adaptive Coloring - Candle colors can reflect side, intensity by volume, or a neutral scheme.
Research Panels - Table shows total samples, current bucket fill, threshold, bars-per-sample, and synthetic return stats.
Alerts - Long and Short triggers on Supertrend direction flips for the synthetic series.
How it works
Sampling
Pick Sampling Method = Volume or Dollar Bars.
Set the dynamic threshold via Rolling Lookback and Filter (Mean or Median), or enable Use Fixed and type a constant.
The script accumulates volume (or pricevolume) each time bar. When the bucket reaches the threshold, it finalizes one or more synthetic candles and resets accumulation.
Each synthetic candle stores its own OHLCV and is appended to the synthetic series used for all downstream logic.
Supertrend on the sampled stream
Choose Supertrend Source (Open, High, Low, Close, HLC3, HL2, OHLC4, HLCC4) derived from the synthetic candle.
Compute ATR over the synthetic series with ATR Period , then form upperBand = src + factorATR and lowerBand = src - factorATR .
Apply classic trailing band and direction rules to produce Supertrend and trend state.
Because bars only come when there is sufficient participation, band touches and flips tend to align with meaningful pushes, not idle prints.
Reading the display
Synthetic Volume Bars - The non-uniform candles that represent equal information buckets. Expect more candles during active sessions and fewer during lulls.
Volume Sampled Supertrend - The main line. Green when Trend is 1, red when Trend is -1.
Markers - Small dots appear when a new synthetic sample is created, useful for aligning activity cycles.
Time Bars Overlay (optional) - Plot regular time candles to compare how the synthetic stream compresses quiet chop.
Settings you will use most
Data Settings
Sampling Method - Volume or Dollar Bars.
Rolling Lookback and Filter - Controls the dynamic threshold. Median is robust to outliers, Mean is smoother.
Use Fixed and Fixed Threshold - Force a constant bucket size for consistent sampling across regimes.
Max Stored Samples - Ring buffer limit for performance.
Indicator Settings
SMA over last N samples - A moving average computed on the synthetic close series. Can be hidden for a cleaner layout.
Supertrend Source - Price field from the synthetic candle.
ATR Period and Factor - Standard Supertrend controls applied on the synthetic series.
Visuals and UI
Show Synthetic Bars - Turn synthetic candles on or off.
Candle Color Mode - Green/Red, Volume Intensity, Neutral, or Adaptive.
Mark new samples - Puts a dot when a bucket closes.
Show Time Bars - Overlay regular candles for comparison.
Paint candles according to Trend - Colors chart candles using current synthetic Supertrend direction.
Line Width , Colors , and Stats Table toggles.
Some workflow notes:
Trend Following
Set Sampling Method = Volume, Filter = Median, and a reasonable Rolling Lookback so busy regimes produce more samples.
Trade in the direction of the Volume Sampled Supertrend. Because flips require real participation, you tend to avoid micro whipsaws seen on time bars.
Use the synthetic SMA as a bias rail and trailing reference for partials or re-entries.
Breakout and Continuation
Watch for rapid clustering of new sample markers and a clean flip of the synthetic Supertrend.
The compression of quiet time and expansion in busy bursts often makes breakouts more legible than on uniform time charts.
Mean Reversion
In instruments that oscillate, faded moves against the synthetic Supertrend are easier to time when the bucket cadence slows and Supertrend flattens.
Combine with the synthetic SMA and return statistics in the table for sizing and expectation setting.
Stats table (top right)
Method and Total Samples - Sampling regime and current synthetic history length.
Current Vol or Dollar and Threshold - Live bucket fill versus the trigger.
Bars in Bucket and Avg Bars per Sample - How much time data each synthetic bar tends to compress.
Avg Return and Return StdDev - Simple research metrics over synthetic close-to-close changes.
Why this reduces noise
Time based bars treat a 5 minute print with 1 percent of average participation the same as one with 300 percent. Volume sampling equalizes bar information content. By advancing the bar only when sufficient activity occurs, you skip low quality intervals that add variance but little signal. For banded systems like Supertrend, this often means fewer false flips and cleaner runs.
Notes and tips
Use Dollar Bars on assets where nominal price varies widely over time or across symbols.
Median filter can resist single burst outliers when setting dynamic thresholds.
If you need a stable research baseline, set Use Fixed and keep the threshold constant across tests.
Enable Show Time Bars occasionally to sanity check what the synthetic stream is compressing or stretching.
Link again for reference
Original Volume Based Sampling engine:
Bottom line
When you let participation set the clock, your Supertrend reacts to meaningful flow instead of idle prints. The result is a cleaner state machine, fewer micro whipsaws, and a trend read that respects when the market is actually trading.

Optimum EMAs x2Function Review
Optimum EMAs assesses EMA-price interactions by scoring reaction percentages for bullish/bearish touches. Creates EMA bands (top: most reactive bearish EMA as resistance; bottom: most reactive bullish EMA as support) with customizable test/bull/bear fast/slow EMAs, toggles, adjustable colors/gradients, and reaction table.
Usage Write-Up
Define fast (e.g., 5-15) and slow (e.g., 15-30) EMA ranges based on strategy. Scan with Test EMA for high reaction scores. Set optima in Bull/Bear Fast/Slow inputs to form reactive EMA bands (bullish top support, bearish bottom resistance), enhancing trend signals in bull/bear markets.

SJA WINFUT B3-10
INDICATOR FOR WINFUT B3 – 5-minute chart.
This indicator was designed to trade the Bovespa index futures contract (WINFUT) on the 5-minute chart.
It integrates technical analysis and macroeconomic context elements.
It combines several indicators in which the system calculates a score weighted by color and intensity for each indicator, generating a metric called “STRENGTH %,” which reflects the dominance of buyers (green), sellers (red), or sideways movement (orange) at the moment.
The calculation is adapted to market hours:
Between 9:00 a.m. and 9:59 a.m., it considers only the available indicators; after 10:00 a.m., it uses all data.
The panel displays real-time information, including divergences between strength and price, providing robust decision support for short-term operations on the mini index.
Buying trend.
The more green indicators (at the top of the panel) and dark blue indicators (at the bottom of the panel) and the higher the strength percentage, the greater the probability of buying.
Selling trend.
The more red indicators (at the top of the panel) and dark blue indicators (at the bottom of the panel) and the higher the strength percentage, the greater the probability of selling.
Translated with DeepL.com (free version)

ORDER BLCOK custom strategy# OB Matrix Strategy - Documentation
**Version:** 1.0
**Author:** HPotter
**Date:** 31/07/2017
The **OB Matrix Strategy** is based on the identification of **bullish and bearish Order Blocks** and the management of conditional orders with multiple Take Profit (TP) and Stop Loss (SL) levels. It uses trend filters, ATR, and percentage-based risk management.
---
## 1. Main Parameters
### Strategy
- `initial_capital`: 50
- `default_qty_type`: percentage of capital
- `default_qty_value`: 10
### Money Management
- `rr_threshold`: minimum Risk/Reward threshold to open a trade
- `risk_percent`: percentage of capital to risk per trade (default 2%)
- `maxPendingBars`: maximum number of bars for a pending order
- `maxBarsOpen`: maximum number of bars for an open position
- `qty_tp1`, `qty_tp2`, `qty_tp3`: quantity percentages for multiple TPs
---
## 2. Order Block Identification
### Order Block Parameters
- `obLookback`: number of bars to identify an Order Block
- `obmode`: method to calculate the block (`Full` or `Breadth`)
- `obmiti`: method to determine block mitigation (`Close`, `Wick`, `Avg`)
- `obMaxBlocks`: maximum number of Order Blocks displayed
### Main Variables
- `bullBlocks`: array of bullish blocks
- `bearBlocks`: array of bearish blocks
- `last_bull_volume`, `last_bear_volume`: volume of the last block
- `dom_block`: dominant block type (Bullish/Bearish/None)
- `block_strength`: block strength (normalized volume)
- `price_distance`: distance between current price and nearest block
---
## 3. Visual Parameters
- `Width`: line thickness for swing high/low
- `amountOfBoxes`: block grid segments
- `showBorder`: show block borders
- `borderWidth`: width of block borders
- `showVolume`: display volume inside blocks
- `volumePosition`: vertical position of volume text
Customizable colors:
- `obHighVolumeColor`, `obLowVolumeColor`, `obBearHighVolumeColor`, `obBearLowVolumeColor`
- `obBullBorderColor`, `obBearBorderColor`
- `obBullFillColor`, `obBearFillColor`
- `volumeTextColor`
---
## 4. Screener Table
- `showScreener`: display the screener table
- `tablePosition`: table position (`Top Left`, `Top Right`, `Bottom Left`, `Bottom Right`)
- `tableSize`: table size (`Small`, `Normal`, `Large`)
The table shows:
- Symbol, Timeframe
- Type and status of Order Block
- Number of retests
- Bullish and bearish volumes
---
## 5. Trend Filters
- EMA as a trend filter (`emaPeriod`, default 223)
- `bullishTrend` if close > EMA
- `bearishTrend` if close < EMA
---
## 6. ATR and Swing Points
- ATR calculated with a customizable period (`atrLength`)
- Swing High/Low for SL/TP calculation
- `f_getSwingTargets` function to calculate SL and TP based on direction
---
## 7. Trade Logic
### Buy Limit on Bullish OB
- Conditions:
- New bullish block
- Uptrend
- RR > threshold (`rr_threshold`)
- SL: `bullishOBPrice * (1 - atr * atrMultiplier)`
- Multiple TPs: TP1 (50%), TP2 (80%), TP3 (100% max)
- Quantity calculation based on percentage risk
### Sell Limit on Bearish OB
- Conditions:
- New bearish block
- Downtrend
- RR > threshold (`rr_threshold`)
- SL: `bearishOBPrice * (1 + atr * atrMultiplier)`
- Multiple TPs: TP1 (50%), TP2 (80%), TP3 (100% max)
- Quantity calculation based on percentage risk
---
## 8. Order Management and Timeout
- Close pending orders after `maxPendingBars` bars
- Close open positions after `maxBarsOpen` bars
- Label management for open orders
---
## 9. Alert Conditions
- `bull_touch`: price inside maximum bullish volume zone
- `bear_touch`: price inside maximum bearish volume zone
- `bull_reject`: confirmation of bullish zone rejection
- `bear_reject`: confirmation of bearish zone rejection
- `new_bull`: new bullish block
- `new_bear`: new bearish block
---
## 10. Level Calculation
- Swing levels based on selected timeframe (`SelectPeriod`)
- `xHigh` and `xLow` for S1 and R1 calculation
- Levels plotted on chart
---
## 11. Take Profit / Stop Loss
- Extended horizontal lines (`extendBars`) to visualize TP and SL
- Customizable colors (`tpColor`, `slColor`)
---
## 12. Notes
- Complete script based on Pine Script v5
- Advanced graphical management with boxes, lines, labels
- Dynamically displays volumes and Order Blocks
- Integrated internal screener
---
### End of Documentation

MNQ TopStep 50K | Ultra Quality v3.0MNQ TopStep 50K | Ultra Quality v3.0 - Publish Summary
📊 Overview
A professional-grade trading indicator designed specifically for MNQ futures traders using TopStep funded accounts. Combines 7 technical confirmations with 5 advanced safety filters to deliver high-quality trade signals while managing drawdown risk.
🎯 Key Features
Core Signal System
7-Point Confirmation: VWAP, EMA crossovers, 15-min HTF trend, MACD, RSI, ADX, and Volume
Signal Grading: Each signal is rated A+ through D based on 7 quality factors
Quality Threshold: Adjustable minimum grade requirement (A+, A, B, C, D)
Advanced Safety Filters (Customizable)
Mean Reversion Filter - Prevents chasing extended moves beyond VWAP bands
ATR Spike Filter - Avoids trading during extreme volatility events
EMA Spacing Filter - Ensures proper trend separation (optional)
Momentum Filter - Requires consecutive directional bars (optional)
Multi-Timeframe Confirmation - Aligns with 15-min trend (optional)
TopStep Risk Management
Real-time drawdown tracking
Position sizing calculator based on remaining cushion
Daily loss limit monitoring
Consecutive loss protection
Max trades per day limiter
Visual Components
VWAP with 1σ, 2σ, 3σ bands
EMA 9/21 with cloud fill
15-min EMA 50 for HTF trend
Comprehensive metrics dashboard
Risk management panel
Filter status panel
Detailed trade labels with entry, stops, and targets
⚙️ Default Settings (Balanced for Regular Signals)
Technical Indicators
Fast EMA: 9 | Slow EMA: 21 | HTF EMA: 50 (15-min)
MACD: 10/22/9
RSI: 14 period | Thresholds: 52 (buy) / 48 (sell)
ADX: 14 period | Minimum: 20
ATR: 14 period | Stop: 2x | TP1: 2x | TP2: 3x
Volume: 1.2x average required
Session Settings
Default: 9:30 AM - 11:30 AM ET (adjustable)
Avoids first 15 minutes after market open
Customizable trading hours
Safety Filters (Default Configuration)
✅ Mean Reversion: Enabled (2.5σ max from VWAP)
✅ ATR Spike: Enabled (2.0x threshold)
❌ EMA Spacing: Disabled (can enable for quality)
❌ Momentum: Disabled (can enable for quality)
❌ MTF Confirmation: Disabled (can enable for quality)
Risk Controls
Minimum Signal Quality: C (adjustable to A+ for fewer/better signals)
Min Bars Between Signals: 10
Max Trades Per Day: 5
Stop After Consecutive Losses: 2
📈 Expected Performance
With Default Settings:
Signals per week: 10-15 trades
Estimated win rate: 55-60%
Risk-Reward: 1:2 (TP1) and 1:3 (TP2)
With Aggressive Settings (Min Quality = D, All Filters Off):
Signals per week: 20-25 trades
Estimated win rate: 50-55%
With Conservative Settings (Min Quality = A, All Filters On):
Signals per week: 3-5 trades
Estimated win rate: 65-70%
🚀 How to Use
Basic Setup:
Add indicator to MNQ 5-minute chart
Adjust TopStep account settings in inputs
Set your risk per trade percentage (default: 0.5%)
Configure trading session hours
Set minimum signal quality (Start with C for balanced results)
Signal Interpretation:
Green Triangle (BUY): Long signal - all confirmations aligned
Red Triangle (SELL): Short signal - all confirmations aligned
Label Details: Shows entry, stop loss, take profit levels, position size, and signal grade
Signal Grade: A+ = Elite (6-7 points) | A = Strong (5) | B = Good (4) | C = Fair (3)
Dashboard Monitoring:
Top Right: Technical metrics and market conditions
Top Left: Filter status (which filters are passing/blocking)
Bottom Right: TopStep risk metrics and position sizing
⚡ Customization Tips
For More Signals:
Lower "Minimum Signal Quality" to D
Decrease ADX threshold to 18-20
Lower RSI thresholds to 50/50
Reduce Volume multiplier to 1.1x
Disable additional filters
For Higher Quality (Fewer Signals):
Raise "Minimum Signal Quality" to A or A+
Increase ADX threshold to 25-30
Enable all 5 advanced filters
Tighten VWAP distance to 2.0σ
Increase momentum requirement to 3-4 bars
For TopStep Compliance:
Adjust "Max Total Drawdown" and "Daily Loss Limit" to match your account
Update "Already Used Drawdown" daily
Monitor the Risk Panel for cushion remaining
Use recommended contract sizing
🛡️ Risk Disclaimer
IMPORTANT: This indicator is for educational and informational purposes only.
Past performance does not guarantee future results
All trading involves substantial risk of loss
Use proper risk management and position sizing
Test thoroughly in paper trading before live use
The indicator does not guarantee profitable trades
Adjust settings based on your risk tolerance and trading style
Always comply with your broker's and TopStep's rules

MNQ TopStep 50K | Ultra Quality v3.0MNQ TopStep 50K | Ultra Quality v3.0 - Publish Summary📊 OverviewA professional-grade trading indicator designed specifically for MNQ futures traders using TopStep funded accounts. Combines 7 technical confirmations with 5 advanced safety filters to deliver high-quality trade signals while managing drawdown risk.🎯 Key FeaturesCore Signal System
7-Point Confirmation: VWAP, EMA crossovers, 15-min HTF trend, MACD, RSI, ADX, and Volume
Signal Grading: Each signal is rated A+ through D based on 7 quality factors
Quality Threshold: Adjustable minimum grade requirement (A+, A, B, C, D)
Advanced Safety Filters (Customizable)
Mean Reversion Filter - Prevents chasing extended moves beyond VWAP bands
ATR Spike Filter - Avoids trading during extreme volatility events
EMA Spacing Filter - Ensures proper trend separation (optional)
Momentum Filter - Requires consecutive directional bars (optional)
Multi-Timeframe Confirmation - Aligns with 15-min trend (optional)
TopStep Risk Management
Real-time drawdown tracking
Position sizing calculator based on remaining cushion
Daily loss limit monitoring
Consecutive loss protection
Max trades per day limiter
Visual Components
VWAP with 1σ, 2σ, 3σ bands
EMA 9/21 with cloud fill
15-min EMA 50 for HTF trend
Comprehensive metrics dashboard
Risk management panel
Filter status panel
Detailed trade labels with entry, stops, and targets
⚙️ Default Settings (Balanced for Regular Signals)Technical Indicators
Fast EMA: 9 | Slow EMA: 21 | HTF EMA: 50 (15-min)
MACD: 10/22/9
RSI: 14 period | Thresholds: 52 (buy) / 48 (sell)
ADX: 14 period | Minimum: 20
ATR: 14 period | Stop: 2x | TP1: 2x | TP2: 3x
Volume: 1.2x average required
Session Settings
Default: 9:30 AM - 11:30 AM ET (adjustable)
Avoids first 15 minutes after market open
Customizable trading hours
Safety Filters (Default Configuration)
✅ Mean Reversion: Enabled (2.5σ max from VWAP)
✅ ATR Spike: Enabled (2.0x threshold)
❌ EMA Spacing: Disabled (can enable for quality)
❌ Momentum: Disabled (can enable for quality)
❌ MTF Confirmation: Disabled (can enable for quality)
Risk Controls
Minimum Signal Quality: C (adjustable to A+ for fewer/better signals)
Min Bars Between Signals: 10
Max Trades Per Day: 5
Stop After Consecutive Losses: 2
📈 Expected PerformanceWith Default Settings:
Signals per week: 10-15 trades
Estimated win rate: 55-60%
Risk-Reward: 1:2 (TP1) and 1:3 (TP2)
With Aggressive Settings (Min Quality = D, All Filters Off):
Signals per week: 20-25 trades
Estimated win rate: 50-55%
With Conservative Settings (Min Quality = A, All Filters On):
Signals per week: 3-5 trades
Estimated win rate: 65-70%
🚀 How to UseBasic Setup:
Add indicator to MNQ 5-minute chart
Adjust TopStep account settings in inputs
Set your risk per trade percentage (default: 0.5%)
Configure trading session hours
Set minimum signal quality (Start with C for balanced results)
Signal Interpretation:
Green Triangle (BUY): Long signal - all confirmations aligned
Red Triangle (SELL): Short signal - all confirmations aligned
Label Details: Shows entry, stop loss, take profit levels, position size, and signal grade
Signal Grade: A+ = Elite (6-7 points) | A = Strong (5) | B = Good (4) | C = Fair (3)
Dashboard Monitoring:
Top Right: Technical metrics and market conditions
Top Left: Filter status (which filters are passing/blocking)
Bottom Right: TopStep risk metrics and position sizing
⚡ Customization TipsFor More Signals:
Lower "Minimum Signal Quality" to D
Decrease ADX threshold to 18-20
Lower RSI thresholds to 50/50
Reduce Volume multiplier to 1.1x
Disable additional filters
For Higher Quality (Fewer Signals):
Raise "Minimum Signal Quality" to A or A+
Increase ADX threshold to 25-30
Enable all 5 advanced filters
Tighten VWAP distance to 2.0σ
Increase momentum requirement to 3-4 bars
For TopStep Compliance:
Adjust "Max Total Drawdown" and "Daily Loss Limit" to match your account
Update "Already Used Drawdown" daily
Monitor the Risk Panel for cushion remaining
Use recommended contract sizing
🛡️ Risk DisclaimerIMPORTANT: This indicator is for educational and informational purposes only.
Past performance does not guarantee future results
All trading involves substantial risk of loss
Use proper risk management and position sizing
Test thoroughly in paper trading before live use
The indicator does not guarantee profitable trades
Adjust settings based on your risk tolerance and trading style
Always comply with your broker's and TopStep's rules

MTF RSI Heatmap)# MTF RSI Heatmap — v2.7.2
**Hybrid Higher-TF Trend + Intraday Impulse Detection + Smart Counters & Alerts**
Turn your lower pane into a **multi-timeframe market bias dashboard**. This heatmap blends classic RSI momentum with a **hybrid Daily/Weekly MA-stack trend** and an **intraday impulse override** that flags fast moves *as they happen*. Clean, configurable, and built for real trading flow.
---
## What it shows
* **6 stacked rows = 6 timeframes** (bottom → top).
* **Colors**: Green = Bull, Red = Bear, Yellow = Neutral.
* **Header counter**: `Bull X/6 | Bear Y/6` = live agreement across visible rows.
* **Impulse markers** ▲/▼ on intraday rows (5m/15m/60m/240m) when a shock move triggers.
* **Signal bar**: A thin column above the top row when at least **N of 6** rows align (configurable).
---
## Why it’s different
* **Impulse Override (intraday)**
Detects sharp moves using % change over the last *N* bars, optionally gated by **volume > SMA × multiplier**. This catches dumps/pops earlier than RSI alone.
* **Hybrid D/W (structure over noise)**
Daily/Weekly rows can use an **MA stack (8/21/55)** instead of RSI for a more stable higher-timeframe trend read. Optional **price > fast MA** filter for stricter confirmation.
* **Intrabar option**
Flip rows **during the bar** for early reads (accepting repaint on TF close), or keep it close-only for no surprises.
---
## Key features
* 🌈 **Theme**: Classic or High-Contrast colors.
* 🧠 **RSI thresholds**: Bull above 55, Bear below 45 (editable).
* 🧲 **RSI smoothing** (EMA) for intraday rows to reduce flicker.
* 🧰 **Compact left legend** with adjustable text size & opacity.
* 🚨 **Alerts**:
* **Impulse-only** (per TF and “any intraday”)
* **N-of-6 confirmation** (bull/bear)
---
## Recommended settings (fast opens & news)
* **Impulse**: `Bars = 1–2`, `Threshold = 0.25–0.35%`, `Vol confirm = ON`, `Multiplier = 1.3–1.5`.
* **Hybrid D/W**: `ON`, `EMA 8/21/55`, `Price filter = ON`.
* **Intrabar**: `ON` if you want intra-bar updates (repaints at TF close).
---
## How to read it
1. **Row scan**: Are the bottom (fast) rows aligning first? That’s early momentum.
2. **Header counter**: Look for 4+/6 agreement as momentum broadens.
3. **Signal bar**: Acts as a “go/no-go” confirmation when your threshold is met.
4. **Impulse ▲/▼**: Use as a **heads-up** for acceleration; then watch if rows cascade in that direction.
---
## Alerts (exact names)
Create alerts with these built-ins:
* **Impulse UP — any intraday**
* **Impulse DOWN — any intraday**
* **Impulse UP — TF1 / TF2 / TF3 / TF4**
* **Impulse DOWN — TF1 / TF2 / TF3 / TF4**
* **Bull confirmation** (N-of-6)
* **Bear confirmation** (N-of-6)
Tip: Use **Once per bar** or **Once per bar close** depending on whether you enabled *Intrabar*.
---
## Inputs overview
* **Timeframes & visibility** per row.
* **RSI**: length, bull/bear thresholds, optional EMA smoothing (intraday only).
* **Impulse**: bars, %, volume confirm, SMA length, multiplier, markers.
* **Hybrid D/W**: MA type (EMA/SMA/HMA), 8/21/55 lengths, price filter.
* **Theme & Legend**: color theme, label size (Tiny/Small/Normal), legend opacity.
* **Signal**: N required for confirmation (default 4).
---
## Pro tips
* Combine with **session opens**, **VWAP**, and **liquidity levels**.
* If you trade breakouts, let **impulse triggers** cue attention, then wait for **N-of-6** confirmation.
* For swing bias, lean on **Hybrid D/W**—it changes slower, but with intent.
---
## Notes & limitations
* **Intrabar = repaint expected** on higher-TF closes—by design for earlier context.
* Colors/thresholds are general guidance, not signals by themselves.
* Past performance ≠ future results; **this is not financial advice**.
---
If you enjoy this, drop a ⭐ and tell me what you want next: background shading on confirmation, tooltips with RSI/ROC per row, or a MACD/RSI hybrid mode. Trade sharp! ✨