The Oracle: Dip & Top Adaptive Sniper [Hakan Yorganci]█ OVERVIEW
The Oracle: Dip & Top Adaptive Sniper is a precision-focused trend trading strategy designed to solve the biggest problem in swing trading: Timing.
Most trend-following strategies chase price ("FOMO"), buying when the asset is already overextended. The Oracle takes a different approach. It adopts a "Sniper" mentality: it identifies a strong macro trend but patiently waits for a Mean Reversion (pullback) to execute an entry at a discounted price.
By combining the structural strength of Moving Averages (SMA 50/200) with the momentum precision of RSI and the volatility filtering of ADX, this script filters out noise and targets high-probability setups.
█ HOW IT WORKS
This strategy operates on a strictly algorithmic protocol known as "The Yorganci Protocol," which involves three distinct phases: Filter, Target, and Execute.
1. The Macro Filter (Trend Identification)
* SMA 200 Rule: By default, the strategy only scans for buy signals when the price is trading above the 200-period Simple Moving Average. This ensures we are always trading in the direction of the long-term bull market.
* Adaptive Switch: A new feature allows users to toggle the Only Buy Above SMA 200? filter OFF. This enables the strategy to hunt for oversold bounces (dead cat bounces) even during bearish or neutral market structures.
2. The Volatility Filter (ADX Integration)
* Sideways Protection: One of the main weaknesses of moving average strategies is "whipsaw" losses during choppy, ranging markets.
* Solution: The Oracle utilizes the ADX (Average Directional Index). It will BLOCK any trade entry if the ADX is below the threshold (Default: 20). This ensures capital is only deployed when a genuine trend is present.
3. The Sniper Entry (Buying the Dip)
* Instead of buying on breakout strength (e.g., RSI > 60), The Oracle waits for the RSI Moving Average to dip into the "Value Zone" (Default: 45) and cross back up. This technique allows for tighter stops and higher Risk/Reward ratios compared to traditional breakout systems.
█ EXIT STRATEGY
The Oracle employs a dynamic dual-exit mechanism to maximize gains and protect capital:
* Take Profit (The Peak): The strategy monitors RSI heat. When the RSI Moving Average breaches the Overbought Threshold (Default: 75), it signals a "Take Profit", securing gains near the local top before a potential reversal.
* Stop Loss (Trend Invalidated): If the market structure fails and the price closes below the 50-period SMA, the position is immediately closed to prevent deep drawdowns.
█ SETTINGS & CONFIGURATION
* Moving Averages: Fully customizable lengths for Support (SMA 50) and Trend (SMA 200).
* Trend Filter: Checkbox to enable/disable the "Bull Market Only" rule.
* RSI Thresholds:
* Sniper Buy Level: Adjustable (Default: 45). Lower values = Deeper dips, fewer trades.
* Peak Sell Level: Adjustable (Default: 75). Higher values = Longer holds, potentially higher profit.
* ADX Filter: Checkbox to enable/disable volatility filtering.
█ BEST PRACTICES
* Timeframe: Designed primarily for 4H (4-Hour) charts for swing trading. It can also be used on 1H for more frequent signals.
* Assets: Highly effective on trending assets such as Bitcoin (BTC), Ethereum (ETH), and high-volume Altcoins.
* Risk Warning: This strategy is designed for "Long Only" spot or leverage trading. Always use proper risk management.
█ CREDITS
* Original Concept: Inspired by the foundational work of Murat Besiroglu (@muratkbesiroglu).
* Algorithm Development & Enhancements: Developed by Hakan Yorganci (@hknyrgnc).
* Modifications include: Integration of ADX filters, Mean Reversion entry logic (RSI Dip), and Dynamic Peak Profit taking.
Cerca negli script per "top"

Nifty Participants - Top 10 📌 Nifty Participants – Top 10 (Indicator Description)
This indicator displays the top 10 weighted stocks from the NIFTY index and shows how each stock is contributing to the index movement in real time.
For each participant, the script calculates price change, percentage change, RSI, VWAP position, volume spike, previous day levels, and their estimated participation based on weightage.
A dynamic table is plotted on the chart with color-coded cells for bullish, bearish, and neutral conditions. Users can customize which columns to display (LTP, Change, Change %, Share, RSI, VWAP, Volume Spike, Previous Day High/Low) and select the timeframe for calculations. The index itself appears as the first row for quick comparison.
Volume spikes are highlighted when current volume exceeds a configurable multiple of the average volume. RSI and VWAP columns also use adaptive coloring to quickly show strength or weakness.
All weightages are user-editable, and the table automatically limits output to the selected number of rows. This makes it an ideal real-time market breadth and contribution tracker for intraday and positional traders.

BTC 1m Chop Top/Bottom Reversal (Stable Entries)Strategy Description: BTC 5m Chop Top/Bottom Reversal (Stable Entries)
This strategy is engineered to capture precise reversal points during Bitcoin’s choppy or sideways price action on the 5-minute timeframe. It identifies short-term tops and bottoms using a confluence of volatility bands, momentum indicators, and price structure, optimized for high-probability scalping and intraday reversals.
Core Logic:
Volatility Filter: Uses an EMA with ATR bands to define overextended price zones.
Momentum Divergence: Confirms reversals using RSI and MACD histogram shifts.
Price Action Filter: Requires candle confirmation in the direction of the trade.
Locked Signal Logic: Prevents repaints and disappearing trades by confirming signals only once per bar.
Trade Parameters:
Short Entry: Above upper band + overbought RSI + weakening MACD + bearish candle
Long Entry: Below lower band + oversold RSI + strengthening MACD + bullish candle
Take Profit: ±0.75%
Stop Loss: ±0.4%
This setup is tuned for traders using tight risk control and leverage, where execution precision and minimal drawdown tolerance are critical.

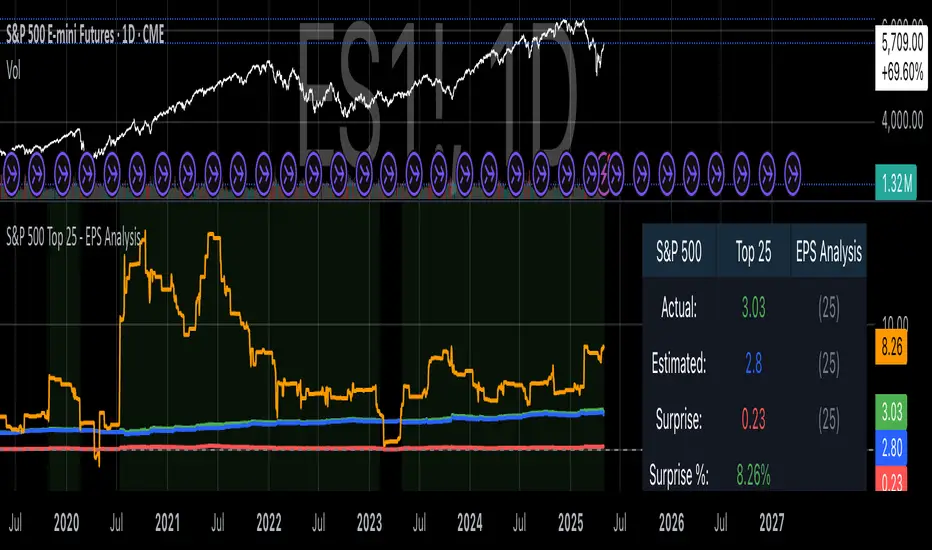
S&P 500 Top 25 - EPS AnalysisEarnings Surprise Analysis Framework for S&P 500 Components: A Technical Implementation
The "S&P 500 Top 25 - EPS Analysis" indicator represents a sophisticated technical implementation designed to analyze earnings surprises among major market constituents. Earnings surprises, defined as the deviation between actual reported earnings per share (EPS) and analyst estimates, have been consistently documented as significant market-moving events with substantial implications for price discovery and asset valuation (Ball and Brown, 1968; Livnat and Mendenhall, 2006). This implementation provides a comprehensive framework for quantifying and visualizing these deviations across multiple timeframes.
The methodology employs a parameterized approach that allows for dynamic analysis of up to 25 top market capitalization components of the S&P 500 index. As noted by Bartov et al. (2002), large-cap stocks typically demonstrate different earnings response coefficients compared to their smaller counterparts, justifying the focus on market leaders.
The technical infrastructure leverages the TradingView Pine Script language (version 6) to construct a real-time analytical framework that processes both actual and estimated EPS data through the platform's request.earnings() function, consistent with approaches described by Pine (2022) in financial indicator development documentation.
At its core, the indicator calculates three primary metrics: actual EPS, estimated EPS, and earnings surprise (both absolute and percentage values). This calculation methodology aligns with standardized approaches in financial literature (Skinner and Sloan, 2002; Ke and Yu, 2006), where percentage surprise is computed as: (Actual EPS - Estimated EPS) / |Estimated EPS| × 100. The implementation rigorously handles potential division-by-zero scenarios and missing data points through conditional logic gates, ensuring robust performance across varying market conditions.
The visual representation system employs a multi-layered approach consistent with best practices in financial data visualization (Few, 2009; Tufte, 2001).
The indicator presents time-series plots of the four key metrics (actual EPS, estimated EPS, absolute surprise, and percentage surprise) with customizable color-coding that defaults to industry-standard conventions: green for actual figures, blue for estimates, red for absolute surprises, and orange for percentage deviations. As demonstrated by Padilla et al. (2018), appropriate color mapping significantly enhances the interpretability of financial data visualizations, particularly for identifying anomalies and trends.
The implementation includes an advanced background coloring system that highlights periods of significant earnings surprises (exceeding ±3%), a threshold identified by Kinney et al. (2002) as statistically significant for market reactions.
Additionally, the indicator features a dynamic information panel displaying current values, historical maximums and minimums, and sample counts, providing important context for statistical validity assessment.
From an architectural perspective, the implementation employs a modular design that separates data acquisition, processing, and visualization components. This separation of concerns facilitates maintenance and extensibility, aligning with software engineering best practices for financial applications (Johnson et al., 2020).
The indicator processes individual ticker data independently before aggregating results, mitigating potential issues with missing or irregular data reports.
Applications of this indicator extend beyond merely observational analysis. As demonstrated by Chan et al. (1996) and more recently by Chordia and Shivakumar (2006), earnings surprises can be successfully incorporated into systematic trading strategies. The indicator's ability to track surprise percentages across multiple companies simultaneously provides a foundation for sector-wide analysis and potentially improves portfolio management during earnings seasons, when market volatility typically increases (Patell and Wolfson, 1984).
References:
Ball, R., & Brown, P. (1968). An empirical evaluation of accounting income numbers. Journal of Accounting Research, 6(2), 159-178.
Bartov, E., Givoly, D., & Hayn, C. (2002). The rewards to meeting or beating earnings expectations. Journal of Accounting and Economics, 33(2), 173-204.
Bernard, V. L., & Thomas, J. K. (1989). Post-earnings-announcement drift: Delayed price response or risk premium? Journal of Accounting Research, 27, 1-36.
Chan, L. K., Jegadeesh, N., & Lakonishok, J. (1996). Momentum strategies. The Journal of Finance, 51(5), 1681-1713.
Chordia, T., & Shivakumar, L. (2006). Earnings and price momentum. Journal of Financial Economics, 80(3), 627-656.
Few, S. (2009). Now you see it: Simple visualization techniques for quantitative analysis. Analytics Press.
Gu, S., Kelly, B., & Xiu, D. (2020). Empirical asset pricing via machine learning. The Review of Financial Studies, 33(5), 2223-2273.
Johnson, J. A., Scharfstein, B. S., & Cook, R. G. (2020). Financial software development: Best practices and architectures. Wiley Finance.
Ke, B., & Yu, Y. (2006). The effect of issuing biased earnings forecasts on analysts' access to management and survival. Journal of Accounting Research, 44(5), 965-999.
Kinney, W., Burgstahler, D., & Martin, R. (2002). Earnings surprise "materiality" as measured by stock returns. Journal of Accounting Research, 40(5), 1297-1329.
Livnat, J., & Mendenhall, R. R. (2006). Comparing the post-earnings announcement drift for surprises calculated from analyst and time series forecasts. Journal of Accounting Research, 44(1), 177-205.
Padilla, L., Kay, M., & Hullman, J. (2018). Uncertainty visualization. Handbook of Human-Computer Interaction.
Patell, J. M., & Wolfson, M. A. (1984). The intraday speed of adjustment of stock prices to earnings and dividend announcements. Journal of Financial Economics, 13(2), 223-252.
Skinner, D. J., & Sloan, R. G. (2002). Earnings surprises, growth expectations, and stock returns or don't let an earnings torpedo sink your portfolio. Review of Accounting Studies, 7(2-3), 289-312.
Tufte, E. R. (2001). The visual display of quantitative information (Vol. 2). Graphics Press.
VIX bottom/top with color scale [Ox_kali]📊 Introduction
━━━━━━━━━━━━━━━━━━━━━━━━━━━━━━━━━━━━━━━━━━━
The “VIX Bottom/Top with Color Scale” script is designed to provide an intuitive, color-coded visualization of the VIX (Volatility Index), helping traders interpret market sentiment and volatility extremes in real time.
It segments the VIX into clear threshold zones, each associated with a specific market condition—ranging from fear to calm—using a dynamic color-coded system.
This script offers significant value for the following reasons:
Intuitive Risk Interpretation: Color-coded zones make it easy to interpret market sentiment at a glance.
Dynamic Trend Detection: A 200-period SMA of the VIX is plotted and dynamically colored based on trend direction.
Customization and Flexibility: All colors are editable in the parameters panel, grouped under “## Color parameters ##”.
Visual Clarity: Key thresholds are marked with horizontal lines for quick reference.
Practical Trading Tool: Helps identify high-risk and low-risk environments based on volatility levels.
🔍 Key Indicators
━━━━━━━━━━━━━━━━━━━━━━━━━━━━━━━━━━━━━━━━━━━
VIX (CBOE Volatility Index) : Measures market volatility and investor fear.
SMA 200 : Long-term trendline of the VIX, with color-coded direction (green = uptrend, red = downtrend).
Color-coded VIX Levels:
🔴 33+ → Something bad just happened
🟠 23–33 → Something bad is happening
🟡 17–23 → Something bad might happen
🟢 14–17 → Nothing bad is happening
✅ 12–14 → Nothing bad will ever happen
🔵 <12 → Something bad is going to happen
🧠 Originality and Purpose
━━━━━━━━━━━━━━━━━━━━━━━━━━━━━━━━━━━━━━━━━━━
Unlike traditional VIX indicators that only plot a line, this script enhances interpretation through visual segmentation and dynamic trend tracking.
It serves as a risk-awareness tool that transforms the VIX into a simple, emotional market map.
This is the first version of the script, and future updates may include alerts, background fills, and more advanced features.
⚙️ How It Works
━━━━━━━━━━━━━━━━━━━━━━━━━━━━━━━━━━━━━━━━━━━
The script maps the current VIX value to a range and applies the corresponding color.
It calculates a SMA 200 and colors it green or red depending on its slope.
It displays horizontal dotted lines at key thresholds (12, 14, 17, 23, 33).
All colors are configurable via input parameters under the group: "## Color parameters ##".
🧭 Indicator Visualization and Interpretation
━━━━━━━━━━━━━━━━━━━━━━━━━━━━━━━━━━━━━━━━━━━
The VIX line changes color based on market condition zones.
The SMA line shows long-term direction with dynamic color.
Horizontal threshold lines visually mark the transitions between volatility zones.
Ideal for quickly identifying periods of fear, caution, or stability.
🛠️ Script Parameters
━━━━━━━━━━━━━━━━━━━━━━━━━━━━━━━━━━━━━━━━━━━
Grouped under “## Color parameters ##”, the following elements are customizable:
🎨 VIX Zone Colors:
33+ → Red
23–33 → Orange
17–23 → Yellow
14–17 → Light Green
12–14 → Dark Green
<12 → Blue
📈 SMA Colors:
Uptrend → Green
Downtrend → Red
These settings allow users to match the script’s visuals to their preferred chart style or theme.
✅ Conclusion
━━━━━━━━━━━━━━━━━━━━━━━━━━━━━━━━━━━━━━━━━━━
The “VIX Bottom/Top with Color Scale” is a clean, powerful script designed to simplify how traders view volatility.
By combining long-term trend data with real-time color-coded sentiment analysis, this script becomes a go-to reference for managing risk, timing trades, or simply staying in tune with market mood.
🧪 Notes
━━━━━━━━━━━━━━━━━━━━━━━━━━━━━━━━━━━━━━━━━━━
This is version 1 of the script. More features such as alert conditions, background fill, and dashboard elements may be added soon. Feedback is welcome!
💡 Color code concept inspired by the original VIX interpretation chart by @nsquaredvalue on Twitter. Big thanks for the visual clarity! 💡
⚠️ Disclaimer
━━━━━━━━━━━━━━━━━━━━━━━━━━━━━━━━━━━━━━━━━━━
This script is a visual tool designed to assist in market analysis. It does not guarantee future performance and should be used in conjunction with proper risk management. Past performance is not indicative of future results.

[blackcat] L3 Top and Bottom Divine JudgmentOVERVIEW
The "Top and Bottom Divine Judgment" indicator is designed to identify potential tops and bottoms in the market using a combination of EMAs, SMAs, and custom calculations based on high and low prices. It provides multiple lines and plots to help traders visualize different market conditions and potential turning points.
FEATURES
Customizable EMA and SMA periods for various calculations.
Identification of bullish and bearish trends using EMAs.
Detection of overbought and oversold conditions.
Multiple lines and histograms to indicate specific market conditions and potential reversals.
Visual alerts with colored lines and shapes.
HOW TO USE
Add the script to your TradingView chart.
Customize Settings:
Adjust the short_ema_period, long_ema_period, sma_period, high_period, low_period, and other period inputs in the "Inputs" section.
Bullish and Bearish EMAs:
bullish_ema (yellow) and bearish_ema (fuchsia) are plotted to assess the overall market trend.
When bullish_ema is above bearish_ema, it suggests an uptrend.
When bullish_ema is below bearish_ema, it suggests a downtrend.
High-Low Boundary Line:
A horizontal line at 50 (yellow) represents a midpoint in the normalized price range, helping to identify overbought or oversold conditions.
Danger and Caution, Sell Signal, etc.:
These lines indicate specific conditions where the market might be overextended or due for a reversal.
Histograms for CZS1 and CZS4:
These histograms (aqua and purple) represent changes in certain indicators, possibly related to momentum or volatility, helping traders gauge the strength of trends.
Support Line Cross:
A shape ("●") is plotted when the close price crosses above a calculated support line, which could be a buy signal.
Generate Trading Signals:
Bullish and Bearish Trends:
Use the crossover of bullish_ema and bearish_ema to identify potential trend changes.
Overbought/Oversold Conditions:
Use the High-Low Boundary Line to identify overbought or oversold levels.
Specific Market Conditions:
Use the lines for "Danger and Caution," "Sell Signal," "Weak Out Strong Stay," "Opportunity," "Low Suck," and "High Sell" to identify specific market conditions and potential reversals.
Support Line Cross:
Use the plotted shape to identify potential buy signals when the close price crosses above the support line.
Risk Management:
Use the indicator in conjunction with other tools and risk management strategies to confirm trading signals and manage positions effectively.
LIMITATIONS
The script is based on historical data and does not guarantee future performance.
It is recommended to use the script in conjunction with other analysis tools.
The effectiveness of the strategy may vary depending on the market conditions and asset being traded.
NOTES
The script is designed for educational purposes and should not be considered financial advice.
Users are encouraged to backtest the strategy on a demo account before applying it to live trades.
THANKS
Special thanks to the TradingView community for their support and feedback.

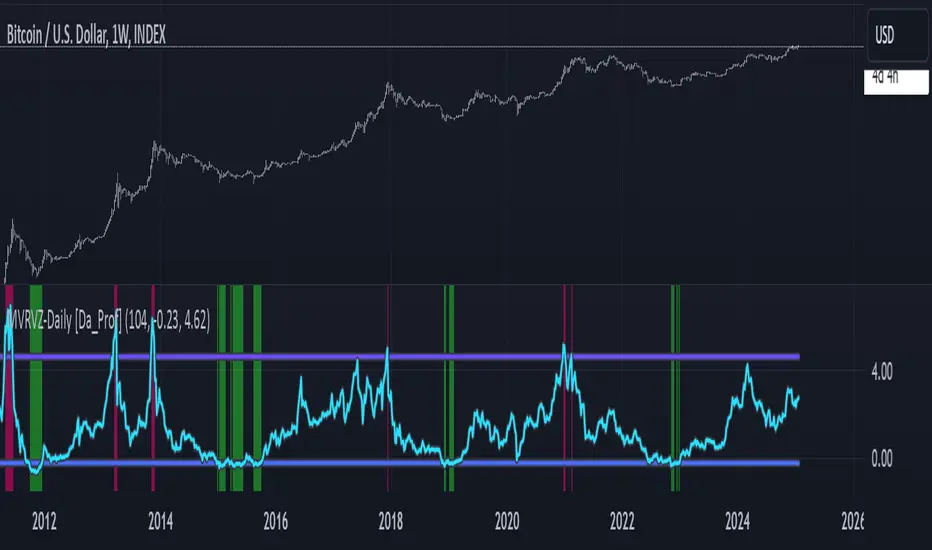
MVRVZ - MVRVZ Top and Bottom Indicator for BTC [Logue]Market Value-Realized Value Z-score (MVRVZ) - The MVRV-Z score measures the value of the bitcoin network by comparing the market cap to the realized value and dividing by the standard deviation of the market cap (market cap – realized cap) / std(market cap)). When the market value is significantly higher than the realized value, the bitcoin network is "overvalued". Very high values have signaled cycle tops in the past and low values have signaled bottoms. For tops, the default trigger value is above 6.85. For bottoms, the indicator is triggered when the MVRVZ is below -0.25 (default).
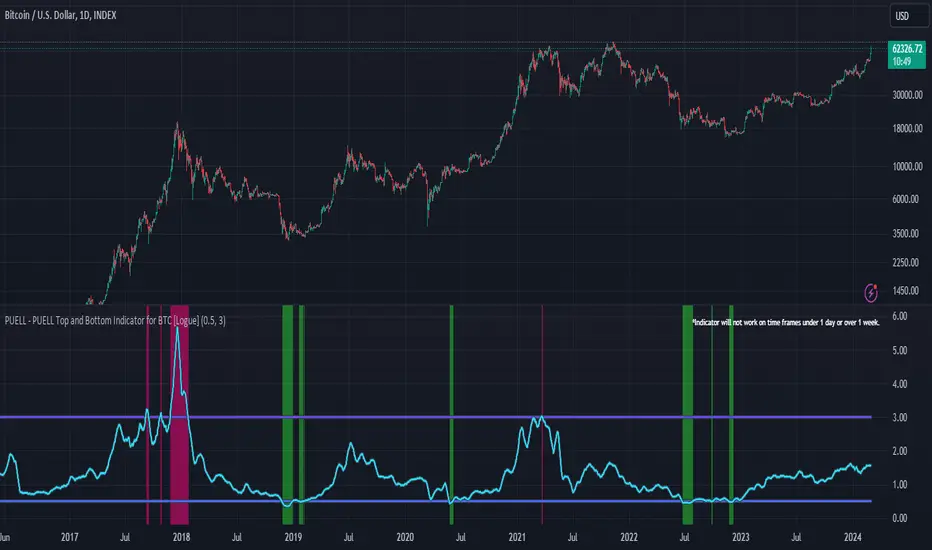
PUELL - PUELL Top and Bottom Indicator for BTC [Logue]Puell Multiple Indicator (PUELL) - The Puell multiple is the ratio between the daily coin issuance in USD and its 365-day moving average. This multiple helps to measure miner profitability. The PUELL indicator smooths the Puell multiple using a 14-day simple moving average. When the PUELL goes to high values relative to historical values, it indicates the profitability of the miners is high and a top may be near. When the PUELL is low relative to historical values, it indicates the profitability of the minors is low and a bottom may be near. The default trigger values are PUELL values above 3.0 for a "top" and below 0.5 for a "bottom".
Crude Oil Top and Bottoms -by Trevor GeallDiscover the Crude Oil Tops and Bottoms Predictor Indicator: Your Key to Market Precision!
How to Use:
Ideal for the daily chart. Wait for the colored background to form.
Confirm signals by waiting for the first candle to close after the background disappears. That would be your sign to go long (if the line is crossing up) or short (if line is crossing dow).
Combine with other indicators for enhanced insights.
Unveil Market Secrets:
Identifies potential tops and bottoms in crude oil.
Empowers strategic trading decisions.
Advanced divergence detection and price channel analysis.
Note: While powerful, no indicator guarantees perfect predictions. Use it alongside comprehensive analysis and risk management. Elevate your crude oil trading now!
PS If I get enough positive feedback on my indicators ill release some of the better ones.

Pro Trading Art - Double Top & Bottom with alertThis indicator is based on ta.pivothigh and ta.pivotlow function. And with the help of different ph and pl I am detecting double top and double bottom.
Features
1. All signal are on realtime means no repaint
2. Able to detect precise double top & bottom
Input Field
Pivot Length : Default 10 => Use to detect pivot point

Horns Pattern Identifier [LuxAlgo]The following script detects regular and inverted horn patterns. Detected patterns are displayed alongside their respective confirmation and take profit levels derived from the pattern measure rule. Breakout of the confirmation levels are highlighted with labels.
This script is a continuation of the educational idea regarding horns patterns.
Settings
Threshold: Controls the maximum allowed slope of the line connecting two horns, with higher values allowing a higher slope.
Usage
Horn patterns are chart patterns introduced by Bulkowski in his book "Encyclopedia of Chart Patterns". We covered this pattern in the following post: Horn Tops & Bottoms Patterns - How To Find and Trade Them
The script allows the user to quickly determine the presence of a regular or inverted horn pattern, alongside automatically displaying the confirmation level and take profits associated with a detected pattern. These are calculated based on the rules described by Bulkowski.
Horn patterns are highlighted by a line connecting the horns, the dotted lines represent the confirmation level, once the price crosses this level a label will appear, either bullish or bearish depending on the detected pattern. The dashed line represents the take profit level.

High Low Index SPY Top 40Modification from original code for "High Low Index" by © LonesomeTheBlue
- Made modification specifically for Top 40 AMEX:SPY holdings
- Added Market sentiment histogram (Total count green vs red), and SMA line for it
- Added arrows for peaks and dips on High Low Index and Market Sentiment MA
Idea behind this indicator is that SPY should follow the overall sentiment of its top holdings. I believe this bring great value to SPY traders.
Enjoy~!

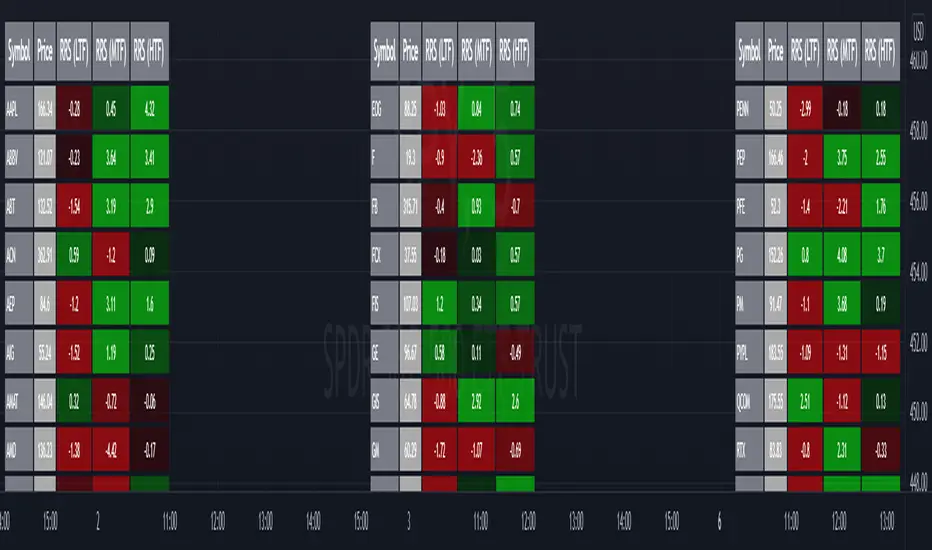
Relative Strength Screener V2 - Top 100 volume leadersNew and improved strength heatmap for the top 100 volume leaders in the S&P. Coded in a workaround to the 40 request.security limitation that currently exists in Pine. Added the ability to input the number of columns (time frames) you wish to display.
For 3 time frame analysis, add the indicator to your chart 3 times. Change the number of columns to 3 for each of these indicators. Specify the column and time frame for each one (example, 5 minute for column 1, 1 hour for column 2 and Daily chart for column 3). It will automatically resize the columns/tables to properly display the output. This provides a sort of "Strength Heatmap" for the top 100 stocks in the S&P. To achieve this, make a copy of the indicator and substitute lines 68-105 with the following premade watchlists :
Make a copy 1 - FIrst 38 volume leaders in the S&P
s01 = input.symbol('AAPL', group = 'Symbols', inline = 's01')
s02 = input.symbol('ABBV', group = 'Symbols', inline = 's02')
s03 = input.symbol('ABT', group = 'Symbols', inline = 's03')
s04 = input.symbol('ACN', group = 'Symbols', inline = 's04')
s05 = input.symbol('AEP', group = 'Symbols', inline = 's05')
s06 = input.symbol('AIG', group = 'Symbols', inline = 's06')
s07 = input.symbol('AMAT', group = 'Symbols', inline = 's07')
s08 = input.symbol('AMD', group = 'Symbols', inline = 's08')
s09 = input.symbol('APA', group = 'Symbols', inline = 's09')
s10 = input.symbol('ATVI', group = 'Symbols', inline = 's10')
s11 = input.symbol('AXP', group = 'Symbols', inline = 's11')
s12 = input.symbol('BA', group = 'Symbols', inline = 's12')
s13 = input.symbol('BBWI', group = 'Symbols', inline = 's13')
s14 = input.symbol('BBY', group = 'Symbols', inline = 's14')
s15 = input.symbol('BK', group = 'Symbols', inline = 's15')
s16 = input.symbol('BMY', group = 'Symbols', inline = 's16')
s17 = input.symbol('BRK.B', group = 'Symbols', inline = 's17')
s18 = input.symbol('C', group = 'Symbols', inline = 's18')
s19 = input.symbol('CAT', group = 'Symbols', inline = 's19')
s20 = input.symbol('CCL', group = 'Symbols', inline = 's20')
s21 = input.symbol('CFG', group = 'Symbols', inline = 's21')
s22 = input.symbol('CL', group = 'Symbols', inline = 's22')
s23 = input.symbol('CNC', group = 'Symbols', inline = 's23')
s24 = input.symbol('COF', group = 'Symbols', inline = 's24')
s25 = input.symbol('COP', group = 'Symbols', inline = 's25')
s26 = input.symbol('COST', group = 'Symbols', inline = 's26')
s27 = input.symbol('CRM', group = 'Symbols', inline = 's27')
s28 = input.symbol('CVS', group = 'Symbols', inline = 's28')
s29 = input.symbol('CVX', group = 'Symbols', inline = 's29')
s30 = input.symbol('DAL', group = 'Symbols', inline = 's30')
s31 = input.symbol('DIS', group = 'Symbols', inline = 's31')
s32 = input.symbol('DISCA', group = 'Symbols', inline = 's32')
s33 = input.symbol('DISCK', group = 'Symbols', inline = 's33')
s34 = input.symbol('DISH', group = 'Symbols', inline = 's34')
s35 = input.symbol('DLTR', group = 'Symbols', inline = 's35')
s36 = input.symbol('DOW', group = 'Symbols', inline = 's36')
s37 = input.symbol('DVN', group = 'Symbols', inline = 's37')
s38 = input.symbol('EBAY', group = 'Symbols', inline = 's38')
Make a copy 2 - Tickers 39 to 76
s01 = input.symbol('EOG', group = 'Symbols', inline = 's01')
s02 = input.symbol('F', group = 'Symbols', inline = 's02')
s03 = input.symbol('FB', group = 'Symbols', inline = 's03')
s04 = input.symbol('FCX', group = 'Symbols', inline = 's04')
s05 = input.symbol('FIS', group = 'Symbols', inline = 's05')
s06 = input.symbol('GE', group = 'Symbols', inline = 's06')
s07 = input.symbol('GIS', group = 'Symbols', inline = 's07')
s08 = input.symbol('GM', group = 'Symbols', inline = 's08')
s09 = input.symbol('GS', group = 'Symbols', inline = 's09')
s10 = input.symbol('HD', group = 'Symbols', inline = 's10')
s11 = input.symbol('IBM', group = 'Symbols', inline = 's11')
s12 = input.symbol('INTC', group = 'Symbols', inline = 's12')
s13 = input.symbol('JNJ', group = 'Symbols', inline = 's13')
s14 = input.symbol('JPM', group = 'Symbols', inline = 's14')
s15 = input.symbol('KR', group = 'Symbols', inline = 's15')
s16 = input.symbol('LUV', group = 'Symbols', inline = 's16')
s17 = input.symbol('LVS', group = 'Symbols', inline = 's17')
s18 = input.symbol('MA', group = 'Symbols', inline = 's18')
s19 = input.symbol('MCD', group = 'Symbols', inline = 's19')
s20 = input.symbol('MCHP', group = 'Symbols', inline = 's20')
s21 = input.symbol('MDT', group = 'Symbols', inline = 's21')
s22 = input.symbol('MET', group = 'Symbols', inline = 's22')
s23 = input.symbol('MGM', group = 'Symbols', inline = 's23')
s24 = input.symbol('MOS', group = 'Symbols', inline = 's24')
s25 = input.symbol('MPC', group = 'Symbols', inline = 's25')
s26 = input.symbol('MRK', group = 'Symbols', inline = 's26')
s27 = input.symbol('MRNA', group = 'Symbols', inline = 's27')
s28 = input.symbol('MS', group = 'Symbols', inline = 's28')
s29 = input.symbol('MSFT', group = 'Symbols', inline = 's29')
s30 = input.symbol('MU', group = 'Symbols', inline = 's30')
s31 = input.symbol('NCLH', group = 'Symbols', inline = 's31')
s32 = input.symbol('NEE', group = 'Symbols', inline = 's32')
s33 = input.symbol('NEM', group = 'Symbols', inline = 's33')
s34 = input.symbol('NFLX', group = 'Symbols', inline = 's34')
s35 = input.symbol('NKE', group = 'Symbols', inline = 's35')
s36 = input.symbol('NVDA', group = 'Symbols', inline = 's36')
s37 = input.symbol('ORCL', group = 'Symbols', inline = 's37')
s38 = input.symbol('OXY', group = 'Symbols', inline = 's38')
Make a copy 3 - tickers 77 to 114
s01 = input.symbol('PENN', group = 'Symbols', inline = 's01')
s02 = input.symbol('PEP', group = 'Symbols', inline = 's02')
s03 = input.symbol('PFE', group = 'Symbols', inline = 's03')
s04 = input.symbol('PG', group = 'Symbols', inline = 's04')
s05 = input.symbol('PM', group = 'Symbols', inline = 's05')
s06 = input.symbol('PYPL', group = 'Symbols', inline = 's06')
s07 = input.symbol('QCOM', group = 'Symbols', inline = 's07')
s08 = input.symbol('RTX', group = 'Symbols', inline = 's08')
s09 = input.symbol('SBUX', group = 'Symbols', inline = 's09')
s10 = input.symbol('SCHW', group = 'Symbols', inline = 's10')
s11 = input.symbol('SLB', group = 'Symbols', inline = 's11')
s12 = input.symbol('SYF', group = 'Symbols', inline = 's12')
s13 = input.symbol('T', group = 'Symbols', inline = 's13')
s14 = input.symbol('TFC', group = 'Symbols', inline = 's14')
s15 = input.symbol('TGT', group = 'Symbols', inline = 's15')
s16 = input.symbol('TJX', group = 'Symbols', inline = 's16')
s17 = input.symbol('TMUS', group = 'Symbols', inline = 's17')
s18 = input.symbol('TSLA', group = 'Symbols', inline = 's18')
s19 = input.symbol('TWTR', group = 'Symbols', inline = 's19')
s20 = input.symbol('TXN', group = 'Symbols', inline = 's20')
s21 = input.symbol('UAL', group = 'Symbols', inline = 's21')
s22 = input.symbol('UNH', group = 'Symbols', inline = 's22')
s23 = input.symbol('V', group = 'Symbols', inline = 's23')
s24 = input.symbol('VIAC', group = 'Symbols', inline = 's24')
s25 = input.symbol('WBA', group = 'Symbols', inline = 's25')
s26 = input.symbol('WFC', group = 'Symbols', inline = 's26')
s27 = input.symbol('WMT', group = 'Symbols', inline = 's27')
s28 = input.symbol('WYNN', group = 'Symbols', inline = 's28')
s29 = input.symbol('XOM', group = 'Symbols', inline = 's29')
s30 = input.symbol('SPY', group = 'Symbols', inline = 's30')
s31 = input.symbol('SPY', group = 'Symbols', inline = 's31')
s32 = input.symbol('SPY', group = 'Symbols', inline = 's32')
s33 = input.symbol('SPY', group = 'Symbols', inline = 's33')
s34 = input.symbol('SPY', group = 'Symbols', inline = 's34')
s35 = input.symbol('SPY', group = 'Symbols', inline = 's35')
s36 = input.symbol('SPY', group = 'Symbols', inline = 's36')
s37 = input.symbol('SPY', group = 'Symbols', inline = 's37')
s38 = input.symbol('SPY', group = 'Symbols', inline = 's38')
Oscillator EdgesAnother simple script to be added on top of other indicators. Simply provides a symbol of varying color depending on the value of the oscillator. Allows up to 4 different colors in each direction. Includes alerts conditions. Demonstration is the indicator being applied to the RSI (purple) included in Market Cipher B.
To use, simply add it to your indicator, and choose and oscillator of your choice in the Input Settings. Alternatively, you can just keep it on 'close' and use the built in RSI. Or, you can use the RSI formula on top of something else (if that's your thing).
The names are silly, so I hope this is okay with all of you.
Let me know what you think, and if there are any problems, questions, or concerns!

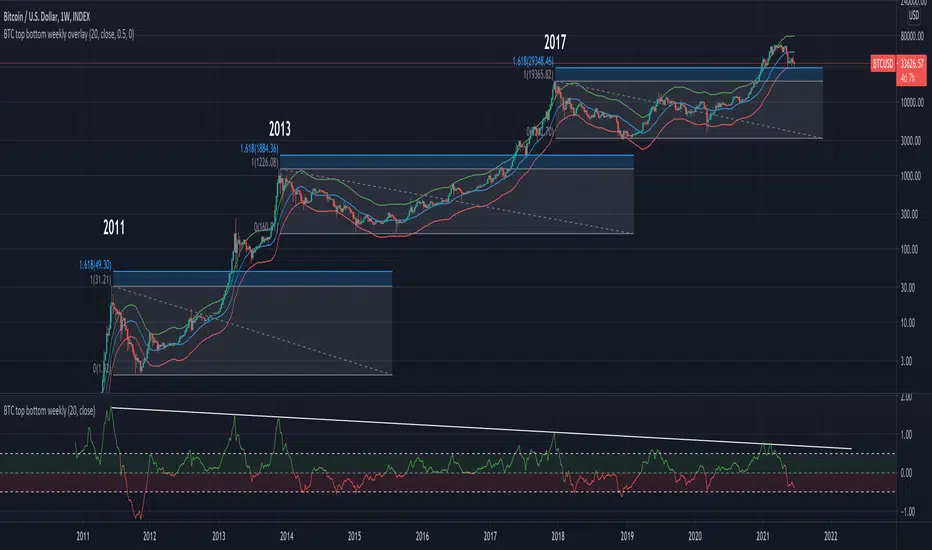
BTC top bottom weekly oscillatorThis indicator is based on the 20 weekly simple moving average and it could be used to help finding potential tops and bottoms on a weekly BTC chart.
This version uses an "oscillator" presentation, it fluctuates around the value zero.
The indicator plots 0 when the close price is near the 20 weekly moving average.
If it's below 0 it reflects the price being below the 20 weekly moving average, and opposite for above.
IT's possible to see how many times the price has hit the 0.5 coef support. In one case it hit 0.6 showing that the 0.5 support can be broken.
The indicator is calculated as Log(close / sma(close))
Instructions:
- Use with the symbol INDEX:BTCUSD so you can see the price since 2010
- Set the timeframe to weekly
Optionals:
- change the coef to 0.6 for a more conservative bottom
- change the coef to 0.4 for a more conservative top

BTC top bottom weekly bandsThis indicator is based on the 20 weekly simple moving average and it could be used to help finding potential tops and bottoms on a weekly BTC chart.
When using the provided "coef" parameter set to the default of 0.5 it shows how most bottoms since 2013 have hit the lower band of this indicator.
The lower band is calculated as exp(coef) * sma(close)
Instructions:
- Use with the symbol INDEX:BTCUSD so you can see the price since 2010
- Set the timeframe to weekly
- Use logarithmic chart (toggle "log" on)
Optionals:
- change the coef to 0.6 for a more conservative bottom
- change the coef to 0.4 for a more conservative top
Boom HunterEvery "boom" begins with a pullback... This indicator will help traders find bottoms and perfect entries into a pump. It combines two indicators, Dr. John Ehlers Early Onset Trend (EOT) and the infamous Stochastic RSI. The indicator features a built in dump and dip detector which usually picks up signals a few candles before it happens. The blue wave (EOT) shows trend, when waves travel up so does the price. Likewise for the opposite. Low points are revealed when EOT bottoms out and flat lines. Traders can then use the Stochastic RSI crossover to enter a trade. As the EOT lines get closer together there is more movement in price action, so as they get wider traders can expect sideways action. This indicator works on all timeframes but has had excellent results on hourly chart.
Entry zones are marked with a green dot at top of indicator. This signals a bottom is being formed and traders should look for an entry.
Exit points are marked with a red dot at top of indicator. This signals a peak and great time to exit.
Dips and dumps are indicated in red at bottom of indicator.

Woobull BTC Top CapA close approximation of Willy Woo's Top Cap indicator.
Top Cap is BTC's market cap cumulative average x 35
Since trading view lacks the data from 2010 to 2014 that is used for the calculation, initial values are taken from Willy Woo's chart.
The indicator must be applied to a CRYPTOCAP:BTC chart and daily timeframe

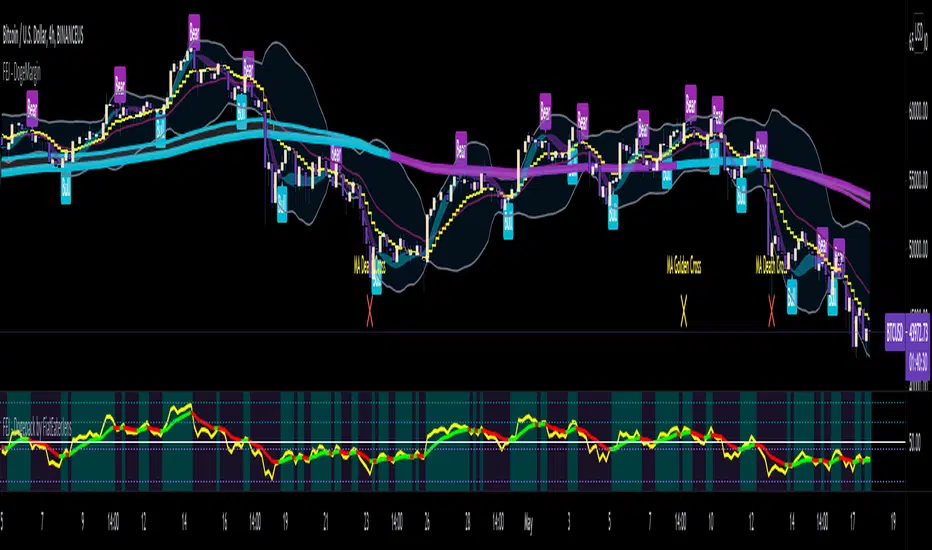
FAJ Dogepack Combines EMA + RSI indicator
Dieses Script ist eine einfache Kombination aus RSI und EMA.
Es erlaubt euch zu erkennen in welche Richtung der Trend in dem aktuellen
TimeFrame geht und wie stark dieser aktuell ist.
Außerdem zeigt es euch ob gerade eher die Bullen oder die Bären den Markt
dominieren. Mit Hilfe des Indikators lassen sich Top und Bottom des aktuellen
Time Frames erkennen.
Ich Empfehle nur eine Nutzung bei BTC um Wellen besser zu erkennen.
Erinnert euch daran, das ist nur eine Beta und gibt immer noch viele Fehlsignale aus, also testet es für euch selber in verschiedenen TimeFrames.
This script is a simple combination of RSI and EMA.
It allows you to see in which direction the trend is going in the current
time frame and how strong it is currently. It also shows you whether the
bulls or the bears are dominating the market. With the help of the indicator,
the top and bottom of the current time frame can be recognized.
recommended only use in BTC to better detect waves.
remember that it is in beta and still sends many false signals so you have to test it well in several time periods.
Sharktank - Pi Cycle PredictionThe Pi Cycle indicator has called tops in Bitcoin quite accurately. Assuming history repeats itself, knowledge about when it might happen again could benefit you.
The indicator is fairly simple:
- A daily moving average of 350 ("long_ma" in script)
- A daily moving average of 111 ("short_ma" in script)
The value of the long moving average is multiplied by two. This way the longer moving average appears above the shorter one.
When the shorter one (orange colored) crosses above the longer (green colored) one, it could mean the top is in.
These moving averages rise at a certain rate. Using these rates we could try to estimate a possible crossover moment. That's exactly what this indicator does! It gives the user a prediction of when a crossover might happen.
Special thanks to:
- Ninorigo, for making his indicator public. This one uses his as a starting point.
- The_Caretaker, for coming up with this idea about calling a top. Yet, his is more price-based, this one is more time-based.

ETH Top Cap [jamesray]This script is modified from Top Cap , as published here.
Historically it matches market tops for ETH

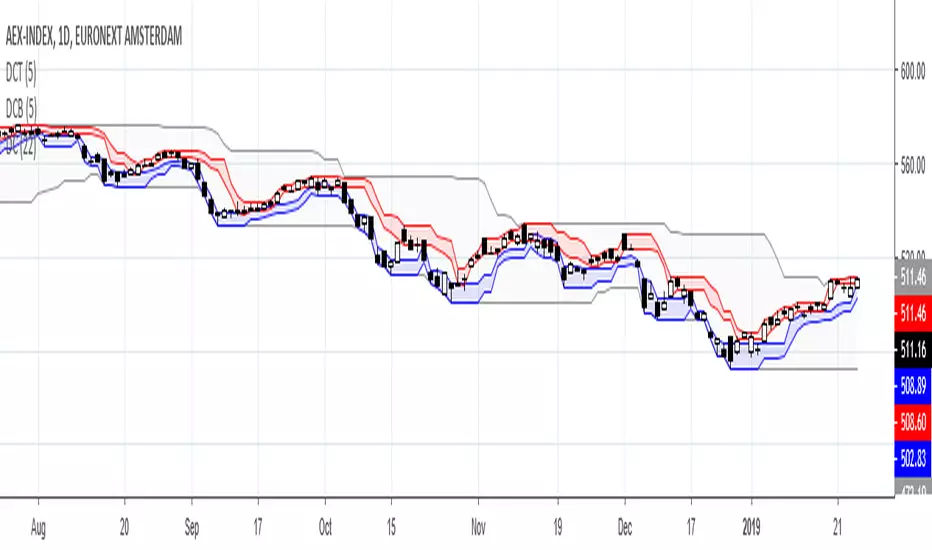
Donchian Channels TopDonchian Channel trends the high/low over a periode. Donchian Channel Top trends the high and the highest low over same periode, indicating possible top range.
Leo Top Alts %Change IndicatorOften BTC movement is predicted by ALT movement. This indicatory takes the top 10 alts and averages their change period over period so for example today vs yesterday. This is like the % number you see in tradingview on the right next to the symbol.
Unfortunately I had to limit it to 10 as it takes a long time to compile, wanted to do top 100
