Comparison (Malaysia Index & Sector)This is just a simple tool for convenient to compare and showing a clear image of all sector and index in Malaysia. They are just in one indicator. From this indicator, you can predict momentum of each sector in Malaysia, which is currently in bull or bear trend.
STRUCTURE
In the setting, the first line with the option of the following index (Malaysia Index) :
1. FBMKLCI
2. FTSEMYX:FBMSCAP
3. FTSEMYX:FBMACE
4. FTSEMYX:FBM70
5. FTSEMYX:FBMT100
6. FTSEMYX:FBMFLG
7. FTSEMYX:FBMEMAS
8. FTSEMYX:FA40
9. FTSEMYX:FBMMSCS
10. FTSEMYX:FBMAPMYR
11. FTSEMYX:FBMMSCAP
The rest of lines is all of the following sector (Malaysia Sector):
1. Technology
2. Telecommunication
3. Health
4. Consumer Product
5. Industrial Product
6. Construction
7. Property
8. Plantation
9. Utilities
10. Transportation
11. Energy
12. REIT
13. Finance
The last line (Line 15) is provided for other stock/index which is not available in option to manually fill.
All sector and index price are smoothen by Moving Average (MA). The default moving average is Relative Moving Average (RMA) which is used in Relative Strength Index ( RSI ) Oscillator. But the range is different from RSI , it is from -100 to 100 instead of 0 to 100. In the end, result and interpretation are just the same as RSI . Green area indicates oversold area, while red area is overbought.
Other choice of Moving Averages are available to change.
The problem of putting all together is the script may take longer to process. It is just for convenient use.
Bottom-Up or Top-Down Invest?
Cerca negli script per "top"

RVI ,Finding Bottom and TopI added a bollinger band to rvi, so we know the upper and lower limits of rvi, and in my opinion the results are satisfactory,
When rvi is below the lower bollinger the indicator will change color to green which indicates a buy signal and vice versa,
But we also have to be careful with changes trends, volume analysis will be helpful for determining the bottoms and top of price movements,
I recommend using this indicator when the price is above MA 200

JSE Top 40 Comparative Relative Strength RSI OscillatorThis code is the result of an idea by @MarcoOlivano. The question was that if putting the comparative relative strength as an RSI oscillator would help in understanding the relative strength of the stock to the overall market? As we both trade the JSE I have made the JSE:J200 or Top 40 the basis for comparison. This can be changed in the settings dropdown if you want to compare with the All Share Index (JSE:J201) or other markets such as the S&P.
On the chart above I have included the Comparative Relative Strength as a reference together with the Comparative Relative Strength RSI.
If you use the indicator or adapt it please let me know if it works for you, how you use it and if it has any value.

JSE Top 40 Comparative Relative StrengthThis code adapts the code by vitvlkv to be appropriate for comparison of JSE stocks with the Top 40 index. It also includes moving averages and Bollinger Bands to identify extreme conditions. You can change the colours and deselect moving averages to make the plot less cluttered. You can also change the selection to compare the stock against to JSE:J201 if you want to compare it to the All Share Index.

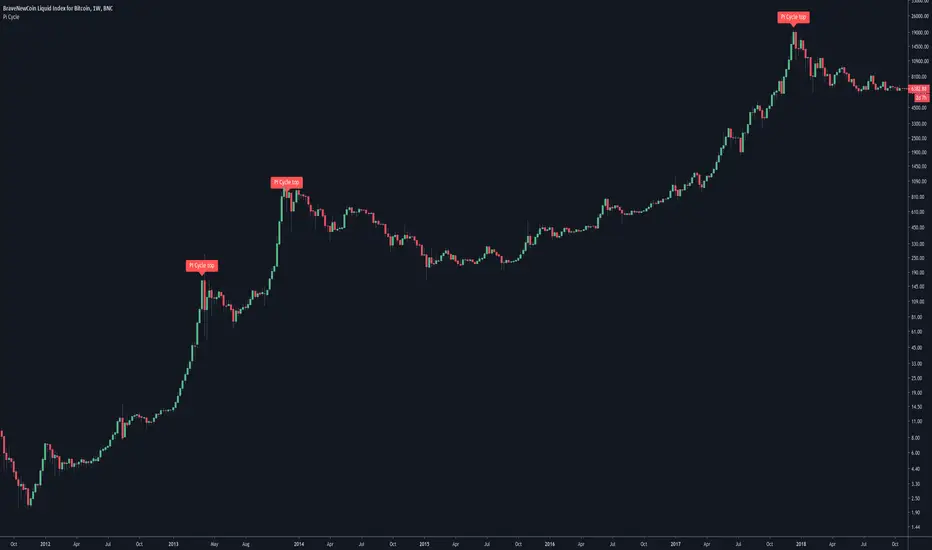
Pi Cycle Bitcoin top indicatorThe Pi Cycle Top Indicator has historically been effective in picking out the timing of market cycle highs to within 3 days.
It uses the 111 day moving average (111DMA) and a newly created multiple of the 350 day moving average, the 350DMA x 2.
Note: The multiple is of the price values of the 350DMA not the number of days.
For the past three market cycles, when the 111DMA moves up and crosses the 350DMA x 2 we see that it coincides with the price of Bitcoin peaking.
It is also interesting to note that 350 / 111 is 3.153, which is very close to Pi = 3.142. In fact, it is the closest we can get to Pi when dividing 350 by another whole number.
It once again demonstrates the cyclical nature of Bitcoin price action over long time frames. Though in this instance it does so with a high degree of accuracy over the past 7 years.
Full Credit to PositiveCrypto
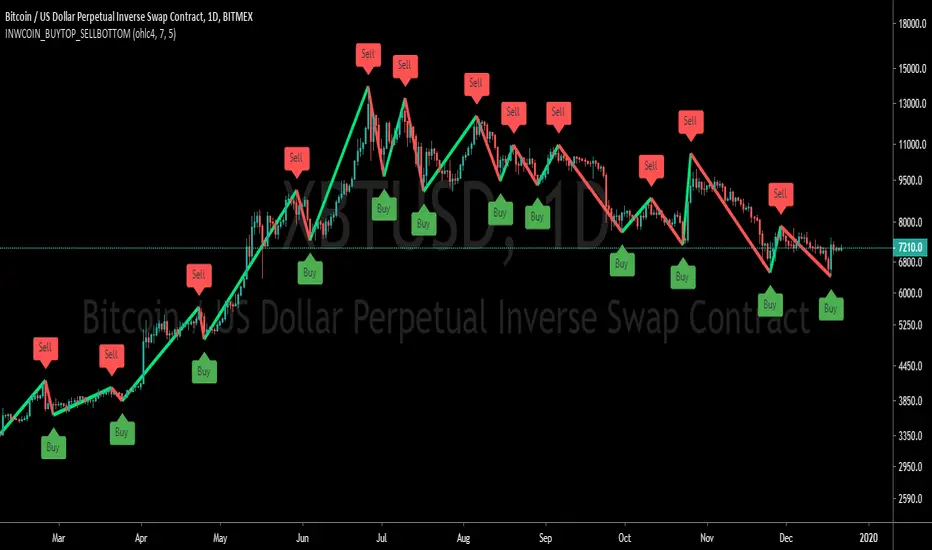
inwCoin Buy Bottom/Sell Top ==============
Eng
==============
base on this study
This study is using Zig-Zag indicator from script above
and to pug a "FAKE" buy & sell at the bottom or top of each duration
I create this to show you guys that you can easily "make up" a 100% win strategy
and to fool any newbies and lure them to VIP group.
==============
Thai
==============
เขียน indicator ง่ายๆ ง่อยๆ โดยเอามาจาก script ที่คนเขาแจกเอาไว้ให้ฟรีๆ ตามลิงค์ข้างบน
โดยหลักการคือจะเป็น strategy Zig-Zag
แล้วเราก็ใส่คำว่า Buy ไว้ที่ก้น
ใส่คำว่า Sell ไว้ที่ยอด
แล้วก็เอามาโพสหลอกเม่า เพื่อให้เห็นว่า อันนี้คือ strategy เทพ
สามารถเข้าที่ก้น ออกที่ยอดได้ตลอดเวลา
มันช่างสุดยอดไปเล้ยพวก!!
อย่าหลงเชื่อนะครับ พวกนี้มันหลอกต้มทั้งนั้น
บ้าบอคอแตก ถ้าทำแบบนี้ได้ทุกครั้ง
ทำตามเอง all-in ทุกครั้งก็รวยตายห่าแล้วครับ
คิดสิ คิด... ใช้สมองหน่อย อย่าเอาไว้คั่นหู
Heiken Ashi Triangles at the Top and Bottom of ScreenHeiken Ashi Triangles at the Top and Bottom of Screen
The image below shows the comparison to actual Heiken Ashi candles
(Though changing from candles to Heiken Ashi tends to smooth the triangles a little)

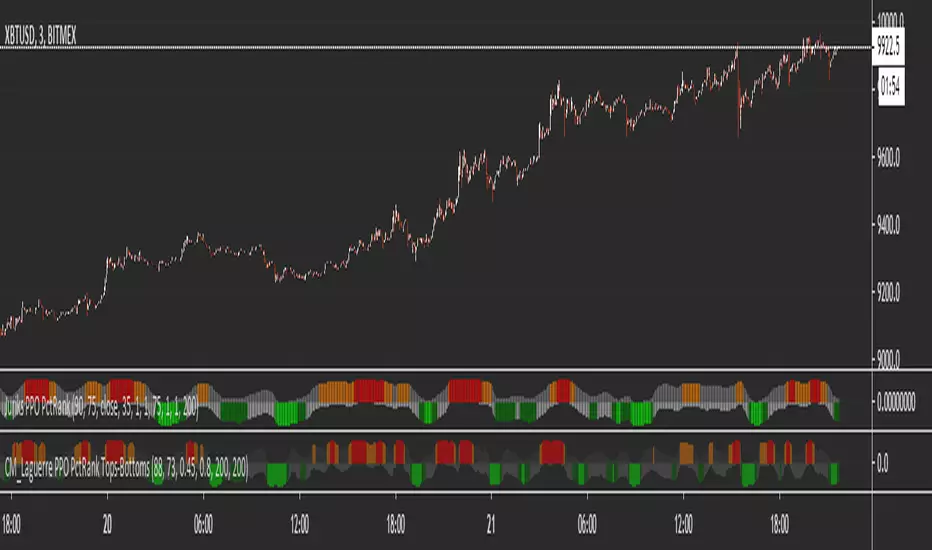
Jurik PPO PercentileRank Mkt Tops & BottomsI saw that Juriks Moving average and its variation of the following script has been pretty popular on MT4/MT5 FX so I decided to try to recreate it in Tradingview.
The basic logic was taken from:
Inspired by the script by one of the most active pinescripters in the early days.
The Jurik Moving average has been created by one of the most active pinescripters nowadays everget:
Those two did all the heavy lifting I am just putting all together.
Cheers to everyone and I hope you guys are a having better day than I am.
Donchian Channels top/bottomDonchian Channels with addition of highest low and lowest high per length. Thus creating a top and bottom channel. Cheers.

CMC Top 5 RSI ScannerScan the RSI for the top 5 cryptos now!
No need to switch between charts anymore. You just need to activate this script and you will have a global view of the current RSI status for your favorite coins. Feel free to edit the source code yourself to add / remove more coins to the scan list.
The transparency will change if the RSI go over the overbuy / oversell zone (default 80/20)
Also, you should display the label names and values on the chart (click on the gear settings at the bottom of your chart > Select "Labels" > Select "Indicator Name label" & "Indicator Last Value Label")
Enjoy!

Divergences for many indicators v2.0A gift from me to all.
This script is developed to find Divergences for many indicators. it analyses divergences and then draws line on the graph. red for negatif, lime for positive divergences.
Currently script checks divergence for RSI, MACD, MACD Histogram, Stochastic, CCI, Momentum, OBV, Diosc, VWMACD and CMF indicators. You can use some or all of these indicators to check divergences as you wish by choosing them on the menu. Also you can add/remove many other indicators to the script to check if there is divergence.
The script first calculates tops/bottoms by using higher time frame zig zag and then finds divergences.
Higher Time Frames are
if currend period 1 min => HTF = 5 mins
if currend period 3 mins => HTF = 15 mins
if currend period 5 mins => HTF = 15 mins
if currend period 15 mins => HTF = 1 hour
if currend period 30 mins => HTF = 1 hour
if currend period 45 mins => HTF = 1 hour
if currend period 1 hour => HTF = 4 hours
if currend period 2 hours => HTF = 4 hours
if currend period 3 hours => HTF = 4 hours
if currend period 4 hours => HTF = 1 day
if currend period 1 day => HTF = 1 week
if currend period 1 week => HTF = 1 week
future plan : script finds regular divergences, soon I will add hidden divergences and also I plan to add alert ;)

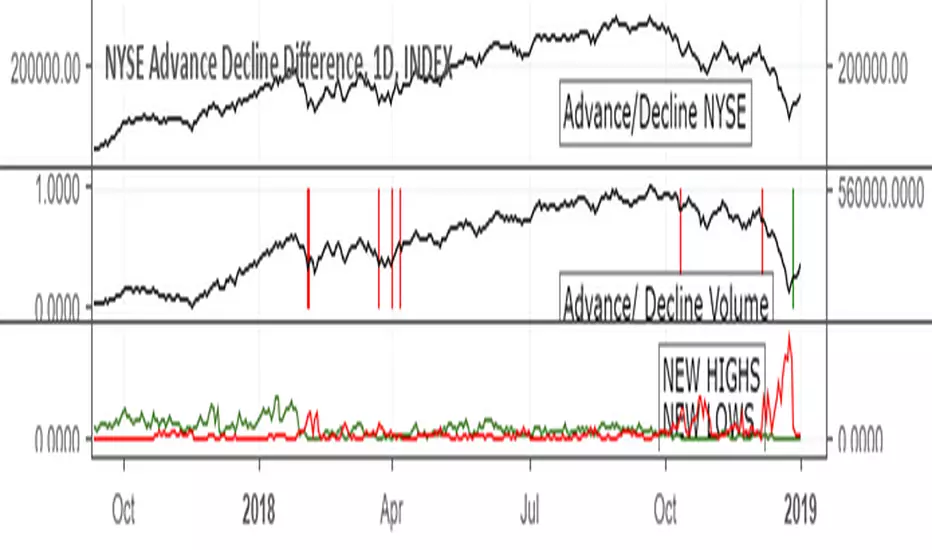
Identify market tops/ bottoms: Advance/ Decline Volume >89%Marks days with up-volume or down-volume greater than 89%. Helps to identify market bottoms or tops.
(Data from NYSE stock exchange)
PPO PercentileRank Mkt Tops & Bottoms (@PuppyTherapy)I was inspired by this script.
works in the same way but I used Exponential averages as a base you can select multiple average types as a base.
You can use even a third moving average to get a slightly different painting than others.
Enter trade when the trend is weakening or with a combination of momentum oscillators / whatever you can find and think that is useful :)

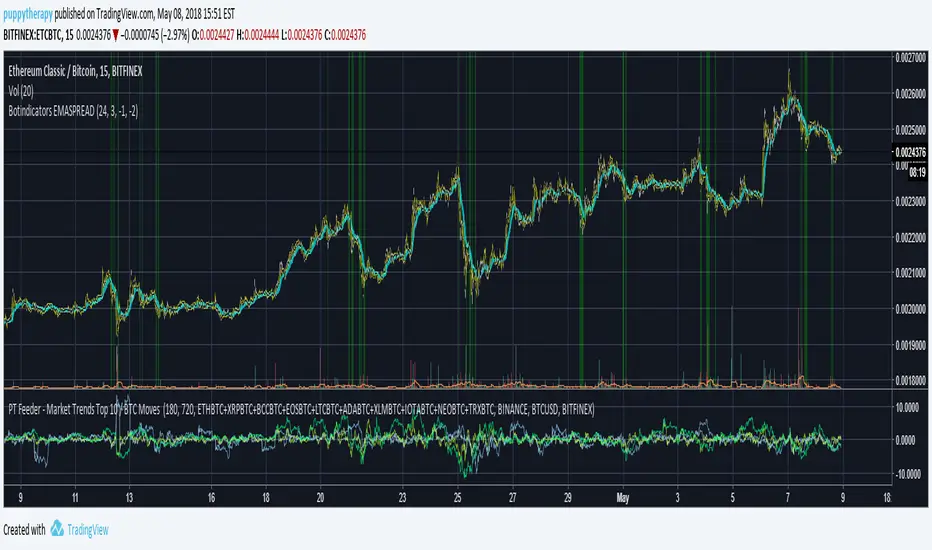
PT Feeder - Market Trends Top 10 / BTC Moves Becasue nobody was kind enough to post some PT Feeder scripts and i knew i could just modify my trends / btc script that i originally created for PT Magic. Well i just did it.
What is this script for ? PT Feeder it allows you to better imagine what kind of values you should be expecting when setting the Market Trends and BTC moves.
Green are top 10 Markets:
"MaxTopCoinLongTermAverageChange": "-3"
"MinBaseCoinPriceChange": "3",
Blue is BTC:
"MinBaseCoinLongTermPriceChange": "-3"
"MaxBaseCoinPriceChange": "3",
Why only 10 markets well becasue tradingview is very limited but it is still better than nothing.
If you like agree and follow !
PT Magic - Market Trends Top 10 ( More is not possible )- Unfortunately more than top 10 trends is not possible sorry
- Some of the colors overlap i will try to fix it soon

Noro's Triple RSI Top/Bottom v1.1In 1.1 added:
+ Leverage-parameter
+ Indicators-parameter
Strategy
It is the indicator. Threefold RSI . 3 different RSI indicators are used:
1) The RSI indicator with the period 2
2) The RSI indicator with the period 7
3) The RSI indicator with the period 14
If at the same time RSI-2 < 10 and RSI-7 < 20 and RSI-14 < 30 = a bottom
If at the same time RSI-2 > 90 and RSI-7 > 80 and RSI-14 > 70 = a top
Parameter accuracy influences.
Strategy allows to measure indicator accuracy. To check whether this indicator is suitable for this pair and a timeframe, how exact.

Noro's Triple RSI Top/BottomIt is the indicator. Threefold RSI. 3 different RSI indicators are used:
1) The RSI indicator with the period 2
2) The RSI indicator with the period 7
3) The RSI indicator with the period 14
If at the same time RSI-2 < 10 and RSI-7 < 20 and RSI-14 < 30 = a bottom
If at the same time RSI-2 > 90 and RSI-7 > 80 and RSI-14 > 70 = a top
Parameter accuracy influences.
Strategy allows to measure indicator accuracy. To check whether this indicator is suitable for this pair and a timeframe, how exact.

1337 VolumeThis volume indicator gives you a unique perspective and ability to analyze volume in any market. The upper line that is always >=0 represents average up volume over a user definable period while the lower line that is always <= 0 represents the average down volume over a user definable period.
green == bullish candle but volume lower than average
lime == bullish candle with above average volume
crimson == bearish candle with below average volume
red == bearish candle with above average volume
This indicator is very useful for spotting bottoms / tops (do a visual backtest and observe its behavior) as well as entry opportunities.
By default, the lookback period for average volume is 7, but I encourage you to change this value in order to find settings that work best for your particular market.
If you have any feedback or ideas for improvement, please comment.
Enjoy :D
Spinning TopsThis is my script for a spinning top. It is just another form of a doji. It is an indecision bar. Enjoy.
Bitcoin Golden Pi CyclesTops are signaled by the fast top MA crossing above the slow top MA, and bottoms are signaled by the slow bottom MA crossing above the fast bottom MA. Alerts can be set on top and bottom prints. Does not repaint.
Similar to the work of Philip Swift regarding the Bitcoin Pi Cycle Top, I’ve recently come across a similar mathematically curious ratio that corresponds to Bitcoin cycle bottoms. This ratio was extracted from skirmantas’ Bitcoin Super Cycle indicator . Cycle bottoms are signaled when the 700D SMA crosses above the 137D SMA (because this indicator is closed source, these moving averages were reverse-engineered). Such crossings have historically coincided with the January 2015 and December 2018 bottoms. Also, although yet to be confirmed as a bottom, a cross occurred June 19, 2022 (two days prior to this article)
The original pi cycle uses the doubled 350D SMA and the 111D SMA . As pointed out this gives the original pi cycle top ratio:
350/111 = 3.1532 ≈ π
Also, as noted by Swift, 111 is the best integer for dividing 350 to approximate π. What is mathematically interesting about skirmanta’s ratio?
700/138 = 5.1095
After playing around with this for a while I realized that 5.11 is very close to the product of the two most numerologically significant geometrical constants, π and the golden ratio, ϕ:
πϕ = 5.0832
However, 138 turns out to be the best integer denominator to approximate πϕ:
700/138 = 5.0725 ≈ πϕ
This is what I’ve dubbed the Bitcoin Golden Pi Bottom Ratio.
In the spirit of numerology I must mention that 137 does have some things going for it: it’s a prime number and is very famously almost exactly the reciprocal of the fine structure constant (α is within 0.03% of 1/137).
Now why 350 and 700 and not say 360 and 720? After all, 360 is obviously much more numerologically significant than 350, which is proven by the fact that 360 has its own wikipedia page, and 350 does not! Using 360/115 and 720/142, which are also approximations of π and πϕ respectively, this also calls cycle tops and bottoms.
There are infinitely many such ratios that could work to approximate π and πϕ (although there are a finite number whose daily moving averages are defined). Further analysis is needed to find the range(s) of numerators (the numerator determines the denominator when maintaining the ratio) that correctly produce bottom and top signals.

[_ParkF]FractalTop gray line is the fractal resistance.
Bottom gray line is the fractal support.
Central red line is the average of the top&bottom fractal.
Fractals can be displayed as support and resistance, and the red fractal average line indicates a trend.
상단 회색선은 프랙탈 저항,
하단 회색선은 프랙탈 지지,
중앙 빨간선은 프랙탈 상,하단의 평균,
프랙탈은 지지와 저항으로 표시되고 빨간색 프랙탈 평균선은 추세입니다.
