CCI based support and resistance strategy
WARNING:
Commissions and slippage has not been considered! Don’t take it easy adding commissions and slippage could turns a fake-profitable strategy to a real disaster.
We consider account size as 10k and we enter 1000 for each trade.
Less than 100 trades is too small sample community and it’s not reliable, Also the performance of the past do not guarantee future performance. This result was handpicked by author and will differ by other timeframes, instruments and settings.
*PLEASE SHARE YOUR SETTINGS THAT WORK WITH THE COMMUNITY.
Introduction:
The CCI-based dynamic support and resistance is a "Bands and Channels" kind of indicator consisting an upper and lower band. This is a strategy which uses CCI-based (Made by me) indicator to execute trades.
SL and TP are calculated based on max ATR during last selected time period. You can edit strategy settings using "Ksl", "Ktp" and the other button for time period. “KSL” and “KTP” are 2.5 and 5 by default.
Bands are calculated regarding CCI previous high and low pivot. CCI length, right pivot length and left pivot length are 50.
A dynamic support and resistance has been calculated using last upper-cci minus a buffer and last lower-cci plus the buffer. The buffer is 10.
If "Trend matter?" button is on you can detect trend by color of the upper and lower line. Green is bullish and red is bearish! "Trend matter?" is on.
The "show mid?" button makes mid line visible, which is average of upper and lower lines, visible. The button is not active by default.
Reaction to the support could be a buy signal while a reaction to the resistance could interpreted as a sell signal.
How this strategy work?
Donald Lambert, a technical analyst, created the CCI, or Commodity Channel Index, which he first published in 1980. CCI is calculated regarding CCI can be used both as trend-detector or an oscillator. As an oscillator most traders believe in static predefined levels. Overbought and oversold candles which are clear in the chart could be used as sell and buy signals.
During my trading career I’ve noticed that there might be some reversal points for the CCI. I believe CCI could have to potential to reverse more from lately reversal point. Of course, just like other trading strategies we are talking about probabilities. We do not expect a win trade each time.
On price chart
Now this the question! What price should the instrument reach that CCI turns to be equal to our reversing aim for CCI? Imagine we have found last important bearish reversal of CCI in 200. Now, if we need the CCI to be 200 what price should we wait for?
How to calculate?
This is the CCI formula:
CCI = (Typical Price - SMA of TP) / (0.015 x Mean Deviation)
Where, Typical Price (TP) = (High + Low + Close)/3
For probable reversing points, high and low pivots of 50 bars have been used.
So we do have an Upper CCI and a Lower CCI. They are valid until the next pivot is available.
By relocating factors in CCI formula you can reach the “Typical Price”.
“
Typical Price = CCI (0.015 * Mean Deviation) + SMA of TP
So we could have a Support or Resistance by replacing CCI with Upper and Lower CCI.
A buy signal is valid if the trend is bullish (or “trend matter” is off) and lowest low of last 2 candles is lower than support and close is greater than both support and open.
A Sell signal is produced in opposite situation.
There are 2+1 options for trend!
Trend matter box is on by default, which means we’ll just open trades in direction of the trend. It’s available to turn it off.
Other 2 options are cross and slope. Cross calculated by comparing fast SMA and slow SMA. The slope one differentiate slow SMA to last “n” one.
Considering last day and today highest ATR as the ATR to calculating SL and TP is our unique technique.
Cerca negli script per "tp"

Euclidean Distance Predictive Candles [SS]Finally releasing this, its been in the works for the past 2 weeks and has undergone many iterations.
I am not sure if I am 100% happy with it yet, but I guess its best to release and get feedback to make improvements.
So this is the Euclidean distance predictive candle indicator and what it does is exactly what it sounds like, it uses Euclidean distance to identify similar candles and then plot the candles and range that immediately proceeded like candles.
While this is using a general machine learning/data science approach (Euclidean distance), I do not employ the KNN (Nearest Neighbors) algo into this. The reason being is it simply offered no predictive advantage than isolating for the last case. I tried it, I didn't like it, the results were not improve and, at times, acutally hindered so I ditched it. Perhaps it was my approach but using some other KNN indicators, I just don't really find them all that more advantageous to simply relying on the Law of Large Numbers and collecting more data rather than less data (which we will get into later in this explanation).
So using this indicator:
There is a lot of customizability here. And the reason is, not all settings are going to work the same for all tickers. To help you narrow down your parameters, I have included various backtest results that show you how the model is performing. You see in the AMZN chart above, with the current settings, it is performing optimally, with a cumulative range pass of 99% (meaning that, of all the cases, the indicator accurately predicted the next day high OR low range 99% of the time), and the ability to predict the candle slightly over 52%.
The recommended settings, from me, are as follows:
So these are generally my recommended settings.
Euclidian Tolerance: This will determine the parameters to look for similar candles. In general, the lower the tolerance, the greater the precision. I recommend keeping it between 0.5, for tickers with larger prices (like ES1! futures or NQ1!) or 0.05 for tickers with lower TPs, like SPY or QQQ.
If the ED Tolerance is too extreme that the indicator cannot find identical setups, it will alert you:
But in general, the more precise you can get it, the better.
Anchor Type: You will see the option to anchor by "Predicted Open" or by "Previous Close". I suggest sticking with anchoring by predicted open. All this means is, it is going to anchor your range, candle, high and low targets by the predicted open price. Anchoring by previous close will anchor by the close of yesterday. Both work okay, but in general the results from anchoring to predicted open have higher pass rates and more accurately depict the candle.
Euclidean Distance Measurement Type: You can choose to measure by candle body or from high to low wicks. I haven't played around with measuring from high to low wicks all that much, because candle body tends to do the job. But remember, ED is a neutral measurement. Which means, its not going to distinguish between a red or green candle, just the formation of the candle. Thus, I tend to recommend, pragmatically, not to necessarily rely on the candle being red or green, but one the formation of the candle (where are the wicks going, are there more bearish wicks or bullish wicks) etc. Examples will follow.
Range Prediction Type: You can filter the range prediction type by last instance (in which, it will pull the previous identical candle and plot the next candle that followed it, adjusted for the current ranges) or "Average of All Cases". So this is where we need to talk a little bit about the law of large numbers.
In general, in statistics, when you have a huge amount of random data, the law of large numbers stipulates that, within this randomness should be repeated events. This is why sometimes chart patterns work, sometimes they don't. When we filter by the average of all cases, we are relying on the law of large numbers. In general, if you are getting good Backtest readings from Last Instance, then you don't need to use this function. But it provides an alternative insight into potential candle formations next day. Its not a bad idea to compare between the two and look for similarities and differences.
So now that we have covered the boring details, let's get into how to use the indicator and some examples.
So the indicator is plotting the range and candle for the next day. As such, we are not looking at the current candle being plotted, but we are looking at the previous candle (see image below for example):
The green arrow shows the prediction for Friday, along with the corresponding result. The purple arrow shows the prediction for Monday which we have yet to realize.
So remember when you are using this, you need to look at the previous candle, and not the candle that it is currently plotting with realtime data, because it is plotting for the next candle.
If you are plotting by last instance, the indicator will tell you which day it is pulling its data from if you have opted to toggle on the demographic data:
You can see the green arrow pointing to the date where it is pulling from. This data serves as the example candle with the candle proceeding this date being the anchored candle (or the predicted candle).
Price Targets and Probability:
In the chart, you can see the green arrow pointing to the green portion of the table. In this table, it will give you the current TPs. These represent the current time target price, which means, the TPs shown here are for Friday. On Monday, the table will update with the TPs for Monday, etc. If you want to view the TPs in advance, you can view them from the actual candle itself.
Below the TPs, you see a bullish 7:6. It means, in a total of 13 cases, the next candle was bullish 7 times and bearish 6 times. Where do we see the number of cases? In the demographic table as well:
Auxiliary functions
Because you are using the previous candle, if you want to avoid confusion, you can have the indicator plot the price targets over the predicted candle, to anchor your attention so to speak. Simply select "Label" in the "Show Price Targets" section, which will look like this:
You can also ask the indicator to plot the demographic data of Higher High, Low, etc. information. What this does is simply looks at all the cases and plots how many times higher highs, lows, lower lows, highs etc. were made:
This will just count all of the cases identified and plot the number of times higher highs, lows, etc. were made.
Concluding Remarks
This is a kind of complex indicator and I can appreciate it may take some getting used to.
I will try to post a tutorial video at some point next week for it, so stay tuned for that.
But this isn't designed to make your life more complicated, just to help give you insights into potential outcomes for the next day or hour or 5 minute (it can be used on all timeframes).
If you find it helpful, great! If not, that's okay, too :-).
Please be aware, this is not my forte of indicators. I am not a data scientist or programmer. My background is in Epi and we don't use these types of data science approaches, so if you have any suggestions or critiques, feel free to share them below.
Otherwise, I hope you enjoy!
Take care everyone and safe trades!

X48 - Strategy | BreakOut & Consecutive (11in1) + Alert | V.1.2================== Read This First Before Use This Strategy ==============
*********** Please be aware that this strategy is not a guarantee of success and may lead to losses.
*********** Trading involves risk and you should always do your own research before making any decisions.
================= Thanks Source Script and Explain This Strategy ===================
► Description
Write a detailed and meaningful description that allows users to understand how your script is original, what it does, how it does it and how to use it
This Strategy Are Combine Strategy and Indicators Alert Function For Systematic Trading User.
Strategy List, Thanks For Original Source Script , From Tradingview Build-in Script From fmzquant Github
// Channel BreakOut Strategy : Calculate BreakOut Zone For Buy and Sell.
// Consecutive Bars UP/Down Strategy : The consecutive bars up/down strategy is a trading strategy used to identify potential buy and sell signals in the stock market. This strategy involves looking for a series of bars (or candles) that are either all increasing or all decreasing in price. If the bars are all increasing, it can be a signal to buy, and if the bars are all decreasing, it can be a signal to sell. This strategy can be used on any timeframe, from a daily chart to an intraday chart.
// 15m Range Length SD : Range Of High and Low Candle Price and Lookback For Calculate Buy and Sell.
Indicators Are Simple Source Script (Almost I'm Chating With CHAT-GPT and Convert pinescript V4 to V5 again for complete almost script and combine after)
// SwingHigh and SwingLow Plot For SL (StopLoss by Last Swing).
// Engulfing and 3 Candle Engulfing Plot.
// Stochastic RSI for Plot and Fill Background Paint and Plot TEXT For BULL and BEAR TREND.
// MA TYPE MODE are plot 2 line of MA Type (EMA, SMA, HMA, WMA, VWMA) for Crossover and Crossunder.
// Donchian Fans MODE are Plot Dot Line With Triangle Degree Bull Trend is Green Plot and Bear Trend is Red Plot.
// Ichimoku Cloud Are Plot Cloud A-B For Bull and Bear Trend.
// RSI OB and OS for TEXT PLOT 'OB' , 'OS' you will know after OB and OS, you can combo with other indicators that's make you know what's the similar trend look like?
// MACD for Plot Diamond when MACD > 0 and MACD < 0, you can combo with other indicators that's make you know what's the similar trend look like?
Alert Can Alert Sent When Buy and Sell or TP and SL, you can adjust text to alert sent by your self or use default setting.
========== Let'e Me Explain How To Use This Strategy =============
========== Properties Setting ==========
// Capital : Default : 1,000 USDT For Alot Of People Are Beginner Investor = It's Capital Your Cash For Investment
// Ordersize : Default Are Setting 5% / Order We Call Compounded
========== INPUT Setting ==========
// First Part Use Must Choose Checkbox For Use of Strategy and Choose TP/SL by Swing or % (can choose both)
// In Detail Of Setting Are Not Too Much, Please Read The Header Of Setting Before Change The Value
// For The Indicator In List You Want To Add Just Check ✅ From MODE Setting, It's Show On Your Chart
// You Can Custom TP/SL % You Want
========== ##### No trading strategy is guaranteed to be 100% successful. ###### =========
For Example In My Systematic Trading
Select 1/3 Strategy Setting TP/SL % Match With Timeframe TP Long Are Not Set It's Can 161.8 - 423.6% but Short Position Are Not Than 100% Just Fine From Your Aset
Choose Indicators For Make Sure Trend and Strategy are the same way like Strategy are Long Position but MACD and Sto background is bear. that's mean this time not open position.
Donchian Fans is Simple Support and Ressistant If You Don't Know How To Plot That's, This indicator plot a simple for you ><.
Make Sure With Engulfing and 3 Candle Engulfing If You Don't Know, What's The Engulfing, This Indicator are plot for you too ><.
For a Big Trend You can use Ichimoku Cloud For Check Trend, Candle Upper Than Cloud or Lower Than Cloud for Bull and Bear Trend.

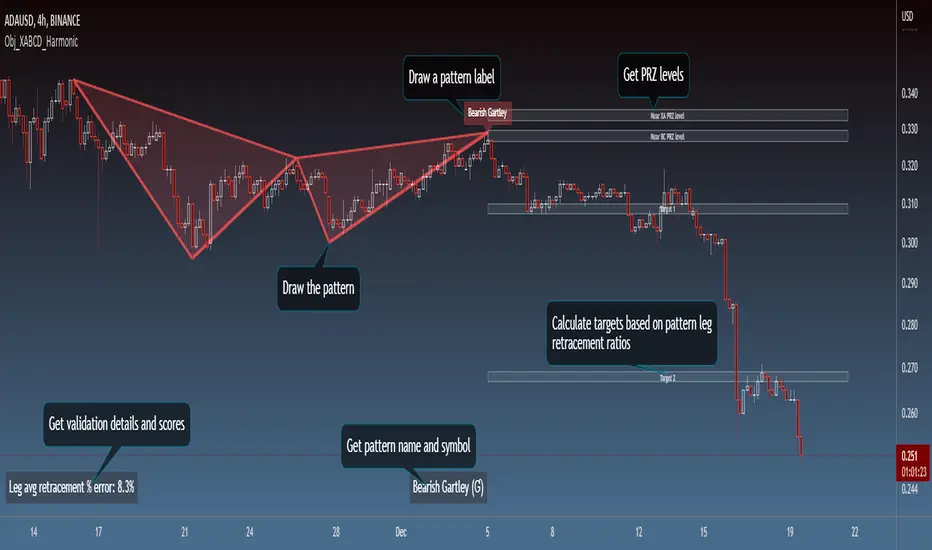
Obj_XABCD_HarmonicLibrary "Obj_XABCD_Harmonic"
Harmonic XABCD Pattern object and associated methods. Easily validate, draw, and get information about harmonic patterns. See example code at the end of the script for details.
init_params(pct_error, pct_asym, types, w_e, w_p, w_d)
Create a harmonic parameters object (used by xabcd_harmonic object for pattern validation and scoring).
Parameters:
pct_error : Allowed % error of leg retracement ratio versus the defined harmonic ratio
pct_asym : Allowed leg length/period asymmetry % (a leg is considered invalid if it is this % longer or shorter than the average length of the other legs)
types : Array of pattern types to validate (1=Gartley, 2=Bat, 3=Butterfly, 4=Crab, 5=Shark, 6=Cypher)
w_e : Weight of ratio % error (used in score calculation, dft = 1)
w_p : Weight of PRZ confluence (used in score calculation, dft = 1)
w_d : Weight of Point D / PRZ confluence (used in score calculation, dft = 1)
Returns: harmonic_params object instance. It is recommended to store and reuse this object for multiple xabcd_harmonic objects rather than creating new params objects unnecessarily.
init(xX, xY, aX, aY, bX, bY, cX, cY, dX, dY, params, tp, p)
Initialize an xabcd_harmonic object instance.
If the pattern is valid, an xabcd_harmonic object instance is returned. If you want to specify your
own validation and scoring parameters, you can do so by passing a harmonic_params object (params).
Or, if you prefer to do your own validation, you can explicitly pass the harmonic pattern type (tp)
and validation will be skipped. You can also pass in an existing xabcd_harmonic instance if you wish
to re-initialize it (e.g. for re-validation and/or re-scoring).
Parameters:
xX : Point X bar index
xY : Point X price/level
aX : Point A bar index
aY : Point A price/level
bX : Point B bar index
bY : Point B price/level
cX : Point C bar index
cY : Point C price/level
dX : Point D bar index
dY : Point D price/level
params : harmonic_params used to validate and score the pattern. Validation will be skipped if a type (tp) is explicitly passed in.
tp : Pattern type
p : xabcd_harmonic object instance to initialize (optional, for re-validation/re-scoring)
Returns: xabcd_harmonic object instance if a valid harmonic, else na
get_name(p)
Get the pattern name
Parameters:
p : Instance of xabcd_harmonic object
Returns: Pattern name (string)
get_symbol(p)
Get the pattern symbol
Parameters:
p : Instance of xabcd_harmonic object
Returns: Pattern symbol (1 byte string)
get_pid(p)
Get the Pattern ID. Patterns of the same type with the same coordinates will have the same Pattern ID.
Parameters:
p : Instance of xabcd_harmonic object
Returns: Pattern ID (string)
set_target(p, target, target_lvl, calc_target)
Set value for a target. Use the calc_target parameter to automatically calculate the target for a specific harmonic ratio.
Parameters:
p : Instance of xabcd_harmonic object
target : Target (1 or 2)
target_lvl : Target price/level (required if calc_target is not specified)
calc_target : Target to auto calculate (required if target is not specified)
Options:
Returns: Target price/level (float)
erase_pattern(p)
Erase the pattern
Parameters:
p : Instance of xabcd_harmonic object
Returns: p
draw_pattern(p)
Draw the pattern
Parameters:
p : Instance of xabcd_harmonic object
Returns: Pattern lines
erase_label(p)
Erase the pattern label
Parameters:
p : Instance of xabcd_harmonic object
Returns: p
draw_label(p, txt, tooltip, clr, txt_clr)
Draw the pattern label. Default text is the pattern name.
Parameters:
p : Instance of xabcd_harmonic object
txt : Label text
tooltip : Tooltip text
clr : Label color
txt_clr : Text color
Returns: Label
harmonic_params
Validation and scoring parameters for a Harmonic Pattern object (xabcd_harmonic)
Fields:
pct_error : Allowed % error of leg retracement ratio versus the defined harmonic ratio
pct_asym
types
w_e
w_p
w_d
xabcd_harmonic
Harmonic Pattern object
Fields:
bull : Bullish pattern flag
tp
xX
xY
aX
aY
bX
bY
cX
cY
dX
dY
r_xb
re_xb
r_ac
re_ac
r_bd
re_bd
r_xd
re_xd
score
score_eAvg
score_prz
score_eD
prz_bN
prz_bF
prz_xN
prz_xF
t1Hit : Target 1 flag
t1
t2Hit
t2
sHit : Stop flag
stop : Stop level
entry : Entry level
eHit
eX
eY
pLines
pLabel
pid
params
Ichimoku Long and Short StrategyThis is a script which tell u when all the parameters in the ichimoku are positive or negative this to open a long or short.
Conditions to show a long:
-Ichimoku cloud in green
-Price Close above Ichimoku cloud
-Lagging span above cloud
-Conversion line above base line
Conditions to show a short:
-Ichimoku cloud in red
-Price close below Ichimoku cloud
-Lagging span below cloud
-Conversion line below base line
Dont take this as principal signal to take longs and shorts. Create your own strategy and dont trust 100% in te indicator.
For highers TF use highers TP and SL and for lowest TF use lowest TP and SL.
This is te settings i use :
15M TF
Conversion line: 9
Base line: 26
Lagging span: 52
displacement: 26
TP: 5%
SL: 3%
1H TF
Conversion line: 9
Base line: 26
Lagging span: 52
displacement: 26
TP: 8%
SL: 4%
If u find better settings pls share ir with us.
TF = Time Frame
TP = Take Profit
SL = Stop Loss
---MERZI---

72s Strat: Backtesting Adaptive HMA+ pt.1This is a follow up to my previous publication of Adaptive HMA+ few months ago, as a mean to provide some kind of initial backtesting tools. Which can be use to explore many possible strategies, optimise its settings to better conform user's pair/tf, and hopefully able to help tweaking your general strategy.
If you haven't read the study or use the indicator, kindly go here first to get the overall idea.
The first strategy introduce in this backtest is one most basic already described in the study; buy/sell is when movement is there and everything is on the right side; When RSI has turned to other side, we can use it as exit point (if in profit of course, else just let it hit our TP/SL, why would we exit before profit). Also, base on RSI when we make entry, we can further differentiate type of signals. --Please check all comments in code directly where the signals , entries , and exits section are.
Second additional strategy to check; is when we also use second faster Adaptive HMA+ for exit. So this is like a double orders on a signal but with different exit-rule (/more on this on snapshots below). Alternatively, you can also work the code so to only use this type of exit.
There's also an additional feature which you can enable its visuals, the Distance Zone , is to help measuring price distance to our xHMA+. It's just a simple atr based envelope really, I already put the sample code in study's comment section, but better gonna update it there directly for non-coder too, after this.
In this sample I use Lot for order quantity size just because that's what I use on my broker. Also what few friends use while we forward-testing it since the study is published, so we also checked/compared each profit/loss report by real number. To use default or other unit of measurement, change the entry code accordingly.
If you change your order size, you should also change the commission in Properties Tab. My broker commission is 5 USD per order/lot, so in there with example order size 0.1 lot I put commission 0.5$ per order (I'll put 2.5$ for 0.5 lot, 10$ for 2 lot, and so on). Crypto usually has higher charge. --It is important that you should fill it base on your broker.
SETTINGS
I'm trying to keep it short. Please explore it further again. (Beginner should also first get acquaintance with terms use here.)
ORDERS:
Base Minimum Profit Before Exit:
The number is multiplier of ongoing ATR. Means that when basic exit condition is met, algo will check whether you're already in minimum profit or not, if not, let it still run to TP or SL, or until it meets subsequent exit condition, then it will check again.
Default Target Profit:
Multiplier of ATR at signal. If reached before any eligible exit condition is met, exit TP.
Base StopLoss Point:
You can change directly in code to use other like ATR Trailing SL, fix percent SL, or whatever. In the sample, 4 options provided.
Maximum StopLoss:
This is like a safety-net, that if at some point your chosen SL point from input above happens to be exceeding this maximum input that you can tolerate, then this max point is the one will be use as SL.
Activate 2nd order...:
The additional doubling of certain buy/sell with different exits as described above. If enable, you should also set pyramiding to at least: 2. If not, it does nothing.
ADAPTIVE HMA+ PERIOD
Many users already have their own settings for these. So in here I only sample the default as first presented in the study. Make it to your adaptive.
MARKET MOVEMENT
(1) Now you can check in realtime how much slope degree is best to define your specific pair/tf is out of congestion (yellow) area. And (2) also able to check directly what ATR lengths are more suitable defining your pair's volatility.
DISTANCE ZONE
Distance Multiplier. Each pair/tf has its own best distance zone (in xHMA+ perspective). The zone also determine whether a signal should appear or not. (Or what type of signal, if you wanna go more detail in constructing your strategy)
USAGE
(Provided you already have your own comfortable settings for minimum-maximum period of Adaptive HMA+. Best if you already have backtested it manually too and/or apply as an add-on to your working strategy)
1. In our experiences, first most important to define is both elements in the Market Movement Settings . These also tend to be persistent for whole season since it's kinda describing that pair/tf overall behaviour. Don't worry if you still get a low Profit Factor here, but by tweaking you should start to see positive changes in one of Max Drawdown and Net Profit, or Percent Profitable.
2. Afterwards, find your pair/tf Distance Zone . When optimising this, what we seek is just a "not to bad" equity curves to start forming. At least Max Drawdown should lessen more. Doesn't have to be great already, but should be better, no red in Net Profit.
3. Then go manage the "Trailing Minimum Profit", TP, SL, and max SL.
4. Repeat 1,2,3. 👻
5. Manage order size, commission, and/or enable double-order (need pyramiding) if you like. Check if your equity can handle max drawdown before margin call.
6. After getting an acceptable backtest result, go to List of Trades tab and find the biggest loss or when many sequencing loss in a row happened. Click on it to go to exact point on chart, observe why the signal failed and get at least general idea how it can be prevented . The rest is yours, you should know your pair/tf more than other.
You can also re-explore your minimum-maximum period for both Major and minor xHMA+.
Keep in mind that all numbers in Setting are conceptually in a form of range . You don't want to get superb equity curves but actually a "fragile" , means one can easily turn it to disaster just by changing only a fraction in one/two of the setting.
---
If you just wanna test the strength of the indicator alone, you can disable "Use StopLoss" temporarily while optimising settings.
Using no SL might be tempting in overall result data in some cases, but NOTE: It is not recommended to not using SL, don't forget that we deliberately enter when it's in high volatility. If want to add flexibility or trading for long-term, just maximise your SL. ie.: chose SL Point>ATR only and set it maximum. (Check your max drawdown after this).
I think this is quite important specially for beginners, so here's an example; Hypothetically in below scenario, because of some settings, the buy order after the loss sell signal didn't appear. Let's say if our initial capital only 1000$ using leverage and order size 0,5 lot (risky position sizing already), moreover if this happens at the beginning of your trading season, that's half of account gone already in one trade . Your max SL should've made you exit after that pumping bar.
The Trailing Minimum Profit is actually look like this. Search in the code if you want to plot it. I just don't like too many lines on chart.
To maximise profit we can try enabling double-order. The only added rule coded is: RSI should rising when buy and falling when sell. 2nd signal will appears above or below default buy/sell signal. (Of course it's also prone to double-loss, re-check your max drawdown after. Profit factor play its part in here for a long run). Snapshot in comparison:
Two default sell signals on left closed at RSI exit, the additional sell signal closed later on when price crossover minor xHMA+. On buy side, price haven't met our minimum profit when first crossunder minor xHMA+. If later on we hit SL on this "+buy" signal, at least we already profited from default buy signal. You can also consider/treat this as multiple TP points.
For longer-term trading, what you need to maximise is the Minimum Profit , so it won't exit whenever an exit condition happened, it can happen several times before reaching minimum profit. Hopefully this snapshot can explain:
Notice in comparison default sell and buy signal now close in average after 3 days. What's best is when we also have confirmation from higher TF. It's like targeting higher TF by entering from smaller TF.
As also mention in the study, we can still experiment via original HMA by putting same value for minimum-maximum period setting. This is experimental EU 1H with Major xHMA+: 144-144, Flat market 13, Distance multiplier 3.6, with 2nd order activated.
Kiwi was a bit surprising for me. It's flat market is effectively below 6, with quite far distance zone of 3.5. Probably because I'm using big numbers in adaptive period.
---
The result you see in strategy tester report below for EURUSD 15m is using just default settings you see in code, as follow:
0,1 lot for each order (which is the smallest allowed by my broker).
No pyramiding. Commission: 0.5 usd per order. Slippage: 3
Opening position is only using basic strategy #1 (RSI exit). Additional exit not activated.
Minimum Profit: 1. TP: 3.
SL use: Half-distance zone. Max SL: 4.5.
Major xHMA+: 172-233. minor xHMA+: 89-121
Distance Zone Multiplier: 2.7
RSI: Standard 14.
(From our forward-testing, the difference we get from net profit is because of the spread, our entry isn't exactly at the close/open price. Not so much though, but not the same. If somebody can direct me to any example where we can code our entry via current bid/ask price, that would be awesome!)
It's already a long post (sorry), think I'm gonna pause here. Check out the code :)
---
DISCLAIMER: Past performance is no guarantee of future results , and so on.. you know the drill ;)
Please read whole description first before using, don't take 1-2 paragraph and claim it's the whole logic, you are responsible of your own actions and understanding.

Full strategy AllinOne with risk management MACD RSI PSAR ATR MAHey, I am glad to present you one of the strategies where I put a lot of time in it.
This strategy can be adapted to all type of timecharts like scalping, daytrading or swing.
The context is the next one :
First we have the ATR to calculate our TP/SL points. At the same time we have another rule once we enter(we enter based on % risk from total equity, in this example 1%, at the same time, lowest ammount for this example is 0.1 lots, but can be modified to 0.01), so we can exit both by tp/sl points, or by losing 1% of our equity or winning 1% of our total equity. It's dinamic.
The strategy is made from
Trend direction :
PSAR
First confirmation point :
Crossover between 10EMA and Bollinger bands middle point
Second confirmation
MACD histogram
Third confirmation
RSI overbought/oversold levels
For entries : we check trend with psar, then once ema cross bb middle point, we confirm together with rsi level for overbought/oversold and macd histogram ( > 0 or <0).
We exit, when we have opposite sign, like from buy to sell or sell to buy, or when we reach tp/sl points, or when we reach % basaed equity points.
It can be changed to be fixed lots, or fixed tp/sl , you just have to uncomment the size from entries, and tp/sl lines.
At the same time, it has the possibility if one desires, to trade only concrete forex session like european, asian and so on for intraday trading.
Hope you enjoy it.
Let me know how it goes.

APEX - Tester - Buy/Sell Strategies - BasicThis is a simple study for backtesting your strategy for the APEX trading bot. It encorporates the following strategies and script created individually :
- Moving averages -
- Bollinger Bands -
- MACD -
- RSI -
- SRSI -
- Stochastic -
- CCI -
- Percentage Change -
- VWAP -
Be aware that the buy points will in no way be exactly the same as APEX. Some buys will be missed by apex (Spikes).
It also encorporates basic riskmangement:
TP - Take profit
SL - Stop Loss
TSL - Trailing Stop Loss
please select at minimum TP and SL combination or TSL (only TP alone wont be enough)
Additional information:
green buy triangle is the basic buy strategy
green sell is casue by TP TSL
orange sell is casue by sell strategy
orange sell is casue by sell strategy
SL red line
TP green line
TSL purple
- Riskmanagement thanks to JustUncleL
- Added S/R lines thanks to buydipsonly ( blue and yellow line )

TMT 1M HA Scalping INDICATOR - Hitesh Nimje📊 TMT 1 Minute HA Scalping Strategy - Hitesh Nimje
🎯 Strategy Overview
A 1-minute scalping strategy designed for high-frequency trading using Heikin Ashi-inspired crossover logic with multiple filters for precision entries.
🔧 Key Components
1. Moving Averages (Trend Detection)
LineTypePeriodColorPurposeFast SMASimple MA9🔵 BluePrimary signal lineSlow SMASimple MA21🔴 RedSecondary confirmationTrend SMASMA (1H)50⚫ BlackOverall market trend bias
2. Entry Signals (Crossover Logic)
🔥 BUY Signal: Fast SMA (9) crosses ABOVE Slow SMA (21)
🔥 SELL Signal: Fast SMA (9) crosses BELOW Slow SMA (21)
3. Entry Filters (4-Layer Confirmation)
✅ LONG Entry = Crossover + Trend Up + RSI Overbought + Bar Confirmed
✅ SHORT Entry = Crossunder + Trend Down + RSI Oversold + Bar Confirmed
longCond = sma_slope > 0 AND rsi >= 70 AND buySignal
shortCond = sma_slope < 0 AND rsi <= 30 AND sellSignal
FilterLongShortPurposeTrend Slopesma_slope > 0sma_slope < 0Market directionRSI FilterRSI >= 70RSI <= 30Momentum extremeCrossoverFast > SlowFast < SlowEntry triggerBar Statebarstate.isconfirmedbarstate.isconfirmedNo repaint
⚡ Risk Management
Stop Loss (Dynamic ATR-based)
Long SL = Lowest Low (7) - 1×ATR(14)
Short SL = Highest High (7) + 1×ATR(14)
Take Profit (1:1 Risk-Reward)
Long TP = Entry + (Entry - SL distance)
Short TP = Entry - (SL distance - Entry)
⏰ Trading Hours
📅 Active: 00:00 - 14:59 (3:00 PM cutoff)
🛑 Auto-close: All positions closed at 15:00
🎨 Visual Elements
📍 BUY Labels: 🟢 Green (below bar)
📍 SELL Labels: 🔴 Red (above bar)
📈 Fast SMA: 🔵 Blue line (9-period)
📉 Slow SMA: 🔴 Red line (21-period)
📊 Trend SMA: ⚫ Black line (50-period, 1H)
⚙️ Input Parameters
ParameterDefaultPurposeEnd of Day1500 (3 PM)Auto-close timeLot Size1Position size
🚀 How It Works (Step-by-Step)
1. Monitor Fast(9) vs Slow(21) SMA crossover
2. Check 1H Trend SMA slope (up/down bias)
3. Validate RSI extreme (70+/30-)
4. Wait for bar confirmation
5. Enter with ATR-based SL & 1:1 TP
6. Auto-exit at 3 PM or SL/TP hit
💡 Strategy Strengths
* ✅ Multi-timeframe trend filter
* ✅ RSI momentum confirmation
* ✅ Dynamic ATR stop losses
* ✅ No repaint signals
* ✅ End-of-day risk control
* ✅ 1:1 Risk-Reward consistency
Perfect for 1-minute scalping on volatile instruments! 🔥
© Hitesh Nimje | Thought Magic Trading
Contact: 8087192915
TRADING DISCLAIMER
RISK WARNING
Trading involves substantial risk of loss and is not suitable for all investors. Past performance is not indicative of future results. You should carefully consider whether trading is suitable for you in light of your circumstances, knowledge, and financial resources.
NO FINANCIAL ADVICE
This indicator is provided for educational and informational purposes only. It does not constitute:
* Financial advice or investment recommendations
* Buy/sell signals or trading signals
* Professional investment advice
* Legal, tax, or accounting guidance
LIMITATIONS AND DISCLAIMERS
Technical Analysis Limitations
* Pivot points are mathematical calculations based on historical price data
* No guarantee of accuracy of price levels or calculations
* Markets can and do behave irrationally for extended periods
* Past performance does not guarantee future results
* Technical analysis should be used in conjunction with fundamental analysis
Data and Calculation Disclaimers
* Calculations are based on available price data at the time of calculation
* Data quality and availability may affect accuracy
* Pivot levels may differ when calculated on different timeframes
* Gaps and irregular market conditions may cause level failures
* Extended hours trading may affect intraday pivot calculations
Market Risks
* Extreme market volatility can invalidate all technical levels
* News events, economic announcements, and market manipulation can cause gaps
* Liquidity issues may prevent execution at calculated levels
* Currency fluctuations, inflation, and interest rate changes affect all levels
* Black swan events and market crashes cannot be predicted by technical analysis
USER RESPONSIBILITIES
Due Diligence
* You are solely responsible for your trading decisions
* Conduct your own research before using this indicator
* Verify calculations with multiple sources before trading
* Consider multiple timeframes and confirm levels with other technical tools
* Never rely solely on one indicator for trading decisions
Risk Management
* Always use proper risk management and position sizing
* Set appropriate stop-losses for all positions
* Never risk more than you can afford to lose
* Consider the inherent risks of leverage and margin trading
* Diversify your portfolio and trading strategies
Professional Consultation
* Consult with qualified financial advisors before trading
* Consider your tax obligations and legal requirements
* Understand the regulations in your jurisdiction
* Seek professional advice for complex trading strategies
LIMITATION OF LIABILITY
Indemnification
The creator and distributor of this indicator shall not be liable for:
* Any trading losses, whether direct or indirect
* Inaccurate or delayed price data
* System failures or technical malfunctions
* Loss of data or profits
* Interruption of service or connectivity issues
No Warranty
This indicator is provided "as is" without warranties of any kind:
* No guarantee of accuracy or completeness
* No warranty of uninterrupted or error-free operation
* No warranty of merchantability or fitness for a particular purpose
* The software may contain bugs or errors
Maximum Liability
In no event shall the liability exceed the purchase price (if any) paid for this indicator. This limitation applies regardless of the theory of liability, whether contract, tort, negligence, or otherwise.
REGULATORY COMPLIANCE
Jurisdiction-Specific Risks
* Regulations vary by country and region
* Some jurisdictions prohibit or restrict certain trading strategies
* Tax implications differ based on your location and trading frequency
* Commodity futures and options trading may have additional requirements
* Currency trading may be regulated differently than stock trading
Professional Trading
* If you are a professional trader, ensure compliance with all applicable regulations
* Adhere to fiduciary duties and best execution requirements
* Maintain required records and reporting
* Follow market abuse regulations and insider trading laws
TECHNICAL SPECIFICATIONS
Data Sources
* Calculations based on TradingView data feeds
* Data accuracy depends on broker and exchange reporting
* Historical data may be subject to adjustments and corrections
* Real-time data may have delays depending on data providers
Software Limitations
* Internet connectivity required for proper operation
* Software updates may change calculations or functionality
* TradingView platform dependencies may affect performance
* Third-party integrations may introduce additional risks
MONEY MANAGEMENT RECOMMENDATIONS
Conservative Approach
* Risk only 1-2% of capital per trade
* Use position sizing based on volatility
* Maintain adequate cash reserves
* Avoid over-leveraging accounts
Portfolio Management
* Diversify across multiple strategies
* Don't put all capital into one approach
* Regularly review and adjust trading strategies
* Maintain detailed trading records
FINAL LEGAL NOTICES
Acceptance of Terms
* By using this indicator, you acknowledge that you have read and understood this disclaimer
* You agree to assume all risks associated with trading
* You confirm that you are legally permitted to trade in your jurisdiction
Updates and Changes
* This disclaimer may be updated without notice
* Continued use constitutes acceptance of any changes
* It is your responsibility to stay informed of updates
Governing Law
* This disclaimer shall be governed by the laws of the jurisdiction where the indicator was created
* Any disputes shall be resolved in the appropriate courts
* Severability clause: If any part of this disclaimer is invalid, the remainder remains enforceable
REMEMBER: THERE ARE NO GUARANTEES IN TRADING. THE MAJORITY OF RETAIL TRADERS LOSE MONEY. TRADE AT YOUR OWN RISK.
Contact Information:
* Creator: Hitesh_Nimje
* Phone: Contact@8087192915
* Source: Thought Magic Trading
© HiteshNimje - All Rights Reserved
This disclaimer should be prominently displayed whenever the indicator is shared, sold, or distributed to ensure users are fully aware of the risks and limitations involved in trading.

ULTRA PRO SCALPING V6//@version=6
indicator("ULTRA PRO SCALPING V6", overlay=true, max_lines_count=500, max_labels_count=500)
// SETTINGS
lengthEMA = input.int(21, "EMA Trend")
riskRR = input.float(1.5, "Ratio TP/SL", step=0.1)
sl_pips = input.float(0.15, "Stop Loss (%)", step=0.01)
showTP_SL = input.bool(true, "Afficher TP & SL")
showSignals = input.bool(true, "Afficher Signaux")
// TREND FILTER
ema = ta.ema(close, lengthEMA)
plot(ema, "EMA", color=color.new(color.yellow, 0), linewidth=2)
// ENTRY SIGNALS
longSignal = ta.crossover(close, ema)
shortSignal = ta.crossunder(close, ema)
// TP/SL SYSTEM
var float lastSL = na
var float lastTP = na
if longSignal
lastSL := close * (1 - sl_pips/100)
lastTP := close + (close - lastSL) * riskRR
if shortSignal
lastSL := close * (1 + sl_pips/100)
lastTP := close - (lastSL - close) * riskRR
// DISPLAY
if showTP_SL and not na(lastSL)
line.new(bar_index-1, lastSL, bar_index, lastSL, color=color.red)
label.new(bar_index, lastSL, "SL", color=color.red)
if showTP_SL and not na(lastTP)
line.new(bar_index-1, lastTP, bar_index, lastTP, color=color.green)
label.new(bar_index, lastTP, "TP", color=color.green)
if showSignals and longSignal
label.new(bar_index, low, "BUY", color=color.green, style=label.style_label_up)
if showSignals and shortSignal
label.new(bar_index, high, "SELL", color=color.red, style=label.style_label_down)
// ALERTS
alertcondition(longSignal, "BUY Signal", "Signal d’achat détecté")
alertcondition(shortSignal, "SELL Signal", "Signal de vente détecté")

kira 3 mins scalp3-min Strict Scalping HA + PSAR + RSI + 1:2 RR
Purpose: 3-minute scalping using Heikin Ashi candles, Parabolic SAR, and RSI with strict entry rules and automatic 1:2 risk:reward.
Logic:
Entry: 3rd consecutive HA candle with no wick (bullish for buy, bearish for sell)
Filters:
Buy: PSAR below candle + RSI > 50
Sell: PSAR above candle + RSI < 50
SL & TP:
Buy SL: lowest low of last 3 candles
Buy TP: entry + 2×(entry−SL)
Sell SL: highest high of last 3 candles
Sell TP: entry − 2×(SL−entry)
Signals: Triangles plotted on chart; alerts available
Use: Apply on 3-min chart. Enter on 3rd candle meeting conditions; follow SL/TP for 1:2 RR.

Buy Sell SignalBuy Sell Signal - EMA Crossover with Dynamic Risk Management
OVERVIEW
This indicator combines a dual EMA crossover system with ATR-based dynamic stop loss and take profit levels to provide complete trade management signals. Unlike basic EMA crossover scripts, this tool automatically calculates and displays entry points, stop losses, and take profit targets based on market volatility, offering traders a complete trading framework in a single indicator.
HOW IT WORKS
The indicator uses three core components working together:
Trend Detection: A fast EMA (default 5) and slow EMA (default 13) identify trend direction. When the fast EMA crosses above the slow EMA, it signals bullish momentum; when it crosses below, it signals bearish momentum.
Entry Validation: Optional candle confirmation filter ensures the crossover is accompanied by a bullish/bearish candle close, reducing false signals in choppy markets.
Risk Management: Uses ATR (Average True Range, default 14 periods) to calculate:
Stop Loss: Positioned below/above recent swing low/high minus ATR multiplier (default 0.5x)
Take Profit: Calculated using customizable risk-reward ratio (default 3:1)
KEY FEATURES
✅ Automatic Position Tracking: Monitors active trades and displays current position status (LONG/SHORT/No position)
✅ Visual Trade Management: Shows entry price (white dashed line), stop loss (red line), and take profit (green line) in real-time
✅ Trade Outcome Signals: Displays clear markers when TP is hit (🎯), SL is triggered (❌), or position is invalidated by opposite signal
✅ Information Dashboard: Live table showing entry price, SL, TP, and actual R:R ratio
✅ Smart Position Invalidation: Automatically closes and invalidates previous positions when opposite trend signal appears
✅ Customizable Alerts: Five alert conditions for BUY/SELL signals, TP hits, SL triggers, and invalidations
INPUTS
Fast EMA Length (default 5): Responsive to recent price action
Slow EMA Length (default 13): Defines broader trend direction
ATR Period (default 14): Volatility measurement period
SL Multiplier (default 0.5): Distance from swing point to stop loss
Risk:Reward Ratio (default 3.0): Target profit relative to risk
Candle Confirmation (default ON): Requires bullish/bearish candle on crossover
HOW TO USE
Apply the indicator to your chart (works on all timeframes)
Adjust EMA periods based on your trading style (shorter for scalping, longer for swing trading)
Set your preferred risk-reward ratio
Enable alerts for automated notifications
When a BUY/SELL signal appears, the indicator automatically calculates and displays your complete trade plan
Monitor the information table for live position updates
Exit when TP is reached or SL is triggered
TRADING METHODOLOGY
This script implements a momentum-following strategy based on exponential moving average crossovers, enhanced with volatility-adjusted risk parameters. The ATR-based stop loss adapts to market conditions—wider stops in volatile markets, tighter stops in calm markets. The position invalidation feature prevents traders from holding outdated positions when market sentiment shifts.
BEST PRACTICES
Use on trending markets for best results
Higher timeframes (4H, Daily) produce fewer but more reliable signals.
For scalpe use 5 and 15 minutes(Risk).
Consider market context and fundamental factors alongside signals
Adjust ATR multiplier based on asset volatility
Test different EMA combinations for your preferred instruments
ORIGINALITY
While EMA crossover systems are common, this script's value lies in its complete integration of entry logic, dynamic risk management, position tracking, and automated invalidation—features typically requiring multiple separate indicators. The ATR-based stop loss calculation and automatic R:R visualization provide practical trade execution guidance that basic crossover indicators lack.
Important Notes:
This indicator does not guarantee profitable trades
Always practice proper risk management
Backtest settings on historical data before live trading
Past performance does not indicate future results

Final Scalping Strategy - RELAXED ENTRY, jangan gopoh braderEMA Scalping System (MTF) Guide (1HR direction, 15 min entry)
Objective
To capture small, consistent profits by entering trades when 15-minute momentum aligns with the 1-hour trend.
Trades are executed only during high-liquidity London and New York sessions to increase the probability of execution and success.
Strategy Setup
Chart Timeframe (Execution): 15-Minute (M15).
Trend Filter (HTF): 1-Hour (H1) chart data is used for the long-term EMA.
Long-Term Trend Filter: 50-Period EMA (based on H1 data).
Short-Term Momentum Signal: 20-Period EMA (based on M15 data).
Risk
Metric: 14-period ATR for dynamic Stop Loss calculation.
✅ Trading Rules🟢
Long (Buy) Entry Conditions
Session: Must be within the London (0800-1700 GMT) or New York (1300-2200 GMT) sessions.
HTF Trend: Current price must be above the 1-Hour EMA 50.
Momentum Signal: Price crosses above the 15-Minute EMA 20.
Confirmation: The bar immediately following the crossover must close above the 15-Minute EMA 20.
Ent
ry: A market order is executed on the close of the confirmation candle.
🔴 Short (Sell) Entry Conditions
Session: Must be within the London (0800-1700 GMT) or New York (1300-2200 GMT) sessions.
HTF Trend: Current price must be below the 1-Hour EMA 50.
Momentum Signal: Price crosses below the 15-Minute EMA 20.
Confirmation: The bar immediately following the crossover must close below the 15-Minute EMA 20.
Entry: A market order is executed on the close of the confirmation candle.
🛑 Trade Management & Exits
Stop Loss (SL): Placed dynamically at 2.0 times the 14-period ATR distance from the entry candle's low (for Buys) or high (for Sells).
Take Profit (TP): Placed dynamically to achieve a 1.5 Risk-Reward Ratio (RR) (TP distance = 1.5 x SL d
istance).
📊 On-Chart Visuals
Detailed Labels: A box appears on the entry bar showing the action, SL/TP prices, Risk/Reward in Pips, and the exact R:R ratio.
Horizontal Lines: Dashed lines display the calculated SL (Red) and TP (Green) levels while the trade is active.
Background: The chart background is shaded to highlight the active London and New York tradi
ng sessions.

Dammu AI ADVANCED PRO1. Indicator Overview
Name: Dammu
Type: Overlay indicator (draws on price chart)
Purpose: Combines SuperTrend, SMA/EMA trends, Swing/Structure analysis, Order Blocks, Fair Value Gaps, High/Low levels, TP/SL labels, and alerts.
Pine Script Version: v5
2. SuperTrend Module
Computes SuperTrend line using ATR and sensitivity.
Signals:
Bullish: Price crosses above SuperTrend.
Bearish: Price crosses below SuperTrend.
Plots buy/sell labels 🚀🐻 based on SMA comparison and SuperTrend cross.
3. SMA/EMA Trend Components
SMA8 & SMA9: Used for additional trend confirmation.
EMA lines: Multiple EMAs with different multipliers for trend detection.
Trend Cloud: Uses Hull MA for trend smoothing.
4. Risk Management
TP/SL Levels: Automatic calculation of stop-loss and take-profit (TP1, TP2, TP3).
Configurable ATR-based risk percentage.
Lines and labels drawn for visual TP/SL.
5. Chart Features
Smooth Range Filter: Filters noise for trend detection.
Colored Trend Cloud: Upward trend = cyan, downward = red.
Sideways Market: ADX filter to color bars purple if trend is weak/sideways.
Bar Colors: Green/red based on SuperTrend signals.
6. Swing & Structure Analysis
Detects Swing Highs/Lows, labels as HH, LH, LL, HL.
Detects CHoCH (Change of Character) or BOS (Break of Structure).
Can show internal or swing structures with configurable label size and color.
7. Order Blocks (Smart Money Concepts)
Detects Internal Order Blocks (iOB) and Swing Order Blocks (OB).
Stores top/bottom/left/time/type in arrays.
Colors and shows boxes based on bullish/bearish type.
Automatically deletes OB if price breaks the block.
8. Fair Value Gaps (FVG)
Identifies gaps between candles as potential trading zones.
Configurable bullish/bearish colors and extension bars.
9. EQH/EQL (Equal Highs/Lows)
Detects equal highs/lows using a threshold.
Plots dotted lines and labels EQH/EQL.
10. High/Low Levels MTF
Optional plotting of previous daily, weekly, monthly highs/lows.
11. Premium/Discount Zones
Plots Premium, Discount, and Equilibrium Zones.
Colors: Premium = red, Discount = green, Equilibrium = gray.
12. Alerts
Buy/Sell alerts for:
SuperTrend crossover
BOS/CHoCH (swing/internal)
EQH/EQL triggers
13. Miscellaneous
Configurable visuals: line style, label size, transparency.
Adjustable volatility filters, ATR lengths, smoothing constants.
Integrated risk & reward visualization.
✅ In short:
This is an all-in-one Smart Money + Trend indicator with SuperTrend signals, swing/structure detection, order blocks, FVGs, EQH/EQL, TP/SL visualization, and optional alerts. It’s designed for both trend-following and order-block-based trading.
If you want, I can make a super-short 1-paragraph version that summarizes it even faster for quick reference.

ATR Adaptive (auto timeframe)This indicator automatically adjusts the Average True Range (ATR) period based on the current chart timeframe, helping traders define dynamic Stop Loss (SL) and Take Profit (TP) levels that adapt to market volatility.
The ATR measures the average range of price movement over a defined number of bars. By using adaptive periods, the indicator ensures that volatility is interpreted consistently across different timeframes — from 1-minute charts to daily or weekly charts.
It plots two main levels on the chart:
🔴 Low – ATR × Multiplier → Suggested Stop Loss (below the candle’s low)
🟢 High + ATR × Multiplier → Suggested Take Profit or trailing level (above the candle’s high)
Optional additional lines show ATR-based TP levels calculated from the current close.
💡 How to use
Select your desired ATR multiplier (e.g., 1.3× for SL, 1.0× for TP).
The script automatically detects the chart timeframe and uses an appropriate ATR length (e.g., ATR(30) on M5, ATR(21) on H1, ATR(14) on Daily).
Use the plotted levels to:
Set Stop Loss just below the red ATR band (for long trades).
Set Take Profit near or slightly below the green ATR band (for short trades, reverse logic).
⚙️ Why it helps
Maintains consistent volatility-based risk across multiple timeframes.
Avoids arbitrary fixed SL/TP values.
Makes the trading strategy more responsive in high-volatility markets and more conservative when volatility contracts.
Particularly useful for intraday and swing trading, where volatility varies significantly between sessions.

Magracia Entry-Exit 5 Min Time frame//------------------------------------------------------------------------------------------------------
// 🧭 Indicator Description
//------------------------------------------------------------------------------------------------------
// 📘 Overview:
// This indicator is a modified version of the LuxAlgo pattern logic designed to detect
// high-probability **RBD (Rally–Base–Drop)** and **DBR (Drop–Base–Rally)** reversal structures
// directly on the current candle. It automatically identifies potential BUY and SELL zones,
// plots corresponding trade signals, and dynamically calculates **Take Profit (TP)** and **Stop Loss (SL)** levels.
//
// The goal of this tool is to give clear, visually guided trade entries and exits that
// follow price structure and momentum changes without repainting historical data.
//
//------------------------------------------------------------------------------------------------------
// 🧩 How It Works:
// • **RBD (Rally–Base–Drop)** → Indicates a bearish reversal (SELL signal)
// • **DBR (Drop–Base–Rally)** → Indicates a bullish reversal (BUY signal)
// • Optional **RBR / DBD** continuation patterns can be toggled on for trend continuation setups.
// • When a signal is detected, the script automatically places:
// ▫ A BUY or SELL marker at the candle
// ▫ Dynamic TP (green dotted line) and SL (red dotted line) levels
// ▫ An EXIT marker when either TP or SL is reached
//
//------------------------------------------------------------------------------------------------------
// ⚙️ Inputs:
// • Enable or disable individual pattern types (RBD, RBR, DBD, DBR)
// • Toggle continuation patterns (RBR/DBD)
// • Customize Take Profit and Stop Loss percentages
// • Adjust rally/drop bar colors for easier pattern visualization
//
//------------------------------------------------------------------------------------------------------
// 🧠 Usage Tips:
// • Works best on volatile pairs and short–term timeframes (1m to 15m)
// • Can be combined with volume or trend filters for stronger confirmation
// • When used on higher timeframes (e.g., 4H+), increase TP/SL percentage range
//
//------------------------------------------------------------------------------------------------------
// ⚠️ Notes:
// • Signals are plotted **in real-time on the current candle** (not delayed).
// • This indicator is for visual and educational use only and does not guarantee profitability.
// • For optimal results, combine it with proper risk management and confirmation indicators.
//
//------------------------------------------------------------------------------------------------------
// © Gideon (CC BY-NC-SA 4.0 Licensed)
//------------------------------------------------------------------------------------------------------

Iani SMC Sniper XAU v2.2 (Long+Short + News Countdown, v6)Iani SMC Sniper v2.6 — Anytime • Auto Pip • FVG 50% • OB • News Panel
Smart-Money Concepts made simple for intraday XAU/USD (works on any symbol).
Finds BOS, 50% FVG “sniper” entries, optional Order Blocks, London H/L, news countdown, and a mini info panel.
What it does
BOS (Break of Structure): detects bullish/bearish BOS after London sweep logic.
FVG 50% entries: plots precise long/short entry dots at the midpoint of the gap.
Auto TP/SL: TP = RR × risk, SL below/above recent swing with a small buffer.
Order Blocks (optional): marks the last opposite candle after BOS and alerts on OB revisit.
London High/Low: tracks session range; session filter is optional.
News countdown: shows next event time and minutes left (user-selectable timezone).
Mini Panel: top-left table with Trend (last BOS), Next news, R:R, Pip size.
Inputs (key)
Auto pip size: uses syminfo.mintick. Manual override available.
Risk:Reward (RR): default 2.0.
Pivot length: swing sensitivity.
Sessions: enable if you want signals only 12:00–20:00 (symbol timezone). Off = anytime.
News timezone: pick your own (e.g., Europe/Brussels, America/New_York).
Absolute & daily times: add your events (strings like 2025-09-17 20:00 or 14:30,16:00…).
Show labels/levels/OBs: toggle on/off.
Alerts included
BOS Bullish / BOS Bearish
BUY Entry / SELL Entry (return to 50% FVG)
Bullish OB revisit / Bearish OB revisit
TP Long/Short reached, SL Long/Short hit
NEWS WARNING (warning window only; does not block signals)
To use: Add Alert → Condition: this indicator → choose any of the alertconditions.
Best use
Bias: H1 for structure.
Execution: M15 (standard) or M5 (aggressive).
Works great on XAUUSD, but is symbol-agnostic (auto pip adapts).
Notes
News times display in the timezone you pick in settings.
OBs are a simple implementation meant for quick visual guidance.
Labels: BUY/SELL near entries, TP/SL on set and when hit, BOS up/down.
Risk disclaimer
This tool is for education only. Not financial advice. Backtest and manage risk.

Index Position Size Calculator for [US30 / US100 / SP500]What it does
This tool helps you size positions consistently for index trades on US30 (Dow Jones), NAS100 (Nasdaq-100), and SP500 (S&P 500). Enter your account balance, risk %, and your planned Entry / Stop-Loss / Target and the script calculates:
• Position Size (rounded to your lot/contract step)
• Risk-to-Reward (R/R)
• Potential P/L in USD based on your inputs
• Visual Entry / SL / TP lines with green/red zones and concise labels
Supported contract styles
Choose a preset for common products (e.g., CFD $1/pt, YM/NQ/ES futures, MYM/MNQ/MES micros) or override the economics yourself. You remain in control of the two key levers:
• $/point — how many dollars you gain/lose per 1 index point per contract/lot
• Point size — how many price units equal 1 index point on your chart (often 1.0, but some brokers use 0.1 or 0.5)
Inputs
• Account Balance ($) and Risk % per trade
• Index: US30 / NAS100 / SP500
• Contract: CFD / Futures (YM, NQ, ES) / Micros (MYM, MNQ, MES)
• $/point: auto from Contract or manual override
• Point size: auto from Index or manual override
• Position size step: rounding (e.g., 1 for futures, 0.01 for CFDs)
• Entry / SL / TP: typed values (snapped to tick), with on-chart zones and labels
• Display toggles for lines and labels
How the math works
• StopPoints = |Entry − SL| ÷ PointSize
• ProfitPoints = |TP − Entry| ÷ PointSize
• Position Size = (AccountBalance × Risk%) ÷ (StopPoints × $/point)
• R/R = ProfitPoints ÷ StopPoints
• Potential P/L = PositionSize × Points × $/point
How to use (quick start)
1. Select Index and Contract.
2. Confirm $/point and Point size match your broker’s specs.
3. Enter Entry / SL / TP for the trade idea.
4. Read the Position Size, R/R, and Potential P/L in the info box.
5. Adjust for fees, spreads, and slippage as needed.
Notes & limitations
• Broker symbols can vary. Always verify $/point and Point size for your instrument before risking capital.
• The script does not place orders and does not generate trade signals; it’s a sizing/visualization tool.
• Results can differ across brokers due to pricing, spreads, minimum lot sizes, and execution rules.
• Use on the intended indices; you’ll see a reminder if you load it elsewhere.
Changelog highlights
• Pine v6, constant-safe inputs, tick-snapping, global fills (no local-scope errors).
• Robust label handling and optional minimal chart markers.
Disclaimer
This script is provided for educational purposes only and does not constitute financial advice or a recommendation to buy or sell any security or derivative. Trading involves risk, including the possible loss of principal. Always do your own research, verify contract specifications with your broker, and consider testing in a demo environment before trading live.

Liquidity Sweep Breakout - LSBLiquidity Sweep Breakout - LSB
A professional session-based breakout system designed for OANDA:USDJPY and other JPY pairs.
Not guesswork, but precision - built on detailed observation of institutional moves to capture clear trade direction daily.
Master the Market’s Daily Bank Flow.
---
Strategy Detail:
I discovered this strategy after carefully studying how Japanese banks influence the forex market during their daily settlement period. Banks are some of the biggest players in the financial world, and when they adjust or settle their accounts in the morning, it often creates a push in the market. From years of observation, I noticed a consistent pattern, once banks finish their settlements, the market usually continues moving in the same direction that was formed right after those actions. This daily banking flow often sets the tone for the entire trading session, especially for JPY pairs like USDJPY.
To capture this move, I built the indicator so that it follows the bank-driven trend with clear rules for entries, stop-loss (SL), and take-profit (TP). The system is designed with professional risk management in mind. By default, it assumes a $10,000 account size, risks only 1% of that balance per trade, and targets a 1:1.5 reward-to-risk ratio. This means for every $100 risked, the potential profit is $150. Such controlled risk makes the system safer and more sustainable for long-term traders. At the same time, users are not limited to this setup, they can adjust the account balance in the settings, and the indicator will automatically recalculate the lot size and risk levels based on their own capital. This ensures the strategy works for small accounts and larger accounts alike.
🌍 Why It Works
Fundamentally driven: Based on **daily Japanese banking settlement flows**.
Session-specific precision: Targets the exact window when USDJPY liquidity reshapes.
Risk-managed: Always calculates lot size based on account and risk preferences.
Automatable: With webhook + MT5 EA, it can be fully hands-free.
---
✅ Recommended
Pair: USDJPY (best observed behavior).
Timeframe: 3-Minute chart.
Platform: TradingView Premium (for webhooks).
Execution: MT5 via EA.
---
🔎 Strategy Concept
The Tokyo Magic Breakout (TMB) is built on years of session observation and the unique daily rhythm of the Japanese banking system.
Every morning between 5:50 AM – 6:10 AM PKT (09:50 – 10:10 JST), Japanese banks perform daily reconciliation and settlement. This often sets the tone for the USDJPY direction of the day.
This strategy isolates that critical moment of liquidity adjustment and waits for a clean breakout confirmation. Instead of chasing noise, it executes only when price action is aligned with the Tokyo market’s hidden flows.
---
🕒 Timing Logic
Session Start: 5:00 AM PKT (Tokyo market open range).
Magic Candle: The 5:54 AM PKT candle is marked as the reference “breakout selector.”
Checkpoints: First confirmation at 6:30 AM PKT, then every 15 minutes until 8:30 AM PKT.
* If price stays inside the magic range → wait.
* If a breakout happens but the candle wick touches the range → wait for the next checkpoint.
* If by 8:30 AM PKT no clean breakout occurs → the day is marked as No Trade Day (NTD).
👉 Recommended timeframe: 3-Minute chart (3M) for precise signals.
---
📈 Trade Execution
Entry: Clean break above/below the magic candle’s range.
Stop-Loss: Opposite side of the Tokyo session high/low.
Take-Profit: Calculated by Reward\:Risk ratio (default 1.5:1).
Lot Size: Auto-calculated based on your risk model:
* Fixed Dollar
* % of Equity
* Conservative (minimum of both).
Visuals include:
✅ Entry/SL/TP lines
✅ Shaded risk (red) and reward (green) zones
✅ Trade labels (Buy/Sell with lot size & levels)
✅ TP/SL hit markers
---
🔔 Alerts & Automation (AutoTMB)
This strategy is fully automation-ready with EA + MT5:
1. Enable alerts in TMB settings.
2. Insert your PineConnector License Key.
3. Configure your risk management preferences.
4. Create a TradingView alert → in the message box simply type:
Pine Script®
{{alert_message}}
and set the EA webhook.
Now, every breakout trade (with exact entry, SL, TP, and lot size) is sent instantly.
👉 On your MT5:
* Install the EA.
* Use the same license key.
* Run it on a VPS or local MT5 terminal.
You now have a hands-free trading system: AutoTMB.

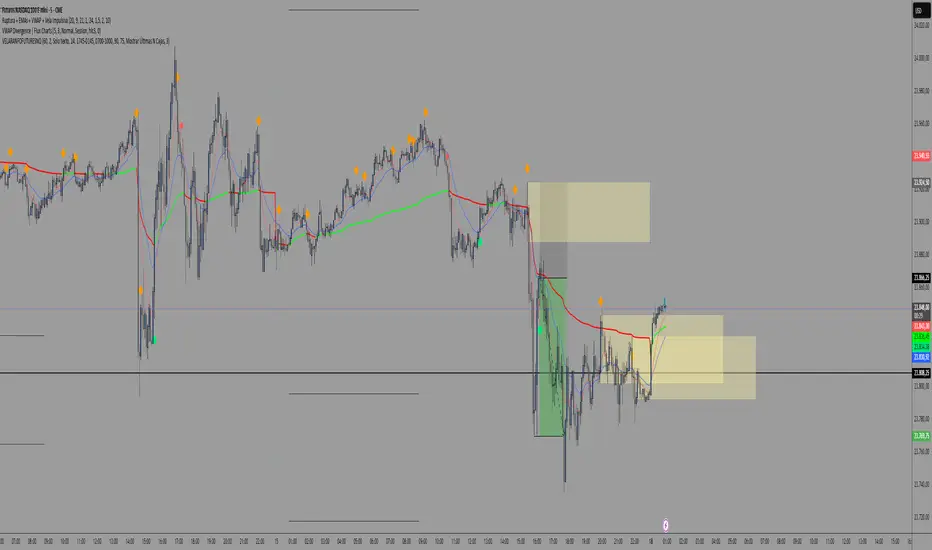
Ruptura + EMAs + VWAP + Vela Impulsiva Indicator: Breakout + EMAs + VWAP + Impulsive Candle + TP/SL
This indicator is designed to identify breakout trading opportunities by combining price action, moving averages, volume-weighted price, and impulsive candles, with clearly defined Take Profit (TP) and Stop Loss (SL) levels.
⏱️ Timeframe Logic:
The 15-minute chart is used to define the price range.
Entries are made on the 2-minute chart when breakout conditions align with momentum confirmation.
📌 Key Components:
Range Definition:
Calculates a price range based on a customizable number of candles (rangeBars), typically from the 15-minute timeframe.
Displays a shaded box highlighting this range.
Trend Filters:
Uses a fast EMA (9) and a slow EMA (21) to determine short-term and medium-term trends.
Includes VWAP as a dynamic support/resistance and directional filter.
Only allows trades when both EMAs and price confirm alignment above (for long) or below (for short) the VWAP.
Impulsive Candle Detection:
Confirms breakouts using large-bodied candles that engulf the previous candle's range.
The candle must exceed a certain multiple of the average range (minRangeMult) to qualify.
Breakout Entry Conditions:
Long Setup: Price breaks above the range high, with EMAs and VWAP confirming bullish alignment, and confirmed by an impulsive candle.
Short Setup: Price breaks below the range low, with EMAs and VWAP aligned bearishly, confirmed by an impulsive candle.
Trade Management:
Automatically plots Take Profit and Stop Loss levels based on the size of the entry candle and a customizable TP multiplier.
Visual dashed lines indicate TP (green) and SL (red) zones.
Session Filter:
Entry signals are limited to a specific time window (e.g., 9:00 to 10:00 AM New York time), typically during the NY session open.
Visual Aids:
Background color highlights potential entry zones (green for long, red for short).
Icons mark confirmed impulsive candles and entry signals.
Range box is updated periodically to reflect the active breakout zone.
Script de código abierto
Siguiendo fielmente el espíritu de TradingView, el creador de este script lo ha publicado en código abierto, permitiendo que otros traders puedan revisar y verificar su funcionalidad. ¡Enhorabuena al autor! Puede utilizarlo de forma gratuita, pero tenga en cuenta que la publicación de este código está sujeta a nuestras Normas internas.
LANZ Strategy 6.0🔷 LANZ Strategy 6.0 — NY Session Entry Tool & Multi-Account Risk Manager
LANZ Strategy 6.0 - Is a trading tool designed to help traders plan, execute, and manage operations with a focus on risk management, multi-account handling, and visual clarity.
It works exclusively on the 1-hour timeframe ⏳ and is optimized for the New York market opening dynamics.
🧠 Core Concept
The strategy identifies bullish trading opportunities based on the 09:00 NY candle. Once detected, it automatically calculates and draws:
EP (Entry Price) — The exact level where the trade setup triggers.
SL (Stop Loss) — Based on a customizable percentage of the candle's high–low range or wick extremes.
TP (Take Profit) — Calculated using your chosen Risk–Reward Ratio (e.g., 1:5, 1:3, etc.).
⚙️ Main Features
⏳ Time-Specific Execution
Operates only when the 09:00 NY candle closes bullish.
Ideal for traders who align with the New York Session market structure.
💰 Multi-Account Lot Size Management
Up to 5 independent accounts can be configured with their own capital and risk %, showing the exact lot size to use for each.
📏 Adaptive Risk Control
Supports both Forex and non-Forex assets (indices, gold, oil).
For non-Forex, you can manually define the pip value according to your broker’s specs.
🎨 Visual Trade Map
Automatically plots clean and easy-to-read EP, SL, and TP lines with customizable colors, styles, and thickness.
A floating information panel displays levels, pip distances, and lot sizes.
🔔 Real-Time Alerts
Alerts for:
Entry signal detection.
Stop Loss hit.
Take Profit hit.
Manual close at the defined session end.
📊 Example
If you trade GBPUSD with Account #1 set to $10,000 and 2% risk,
and the 09:00 NY candle closes bullish with SL = 30 pips and RR = 5:1:
EP, SL, and TP levels are drawn instantly.
Risk = $200 (2% of $10,000).
Lot size is calculated automatically.
All details are shown in the on-chart panel.
🛠️ How to Use
Load the indicator on a 1-hour chart.
Configure risk settings and account data.
Wait for the 09:00 NY candle to close bullish.
Use the displayed lot size and levels to execute your trade.
Let the tool alert you for SL, TP, or manual close.
⚠️ Disclaimer:
This script is for educational purposes only. It does not guarantee profits and past performance does not represent future results. Always manage your risk responsibly.
👨💻 Credits:
💡 Developed by: LANZ
🧠 Execution Model & Logic Design: LANZ
📅 Designed for: 1H timeframe and NY-based entries

EMA 6/21/50 PROIndicator Description: EMAs 6/21/50 + MACD + AO + Panel + Alerts
This technical indicator combines several analysis tools to help identify opportunities to enter consolidated trends. It integrates Exponential Moving Averages (EMAs), the MACD, the Amazing Oscillator (AO), and an interactive information panel that allows you to visualize entry signals, trend direction, and potential exit levels (Take Profit and Stop Loss). It is designed for day or swing traders who want a quick and structured reading of the market.
What does the script do? The indicator does the following: It draws 6, 21, and 50-period EMAs on the chart to detect the direction of the trend. It generates LONG/SHORT entry signals based on EMA crossover, alignment with the overall trend (EMA50), and confirmation by indicators: MACD:
Momentum filter. AO: Impulse depletion filter. It visually displays the TP (Take Profit) and SL (Stop Loss) levels when there is a signal. It includes an informative graphical panel with icons and text summarizing the market status and entry conditions.
It issues customizable alerts for entry signals, allowing it to be used in automated strategies or as a manual guide. Allows you to enable/disable visual elements with buttons to customize the experience.
How does it do it?
EMAs and crossover signals: It uses three EMAs: 6 (fast), 21 (medium), and 50 (slow).
A LONG signal occurs when the 6-EMA crosses above the 21-EMA, the price is above the 50-EMA, the MACD confirms bullish momentum, and the AO shows no exhaustion.
A SHORT signal is given in reverse conditions, with the option to limit the system to long signals only (Long signals only).
Additional filters:
MACD: Entry is avoided if there is no favorable crossover between the MACD line and its signal.
AO: Entry is avoided if the OA shows signs of weakness or exhaustion. TP/SL Visual:
TP and SL levels are calculated based on user-defined pips, and are automatically drawn on the chart when there is a valid signal.
Information panel: Each bar is automatically updated. Samples: general trend, EMA crossover, MACD/AO filters, and presence of LONG/SHORT signal. It is possible to hide it with a button from the settings panel.
Alerts: Alerts are generated when the full LONG or SHORT entry conditions are met. They are useful for receiving automatic notifications or integrating them into automated systems.
How to use it?
Add to chart and configure options: Year of start of the analysis.
Activate only long signals if you wish.
Show/hide panel, EMAs, or TP/SL levels. Interpreting signals:
Green triangle under a candle = Possible LONG entry.
Red triangle above a candle = Possible SHORT entry.
Green Line = Suggested Take Profit. Red Line = Suggested Stop Loss. Trigger alerts from TradingView's alert settings to be notified in real-time.
Important Note
This script does not execute orders or represent an automated trading strategy.
It is a visual analysis tool that can support decision-making, but it is recommended to use it in conjunction with other elements of analysis and proper risk management.

Ayman Entry Signal – Ultimate PRO (Scalping Gold Settings)1. Overview
This indicator is a professional gold scalping tool built for TradingView using Pine Script v6.
It combines multiple price action and technical filters to generate high-probability Buy/Sell signals with built-in trade management features (TP1, TP2, SL, Break Even, Partial Close, Stats tracking).
It is optimized for XAUUSD but can be applied to other assets with proper setting adjustments.
2. Key Features
Multi-Condition Trade Signals – EMA trend, Break of Structure, Order Blocks, FVG, Liquidity Sweeps, Pin Bars, Higher Timeframe confirmation, Trend Cloud, SMA Cross, and ADX.
Full Trade Management – Auto-calculates lot size, SL, TP1, TP2, Break Even, Partial Close.
Dynamic Chart Drawing – Entry lines, SL/TP lines, trade boxes, and real-time PnL.
Statistics Panel – Tracks wins, losses, breakeven trades, and total PnL over selected dates.
Customizable Filters – All filters can be turned ON/OFF to match your strategy.
3. Main Inputs & Settings
Account Settings
Capital ($) – Total trading capital.
Risk Percentage (%) – Risk per trade.
TP to SL Ratio – Risk-to-reward ratio.
Value Per Point ($) – Value per pip/point for lot size calculation.
SL Buffer – Extra points added to SL to avoid stop hunts.
Take Profit Settings
TP1 % of Full Target – Fraction of TP1 compared to TP2.
Move SL to Entry after TP1? – Activates Break Even after TP1.
Break Even Buffer – Extra points when moving SL to BE.
Take Partial Close at TP1 – Option to close half at TP1.
Signal Filters
ATR Period – For SL/TP calculation buffer.
EMA Trend – Uses EMA 9/21 crossover for trend.
Break of Structure (BoS) – Requires structure break confirmation.
Order Block (OB) – Validates trades within OB zones.
Fair Value Gap (FVG) – Confirms trades inside FVGs.
Liquidity Sweep – Checks if liquidity zones are swept.
Pin Bar Confirmation – Uses candlestick patterns for extra confirmation.
Pin Bar Body Ratio – Controls strictness of Pin Bar filter.
Higher Timeframe Filters (HTF)
HTF EMA Confirmation – Confirms lower timeframe trades with higher timeframe trend.
HTF BoS – Confirms with higher timeframe structure break.
HTF Timeframe – Selects higher timeframe.
Advanced Filters
SuperTrend Filter – Confirms trades based on SuperTrend.
ADX Filter – Filters out low volatility periods.
SMA Cross Filter – Uses SMA 8/9 cross as filter.
Trend Cloud Filter – Uses EMA 50/200 as a cloud trend filter.
4. How It Works
Buy Signal Conditions
EMA 9 > EMA 21 (trend bullish)
Optional filters (BoS, OB, FVG, Liquidity Sweep, Pin Bar, HTF confirmations, ADX, SMA Cross, Trend Cloud) must pass if enabled.
When all active filters pass → Buy signal triggers.
Sell Signal Conditions
EMA 9 < EMA 21 (trend bearish)
Same filtering process but for bearish conditions.
When all active filters pass → Sell signal triggers.
5. Trade Execution & Management
When a signal triggers:
Lot size is auto-calculated based on risk % and SL distance.
SL is placed beyond recent swing high/low + ATR buffer.
TP1 and TP2 are calculated from the SL using the reward-to-risk ratio.
Break Even: If enabled, SL moves to entry price after TP1 is hit.
Partial Close: If enabled, half of the position closes at TP1.
Trade Exit: Full exit at TP2, SL hit, or partial close at TP1.
6. Chart Display
Entry Line – Shows entry price.
SL Line – Red dashed line at stop loss level.
TP1 Line – Lime dashed line for TP1.
TP2 Line – Green dashed line for TP2.
PnL Labels – Displays real-time profit/loss in $.
Trade Box – Visual area showing trade range.
Pin Bar Shapes – Optional, marks Pin Bars.
7. Statistics Panel
Stats Header – Shows “Stats”.
Total Trades
Wins
Losses
Breakeven Trades
Total PnL
Can be reset or filtered by date.
8. How to Use
Load the Indicator in TradingView.
Select Gold (XAUUSD) on your preferred scalping timeframe (1m, 5m, 15m).
Adjust settings:
Use default gold scalping settings for quick start.
Enable/disable filters according to your style.
Wait for a Buy/Sell alert.
Confirm visually that all desired conditions align.
Place trade with calculated lot size, SL, and TP levels shown on chart.
Let trade run – the indicator manages Break Even & Partial Close if enabled.
9. Recommended Timeframes
Scalping: 1m, 5m, 15m
Day Trading: 15m, 30m, 1H
Swing: 4H, Daily (adjust settings accordingly)
