EMA100 Breakout by shubhThis indicator is a clean, price-action-based breakout system designed for disciplined trend trading on any timeframe — especially for Nifty and Bank Nifty spot, futures, and options charts.
It uses a single 100-period EMA to define trend direction and waits for decisive candle closes across the EMA to trigger potential entries.
The logic ensures only one active trade at a time, enforcing patience and clarity in decision-making.
⚙️ Core Logic
Buy Setup
A bullish candle closes above the 100 EMA while its open was below the EMA.
Entry occurs at candle close.
Stop-Loss (SL): Low of the signal candle.
Target (TP): 4 × the SL distance (Risk : Reward = 1 : 4).
Sell Setup
A bearish candle closes below the 100 EMA while its open was above the EMA.
Entry occurs at candle close.
Stop-Loss (SL): High of the signal candle.
Target (TP): 4 × the SL distance.
Trade Management
Only one trade may run at a time (either long or short).
New signals are ignored until the current position hits SL or TP.
Transparent labels show Entry, SL, and TP levels on chart.
Dotted lines visualize active Stop-Loss (red) and Target (green).
Exit markers:
✅ Target Hit
❌ Stop Loss Hit
🧠 Key Advantages
Simple and transparent trend-following logic.
Enforces disciplined “one-trade-at-a-time” behavior.
High risk-to-reward (1 : 4).
Works across timeframes — 5 min to Daily.
Ideal for intraday and positional setups.
📊 Suggested Use
Apply on Nifty / Bank Nifty spot or futures charts.
Works on any instrument with clear momentum swings.
Best confirmation when EMA 100 acts as dynamic support/resistance.
⚠️ Disclaimer
This script is for educational and research purposes only.
It is not financial advice or an invitation to trade.
Always backtest thoroughly and manage risk responsibly before applying in live markets.
Cerca negli script per "tp"

London Breakout Structure by Ale 2This indicator identifies market structure breakouts (CHOCH/BOS) within a specific London session window, highlighting potential breakout trades with automatic entry, stop loss (SL), and take profit (TP) levels.
It helps traders focus on high-probability breakouts when volatility increases after the Asian session, using price structure, ATR-based volatility filters, and a custom risk/reward setup.
🔹 Example of Strategy Application
Define your session (e.g. 04:00 to 05:00).
Wait for a CHOCH (Change of Character) inside this session.
If a bullish CHOCH occurs → go LONG at candle close.
If a bearish CHOCH occurs → go SHORT at candle close.
SL is set below/above the previous swing using ATR × multiplier.
TP is calculated automatically based on your R:R ratio.
📊 Example:
When price breaks above the last swing high within the session, a “BUY” label appears and the indicator draws Entry, SL, and TP levels automatically.
If the breakout fails and price closes below the opposite structure, a “SELL” signal will replace the bullish setup.
🔹 Details
The logic is based on structural shifts (CHOCH/BOS):
A CHOCH occurs when price breaks and closes beyond the most recent high/low.
The indicator dynamically detects these shifts in structure, validating them only inside your chosen time window (e.g. the London Open).
The ATR filter ensures setups are valid only when the range has enough volatility, avoiding false signals in low-volume hours.
You can also visualize:
The session area (purple background)
Entry, Stop Loss, and Take Profit levels
Direction labels (BUY/SELL)
ATR line for volatility context
🔹 Configuration
Start / End Hour: define your preferred trading window.
ATR Length & Multiplier: adjust for volatility.
Risk/Reward Ratio: set your desired R:R (default 1:2).
Minimum Range Filter: avoids signals with tight SLs.
Alerts: receive notifications when breakout conditions occur.
🔹 Recommendations
Works best on 15m or 5m charts during London session.
Designed for breakout and structure-based traders.
Works on Forex, Crypto, and Indices.
Ideal as a visual and educational tool for understanding BOS/CHOCH behavior.

[LTS] Marubozu Candle StrategyOVERVIEW
The Marubozu Candle Strategy identifies and trades wickless candles (Marubozu patterns) with dynamic take-profit and stop-loss levels based on market volatility. This indicator combines traditional Japanese candlestick pattern recognition with modern volatility-adjusted risk management and includes a comprehensive performance tracking dashboard.
A Marubozu candle is a powerful continuation pattern characterized by the complete absence of wicks on one side, indicating strong directional momentum. This strategy specifically detects:
- Bullish Marubozu: Close > Open AND Low = Open (no lower wick)
- Bearish Marubozu: Close < Open AND High = Open (no upper wick)
When price returns to test these levels, the indicator generates trading signals with predefined risk-reward parameters.
CORE METHODOLOGY
Detection Logic:
The script scans each bar for Marubozu formations using precise price comparisons. When a wickless candle appears, a horizontal line extends from the opening price, marking it as a potential support (bullish) or resistance (bearish) level. These levels remain active until price touches them or until the maximum line limit is reached.
EMA Filter (Optional):
An exponential moving average filter enhances signal quality by requiring proper trend alignment. For bullish signals, price must be above the EMA when touching the level. For bearish signals, price must be below the EMA. This filter reduces counter-trend trades and improves win rates in trending markets. Users can disable this filter for range-bound conditions.
Dynamic Risk Management:
The strategy employs ATR-based (Average True Range) position sizing rather than fixed point values. This approach adapts to market volatility automatically:
- In low volatility: Tighter stops and targets
- In high volatility: Wider stops and targets proportional to market movement
Default settings use a 2:1 reward-to-risk ratio (1x ATR for take-profit, 0.5x ATR for stop-loss), but users can adjust these multipliers to match their trading style.
HOW IT WORKS
Step 1 - Pattern Detection:
On each bar, the indicator evaluates whether the candle qualifies as a Marubozu by comparing the high, low, open, and close prices. When detected, the opening price becomes the key level.
Step 2 - Level Management:
Horizontal lines extend from each Marubozu's opening price. The indicator maintains two separate arrays: one for unbroken levels (actively extending) and one for broken levels (historical reference). Users can configure how many of each type to display, preventing chart clutter while maintaining relevant context.
Step 3 - Signal Generation:
When price returns to touch a Marubozu level, the indicator evaluates the EMA filter condition. If the filter passes (or is disabled), the script draws TP/SL boxes showing the expected profit and loss zones based on current ATR values.
Step 4 - Trade Tracking:
Each valid signal enters the tracking system, which monitors subsequent price action to determine outcomes. The script identifies whether the take-profit or stop-loss was hit first (discarding trades where both trigger on the same candle to avoid ambiguous results).
PERFORMANCE DASHBOARD
The integrated dashboard provides real-time strategy analytics to automatically convert results to dollar values for any instrument:
Tracked Metrics:
- Total Trades: Complete count of closed positions
- Wins/Losses: Individual counts with color coding
- Win Rate: Success percentage with dynamic color (green >= 50%, red < 50%)
- Total P&L: Cumulative profit/loss in dollars
- Avg Win: Mean dollar amount per winning trade
- Avg Loss: Mean dollar amount per losing trade
NOTE: The dollar values shown in the dashboard are for trading only a single share/contract/etc. You will need to manually multiply those numbers by the amount of shares/contracts you are trading to get a true value.
The dollar conversion works automatically across all markets:
- Futures contracts (ES, NQ, CL, etc.) use their contract specifications
- Forex pairs use standard lot calculations
- Stocks and crypto use their respective point values
This eliminates manual calculation and provides immediate performance feedback in meaningful currency terms.
CUSTOMIZATION OPTIONS
ATR Settings:
- ATR Period: Lookback length for volatility calculation (default: 14)
- TP Multiplier: Take-profit distance as multiple of ATR (default: 3.0)
- SL Multiplier: Stop-loss distance as multiple of ATR (default: 1.5)
EMA Settings:
- EMA Length: Period for trend filter calculation (default: 9)
- Use EMA Filter: Toggle trend confirmation requirement (default: enabled)
Visual Settings:
- Bullish Color: Color for long signals and wins (default: green)
- Bearish Color: Color for short signals and losses (default: red)
- EMA Color: Color for trend filter line (default: orange)
- Line Width: Thickness of Marubozu level lines (1-5, default: 2)
- EMA Width: Thickness of EMA line (1-5, default: 2)
Line Management:
- Max Unbroken Lines: Limit for active extending lines (default: 10)
- Max Broken Lines: Limit for historical touched lines (default: 5)
Dashboard Settings:
- Show Dashboard: Toggle performance display on/off
- Dashboard Position: Corner placement (4 options)
- Dashboard Size: Text size selection (Tiny/Small/Normal/Large)
HOW TO USE
1. Add the indicator to your chart
2. Adjust ATR multipliers based on your risk tolerance (higher values = more conservative)
3. Configure the EMA filter based on market conditions (enable for trending, disable for ranging)
4. Set line limits to match your visual preference and chart timeframe
5. Monitor the dashboard to track strategy performance in real-time
6. Use the TP/SL boxes as reference levels for manual trades or automation
Best Practices:
- Enable EMA filter in strongly trending markets
- Disable EMA filter if you want more trade signals but at lower quality
- Increase ATR multipliers in highly volatile markets
- Decrease ATR multipliers for tighter, more frequent trades
- Review avg win/loss ratio to ensure positive expectancy
UNIQUE FEATURES
Unlike basic Marubozu detectors, this strategy provides:
1. Automatic level tracking with memory management
2. Volatility-adjusted risk parameters instead of fixed values
3. Optional trend confirmation via EMA filter
4. Real-time performance analytics with automatic dollar conversion
5. Separate tracking of wins/losses with individual averages
6. Configurable visual display to prevent chart clutter
7. Complete transparency with all logic visible in open-source code

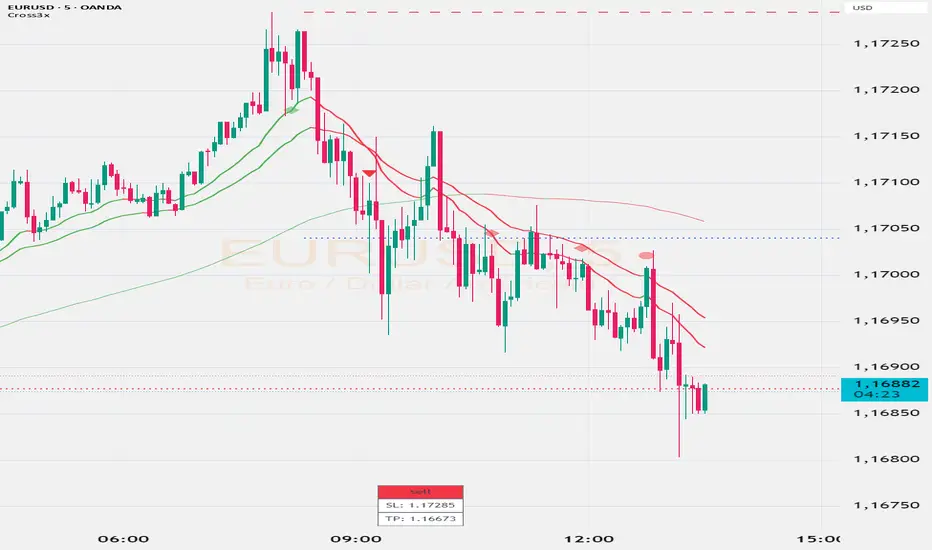
Cross3x v2Cross3x – Smart Trend & Rejection Detection System
Cross3x is a precision trading indicator designed for traders who combine trend-following with early reversal detection. Built on a triple moving average core, it delivers high-quality signals with minimal noise and maximum clarity.
Core Features:
Trend Filtered Crossover: Uses a fast EMA (18), slow EMA (33), and long-term SMA (99) to generate reliable entry signals only in the direction of the dominant trend.
Dynamic SL/TP/BE Management:
Stop Loss placed at the lowest/highest extreme over a user-defined lookback.
Take Profit calculated using a customizable Risk/Reward ratio.
Break-Even level set as a percentage between entry and TP (e.g., 10% = BE just above entry).
Early Rejection Signals: Flags potential reversals when price tests a moving average with a long wick during a countertrend candle — ideal for spotting pullbacks before the next leg.
Green flag: "Potential Long Setup" after a bullish rejection.
Red flag: "Potential Short Setup" after a bearish rejection.
Confirmation Points: Circles appear when price retraces cleanly after a crossover, signaling optimal entry zones.
Interactive Dashboard: Real-time table showing current signal, SL, and TP levels.
Customizable Alerts: Fully configurable alerts for entries, confirmation points, and rejection setups.
Why Use Cross3x?
It doesn’t just follow trends — it anticipates them. By combining classical crossovers with smart rejection logic and structured risk management, Cross3x helps you enter earlier, manage risk better, and stay aligned with market momentum.
Perfect for swing traders, intraday scalpers, and algorithmic strategies seeking a clean, robust foundation.
Usage Tips:
Combine "Potential" flags with order blocks or key levels for higher accuracy.
Use confirmation circles as entry triggers after early setups.
Adjust RR and BE% based on volatility and trading style.
Deploy Cross3x to turn simple crossovers into a complete trading methodology.
AlgoWay GRSIM🧭 What this strategy tries to do
This strategy detects when a market move is losing strength and prepares for a potential reversal, but it waits for fresh momentum confirmation before acting.
It combines:
• RSI-based divergence (to spot exhaustion and potential turning points),
• Impulse MACD (to verify that the new direction actually has force behind it).
________________________________________
⚙️ When it takes trades
Long (Buy):
• A bullish RSI divergence appears (a clue that selling pressure is fading);
• Within a short time window, the Impulse MACD turns strongly positive;
• Optionally, the impulse line itself must be rising (if the Impulse Direction Filter is
enabled).
Short (Sell):
• A bearish RSI divergence appears (buying pressure fading);
• Within a short time window, the Impulse MACD turns strongly negative;
• Optionally, the impulse line must be falling (if the Impulse Direction Filter is enabled).
If momentum confirmation happens too late, the divergence “expires” and the signal is ignored.
________________________________________
🧩 How entries work
1. Reversal clue:
The strategy detects disagreement between price and RSI (price makes a new high/low, RSI doesn’t).
That suggests a shift in underlying strength.
2. Momentum confirmation:
Before entering, the Impulse MACD must agree — showing real push in the same direction.
3. Impulse direction filter (optional):
When enabled, the impulse itself must accelerate (rise for longs, fall for shorts), avoiding fake signals where price diverges but momentum is still fading.
4. No stacking:
It opens only one position at a time.
________________________________________
🚪 How exits work
Two main exit styles:
Conservative (default):
Longs close when impulse crosses below its signal line.
Shorts close when impulse crosses above its signal line.
✅ Keeps trades as long as momentum agrees.
Color-change (fast):
Longs close immediately when impulse flips bearish.
Shorts close immediately when impulse flips bullish.
⚡ Faster and more defensive.
Plus:
Stop Loss (%) and Take Profit (%) act as fixed-distance protective exits (set to 0 to disable either one).
________________________________________
📊 What you’ll see on the chart
A thick Impulse MACD line and thin signal line (oscillator view).
Diamonds — detected bullish/bearish divergence points.
Circles — where impulse crosses its signal (momentum change).
A performance panel (top-right) showing Net Profit, Trades, Win Rate, Profit Factor, Pessimistic PF, and Max Drawdown.
________________________________________
🔧 What you can tune
Signal Lifetime (bars): how long a divergence remains valid.
Impulse Direction Filter: ensure the impulse itself is moving in the trade’s direction.
Stop Loss / Take Profit (%): risk and target in percent.
Exit Style: conservative cross or faster color-change.
RSI / MA / Signal Lengths: adjust responsiveness (defaults are balanced).
________________________________________
💪 Strengths
Confirms reversals using momentum direction, not just divergence.
Avoids “early” signals where momentum is still fading.
Works symmetrically for longs and shorts.
Built-in stop/target protection.
Clear, visual confirmation of all logic components.
________________________________________
⚠️ Things to keep in mind
In sideways markets, the impulse can flip often — prefer conservative exits.
Too small SL/TP → constant stop-outs.
Too wide SL/TP → deep drawdowns.
Always test with different timeframes and markets.
________________________________________
💡 Practical tips
Start with default settings.
Enable “Use Impulse Direction Filter” in trending markets, disable it in very choppy ones.
Focus on Profit Factor, Win Rate, and Max Drawdown after several dozen trades.
Keep SL/TP roughly aligned with typical swing size.
“AlgoWay GRSIM” is a reversal-with-confirmation strategy: it spots likely turns, demands real momentum alignment (optionally verified by impulse direction), and manages exits with clear momentum cues plus built-in protective limits.

First-Move-Wrong Toolkit [CHE] First-Move-Wrong Toolkit — Session-bound sweep rejection with structure confirmation
Summary
This indicator marks potential “first move wrong” reversals during a defined trading session. It looks for a quick sweep beyond the prior day high or low, or the opening range high or low, followed by rejection and a basic structure confirmation. Optional rules require a retest and a VWAP reclaim in the direction of the trade idea. The script renders session levels as right-extended lines, signals as labels, optional SL/TP guide lines for visualization, and background tints during sweep events. Pivots are confirmed using swing width, which reduces repaint risk compared to live swings.
Motivation: Why this design?
Intraday reversals often start with a liquidity sweep around obvious highs or lows. Acting on the sweep alone can be noisy, while waiting for structure break and a retest can be slow. This tool balances both by checking a sweep and rejection at session-relevant levels, then requiring a simple structure cue and, optionally, a retest and a VWAP filter. The goal is a clear, rule-based signal layer that is easy to audit on chart without hidden state.
What’s different vs. standard approaches?
Baseline reference: Simple sweep detectors or basic CHOCH markers that ignore session context and liquidity anchors.
Architecture differences:
Session-aware opening range tracking that finalizes after the chosen minutes from session start.
Daily previous high and low pulled without lookahead, then extended forward as visual anchors.
Confirmed pivot highs and lows to avoid repaint from live, unconfirmed swings.
Optional retest rule using crossover or crossunder at the trigger level.
Optional VWAP filter to demand reclaim in the intended direction.
Global label cooldown to prevent clusters of signals.
Practical effect: Fewer one-off flips around noisy levels, clearer alignment with session structure, and compact visual feedback through lines, labels, and tints.
How it works (technical)
Levels: During the defined session, the script builds an opening range high and low until the configured minute mark after session start, then freezes those levels for the day. It also fetches the previous day high and low from the daily timeframe without lookahead and extends them forward.
Sweep and rejection: A sweep is defined as price moving beyond a target level and then rejecting back inside on the same bar. The script checks this condition separately for highs and lows against opening range and previous-day levels.
Structure validation: Confirmed pivot highs and lows are computed using a symmetric swing width. A bearish idea requires a prior sweep of a high plus a break through the last confirmed swing low. A bullish idea requires a prior sweep of a low plus a break through the last confirmed swing high.
Optional retest: If enabled, a bearish signal needs a cross under the bearish trigger level; a bullish signal needs a cross over the bullish trigger level.
VWAP filter (optional): The script requires a reclaim of VWAP in the intended direction when enabled.
State handling: Opening range values, previous-day lines, and the label cooldown timestamp are stored in persistent variables. Lines are created once and updated each bar to extend forward.
Repaint considerations: Pivots confirm only after the specified swing width, reducing repaint. The daily level request is performed without lookahead. Signals use closed-bar checks implied by crossover and crossunder logic.
Parameter Guide
Session (local) — Defines the active trading window. Default nine to seventeen. Narrower windows focus on the main session drive.
Opening Range (min) — Minutes from session start to finalize OR levels. Default fifteen. Shorter values react faster; longer values stabilize levels.
Use PrevDay H/L levels — Toggle previous-day anchors. On by default.
Use OR H/L levels — Toggle opening range anchors. On by default.
Equal H/L tolerance (ticks) — Intended tolerance for equal highs or lows. Default one. (Unknown/Optional) in current signals.
Swing width — Bars on both sides for confirmed pivots. Default two. Larger values reduce noise but confirm later.
Require CHOCH after sweep — Enforces structure break after a sweep. On by default.
Prefer retest entries — Requires crossover or crossunder of the trigger level. On by default.
VWAP filter — Demands a reclaim of VWAP in signal direction. Off by default.
TP in R (guide) — Multiplier for visual TP guides. Default one. Visualization only.
Show levels / Show signals / Show R-guides — Rendering toggles. R-guides are visual aids, not orders.
Label cooldown (bars) — Minimum bars between labels. Default five. Higher values reduce clusters.
Palette inputs — Colors and transparencies for levels, labels, VWAP, and tints.
Reading & Interpretation
Lines: Dotted lines represent opening range high and low after the OR window completes. Dashed lines represent previous-day high and low.
Signals: “Long” labels appear after a low-side sweep with rejection and structure confirmation, subject to optional retest and VWAP rules. “Short” labels mirror this on the high side.
Background tints: Red-tinted bars indicate a high-side sweep and rejection. Green-tinted bars indicate a low-side sweep and rejection.
R-guides: Circles display a visual stop level at the bar extreme and a target guide based on the selected multiple. They are informational only.
Practical Workflows & Combinations
Session reversal scans: During the first hour, watch for sweeps around previous-day or opening range levels, then wait for structure confirmation and optional retest.
Trend following with filters: Combine signals with higher-timeframe structure or a moving average regime check. Ignore signals against the dominant regime.
Exits and stops: Use the visual stop as a reference near the sweep extreme; adapt the target guide to volatility and market conditions.
Multi-asset / Multi-TF: Works on intraday timeframes for liquid futures, indices, forex, and large-cap equities. Start with default settings and adjust swing width and OR minutes to instrument volatility.
Behavior, Constraints & Performance
Repaint/confirmation: Pivots confirm after the swing window completes. Signals occur only when conditions are met on closed bars.
security()/HTF: Daily previous-day levels are requested without lookahead to reduce repaint.
Resources: Uses persistent variables and line updates per bar; no heavy loops or arrays.
Known limits: Signals can arrive later when swing width is large. Gaps around session boundaries may distort OR levels. VWAP behavior may vary with partial sessions or illiquid assets.
Sensible Defaults & Quick Tuning
Starting point: Session nine to seventeen, opening range fifteen minutes, swing width two, CHOCH required, retest on, VWAP off, cooldown five bars.
Too many flips: Increase swing width, enable VWAP filter, or raise label cooldown.
Too sluggish: Reduce swing width or shorten the opening range window.
Too many session-level hits: Disable either previous-day levels or opening range levels to simplify context.
What this indicator is—and isn’t
This is a session-aware visualization and signal layer focused on sweep-plus-structure behavior. It is not a complete trading system and does not manage orders, risk, or portfolio exposure. Use it with market structure, risk limits, and execution rules that fit your process.
Disclaimer
The content provided, including all code and materials, is strictly for educational and informational purposes only. It is not intended as, and should not be interpreted as, financial advice, a recommendation to buy or sell any financial instrument, or an offer of any financial product or service. All strategies, tools, and examples discussed are provided for illustrative purposes to demonstrate coding techniques and the functionality of Pine Script within a trading context.
Any results from strategies or tools provided are hypothetical, and past performance is not indicative of future results. Trading and investing involve high risk, including the potential loss of principal, and may not be suitable for all individuals. Before making any trading decisions, please consult with a qualified financial professional to understand the risks involved.
By using this script, you acknowledge and agree that any trading decisions are made solely at your discretion and risk.
Do not use this indicator on Heikin-Ashi, Renko, Kagi, Point-and-Figure, or Range charts, as these chart types can produce unrealistic results for signal markers and alerts.
Best regards and happy trading
Chervolino

Adaptive Trend Breaks Adaptive Trend Breaks
## WHAT IT DOES
This script is a modified and enhanced version of "Trendline Breakouts With Targets" concept by ChartPrime.
Adaptive Trend Breaks (ATB) is a trendline breakout system optimized for scalping liquid futures contracts. The indicator automatically draws dynamic support and resistance trendlines based on pivot points, then generates trade signals when price breaks through these levels with confirmation filters. It includes automated target and stop-loss placement with real-time P&L tracking in dollars.
## HOW IT WORKS
**Trendline Detection Method:**
The indicator uses pivot high/low detection to identify significant price turning points. When a new pivot forms, it calculates the slope between consecutive pivots to draw dynamic trendlines. These lines extend forward based on the established trend angle, creating actionable support and resistance zones.
**Band System:**
Around each trendline, the script creates a "band" using a volatility-adjusted calculation: `ATR(14) * 0.2 * bandwidth multiplier / 2`. This adaptive band accounts for current market conditions - wider during volatile periods, tighter during quiet markets.
**Breakout Logic:**
A breakout signal triggers when:
1. Price closes beyond the trendline + band zone
2. Volume exceeds the 20-period moving average by your set multiplier (default 1.2x)
3. Price is within Regular Trading Hours (9:30-16:00 EST) if session filter enabled
4. Current ATR meets minimum volatility threshold (prevents trading dead markets)
**Target & Stop Calculation:**
Upon breakout confirmation:
- **Entry**: Trendline breach point
- **Target**: Entry ± (bandwidth × target multiplier) - default 8x for quick scalps
- **Stop**: Entry ± (bandwidth × stop multiplier) - default 8x for 1:1 risk/reward
- Multipliers adjust automatically to market volatility through the ATR-based band
**P&L Conversion:**
The script converts point movements to dollars using:
```
Dollar P&L = (Price Points × Contract Point Value × Quantity)
```
For example, a 10-point NQ move with 2 contracts = 10 × $20 × 2 = $400
## HOW TO USE IT
**Setup:**
1. Select your instrument (NQ/ES/YM/RTY) - point values auto-configure
2. Set contract quantity for accurate dollar P&L
3. Choose pivot period (lower = more signals but more noise, default 5 for scalping)
4. Adjust bandwidth multiplier if trendlines are too tight/loose (1-5 range)
**Filters Configuration:**
- **Volume Filter**: Requires breakout volume > moving average × multiplier. Increase multiplier (1.5-2.0) for higher conviction trades
- **Session Filter**: Enable to trade only RTH. Disable for 24-hour trading
- **ATR Filter**: Prevents signals during low volatility. Increase minimum % for more active markets only
**Risk Management:**
- Set target/stop multipliers based on your risk tolerance
- 8x bandwidth = approximately 1:1 risk/reward for most liquid futures
- Enable trailing stops for trend-following approach (moves stop to protect profits)
- Adjust line length to see targets further into the future
**Statistics Table:**
- Choose timeframe to analyze: all-time, today, this week, custom days
- Monitor win rate, profit factor, and net P&L in dollars
- Track long vs short performance separately
- See real-time unrealized P&L on active trades
**Reading Signals:**
- **Green triangle below bar** = Long breakout (resistance broken)
- **Red triangle above bar** = Short breakout (support broken)
- **White dashed line** = Entry price
- **Orange line** = Take profit target with dollar value
- **Red line** = Stop loss with dollar value
- **Green checkmark (✓)** = Target hit, winning trade
- **Red X (✗)** = Stop hit, losing trade
## WHAT IT DOES NOT DO
**Limitations to Understand:**
- Does not predict future trendline formations - it reacts to breakouts after they occur
- Historical trendlines disappear after breakout (not kept on chart for clarity)
- Requires sufficient volatility - may not signal in extremely quiet markets
- Volume filter requires exchange volume data (not available on all symbols)
- Statistics are indicator-based simulations, not actual trading results
- Does not account for slippage, commissions, or order fills
## BEST PRACTICES
**Recommended Settings by Market:**
- **NQ (Nasdaq)**: Default settings work well, consider volume multiplier 1.3-1.5
- **ES (S&P 500)**: Slightly slower, try period 7-8, volume 1.2
- **YM (Dow)**: Lower volatility, reduce bandwidth to 1.5-2
- **RTY (Russell)**: Higher volatility, increase bandwidth to 3-4
**Risk Management:**
- Never risk more than 2-3% of account per trade
- Use contract quantity calculator: Max Risk $ ÷ (Stop Distance × Point Value)
- Start with 1 contract while learning the system
- Backtest your specific timeframe and instrument before live trading
**Optimization Tips:**
- Increase pivot period (7-10) for fewer but higher-quality signals
- Raise volume multiplier (1.5-2.0) in choppy markets
- Lower target/stop multipliers (5-6x) for tighter profit taking
- Use trailing stops in strong trending conditions
- Disable session filter for overnight gaps and Asia session moves
## TECHNICAL DETAILS
**Key Calculations:**
- Pivot Detection: `ta.pivothigh(high, period, period/2)` and `ta.pivotlow(low, period, period/2)`
- Slope Calculation: `(newPivot - oldPivot) / (newTime - oldTime)`
- Adaptive Band: `min(ATR(14) * 0.2, close * 0.002) * multiplier / 2`
- Breakout Confirmation: Price crosses trendline + 10% of band threshold
**Data Requirements:**
- Minimum bars in view: 500 for proper pivot calculation
- Volume data required for volume filter accuracy
- Intraday timeframes recommended (1min - 15min) for scalping
- Works on any timeframe but optimized for fast execution
**Performance Metrics:**
All statistics calculate based on indicator signals:
- Tracks every signal as a trade from entry to TP/SL
- P&L in actual contract dollar values
- Win rate = (Winning trades / Total trades) × 100
- Profit factor = Gross profit / Gross loss
- Separates long/short performance for bias analysis
## IDEAL FOR
- Futures scalpers and day traders
- Traders who prefer visual trendline breakouts
- Those wanting automated TP/SL placement
- Traders tracking performance in dollar terms
- Multiple timeframe analysis (compare 1min vs 5min signals)
## NOT SUITABLE FOR
- Swing trading (targets too close)
- Stocks/forex without modifying point values
- Extremely low timeframes (<30 seconds) - too much noise
- Markets without volume data if using volume filter
- Illiquid contracts (signals may not execute at shown prices)
---
**Settings Summary:**
- Core: Period, bandwidth, extension, trendline style
- Filters: Volume, RTH session, ATR volatility
- Risk: R:R ratio, target/stop multipliers, trailing stop
- Display: Stats table position, size, colors
- Stats: Timeframe selection (all-time to custom days)
**License:** This indicator is published open-source under Mozilla Public License 2.0. You may use and modify the code with proper attribution.
**Disclaimer:** This indicator is for educational purposes. Past performance does not guarantee future results. Always practice proper risk management and test thoroughly before live trading.
---
## CREDITS & ATTRIBUTION
This script builds upon the "Trendline Breakouts With Targets" concept by ChartPrime with significant enhancements:
**Major Improvements Added:**
- **Futures-Specific Calculations**: Automated dollar P&L conversion using actual contract point values (NQ=$20, ES=$50, YM=$5, RTY=$50)
- **Advanced Statistics Engine**: Comprehensive performance tracking with customizable timeframe analysis (today, week, month, custom ranges)
- **Multi-Layer Filtering System**: Volume confirmation, RTH session filter, and ATR volatility filter to reduce false signals
- **Professional Trade Management**: Enhanced visual trade tracking with separate TP/SL lines, dollar value labels, and optional trailing stops
- **Optimized for Scalping**: Faster pivot periods (5 vs 10), tighter bands, and reduced extension bars for quick entries
Original trendline detection methodology by ChartPrime - used with modification under Mozilla Public License 2.0.

Strategy with Reference Lines📊 Strategy with Reference Lines
Description:
This strategy uses a contrarian approach based on the analysis of the previous candle to identify entry and exit points. The strategy draws horizontal reference lines at important levels of the previous candle and generates buy/sell signals based on the candle's direction.
Key Features:
🔹 Multi-Timeframe Analysis: Configurable for 1H, 2H, 3H, 4H, 6H, 12H, and 1D
🔹 Reference Lines: High, low, close, and midpoint (50%) of the previous candle
🔹 Visual Signals: Labels with prices and actions (BUY/SELL/TP)
🔹 Optional Trading: Enable/disable automatic order execution
🔹 Complete System: Automatic entry, Take Profit, and Stop Loss
🔹 Alerts: Notifications when a new candle is detected
Strategy Logic:
When the previous candle is POSITIVE:
Signal: 🔴 SELL at the previous candle's close
Take Profit: 🎯 Midpoint (50%) of the previous candle
Stop Loss: 🔴 High of the previous candle
When the previous candle is NEGATIVE:
Signal: 🟢 BUY at the previous candle's close
Take Profit: 🎯 Midpoint (50%) of the previous candle
Stop Loss: 🟢 Low of the previous candle
Visual Elements:
Green Line: High of the previous candle (when positive)
Red Line: Low of the previous candle (when negative)
Yellow Line: Close of the previous candle (always present)
Blue Line: Midpoint (50%) of the previous candle (always present)
Labels: Prices and actions with emojis for easy identification
Settings:
Timeframe: Default 4H (configurable)
Auto Trading: Disabled by default (safety)
Alerts: Include entry prices, TP, and SL
Recommended Usage:
✅ Visual Analysis: Use with trading disabled for analysis
✅ Backtesting: Enable trading to test historically
✅ Swing Trading: Ideal for 4H or higher timeframes
✅ Risk Management: Automatic SL and TP for protection
Risk Disclaimer:
This strategy is for educational and analysis purposes only. Always test in a simulation environment before using with real capital. Trading involves significant risks and may result in losses.

Macro Momentum – 4-Theme, Vol Target, RebalanceMacro Momentum — 4-Theme, Vol Target, Rebalance
Purpose. A macro-aware strategy that blends four economic “themes”—Business Cycle, Trade/USD, Monetary Policy, and Risk Sentiment—into a single, smoothed Composite signal. It then:
gates entries/exits with hysteresis bands,
enforces optional regime filters (200-day bias), and
sizes the position via volatility targeting with caps for long/short exposure.
It’s designed to run on any chart (index, ETF, futures, single stocks) while reading external macro proxies on a chosen Signal Timeframe.
How it works (high level)
Build four theme signals from robust macro proxies:
Business Cycle: XLI/XLU and Copper/Gold momentum, confirmed by the chart’s price vs a long SMA (default 200D).
Trade / USD: DXY momentum (sign-flipped so a rising USD is bearish for risk assets).
Monetary Policy: 10Y–2Y curve slope momentum and 10Y yield trend (steepening & falling 10Y = risk-on; rising 10Y = risk-off).
Risk Sentiment: VIX momentum (bearish if higher) and HYG/IEF momentum (bullish if credit outperforms duration).
Normalize & de-noise.
Optional Winsorization (MAD or stdev) clamps outliers over a lookback window.
Optional Z-score → tanh mapping compresses to ~ for stable weighting.
Theme lines are SMA-smoothed; the final Composite is LSMA-smoothed (linreg).
Decide direction with hysteresis.
Enter/hold long when Composite ≥ Entry Band; enter/hold short when Composite ≤ −Entry Band.
Exit bands are tighter than entry bands to avoid whipsaws.
Apply regime & direction constraints.
Optional Long-only above 200MA (chart symbol) and/or Short-only below 200MA.
Global Direction control (Long / Short / Both) and Invert switch.
Size via volatility targeting.
Realized close-to-close vol is annualized (choose 9-5 or 24/7 market profile).
Target exposure = TargetVol / RealizedVol, capped by Max Long/Max Short multipliers.
Quantity is computed from equity; futures are rounded to whole contracts.
Rebalance cadence & execution.
Trades are placed on Weekly / Monthly / Quarterly rebalance bars or when the sign of exposure flips.
Optional ATR stop/TP for single-stock style risk management.
Inputs you’ll actually tweak
General
Signal Timeframe: Where macro is sampled (e.g., D/W).
Rebalance Frequency: Weekly / Monthly / Quarterly.
ROC & SMA lengths: Defaults for theme momentum and the 200D regime filter.
Normalization: Z-score (tanh) on/off.
Winsorization
Toggle, lookback, multiplier, MAD vs Stdev.
Risk / Sizing
Target Annualized Vol & Realized Vol Lookback.
Direction (Long/Short/Both) and Invert.
Max long/short exposure caps.
Advanced Thresholds
Theme/Composite smoothing lengths.
Entry/Exit bands (hysteresis).
Regime / Execution
Long-only above 200MA, Short-only below 200MA.
Stops/TP (optional)
ATR length and SL/TP multiples.
Theme Weights
Per-theme scalars so you can push/pull emphasis (e.g., overweight Policy during rate cycles).
Macro Proxies
Symbols for each theme (XLI, XLU, HG1!, GC1!, DXY, US10Y, US02Y, VIX, HYG, IEF). Swap to alternatives as needed (e.g., UUP for DXY).
Signals & logic (under the hood)
Business Cycle = ½ ROC(XLI/XLU) + ½ ROC(Copper/Gold), then confirmed by (price > 200SMA ? +1 : −1).
Trade / USD = −ROC(DXY).
Monetary Policy = 0.6·ROC(10Y–2Y) − 0.4·ROC(10Y).
Risk Sentiment = −0.6·ROC(VIX) + 0.4·ROC(HYG/IEF).
Each theme → (optional Winsor) → (robust z or scaled ROC) → tanh → SMA smoothing.
Composite = weighted average → LSMA smoothing → compare to bands → dir ∈ {−1,0,+1}.
Rebalance & flips. Orders fire on your chosen cadence or when the sign of exposure changes.
Position size. exposure = clamp(TargetVol / realizedVol, maxLong/Short) × dir.
Note: The script also exposes Gross Exposure (% equity) and Signed Exposure (× equity) as diagnostics. These can help you audit how vol-targeting and caps translate into sizing over time.
Visuals & alerts
Composite line + columns (color/intensity reflect direction & strength).
Entry/Exit bands with green/red fills for quick polarity reads.
Hidden plots for each Theme if you want to show them.
Optional rebalance labels (direction, gross & signed exposure, σ).
Background heatmap keyed to Composite.
Alerts
Enter/Inc LONG when Composite crosses up (and on rebalance bars).
Enter/Inc SHORT when Composite crosses down (and on rebalance bars).
Exit to FLAT when Composite returns toward neutral (and on rebalance bars).
Practical tips
Start higher timeframes. Daily signals with Monthly rebalance are a good baseline; weekly signals with quarterly rebalances are even cleaner.
Tune Entry/Exit bands before anything else. Wider bands = fewer trades and less noise.
Weights reflect regime. If policy dominates markets, raise Monetary Policy weight; if credit stress drives moves, raise Risk Sentiment.
Proxies are swappable. Use UUP for USD, or futures-continuous symbols that match your data plan.
Futures vs ETFs. Quantity auto-rounds for futures; ETFs accept fractional shares. Check contract multipliers when interpreting exposure.
Caveats
Macro proxies can repaint at the selected signal timeframe as higher-TF bars form; that’s intentional for macro sampling, but test live.
Vol targeting assumes reasonably stationary realized vol over the lookback; if markets regime-shift, revisit volLook and targetVol.
If you disable normalization/winsorization, themes can become spikier; expect more hysteresis band crossings.
What to change first (quick start)
Set Signal Timeframe = D, Rebalance = Monthly, Z-score on, Winsor on (MAD).
Entry/Exit bands: 0.25 / 0.12 (defaults), then nudge until trade count and turnover feel right.
TargetVol: try 10% for diversified indices; lower for single stocks, higher for vol-sell strategies.
Leave weights = 1.0 until you’ve inspected the four theme lines; then tilt deliberately.

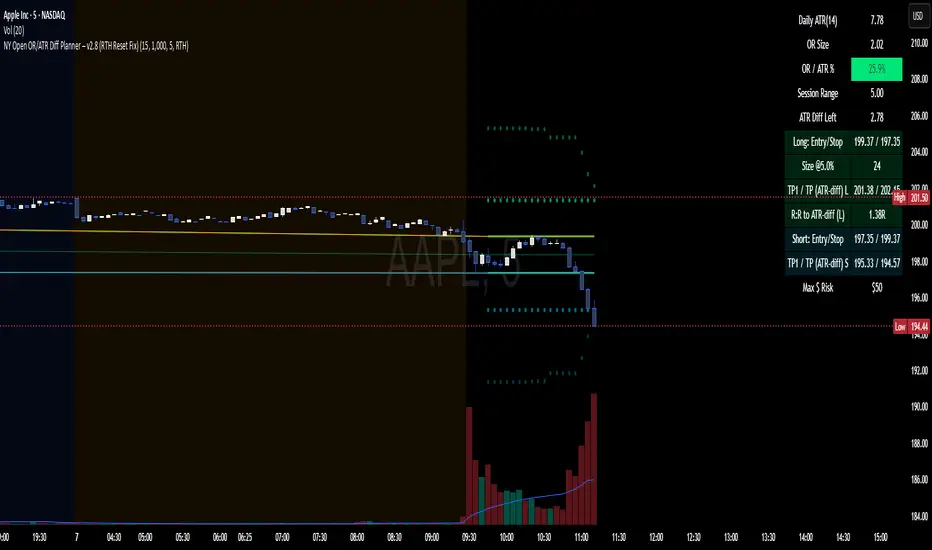
NY Open OR/ATR Diff Planner – v2.8 NY Open OR/ATR Diff Planner – v2.8 (Hi-Contrast)
Trade the Opening Range Breakout with a plan, not vibes.
This tool builds the NY Opening Range (OR) from the cash open and overlays a complete, risk-based execution plan: precise entry, structural stop, position size, targets, and R:R — all tied to the Daily ATR(14) and the remaining ATR “fuel” left in the day.
What it does
Opening Range: First N minutes after 09:30 ET (choose 5/15/30/60).
Today-only lines: Automatically resets at 09:30; no carry-over from prior days.
Session aware: Works on RTH or ETH charts. OR always anchors at 09:30 ET.
Fuel model: Computes Session Range (since 09:30) and ATR Diff Left = Daily ATR − Session Range.
Entries & Stops:
Long plan: Entry = ORH, Stop = ORL
Short plan: Entry = ORL, Stop = ORH
Targets:
TP1 = 1R (distance of entry→stop)
TP (ATR-diff cap): Entry ± ATR Diff Left (caps greed when the day’s ATR is nearly spent)
Sizing & R:R: Position size = Account × Risk% / Risk per share, with live R:R to ATR-diff target.
Hi-contrast table: Clear readout of Daily ATR, OR size, OR/ATR%, Session Range, ATR left, entries/stops/TPs, size, and max $ risk.
Inputs
Opening Range (minutes): 5 / 15 / 30 / 60
Account Size ($) and Risk % per trade
Session mode: RTH (09:30–16:00) or ETH (chart’s session; still anchored at 09:30)
Also show Short plan (toggle)
Show info table (toggle)
How to use
Add on a 1–5m chart.
Choose your OR window (e.g., 15m = 09:30–09:45).
Set Account Size and Risk % (e.g., 4–5% for small accounts; adjust to taste).
Wait for the OR to complete.
Trade the break/retest with the levels shown:
Long: Break of ORH, SL at ORL, TP1 = 1R, TP2 = ATR-diff cap.
Short: Mirror logic.
If OR/ATR% > ~50% (red), the “fuel” is thin — be selective.
Why it helps build an edge
Objective structure: Clear levels and sizing remove guesswork.
Context-aware targets: ATR-diff keeps targets realistic to the day’s potential.
Discipline by design: One framework that’s easy to review, journal, and iterate.
Notes
This is an indicator (visual planner), not an order-placing strategy.
If you want a back testable version (one trade/day, optional retest rule, TP/SL logic), say the word — I can publish a strategy variant.
Keywords: ORB, Opening Range, ATR, Risk Management, Position Sizing, Day Trading, NYSE Open, Mean Reversion Fuel, Execution Planner
Apex Edge – Wolfe Wave HunterApex Edge – Wolfe Wave Hunter
The modern Wolfe Wave, rebuilt for the algo era
This isn’t just another Wolfe Wave indicator. Classic Wolfe detection is rigid, outdated, and rarely tradable. Apex Edge – Wolfe Wave Hunter re-engineers the pattern into a modern, SMC-driven model that adapts to today’s liquidity-dominated markets. It’s not about drawing pretty shapes – it’s about extracting precision entries with asymmetric risk-to-reward potential.
🔎 What it does
Automatic Wolfe Wave Detection
Identifies bullish and bearish Wolfe Wave structures using pivot-based logic, symmetry filters, and slope tolerances.
Channel Glow Zones
Highlights the Wolfe channel and projects it forward into the future (bars are user-defined). This allows you to see the full potential of the trade before price even begins its move.
Stop Loss (SL) & Entry Arrow
At the completion of Wave 5, the algo prints a Stop Loss line and a tiny entry arrow (green for bullish, red for bearish). but the colours can be changed in user settings. This is the “execution point” — where the Wolfe setup becomes tradable.
Target Projection Lines
TP1 (EPA): Derived from the traditional 1–4 line projection.
TP2 (1.272 Fib): Optional secondary profit target.
TP3 (1.618 Fib): Optional extended target for large runners.
All TP lines extend into the future, so you can track them as price evolves.
Volume Confirmation (optional)
A relative volume filter ensures Wave 5 is formed with meaningful market participation before a setup is confirmed.
Alerts (ready out of the box)
Custom alerts can be fired whenever a bullish or bearish Wolfe Wave is confirmed. No need to babysit the charts — let the script notify you.
⚙️ Customisation & User Control
Every trader’s market and style is different. That’s why Wolfe Wave Hunter is fully customisable:
Arrow Colours & Size
Works on both light and dark charts. Choose your own bullish/bearish entry arrow colours for maximum visibility.
Tolerance Levels
Adjust symmetry and slope tolerance to refine how strict the channel rules are.
Tighter settings = fewer but cleaner zones.
Looser settings = more frequent setups, but with slightly lower structural quality.
Channel Glow Projection
Define how many bars forward the channel is drawn. This controls how far into the future your Wolfe zones are extended.
Stop Loss Line Length
Keep the SL visible without it extending infinitely across your chart.
Take Profit Line Colors
Each TP projection can be styled to your preference, allowing you to clearly separate TP1, TP2, and TP3.
This isn’t a one-size-fits-all tool. You can shape Wolfe detection logic to match the pairs, timeframes, and market conditions you trade most.
🚀 Why it’s different
Classic Wolfe waves are rare — this script adapts the model into something practical and tradeable in modern markets.
Liquidity-aligned — many setups align with structural sweeps of Wave 3 liquidity before driving into profit.
Entry built-in — most Wolfe scripts only draw the structure. Wolfe Wave Hunter gives you a precise entry point, SL, and projected TPs.
Backtest-friendly — you’ll quickly discover which assets respect Wolfe waves and which don’t, creating your own high-probability Wolfe watchlist.
⚠️ Limitations & Disclaimer
Not all markets respect Wolfe Waves. Some FX pairs, metals, and indices respect the structure beautifully; others do not. Backtest and create your own shortlist.
No guaranteed sweeps. Many entries occur after a liquidity sweep of Wave 3, but not all. The algo is designed to detect Wolfe completion, not enforce textbook liquidity rules.
Probabilistic, not predictive. Wolfe setups don’t win every time. Always use risk management.
High-RR focus. This is not a high-frequency tool. It’s designed for precision, asymmetric setups where risk is small and reward potential is large.
✅ The Bottom Line
Apex Edge – Wolfe Wave Hunter is a modern reimagination of the Wolfe Wave. It blends structural geometry, liquidity dynamics, and algo-driven execution into a single tool that:
Detects the pattern automatically
Provides SL, entry, and TP levels
Offers alerts for hands-off trading
Allows deep customisation for different markets
When it hits, it delivers outstanding risk-to-reward. Backtest, refine your tolerances, and build your watchlist of assets where Wolfe structures consistently pay.
This isn’t just Wolfe detection — it’s Wolfe trading, rebuilt for the modern trader.
Developer Notes - As always with the Apex Edge Brand, user feedback and recommendations will always be respected. Simply drop us a message with your comments and we will endeavour to address your needs in future version updates.

Iani SMC Sniper XAU v2.2 (Long+Short + News Countdown, v6)Iani SMC Sniper XAU (v2.2) — smart-money logic for XAUUSD.
This indicator hunts “sniper entries” using a simple SMC sequence:
Sweep → BOS → 50% FVG entry
• After London session builds its range, we wait for a liquidity sweep (price dips below London Low for longs / wicks above London High for shorts).
• A BOS confirms direction (close breaks the last swing).
• First FVG that prints after BOS gives the entry at 50% (mid-gap).
• SL anchored to the protective swing (with a small safety buffer). TP is plotted using your Risk:Reward.
News countdown (non-blocking):
The script does not auto-fetch news; you set daily times (e.g., 14:30, 16:00) and/or specific dates (“YYYY-MM-DD HH:MM”). A countdown label shows “NEWS in Xm”. Signals are not blocked—this is just a safety heads-up for prop-firm rules.
Inputs: pivot length, RR, pip size (XAU default 0.10), session filter (after London), news times (recurring & absolute), show/hide levels & labels.
Plots & labels: London High/Low (daily), Entry/SL/TP lines, BOS/Sweep/BUY/SELL markers, news badge.
Alerts: BOS Bull/Bear, BUY/SELL Entry touch, TP/SL hit, NEWS WARNING.
Notes:
• Designed for XAUUSD intraday; works on other symbols if you adjust pip size.
• Uses symbol timezone; adjust your news times for DST if needed.
• Indicator only—no orders, no backtest. Manage risk and execution in MT5/your platform.
Changelog (v2.2): Pine v6, robust time parsing, one-line logical expressions (fixed EOL errors), mirrored short logic, cleaner London H/L reset, countdown label.
Disclaimer: Educational tool, not financial advice. Past performance ≠ future results.
Tags: SMC, ICT, XAUUSD, Gold, Liquidity Sweep, BOS, FVG, London Session, News, Intraday, Scalping, DayTrading.

B@dshah Indicator🚀 Advanced Multi-Indicator Trading System
A comprehensive trading indicator that combines multiple technical analysis tools for high-probability signal generation:
📊 CORE FEATURES:
- EMA Trend Analysis (Fast/Slow crossovers)
- RSI Momentum Detection
- MACD Signal Confirmation
- Bollinger Bands (Squeeze & Mean Reversion)
- Fibonacci Retracement Levels
- Volume & ATR Filtering
- Multi-Confluence Scoring System (0-10 scale)
🎯 SIGNAL QUALITY:
- Non-repainting signals (confirmed at bar close)
- Minimum 60% strength threshold for trades
- Dynamic TP/SL based on market structure
- Real-time win rate tracking
- Signal strength percentage display
⚙️ UNIQUE FEATURES:
- BB Squeeze detection for volatility breakouts
- Fibonacci level confluence analysis
- Smart position sizing recommendations
- Visual TP/SL lines with outcome tracking
- Comprehensive statistics table
🔔 ALERTS INCLUDED:
- Buy/Sell signals with strength ratings
- TP/SL hit notifications
- BB squeeze/expansion alerts
- Fibonacci level touches
Best used on 1H+ timeframes for optimal results.
Perfect for swing trading and position entries.
PowerTrend Pro Strategy – Gold OptimizedTired of false signals on Gold?
PowerTrend Pro combines VWAP, Supertrend, RSI, and smart MA filters with trailing stops & break-even logic to deliver high-probability trades on XAUUSD.
PowerTrend Pro Strategy is a professional-grade trading system designed to capture high-probability swing and intraday opportunities on XAUUSD (Gold) and other volatile markets.
🔑 Core Features
VWAP Anchoring – institutional fair value reference to filter trades.
Supertrend (ATR-based) – adaptive trend filter tuned for Gold’s volatility.
Multi-Timeframe RSI – confirms momentum alignment across intraday and higher timeframe.
EMA + SMA Combo – ensures trades follow strong directional bias, reducing false signals.
Dynamic Risk Management
Adjustable Take Profit / Stop Loss (%)
Trailing Stop that locks in profits on extended moves
Break-Even Logic (stop loss moves to entry once price is in profit)
⚡ Gold-Tuned Presets
XAUUSD 1H → tighter TP/SL & faster entries for active intraday trading.
XAUUSD 4H → wider ATR filter & trailing stops to capture bigger swings.
Generic Mode → works on Forex, Indices, and Crypto (fully customizable).
🎯 Why It Works
Gold is notoriously volatile — quick spikes wipe out weak strategies. PowerTrend Pro solves this by combining:
✅ Institutional bias (VWAP)
✅ Adaptive trend filter (Supertrend)
✅ Momentum confirmation (RSI MTF)
✅ Robust trend structure (EMA + SMA)
✅ Smart exits (TP, SL, trailing & breakeven)
This multi-layer confirmation makes entries stronger and keeps risk under control.
🛠️ Usage
Add the strategy to your chart.
Choose a preset (XAUUSD 1H, 4H, or Generic).
Run Strategy Tester for performance metrics.
Optimize TP/SL and ATR values for your broker & market conditions.
🔥 Pro Tip: Combine this strategy with a session filter (London/NY overlap) or volume confirmation to boost accuracy in Gold.

Jimb0ws Strategy Trending Info PanelsJimb0ws Strategy — Golden Candles + Bubble Zones
A price-action/EMA strategy built for FX scalping and intraday swings. It colors Golden Candles when strong bodies touch/skim EMA20/50 in trend (“bubble”) and optionally highlights Robin Candles (break of the prior golden body). Signals are throttled per bubble and filtered by multiple higher-timeframe conditions.
How it trades
Trend bubbles: Uses EMA20/50/100/200 alignment on the chart timeframe; also reads 1H & 4H bubbles for context.
Entries: BUY/SELL labels appear only when a golden setup aligns with fractal/structure checks and all active filters pass.
Stops/Targets (strategy mode):
• Longs: SL = EMA100 if EMA200 > EMA100, else SL = EMA200.
• Shorts: SL = EMA100 if EMA200 < EMA100, else SL = EMA200.
• TP = RR × risk (default 2R).
An on-chart SL/TP info label prints the exact prices at each signal.
Risk filter options: disable beyond 1H EMA50, proximity band around 1H EMA50, wick overdrive veto, session filter (toggle on/off), max signals per bubble.
Visuals & tools
Colored EMAs (20/50/100/200), bubble zone background.
4H info panel (state, start time, duration); Prev-Day ATR panel sits above it.
Optional 1H info panel and consolidation warning.
Fractal markers (size selectable).
Alerts
1H bubble state change (Long/Short/Consolidation).
BUY/SELL signals.
Inputs worth checking
Session & timezone, min body size, pip tolerances, proximity/WOD filters, max signals per bubble, RR, SL/TP label offset.
Notes
Best on FX pairs; pip = mintick × 10. Backtest and adjust to your instrument and session. This is not financial advice.

Scalper SMA-RSI-MACD – Entry/Exit Signals v2Scalper SMA–RSI–MACD Strategy (Intraday) – Indicator Version
This is an intraday scalping and short-term trading tool designed for manual trading. It provides entry and exit signals based on a combination of trend, momentum, and volatility-based risk management.
Core Components
Trend Filter (Optional)
Uses an EMA (default 200) and an SMA ribbon (5/8/13) to identify the primary trend direction.
Only allows long trades in uptrend and short trades in downtrend (can be turned off for more signals).
Entry Conditions
RSI Pullback: Detects oversold (for long) or overbought (for short) conditions based on a short RSI (default length = 4).
MACD Momentum Turn: Detects bullish or bearish MACD crossovers or momentum shifts.
Both conditions must occur within a specified lookback period (default = last 3 bars).
Stop Loss (SL) Placement
SL is placed at a fixed multiple of the ATR (Average True Range) from the entry price (default = 1.5 × ATR).
Adjusting the multiplier changes how far the SL is placed.
Take Profit (TP) Levels
Two targets: TP1 and TP2, each based on R-multiples of the SL distance.
Default: TP1 = 1 × risk (1:1 R/R), TP2 = 2 × risk (1:2 R/R).
Exit Modes (Selectable)
TP1 or SL
TP2 or SL
Opposite signal (exit when the opposite entry condition appears)
Session Filter (Optional)
Can restrict trading signals to specific market hours (default off for more signals).
Signals and Alerts
Displays LONG and SHORT arrows for entries.
Plots SL and TP levels on the chart.
Marks exits as TP, SL, or opposite signal.
Built-in alertcondition() allows creating TradingView alerts for all entry and exit events.
Typical Usage
Works best on 1-minute to 5-minute charts for scalping; can be adapted to higher timeframes for swing trading.
Ideal for manual execution — the trader sees the signal, checks market conditions, and decides whether to enter.
Can be tuned for more or fewer signals by adjusting RSI thresholds, MACD lookback, and trend filter settings.

Painel Técnico (4H x 1D) — Clean UI + Alertas BrenoG📋 Main Functions
1️⃣ Analysis in two fixed timeframes
4 hours and 1 day analyzed in parallel.
Each column in the table displays the data for its respective timeframe.
2️⃣ Entry point based on oversold conditions
The “entry point” is not the current price, but rather the last candle that went into oversold territory (RSI ≤ configured threshold).
If there has been no recent oversold condition, the current price is used as a fallback.
All calculations (Buy Zone, Stops, TPs) are based on this point.
3️⃣ Buy Zone
Defined as:
java
Copiar
Editar
Low Zone = entry * (1 - width%)
High Zone = entry
Always visible in the table, but alerts can be set to trigger only if RSI is oversold at the moment of entry.
4️⃣ Automatic Stops
Moderate Stop and Conservative Stop, calculated as a % below the entry point.
Displayed in the table with black text on a gray background for emphasis.
Alerts trigger when price crosses below these levels.
5️⃣ Take Profits (TP1–TP4)
Calculated from the entry point:
By percentage (usePercentTP = true) or
By fixed prices (usePercentTP = false).
The table displays:
Target price
% gain over the entry point
They only appear when RSI > 50 and EMA50 > EMA200 (the “alignment” condition).
Alerts trigger only on breakouts upward.
6️⃣ Context Indicators
RSI → shows numeric value and green/red color.
MACD → indicates if the MACD line is above or below the signal line.
EMAs 50/200 → indicates “Golden Cross” or “Death Cross”.
Price vs EMA200 → dedicated row showing “Above” or “Below EMA 200” with green/red color.
7️⃣ Visual Panel
Semi–transparent dark gray background, thin borders.
Colored header:
Blue for 4H
Orange for 1D
Rows separated by data type for easy reading.
Configurable font size (tiny to large).
Table position configurable (top_left, top_right, etc.).
8️⃣ Integrated Alerts
Entry/Exit of Buy Zone
Touch of each TP
Touch of each Stop
RSI entering Oversold
All alerts are separated by timeframe with clear, fixed messages.
📌 Simple Summary:
It’s an intelligent panel that combines multi–timeframe technical analysis, automatic calculation of entries/stops/TPs based on oversold conditions, and ready–to–use alerts — all presented in a visual, compact, and fully configurable format.

VHX EMA 135/315📈 EMA 135/315 Cross Strategy – Your Trend Compass with Smart Confirmations
🔍 Core Idea
The EMA 135/315 Cross strategy is a trend-following system.
It tracks two moving averages:
EMA 135 → the “fast” line that reacts to short-term price moves
EMA 315 → the “slow” line that reacts to the bigger trend
When the fast EMA crosses above the slow EMA → market momentum is turning up → BUY signal 🟢
When the fast EMA crosses below the slow EMA → momentum is turning down → SELL signal 🔴
This gives you a clear entry trigger — no guessing, no overcomplication.
✨ On Your Chart
BUY/SELL Arrows
🟢 Green arrow = bullish cross → trend turning up
🔴 Red arrow = bearish cross → trend turning down
Trend Info Panel (Top Left)
Current Trend: BUY / SELL / Neutral
Last Cross: how many bars ago it happened
EMA Gap in %: measures the strength of the trend
Status: “Approaching” if EMAs are getting close → possible cross soon
Automatic TP/SL Levels
📈 TP line (+2% from entry)
📉 SL line (–0.5% from entry)
Saves time — you instantly see your target and protection
EMA Distance Meter
Big % gap = strong trend momentum 🚀
Small % gap = weak or sideways market ⚠️
Real-Time Alerts
You get notified when a cross happens, even if you’re away from the screen
🧠 The Logic Behind It
The EMA 135 reacts faster → it reflects short-term momentum
The EMA 315 moves slower → it reflects the main trend
When the fast EMA overtakes the slow EMA: short-term strength now aligns with the long-term trend → higher probability of a sustained move
The gap % tells you how strong the alignment is — large gap = cleaner moves, small gap = market in transition
“Approaching” status warns that the EMAs are converging, which often happens before a reversal
📊 Boosting the Strategy with Volume Analysis
The EMA cross is a strong trigger, but volume confirms the quality of the move:
High Volume + Cross → more reliable signal, as strong market participation is pushing the trend
Low Volume + Cross → caution, the move might be weak or a false breakout
💡 Tip:
Check the volume histogram or a volume-based indicator (e.g., Volume Profile, OBV).
On a BUY signal: volume should spike above the recent average.
On a SELL signal: watch for strong selling volume bars.
📍 Adding Support & Resistance for Precision
Support and resistance levels help filter out bad trades and optimize entries:
Best BUY setups:
EMA 135 crosses above EMA 315 near a known support zone
Bonus if volume confirms the move
Avoid buying directly into a strong resistance
Best SELL setups:
EMA 135 crosses below EMA 315 near a known resistance zone
Bonus if selling volume is strong
Avoid selling directly into a major support
💡 Use tools like horizontal lines, previous highs/lows, and Volume Profile nodes to spot these zones.
📈 Best Usage Practices
Timeframes
Lower timeframes (1m–5m) → more signals, but more noise → best for scalping with extra filters
Always Combine With Confirmation
EMA Cross = Trigger
Volume spike = Confirmation
S/R zone in your favor = High-probability setup
Manage Risk
Start with the built-in TP/SL
Adjust SL if volatility is higher than usual
Consider trailing stop once price moves in your favor
Avoid Sideways Markets
If EMA gap % is very small and crosses happen often → stand aside until a clear direction forms
Use Alerts
Set alerts for BUY & SELL crosses so you never miss a setup
In short:
This isn’t just an EMA cross indicator — it’s a trend system with built-in risk management, strength measurement, and pre-trade preparation. Combine it with volume confirmation and smart use of support/resistance, and you turn a simple signal into a high-probability trading edge.

Options Strategy V2.0📈 Options Strategy V2.0 – Intraday Reversal-Resilient Momentum System
Overview:
This strategy is designed specifically for intraday SPY, TSLA, MSFT, etc. options trading (0DTE or 1DTE), using high-probability signals derived from a confluence of technical indicators: EMA crossovers, RSI thresholds, ATR-based risk control, and volume spikes. The strategy aims to capture strong directional moves while avoiding overtrading, thanks to a built-in cooldown logic and optional time/session filters.
⚙️ Core Concept
The strategy executes trades only in the direction of the prevailing trend, determined by short- and long-term Exponential Moving Averages (EMA). Entry signals are generated when the Relative Strength Index (RSI) confirms momentum in the direction of the trend, and volume spikes suggest institutional activity.
To increase adaptability and user control, it includes a highly customizable parameter set for both long and short entries independently.
📌 Key Features
✅ Trend-Following Logic
Long entries are only allowed when EMA(short) > EMA(long)
Short entries are only allowed when EMA(short) < EMA(long)
✅ RSI Confirmation
Long: Requires RSI crossover above a configurable threshold
Short: Requires RSI crossunder below a configurable threshold
Optional rejection filters: Entry blocked above/below specific RSI extremes
✅ Volume Spike Filter
Confirms institutional participation by comparing current volume to an average multiplied by a user-defined factor.
✅ ATR-Based Risk Management
Both Stop Loss (SL) and Take Profit (TP) are dynamically calculated using ATR × a multiplier.
TP/SL ratio is fully configurable.
✅ Cooldown Control
After every trade, the system waits for a set number of bars before allowing new entries.
This prevents overtrading and increases signal quality.
Optionally, cooldown is ignored for reversal trades, ensuring the system can react immediately to a confirmed trend change.
✅ Candle Body Filter (Noise Control)
Avoids trades on candles with too small bodies relative to wicks (often noise or indecision candles).
✅ VWAP Confirmation (Optional)
Ensures price is trading above VWAP for long entries, or below for short entries.
✅ Time & Session Filters
Trades only during regular market hours (09:30–16:00 EST).
No-trade zone (e.g., 14:15–15:45 EST) to avoid low-liquidity traps or late-day whipsaws.
✅ End-of-Day Auto Close
All open positions are force-closed at 15:55 EST, protecting against overnight risk (especially relevant for 0DTE options).
📊 Visual Aids
EMA plots show trend direction
VWAP line provides real-time mean-reversion context
Stop Loss and Take Profit lines appear dynamically with each trade
Alerts notify of entry signals and exit triggers
🔧 Customization Panel
Nearly every element of the strategy can be tailored:
EMA lengths (short and long, for both sides)
RSI thresholds and length
ATR length, SL multiplier, and TP/SL ratio
Volume spike sensitivity
Minimum EMA distance filter
Candle body ratio filter
Session restrictions
Cooldown logic (duration + reversal exception)
This makes the strategy extremely versatile, allowing both conservative and aggressive configurations depending on the trader’s profile and the market context.
📌 Example Use Case: SPY Options (0DTE or 1DTE)
This system was designed and tested specifically for SPY and other intraday options trading, where:
Delta is around 0.50 or higher
Trades are short-lived (often 1–5 candles)
You aim to trade 1–3 signals per day, filtering out weak entries
🚫 Important Notes
It is not a scalping strategy; it relies on confirmed breakouts with trend support
No pyramiding or re-entries without cooldown to preserve risk integrity
Should be used with real-time alerts and manual broker execution
📈 Alerts Included
📈 Long Entry Signal
📉 Short Entry Signal
⚠️ Auto-closed all positions at 15:55 EST
✅ Proven Settings – Real Trades + Backtest Results
The current version of the strategy includes the optimal settings I’ve arrived at through extensive backtesting, as well as 3 months of real trading with consistent profitability. These results reflect real-world execution under live market conditions using 0DTE SPY options, with disciplined trade management and risk control.
🧠 Final Thoughts
Options Strategy V2.0 is a robust, highly tunable intraday strategy that blends momentum, trend-following, and volume confirmation. It is ideal for disciplined traders focused on SPY or other 0DTE/1DTE options, and it includes guardrails to reduce false signals and improve execution timing.
Perfect for those who seek precision, flexibility, and risk-defined setups—not blind automation.

Custom P&L Tool (EUR/USD)This tool lets you visually calculate potential Profit & Loss, Risk:Reward, and pip distances for a trade based on your:
Entry price
Stop Loss (SL)
Take Profit (TP)
Lot size (0.01 up to 10 lots)
Trade direction (Long or Short)
🔹 Automatically shows horizontal lines for Entry, TP, and SL
🔹 Displays a live P&L table with:
TP pips
SL pips
Estimated profit/loss in USD
Risk:Reward ratio

1EMA + 1MACD + 1RSI Crypto Strategy AB 092Title: EMA + MACD + RSI Crypto Strategy
Overview:
This is a trend-following and momentum-based crypto trading strategy built for 1H, 4H, and 1D timeframes, combining three proven indicators:
EMA 50 & EMA 200 Crossover – identifies long-term trend direction.
MACD Crossover (12, 26, 9) – confirms momentum shift.
RSI Filter (14) – avoids overbought/oversold traps and refines entries.
Buy Entry Conditions:
EMA 50 > EMA 200 (Golden Cross)
MACD line crosses above signal line
RSI is between 45 and 70
Sell Entry Conditions:
EMA 50 < EMA 200 (Death Cross)
MACD line crosses below signal line
RSI is between 30 and 55
Risk Management:
Configurable Take Profit and Stop Loss percentages via inputs.
Default: 3% TP, 1.5% SL (adjustable based on timeframe and asset volatility).
Best For:
Intraday trades on 1H (BTC, ETH, SOL)
Swing trades on 4H
Position entries on 1D (top 50 altcoins)
This script includes visual Buy/Sell signals, alert conditions, and customizable SL/TP logic — making it a clean, actionable, and reliable strategy for crypto traders.

MA Signal IndicatorMA Signal Indicator
The MA Signal Indicator is a customizable designed to identify potential trading opportunities based on price interactions with a Simple Moving Average (SMA). It incorporates risk management features such as stop-loss (SL), take-profit (TP), and breakeven levels, calculated using the Average True Range (ATR). The indicator is visually intuitive, overlaying trade signals, price levels, and colored zones directly on the chart.
Key Features:
1. Moving Average-Based Signals:
• Generates buy (long) signals when the price crosses above a user-defined SMA (default: 55 periods).
• Generates sell (short) signals when the price crosses below the SMA.
• Long and short trades can be independently enabled or disabled via input settings.
2. Risk Management:
• Stop-Loss (SL): Set as a multiple of the ATR (default: 1x ATR) below the entry price for long trades or above for short trades.
• Take-Profit (TP): Set as a multiple of the ATR (default: 5x ATR) above the entry price for long trades or below for short trades.
• Breakeven Level: A trigger level (default: 2x ATR) where traders may choose to move their stop-loss to breakeven, optionally displayed on the chart.
3. Visual Feedback:
• SMA Line: Plotted in orange (default: 55-period SMA) for trend reference.
• Trade Zone: Highlights the area between the stop-loss and take-profit levels with a semi-transparent green (long) or red (short) background.
• Price Lines: Displays entry price (white), stop-loss (red), take-profit (green), and breakeven level (gray, optional) as horizontal lines during active trades.
• Signal Markers: Triangular markers indicate entry points (green triangle up for long, red triangle down for short).
• Exit Markers: Labels show when a trade hits the take-profit (green checkmark) or stop-loss (red cross).
4. Trade Logic:
• Only one trade is active at a time (long or short).
• Trades are exited when either the stop-loss or take-profit is hit, resetting the indicator for the next signal.
• Ensures signals are only triggered when not already in a trade, avoiding duplicate entries.
Inputs:
• MA Period: Length of the SMA (default: 55).
• ATR Period: Period for ATR calculation (default: 5).
• SL Multiplier: ATR multiplier for stop-loss (default: 1.0).
• TP Multiplier: ATR multiplier for take-profit (default: 5.0).
• Move to Breakeven After: ATR multiplier for breakeven trigger (default: 2.0).
• Show Break Even Line: Option to display the breakeven level (default: true).
• Allow Long Trades: Enable/disable long signals (default: true).
• Allow Short Trades: Enable/disable short signals (default: true).
Use Case:
This indicator is ideal for trend-following traders who want a clear, visual system for entering and exiting trades based on SMA crossovers, with predefined risk and reward levels. It suits both manual and automated trading strategies, providing flexibility to adjust parameters for different markets or timeframes.
Notes:
• The indicator is overlaid on the price chart for easy integration with other analysis tools.
• Users should test and adjust parameters (e.g., MA length, ATR multipliers) to suit their trading style and market conditions.
• The breakeven line is a visual guide; manual adjustment of stops is required as the indicator does not automatically modify trade positions.
This indicator provides a robust framework for disciplined trading with clear entry, exit, and risk management visuals.
Gold Power Hours Strategy📈 Gold Power Hours Trading Strategy
Trade XAUUSD (Gold) or XAUEUR during the most volatile hours of the New York session, using momentum and trend confirmation, with session-specific risk/reward profiles.
✅ Strategy Rules
🕒 Valid Trading Times ("Power Hours"):
Trades are only taken during high-probability time windows on Tuesdays, Wednesdays, and Thursdays , corresponding to key New York session activity:
Morning Session:
08:00 – 11:00 (NY time)
Afternoon Session:
12:30 – 16:00
19:00 – 22:00
These times align with institutional activity and economic news releases.
📊 Technical Indicators Used:
50-period Simple Moving Average (SMA50):
Identifies the dominant market trend.
14-period Relative Strength Index (RSI):
Measures market momentum with session-adjusted thresholds.
🟩 Buy Signal Criteria:
Price is above the 50-period SMA (bullish trend)
RSI is greater than:
60 during Morning Session
55 during Afternoon Session
Must be during a valid day (Tue–Thu) and Power Hour session
🟥 Sell Signal Criteria:
Price is below the 50-period SMA (bearish trend)
RSI is less than:
40 during Morning Session
45 during Afternoon Session
Must be during a valid day and Power Hour session
🎯 Trade Management Rules:
Morning Session (08:00–11:00)
Stop Loss (SL): 50 pips
Take Profit (TP): 150 pips
Risk–Reward Ratio: 1:3
Afternoon Session (12:30–16:00 & 19:00–22:00)
Stop Loss (SL): 50 pips
Take Profit (TP): up to 100 pips
Risk–Reward Ratio: up to 1:2
⚠️ TP is slightly reduced in the afternoon due to typically lower volatility compared to the morning session.
📺 Visuals & Alerts:
Buy signals: Green triangle plotted below the bar
Sell signals: Red triangle plotted above the bar
SMA50 line: Orange
Valid session background: Light pink
Alerts: Automatic alerts for buy/sell signals
