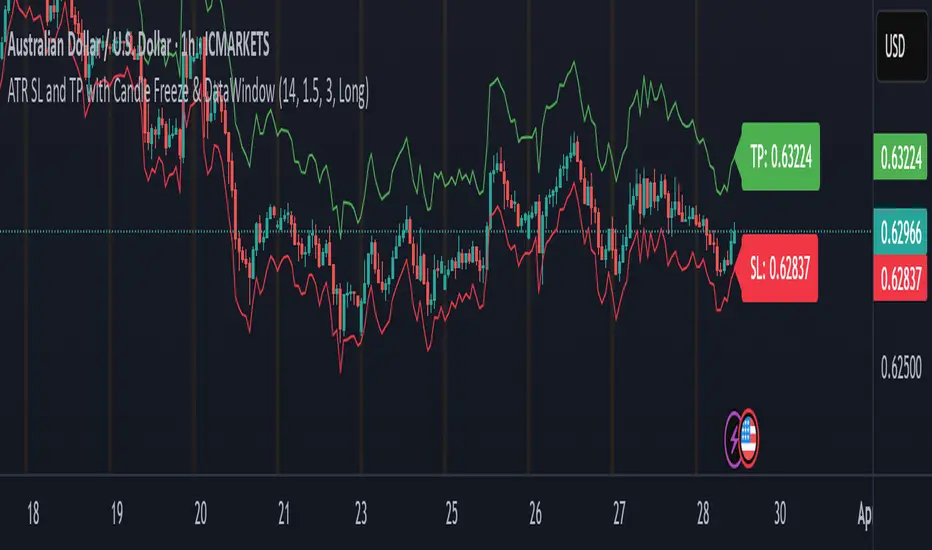
ATR SL and TP with Candle Freeze & DataWindowThis indicator uses the Average True Range (ATR) to automatically calculate your stop loss (SL) and take profit (TP) levels based on the current market volatility and your chosen multipliers. Here's how it works:
ATR Calculation:
The indicator computes the ATR, which measures the average market volatility over a set period. This value helps gauge how much the price typically moves.
SL and TP Determination:
Depending on whether you're in a long or short trade, the SL and TP are calculated relative to the current price:
For a long trade, the stop loss is set below the current price (by subtracting a multiple of the ATR) and the take profit is set above it (by adding a multiple of the ATR).
For a short trade, the calculations are reversed.
Candle Freeze Feature:
Once a new candle starts, the calculated SL and TP values are "frozen" for that candle. This means they remain constant during the candle's formation, preventing them from updating continuously as the price fluctuates. This can make it easier to plan your trades without the levels shifting mid-candle.
Data Window & Labels:
The SL and TP values are plotted on the chart as lines and displayed in labels for quick reference. Additionally, they appear in TradingView's Data Window, so you can easily copy the price numbers if needed.
Overall, the indicator is designed to help you manage your trades by setting dynamic, volatility-adjusted SL and TP levels that only update at the start of each new candle, aligning with your chosen timeframe. Let me know if you have any more questions or need further adjustments!
Cerca negli script per "tp"
Supertrend TP SL (PRO)2. Main Components:
Supertrend Indicator:
Theoretical basis: The Supertrend indicator is based on two main concepts: Average True Range (ATR) and Factor. ATR measures the extent of price fluctuations in a given period of time, while Factor determines the sensitivity of the indicator to price changes.
Mechanism of operation: The indicator calculates two possible lines: one line representing the potential support level and another line representing the potential resistance level. The selection of the appropriate line depends on the current price direction. When the price is above the line, the indicator is considered to be in an uptrend, and vice versa.
Customizable inputs:
atrPeriod: Allows the trader to specify the time period for calculating the ATR. Shorter periods make the indicator more sensitive to price changes, while longer periods reduce its sensitivity.
factor: Allows the adjustment of the factor. Higher values make the indicator less likely to give false signals, but they may also delay entry signals.
Risk Management:
Take Profit and Stop Loss Orders:
TPPoints: Specifies the distance between the entry price and the take profit level. This distance is expressed in points, and is converted to an actual price value using syminfo.mintick (the smallest possible price movement of the traded asset).
SLPoints: Specifies the distance between the entry price and the stop loss level.
Importance: These orders allow the trader to specify the maximum loss he is willing to take and the profit target he is aiming to achieve, which helps in effective risk management.
Activate/Disable Trades:
isLongEnabled: Allows buy trades to be enabled or disabled, which allows the trader to trade in one direction only (for example, only trade in the uptrend during a bull market).
isShortEnabled: Allows sell trades to be enabled or disabled.
isTakeProfitEnabled: Allows take profit orders to be enabled or disabled. The trader may wish to disable them if he prefers to manage his trades manually.
isStopLossEnabled: Allows you to enable or disable stop loss orders. Although disabling them may seem tempting in some cases, it is a very risky move.
Visual Customization:
Line Style and Width:
lineStyle: Allows the trader to choose the style of lines used to draw TP and SL levels (Solid, Dashed, Dotted).
lineWidth: Sets the thickness of the lines.
Label Size:
labelSize: Allows you to set the size of the labels that display TP and SL levels (Small, Normal, Large).
Colors:
bullColor, bearColor, tpColor, slColor: Allows the trader to customize the colors of the different elements on the chart, making visual analysis easier.
3. Strategy Logic:
Determining Entry Signals: The strategy relies on the Supertrend indicator to determine entry signals. When the Supertrend trend changes from bearish to bullish, a buy trade is triggered (if isLongEnabled is enabled). When the trend changes from bullish to bearish, a sell trade is triggered (if isShortEnabled is enabled).
Order Execution: Once the entry signal is triggered, the strategy automatically places buy or sell orders.
Trade Management: After opening a trade, the strategy monitors the price and automatically triggers Take Profit and Stop Loss orders if the price reaches the specified levels.
Visualization: The strategy displays useful information on the chart, such as TP and SL lines, entry and exit signals, which helps the trader understand the strategy’s behavior and evaluate its performance.
4. Advanced Tips:
Optimizing Settings: The strategy’s performance can be improved by adjusting different input values. For example, the trader can experiment with different values for atrPeriod and factor to improve the accuracy of Supertrend signals.
Combining Indicators: This strategy can be combined with other indicators to improve the accuracy of entry signals. For example, the Relative Strength Index (RSI) can be used to confirm Supertrend signals.
Time Analysis: The strategy’s performance can be analyzed over different time periods to evaluate its effectiveness in various market conditions.
Strategy Testing: Before using the strategy in real trading, it should be tested on historical data (Backtesting) to evaluate its performance and determine the optimal settings.
5. Associated Risks:
False Signals: The Supertrend indicator may sometimes give false signals, especially in volatile markets.
Losses: Even with the use of stop loss orders, the trader may be exposed to significant losses.
Over-optimization: Over-optimization of settings on historical data may lead to misleading results. The trader should be careful about generalizing the results to future data.
Over-reliance on automation: The automated strategy should not be relied upon completely. The trader should monitor the trades and make appropriate decisions when necessary.
6. Disclaimer:
I am not a licensed financial advisor. This strategy is provided for educational and illustrative purposes only and should not be considered as investment advice. Trading in financial markets involves significant risks and you may lose your invested capital. Before making any investment decisions, consult a qualified financial advisor and conduct your own research. You alone are responsible for your trading decisions and their results. By using this strategy, you acknowledge and agree that I am not responsible for any losses or damages you may incur.
2. المكونات الرئيسية:
مؤشر Supertrend:
الأساس النظري: يعتمد مؤشر Supertrend على مفهومين رئيسيين هما: متوسط المدى الحقيقي (Average True Range - ATR) ومعامل الضرب (Factor). ATR يقيس مدى تقلبات الأسعار في فترة زمنية محددة، بينما Factor يحدد مدى حساسية المؤشر لتغيرات الأسعار.
آلية العمل: يقوم المؤشر بحساب خطين محتملين: خط يمثل مستوى الدعم المحتمل وخط آخر يمثل مستوى المقاومة المحتمل. يعتمد اختيار الخط المناسب على اتجاه السعر الحالي. عندما يكون السعر أعلى من الخط، يعتبر المؤشر في اتجاه صاعد، والعكس صحيح.
المدخلات القابلة للتخصيص:
atrPeriod: يتيح للمتداول تحديد الفترة الزمنية لحساب ATR. الفترات الأقصر تجعل المؤشر أكثر حساسية لتغيرات الأسعار، بينما الفترات الأطول تقلل من حساسيته.
factor: يسمح بتعديل معامل الضرب. القيم الأعلى تجعل المؤشر أقل عرضة لإعطاء إشارات خاطئة، ولكنها قد تؤخر أيضًا إشارات الدخول.
إدارة المخاطر:
أوامر جني الأرباح وإيقاف الخسارة:
TPPoints: يحدد المسافة بين سعر الدخول ومستوى جني الأرباح. يتم التعبير عن هذه المسافة بالنقاط (Points)، ويتم تحويلها إلى قيمة سعرية فعلية باستخدام syminfo.mintick (أصغر حركة سعرية ممكنة للأصل المتداول).
SLPoints: يحدد المسافة بين سعر الدخول ومستوى إيقاف الخسارة.
الأهمية: تتيح هذه الأوامر للمتداول تحديد الحد الأقصى للخسارة التي يرغب في تحملها والهدف الربحي الذي يسعى لتحقيقه، مما يساعد على إدارة المخاطر بشكل فعال.
تفعيل/تعطيل الصفقات:
isLongEnabled: يسمح بتفعيل أو تعطيل صفقات الشراء، مما يمكن المتداول من التداول في اتجاه واحد فقط (على سبيل المثال، التداول فقط في الاتجاه الصاعد خلال سوق صاعدة).
isShortEnabled: يسمح بتفعيل أو تعطيل صفقات البيع.
isTakeProfitEnabled: يسمح بتفعيل أو تعطيل أوامر جني الأرباح. قد يرغب المتداول في تعطيلها إذا كان يفضل إدارة صفقاته يدويًا.
isStopLossEnabled: يسمح بتفعيل أو تعطيل أوامر إيقاف الخسارة. على الرغم من أن تعطيلها قد يبدو مغريًا في بعض الحالات، إلا أنه يعتبر خطوة محفوفة بالمخاطر للغاية.
التخصيص المرئي:
نمط وعرض الخطوط:
lineStyle: يتيح للمتداول اختيار نمط الخطوط المستخدمة لرسم مستويات TP و SL (Solid, Dashed, Dotted).
lineWidth: يحدد سمك الخطوط.
حجم الملصقات:
labelSize: يسمح بتحديد حجم الملصقات التي تعرض مستويات TP و SL (Small, Normal, Large).
الألوان:
bullColor, bearColor, tpColor, slColor: تتيح للمتداول تخصيص ألوان العناصر المختلفة على الرسم البياني، مما يسهل عملية التحليل البصري.
3. منطق عمل الاستراتيجية:
تحديد إشارات الدخول: تعتمد الاستراتيجية على مؤشر Supertrend لتحديد إشارات الدخول. عندما يتغير اتجاه Supertrend من هابط إلى صاعد، يتم تفعيل صفقة شراء (إذا كانت isLongEnabled مفعلة). وعندما يتغير الاتجاه من صاعد إلى هابط، يتم تفعيل صفقة بيع (إذا كانت isShortEnabled مفعلة).
تنفيذ الأوامر: بمجرد تفعيل إشارة الدخول، تقوم الاستراتيجية بوضع أوامر الشراء أو البيع تلقائيًا.
إدارة الصفقات: بعد فتح الصفقة، تقوم الاستراتيجية بمراقبة السعر وتفعيل أوامر جني الأرباح وإيقاف الخسارة تلقائيًا في حالة وصول السعر إلى المستويات المحددة.
التمثيل المرئي: تعرض الاستراتيجية معلومات مفيدة على الرسم البياني، مثل خطوط TP و SL وإشارات الدخول والخروج، مما يساعد المتداول على فهم سلوك الاستراتيجية وتقييم أدائها.
4. نصائح متقدمة:
تحسين الإعدادات: يمكن تحسين أداء الاستراتيجية من خلال تعديل قيم المدخلات المختلفة. على سبيل المثال، يمكن للمتداول تجربة قيم مختلفة لـ atrPeriod و factor لتحسين دقة إشارات Supertrend.
الجمع بين المؤشرات: يمكن دمج هذه الاستراتيجية مع مؤشرات أخرى لتحسين دقة إشارات الدخول. على سبيل المثال، يمكن استخدام مؤشر القوة النسبية (RSI) لتأكيد إشارات Supertrend.
التحليل الزمني: يمكن تحليل أداء الاستراتيجية على مدى فترات زمنية مختلفة لتقييم مدى فعاليتها في ظروف السوق المتنوعة.
اختبار الاستراتيجية: قبل استخدام الاستراتيجية في التداول الحقيقي، يجب اختبارها على بيانات تاريخية (Backtesting) لتقييم أدائها وتحديد الإعدادات المثلى.
5. المخاطر المرتبطة:
الإشارات الخاطئة: قد يعطي مؤشر Supertrend إشارات خاطئة في بعض الأحيان، خاصة في الأسواق المتقلبة.
الخسائر: حتى مع استخدام أوامر إيقاف الخسارة، قد يتعرض المتداول لخسائر كبيرة.
التحسين المفرط: قد يؤدي التحسين المفرط للإعدادات على بيانات تاريخية إلى نتائج مضللة. يجب أن يكون المتداول حذرًا بشأن تعميم النتائج على البيانات المستقبلية.
الاعتماد الزائد على الأتمتة: يجب عدم الاعتماد بشكل كامل على الاستراتيجية الآلية. يجب على المتداول مراقبة الصفقات واتخاذ القرارات المناسبة عند الضرورة.
6. إخلاء المسؤولية:
أنا لست مستشارًا ماليًا مرخصًا. هذه الاستراتيجية مقدمة لأغراض تعليمية وتوضيحية فقط، ولا ينبغي اعتبارها نصيحة استثمارية. التداول في الأسواق المالية ينطوي على مخاطر كبيرة، وقد تخسر رأس المال المستثمر. قبل اتخاذ أي قرارات استثمارية، استشر مستشارًا ماليًا مؤهلاً وقم بإجراء بحثك الخاص. أنت وحدك المسؤول عن قراراتك التجارية ونتائجها. باستخدام هذه الاستراتيجية، فإنك تقر وتوافق على أنني لست مسؤولاً عن أي خسائر أو أضرار قد تتكبدها.

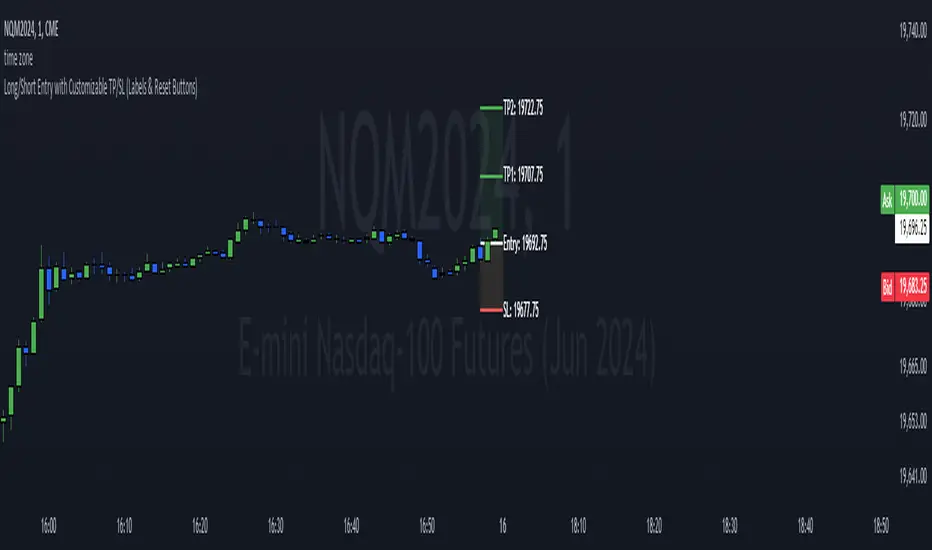
Long/Short Entry with Customizable TP/SLThis TradingView indicator is designed to help traders visualize potential trade entries along with their corresponding stop-loss (SL) and take-profit (TP) levels. It offers a high degree of customization, allowing users to:
Choose Entry Type: Select whether the anticipated trade is a Long or Short position.
Set Entry Price: Specify the exact price level at which you intend to enter the trade.
Customize TP/SL:
Enable/Disable: Choose whether to include a stop-loss (SL) and up to five take-profit (TP) levels.
Distance: Set the distance (in price points) for each SL and TP level from the entry price.
Add/Update Trade: Clicking the "Add/Update Trade" button will plot the entry line, SL line (if enabled), and TP lines (if enabled) on the chart, along with their corresponding labels. The lines and boxes will start two candles before the current bar and extend into the future.
Reset Trade: Clicking the "Reset Trade" button will clear all the lines, boxes, and labels from the chart, allowing you to start fresh with a new trade idea.
Visual Cues:
The indicator uses color-coded lines and boxes to distinguish between entry, SL, and TP levels.
Labels are provided next to each line, displaying the type of level (e.g., "Entry," "SL," "TP1") and its corresponding price.
Key Features:
Highly Customizable: Tailor the indicator to your specific trading style and risk management preferences.
Visual Clarity: Clearly visualize potential trade setups and their outcomes.
Easy to Use: The intuitive interface makes it simple to add, update, and reset trades.
Flexibility: Supports both long and short positions.
Limitations:
The indicator is designed for visualization and planning purposes only. It does not automatically execute trades.
The simulated "Add Trade" and "Reset Trade" buttons require manual unchecking after each click.
Four WMA Strategy with TP and SLBasically I read a research paper on how they used different moving averages for long entries and short entries, and it kind of dawned on me that I always used the same one for long entry or exit, or even swing trading. So I smashed this together to see what would happen.
The strategy combines the use of four different WMAs for identifying trade entry points, along with a predefined take profit (TP) and stop loss (SL) for risk management. Here's a detailed description of its features and how it operates:
Main Features
1. **WMAs as the Core Indicator**:
- The strategy uses four WMAs with different lengths. Two WMAs (`longM1` and `longM2`) are used for long entry signals, and the other two (`shortM1` and `shortM2`) for short entry signals.
- The lengths of these WMAs are adjustable through input parameters.
2. **Trade Entry Conditions**:
- A long entry is signaled when the shorter WMA crosses under the longer WMA .
- Conversely, a short entry is signaled when the shorter WMA crosses under the longer WMA.
3. **Take Profit and Stop Loss**:
- The strategy includes a take profit and stop loss mechanism.
- The TP and SL levels are set as a percentage of the entry price, with the percentage values being adjustable through input parameters.
4. **Visual Representation**:
- The WMAs are plotted on the chart for visual aid, each with a distinct color for easy identification.
How It Works
- The strategy continuously monitors the crossing of WMAs to detect potential entry points for long and short positions.
- Upon detecting a long or short condition, it automatically enters a trade and sets the corresponding TP and SL levels based on the current price and the specified percentages.
- The strategy then actively manages the trade, exiting the position when either the TP or SL level is reached.
Drawbacks
- **Overreliance on WMAs**: The strategy heavily relies on WMAs for trade signals. While WMAs are useful for identifying trends, they might not always provide timely entry and exit signals.
- **Market Conditions**: It may not perform well in highly volatile or sideways markets where WMA crossovers could lead to false signals.
- **Risk Management**: The fixed percentage for TP and SL might not be suitable for all market conditions. Traders might need to adjust these values frequently based on market volatility and their risk tolerance.
Apparently I need to emphasize to use brains when using indicators and setting them up to achieve the results you can or want. Also risk of 12% is considered very high so I lowered the numbers to 5%, which tanked the profits, try adjusting them on your own. Check the properties settings for more info on comission and slippage.
Conclusion
The "Four WMA Strategy with TP and SL" is suitable for traders who prefer a moving average-based approach to trading, combined with a straightforward mechanism for risk management through take profit and stop loss. However, like all strategies, it should be used with an understanding of its limitations and ideally tested thoroughly in various market conditions before applying it to live trading.
Bassi MACD Pro + ADX Filter + Smart Histogram TP + RSIA professional-grade MACD indicator that dramatically reduces false signals by combining four powerful filters:
Key Features
Classic MACD (12,26,9) with clean, high-visibility histogram coloring
ADX + DI filter – only takes trades when ADX > user-defined threshold (default 25) ensuring you trade only in strong trending markets
Smart Histogram Take-Profit logic – automatically detects the exact moment bullish/bearish momentum starts to weaken after a strong move and marks a precise TP level (one TP per trade – no repainting, no multiple signals)
Zero-line crossover confirmation + histogram direction filter – eliminates many whipsaw signals common in regular MACD
Separate RSI pane with overbought/oversold levels and visual markers (for additional confluence – does not interfere with main logic)
Visual Signals
Green “MACD BUY” label + lime triangle = confirmed long entry in strong trend
Red “MACD SELL” label + red triangle = confirmed short entry in strong trend
Small lime/red “TP” triangles = Smart Histogram Take-Profit triggered (perfect exit timing based on momentum fade)
Alert Conditions Included
MACD BUY
MACD SELL
TP Long Hit
TP Short Hit
Combined “Any Signal” alert
Why this version outperforms standard MACD
Most MACD crossovers fail in ranging markets. This script solves that by:
Requiring strong trend (ADX filter)
Confirming histogram is actually growing in the new direction
Waiting for the true zero-line cross with momentum
Giving you an intelligent, non-fixed % take-profit based on real histogram exhaustion
Excellent for swing trading, day trading, crypto, forex, and stocks on any timeframe (works especially well on 1H–4H–Daily).
Clean, fast, no repainting, fully alert-ready.
Add to chart → set your alerts → trade only the highest-probability MACD signals.

Triangle Breakout Strategy with TP/SL, EMA Filter📌 Triangle Breakout Strategy with TP/SL, EMA Filters, and Backtest – Explained.
✅ 1. Pattern Detection – Triangle Breakout
The script scans for triangle patterns by detecting local pivot highs and pivot lows.
It uses two recent highs and two recent lows to draw converging trendlines (upper and lower boundaries of the triangle).
If the price breaks above the upper trendline, a bullish breakout signal is generated.
🎯 2. TP (Take Profit) & SL (Stop Loss)
When a bullish breakout is detected:
A buy order is placed using strategy.entry.
TP and SL levels are calculated relative to the current close price:
TP = 3% above the entry price
SL = 1.5% below the entry price
These are defined using strategy.exit.
📊 3. EMA Filter
An optional filter checks if:
Price is above both EMA 20 and EMA 50
Only if this condition is met, the strategy allows a long entry.
You can toggle the filter on or off with useEMAFilter.
📈 4. Backtesting with Strategy Tester
This script uses strategy() instead of indicator() to enable TradingView’s built-in backtest engine.
Every buy entry and exit (based on TP or SL) is recorded.
📌 5. Visuals
EMA 20 and EMA 50 lines are plotted on the chart.
A label is shown when a breakout is detected: "Breakout Up"
Results (profit, win rate, drawdown, etc.) can be viewed in the Strategy Tester panel.

8:15 AM 15-min Candle Box on 5-min Chart with TP and SLThe “8:15 AM 15-min Candle Box on 5-min Chart with TP and SL” indicator is a custom-built Pine Script tool for breakout trading strategies, particularly tailored for assets like NASDAQ Futures (NAS100) during the U.S. market pre-open.
🔍 What It Does:
Tracks the 8:15–8:30 AM Central Time (CDT) Candle:
It marks the high and low of the 15-minute candle that starts at 8:15 AM (CDT).
The box visually outlines this price range.
Draws a Breakout Box:
At 8:30 AM, a box is drawn from the 8:15 candle’s high and low.
The box stretches forward 8 hours into the session, helping you visualize price interaction with that range.
Detects Breakouts:
If the price closes above the high, it signals a buy breakout.
If it closes below the low, it signals a sell breakout.
Automatically Calculates TP and SL:
Take Profit (TP): 50 pips from the breakout level in the direction of the trade.
Stop Loss (SL): 40 pips in the opposite direction.
Pips are calculated using the symbol’s minimum tick size.
Color Feedback:
Box turns green on a buy breakout, red on a sell breakout.
If TP is reached, the box turns black.
If SL is hit, the box turns purple.
🧠 Why Use This Indicator:
Perfect for pre-market breakout traders who want a visual confirmation of price action around the U.S. market open.
Provides a clear entry range, trade direction, and risk/reward visual cue.
No manual drawing — everything is automated daily based on reliable timing.
Would you like a version with alerts or plotted TP/SL lines as well?

BullBear with Volume-Percentile TP - Strategy [presentTrading] Happy New Year, everyone! I hope we have a fantastic year ahead.
It's been a while since I published an open script, but it's time to return.
This strategy introduces an indicator called Bull Bear Power, combined with an advanced take-profit system, which is the main innovative and educational aspect of this script. I hope all of you find some useful insights here. Welcome to engage in meaningful exchanges. This is a versatile tool suitable for both novice and experienced traders.
█ Introduction and How it is Different
Unlike traditional strategies that rely solely on price or volume indicators, this approach combines Bull Bear Power (BBP) with volume percentile analysis to identify optimal entry and exit points. It features a dynamic take-profit mechanism based on ATR (Average True Range) multipliers adjusted by volume and percentile factors, ensuring adaptability to diverse market conditions. This multifaceted strategy not only improves signal accuracy but also optimizes risk management, distinguishing it from conventional trading methods.
BTCUSD 6hr performance
Disable the visualization of Bull Bear Power (BBP) to clearly view the Z-Score.
█ Strategy, How it Works: Detailed Explanation
The BBP Strategy with Volume-Percentile TP utilizes several interconnected components to analyze market data and generate trading signals. Here's an overview with essential equations:
🔶 Core Indicators and Calculations
1. Exponential Moving Average (EMA):
- **Purpose:** Smoothens price data to identify trends.
- **Formula:**
EMA_t = (Close_t * (2 / (lengthInput + 1))) + (EMA_(t-1) * (1 - (2 / (lengthInput + 1))))
- Usage: Baseline for Bull and Bear Power.
2. Bull and Bear Power:
- Bull Power: `BullPower = High_t - EMA_t`
- Bear Power: `BearPower = Low_t - EMA_t`
- BBP:** `BBP = BullPower + BearPower`
- Interpretation: Positive BBP indicates bullish strength, negative indicates bearish.
3. Z-Score Calculation:
- Purpose: Normalizes BBP to assess deviation from the mean.
- Formula:
Z-Score = (BBP_t - bbp_mean) / bbp_std
- Components:
- `bbp_mean` = SMA of BBP over `zLength` periods.
- `bbp_std` = Standard deviation of BBP over `zLength` periods.
- Usage: Identifies overbought or oversold conditions based on thresholds.
🔶 Volume Analysis
1. Volume Moving Average (`vol_sma`):
vol_sma = (Volume_1 + Volume_2 + ... + Volume_vol_period) / vol_period
2. Volume Multiplier (`vol_mult`):
vol_mult = Current Volume / vol_sma
- Thresholds:
- High Volume: `vol_mult > 2.0`
- Medium Volume: `1.5 < vol_mult ≤ 2.0`
- Low Volume: `1.0 < vol_mult ≤ 1.5`
🔶 Percentile Analysis
1. Percentile Calculation (`calcPercentile`):
Percentile = (Number of values ≤ Current Value / perc_period) * 100
2. Thresholds:
- High Percentile: >90%
- Medium Percentile: >80%
- Low Percentile: >70%
🔶 Dynamic Take-Profit Mechanism
1. ATR-Based Targets:
TP1 Price = Entry Price ± (ATR * atrMult1 * TP_Factor)
TP2 Price = Entry Price ± (ATR * atrMult2 * TP_Factor)
TP3 Price = Entry Price ± (ATR * atrMult3 * TP_Factor)
- ATR Calculation:
ATR_t = (True Range_1 + True Range_2 + ... + True Range_baseAtrLength) / baseAtrLength
2. Adjustment Factors:
TP_Factor = (vol_score + price_score) / 2
- **vol_score** and **price_score** are based on current volume and price percentiles.
Local performance
🔶 Entry and Exit Logic
1. Long Entry: If Z-Score crosses above 1.618, then Enter Long.
2. Short Entry: If Z-Score crosses below -1.618, then Enter Short.
3. Exiting Positions:
If Long and Z-Score crosses below 0:
Exit Long
If Short and Z-Score crosses above 0:
Exit Short
4. Take-Profit Execution:
- Set multiple exit orders at dynamically calculated TP levels based on ATR and adjusted by `TP_Factor`.
█ Trade Direction
The strategy determines trade direction using the Z-Score from the BBP indicator:
- Long Positions:
- Condition: Z-Score crosses above 1.618.
- Short Positions:
- Condition: Z-Score crosses below -1.618.
- Exiting Trades:
- Long Exit: Z-Score drops below 0.
- Short Exit: Z-Score rises above 0.
This approach aligns trades with prevailing market trends, increasing the likelihood of successful outcomes.
█ Usage
Implementing the BBP Strategy with Volume-Percentile TP in TradingView involves:
1. Adding the Strategy:
- Copy the Pine Script code.
- Paste it into TradingView's Pine Editor.
- Save and apply the strategy to your chart.
2. Configuring Settings:
- Adjust parameters like EMA length, Z-Score thresholds, ATR multipliers, volume periods, and percentile settings to match your trading preferences and asset behavior.
3. Backtesting:
- Use TradingView’s backtesting tools to evaluate historical performance.
- Analyze metrics such as profit factor, drawdown, and win rate.
4. Optimization:
- Fine-tune parameters based on backtesting results.
- Test across different assets and timeframes to enhance adaptability.
5. Deployment:
- Apply the strategy in a live trading environment.
- Continuously monitor and adjust settings as market conditions change.
█ Default Settings
The BBP Strategy with Volume-Percentile TP includes default parameters designed for balanced performance across various markets. Understanding these settings and their impact is essential for optimizing strategy performance:
Bull Bear Power Settings:
- EMA Length (`lengthInput`): 21
- **Effect:** Balances sensitivity and trend identification; shorter lengths respond quicker but may generate false signals.
- Z-Score Length (`zLength`): 252
- **Effect:** Long period for stable mean and standard deviation, reducing false signals but less responsive to recent changes.
- Z-Score Threshold (`zThreshold`): 1.618
- **Effect:** Higher threshold filters out weaker signals, focusing on significant market moves.
Take Profit Settings:
- Use Take Profit (`useTP`): Enabled (`true`)
- **Effect:** Activates dynamic profit-taking, enhancing profitability and risk management.
- ATR Period (`baseAtrLength`): 20
- **Effect:** Shorter period for sensitive volatility measurement, allowing tighter profit targets.
- ATR Multipliers:
- **Effect:** Define conservative to aggressive profit targets based on volatility.
- Position Sizes:
- **Effect:** Diversifies profit-taking across multiple levels, balancing risk and reward.
Volume Analysis Settings:
- Volume MA Period (`vol_period`): 100
- **Effect:** Longer period for stable volume average, reducing the impact of short-term spikes.
- Volume Multipliers:
- **Effect:** Determines volume conditions affecting take-profit adjustments.
- Volume Factors:
- **Effect:** Adjusts ATR multipliers based on volume strength.
Percentile Analysis Settings:
- Percentile Period (`perc_period`): 100
- **Effect:** Balances historical context with responsiveness to recent data.
- Percentile Thresholds:
- **Effect:** Defines price and volume percentile levels influencing take-profit adjustments.
- Percentile Factors:
- **Effect:** Modulates ATR multipliers based on price percentile strength.
Impact on Performance:
- EMA Length: Shorter EMAs increase sensitivity but may cause more false signals; longer EMAs provide stability but react slower to market changes.
- Z-Score Parameters:*Longer Z-Score periods create more stable signals, while higher thresholds reduce trade frequency but increase signal reliability.
- ATR Multipliers and Position Sizes: Higher multipliers allow for larger profit targets with increased risk, while diversified position sizes help in securing profits at multiple levels.
- Volume and Percentile Settings: These adjustments ensure that take-profit targets adapt to current market conditions, enhancing flexibility and performance across different volatility environments.
- Commission and Slippage: Accurate settings prevent overestimation of profitability and ensure the strategy remains viable after accounting for trading costs.
Conclusion
The BBP Strategy with Volume-Percentile TP offers a robust framework by combining BBP indicators with volume and percentile analyses. Its dynamic take-profit mechanism, tailored through ATR adjustments, ensures that traders can effectively capture profits while managing risks in varying market conditions.

Enhanced BOS Strategy with SL/TP and EMA TableDescription:
The Enhanced BOS (Break of Structure) Strategy is an advanced open-source trading indicator designed to identify key market structure changes, integrated with dynamic Stop Loss (SL) and Take Profit (TP) levels, along with an informative EMA (Exponential Moving Average) table for added trend analysis.
Key Features:
Break of Structure (BOS) Detection:
The script detects bullish and bearish BOS by identifying pivot points using a custom pivot period. When the price crosses above or below these points, it signals a potential market trend reversal or continuation.
Dynamic SL/TP Levels:
Users can toggle static SL/TP settings, which automatically calculate levels based on user-defined points. These levels are visualized on the chart with dotted lines and labeled for clarity.
Volume Filters:
The strategy includes a volume condition filter to ensure that only trades within a specified volume range are considered. This helps in avoiding low-volume trades that might lead to false signals.
EMA Table Display:
An on-chart table displaying the current values of the 13-period, 50-period, and 200-period EMAs. This provides a quick reference for trend identification and confirmation, helping traders to stay aligned with the broader market trend.
How It Works:
The script utilizes a combination of moving averages and pivot points to identify potential breakouts or breakdowns in market structure. When a bullish BOS is detected, and the volume conditions are met, the strategy suggests a long position, marking potential SL/TP levels. Similarly, it suggests short positions for bearish BOS.
The EMA table serves as a visual aid, providing real-time updates of the EMA values, allowing traders to gauge the market’s directional bias quickly.
How to Use:
Setting Parameters:
Adjust the pivot period to fine-tune BOS detection according to your trading style and the asset’s volatility.
Configure the SL/TP settings based on your risk tolerance and target profit levels.
Interpreting Signals:
A “Buy” label on the chart indicates a bullish BOS with volume confirmation, signaling a potential long entry.
A “Sell” label indicates a bearish BOS with volume confirmation, signaling a potential short entry.
The EMA table aids in confirming these signals, where the position of the fast, mid, and slow EMAs can provide additional context to the trend’s strength and direction.
Volume Filtering:
Ensure your trades are filtered through the script’s volume condition, which allows for the exclusion of low-volume periods that might generate unreliable signals.
Unique Value:
Unlike many other BOS strategies, this script integrates volume conditions and a visual EMA table, providing a comprehensive toolkit for traders looking to capture market structure shifts while maintaining an eye on trend direction and trade execution precision.
Additional Information:
This script is designed for use on standard bar or candlestick charts for best results.
It is open-source and free to use, encouraging collaboration and improvement by the TradingView community.
By combining powerful trend-following EMAs with the precision of BOS detection and the safety of volume filtering, the Enhanced BOS Strategy offers a balanced approach to trading market structure changes.

SILVER Midnight Candle Color Strategy 1-Hour Delay and SL/TP Overview:
The "Midnight Candle Color Strategy with 1-Hour Delay and SL/TP" is a unique trading strategy designed for the Forex market. This strategy capitalizes on the color of the midnight candle based on New York time, making trade decisions one hour later, at 1:00 AM.
Key Features:
Time Zone Adjustment: Automatically adjusts to New York time (UTC-5 or UTC-4 during Daylight Saving Time).
Midnight Candle Analysis: Utilizes the color of the midnight candle to gauge market sentiment.
Trade Execution at 1 AM: Trades are executed one hour after midnight based on the previous day's candle color.
Strategic SL/TP: Incorporates predefined stop loss (SL) and take profit (TP) levels for each trade.
How It Works:
The script first determines whether the current bar represents 12:00 AM or 1:00 AM in New York time.
At midnight, it records the color of the candle (green for bullish, red for bearish).
At 1:00 AM, the strategy:
Enters a long position if the midnight candle was green, with specific TP and SL settings.
Enters a short position if the midnight candle was red, again with defined TP and SL.
Visualization:
Optional markers are plotted on the chart for easy visualization of the strategy's entry points at midnight and 1 AM.
Usage Tips:
Ideal for traders focusing on overnight price movements and early morning trends.
Best suited for SILVER trading due to the 24-hour trading cycle.
We recommend backtesting the strategy with historical data to evaluate performance.
Disclaimer:
This strategy is provided for educational purposes and should not be considered as financial advice. Users should conduct their own research and exercise caution while trading. Past performance is not indicative of future results.
I´m not a signal service, however I´m sharing my signals. For free. If you wish to buy something, contact some other signalist, preferably with 5-10-15-20K followers, selling signals on the premium channel, but in reality not trading them themselves. If you will realise after few blown account that something is wrong, ask yourself why is that. Trading is not pushing the buy-sell button and drinking tequila on the beach. If you want to learn, you know what to do.

Marubozu Detector with Dynamic SL/TP
Strategy Overview:
This indicator detects a "Marubozu" bullish pattern or a “Marubozu” bearish pattern to suggest potential buy and sell opportunities. It uses dynamic Stop Loss (SL) and Take Profit (TP) management, based on either market volatility (ATR) or liquidity zones.
This tool is intended for educational and informational purposes only.
Key Features:
Entry: Based on detecting Marubozu bullish or bearish candle pattern.
Exit: Targets are managed through ATR multiples or previous liquidity levels (swing highs or swing lows).
Smart Liquidity: Optionally identify deeper liquidity targets.
Full Alerts: Buy and Sell signals supported with customizable alerts.
Visualized Trades: Entry, SL, and TP levels are plotted on the chart.
User Inputs:
ATR Length, ATR Multipliers
Take Profit Mode (Liquidity/ATR)
Swing Lookback and Strength
Toggleable Buy/Sell alerts
All Time Frames
📖 How to Use:
Add the Indicator:
Apply the script to your chart from the TradingView indicators panel.
Look for Buy Signals:
A buy signal is triggered when the script detects a "Marubozu" bullish pattern.
Entry, Stop Loss, and Take Profit levels are plotted automatically.
Look for Sell Signals:
A Sell signal is triggered when the script detects a "Marubozu" bearish pattern.
Entry, Stop Loss, and Take Profit levels are plotted automatically.
Choose Take Profit Mode:
ATR Mode: TP is based on a volatility target.
Liquidity Mode: TP is based on past swing highs.
Set Alerts (Optional):
Enable Buy/Sell alerts in the settings to receive real-time notifications.
Practice First:
Always backtest and paper trade before live use.
📜 Disclaimer:
This script does not offer financial advice.
No guarantees of profit or performance are made.
Use in demo accounts or backtesting first.
Always practice proper risk management and seek advice from licensed professionals if needed.
✅ Script Compliance:
This script is designed in full accordance with TradingView’s House Rules for educational tools.
No financial advice is provided, no performance is guaranteed, and users are encouraged to backtest thoroughly.

[AcerX] Leverage, TP & Optimal TP CalculatorHow It Works
Inputs:
Portfolio Allocation (%): The percentage of your portfolio you're willing to risk on the trade.
Stop Loss (%): The stop loss distance below the entry price.
Taker Fee (%) and Maker Fee (%): The fees applied on entry and exit.
Calculations:
The script calculates the required "raw" leverage to risk 1% of your portfolio.
It floors the computed leverage to an integer ("effectiveLeverage").
If the computed leverage is less than 1, it shows an error message (and suggests the maximum allocation for at least 1× leverage).
Otherwise, it calculates the TP levels for target profits of 1.2%, 1.5%, and 2%, and an "Optimal TP" that nets a 1% profit after fees.
Display:
A table is drawn on the top right corner of your chart displaying the effective leverage, the TP levels, and an error message if applicable.
Simply add this script as a new indicator in TradingView, and adjust the inputs as needed.
Happy trading!

Auto Swing TPAutomatic TP generator from recent swing highs and swing lows
Multiple long & short TPs from current price are displayed.
Results will differ by timeframe.
The main parameter is the "cell size" which is the least significant price move for the current asset. The default value of 0.4% is optimized for crypto. You may want to use less for less volatile asset classes.
How it works
We divide price into cells of a certain percent sizes, mainly because this makes the computation a lot easier.
We note in which bar every price cell was last visited. We take the distance to the current bar and then the logarithm of that to a certain base (the "time dimension"). Using a logarithm gives a nice balance of near-term and long-term targets. We call that logarithmic value the "level" of that price cell.
If a price cell has a significantly higher or lower level (at least by +2 or -2) than the cell above or below, this is considered a possible TP area.
Finally we check if the trade makes sense (meaning is of a certain size, at least 10 cells by default). If yes, we reduce the TP by a bit (by default 2 cells) and add it to the chart.

Supertrend (Buy/Sell) With TP & SLSupertrend (Buy/Sell) with TP & SL: An Enhanced Trading Tool
This Pine Script indicator combines the popular Supertrend indicator with multiple take-profit (TP) and stop-loss (SL) levels, providing traders with a comprehensive visual aid for potential entries, exits, and risk management.
Originality
Buffer Zones for Precision: Instead of relying solely on the Supertrend line, this script incorporates buffer zones around it. This helps filter out false signals, especially in volatile markets, leading to more accurate buy/sell signals.
Flexible Stop-Loss: Offers the choice between a fixed or trailing stop-loss, allowing traders to tailor their risk management approach based on their preferences and market conditions.
Multiple Take-Profit Levels: Provides three potential take-profit levels, giving traders the flexibility to secure profits at different stages of a trend.
Heikin Ashi Candles & VWAP: Incorporates Heikin Ashi candles for smoother trend visualization and adds a VWAP line for potential support/resistance levels.
Clear Table Display: Presents key information like Stop Loss and Take Profit levels in a user-friendly table, making it easier to track trade targets.
How It Works
Supertrend Calculation: The Supertrend is calculated using ATR (Average True Range) to gauge market volatility. The script then creates buffer zones around the Supertrend line for refined signal generation.
Buy/Sell Signals:
Buy: When the close price crosses above the upper buffer zone, indicating a potential uptrend.
Sell: When the close price crosses below the lower buffer zone, suggesting a potential downtrend.
Take Profit & Stop Loss:
Take Profits: Three TP levels are calculated based on ATR and a customizable profit factor.
Stop Loss: The stop-loss can be set as either a fixed value based on ATR or as a trailing stop-loss that dynamically adjusts to lock in profits.
How To Use
Add the Indicator: Search for "Supertrend (Buy/Sell) With TP & SL" in the TradingView indicators list and add it to your chart.
Customize Inputs: Adjust parameters like ATR Period, Factor, Take Profit Factor, Stop Loss Factor, Stop Loss Type, etc., based on your trading style and preferences.
Interpret Signals: Look for buy signals when the price crosses above the upper buffer and sell signals when it crosses below the lower buffer.
Manage Risk: Use the plotted Take Profit and Stop Loss levels to manage your risk and potential rewards.
Concepts
Supertrend: A trend-following indicator that helps identify the direction of the prevailing trend.
ATR (Average True Range): A measure of market volatility.
Buffer Zones: Used to filter out false signals by creating a zone around the Supertrend line.
Trailing Stop Loss: A dynamic stop-loss that moves with the price to protect profits.
Heikin Ashi: A type of candlestick chart designed to filter out market noise and make trends easier to identify.
VWAP (Volume Weighted Average Price): An indicator that shows the average price at which a security has traded throughout the day, based on both volume and price.
Important Note: This script is for educational and informational purposes only. Backtest thoroughly and use with caution in live trading. Always manage your risk appropriately.

RSI Strategy with Manual TP and SL 19/03/2024This TradingView script implements a simple RSI (Relative Strength Index) strategy with manual take profit (TP) and stop-loss (SL) levels. Let's break down the script and analyze its components:
RSI Calculation: The script calculates the RSI using the specified length parameter. RSI is a momentum oscillator that measures the speed and change of price movements. It ranges from 0 to 100 and typically values above 70 indicate overbought conditions while values below 30 indicate oversold conditions.
Strategy Parameters:
length: Length of the RSI period.
overSold: Threshold for oversold condition.
overBought: Threshold for overbought condition.
trail_profit_pct: Percentage for trailing profit.
Entry Conditions:
For a long position: RSI crosses above 30 and the daily close is above 70% of the highest close in the last 50 bars.
For a short position: RSI crosses below 70 and the daily close is below 130% of the lowest close in the last 50 bars.
Entry Signals:
Long entry is signaled when both conditions for a long position are met.
Short entry is signaled when both conditions for a short position are met.
Manual TP and SL:
Take profit and stop-loss levels are calculated based on the entry price and the specified percentage.
For long positions, the take profit level is set above the entry price and the stop-loss level is set below the entry price.
For short positions, the take profit level is set below the entry price and the stop-loss level is set above the entry price.
Strategy Exits:
Exit conditions are defined for both long and short positions using the calculated take profit and stop-loss levels.
Chart Analysis:
This strategy aims to capitalize on short-term momentum shifts indicated by RSI crossings combined with daily price movements.
It utilizes manual TP and SL levels, providing traders with flexibility in managing their positions.
The strategy may perform well in ranging or oscillating markets where RSI signals are more reliable.
However, it may encounter challenges in trending markets where RSI can remain overbought or oversold for extended periods.
Traders should backtest this strategy thoroughly on historical data and consider optimizing parameters to suit different market conditions.
Risk management is crucial, so traders should carefully adjust TP and SL percentages based on their risk tolerance and market volatility.
Overall, this strategy provides a structured approach to trading based on RSI signals while allowing traders to customize their risk management. However, like any trading strategy, it should be used judiciously and in conjunction with other forms of analysis and risk management techniques.

Trading TP SL Risk Commission Calculator🎉 Introducing Your Trading TP SL Risk Commission Calculator! 🎉
Hey there, savvy trader! 🚀 Are you looking to enhance your trading game? Meet the Trading TP SL Risk Commission Calculator! This handy tool is here to guide you through the complexities of trading, providing insights into your potential risks and rewards. Let's walk through how you can leverage it for smarter trading decisions!
Setting Up 🛠
Let's get your calculator ready for action:
Lines and Labels Visibility: Flip this switch on to see your Entry, Take Profit (TP), Stop Loss (SL), and Liquidation points displayed on your chart. It's a great way to get a visual summary of your strategy.
Input Your Trade Details: Enter your Entry Price, Take Profit Price, and Stop Loss Price. These figures are crucial for mapping out your trade.
Order Info: Specify your Order Size in USD, the amount of Leverage you're using, and your platform's Commission Rate. This customizes the calculator to fit your unique trading setup.
Customizing Your View 🎨
Table Placement & Size: Pick the location and size for your results table to appear on your screen. Tailor it to your liking, whether you prefer it out of the way or front and center.
Deciphering Your Results 📊
With your inputs in place, the calculator springs into action. Here's what you'll find:
Risk Assessment (with Emojis!): Quickly gauge your risk level with our intuitive emoji system, ranging from "⛔️⛔️⛔️" (very high risk) to "✅✅✅" (very low risk).
Profit and Loss Insights: Understand your potential take-profit gains and stop-loss implications, both as percentages and in USD. We also factor in fees to give you a clear picture.
Liquidation Alert: For those using leverage, the liquidation price calculation is crucial to avoid unpleasant surprises.
Expert Tips 💡
Stay Flexible: Market conditions evolve, so should your strategy. Revisit and adjust your inputs regularly to stay aligned with your trading goals.
Risk Emoji Check: Keep an eye on your risk level emojis. A sea of "⛔️" might signal it's time to reassess your approach.
Use Visual Guides: The on-chart lines and labels offer a quick visual reference to how your current trade measures up against your TP, SL, and liquidation thresholds.
Dive In and Trade Smart! 🚦
This calculator isn't just about making calculations; it's about empowering you to make informed trading decisions. With this tool in your arsenal, you're equipped to navigate the trading waters with confidence and clarity.

Sadgir Patterns with SL/TPThe "Sadgir Patterns with SL/TP" is a cutting-edge trading indicator designed for traders seeking to leverage the power of Hull Moving Averages in conjunction with phase accumulation analysis. This unique indicator, developed on the Pine Script platform, is ideal for various markets, including stocks, forex, cryptocurrencies, and commodities.
Key Features:
Adaptive Hull Moving Average: Utilizes an adaptive Hull Moving Average, which provides a smooth and responsive moving average line, aiding in identifying trend directions and potential market reversals.
Phase Accumulation Analysis: Integrates phase accumulation calculations to dynamically adjust the length of the Hull Moving Average, ensuring that the indicator stays in sync with market conditions.
Signal Generation: Generates clear "Long" and "Short" signals, which are visually represented on the chart, assisting traders in making informed decisions.
Dynamic Stop Loss and Take Profit Levels: Automatically calculates and plots dynamic stop loss (SL) and take profit (TP) levels as horizontal lines on the chart, based on user-defined percentage settings. These levels adjust in real-time with the price action, offering a systematic approach to risk management.
Customizable Settings: Provides users with the flexibility to adjust the source of the moving average, power settings for the Hull Moving Average, cycles, and powers for phase accumulation, as well as the percentage values for SL and TP levels.
Visual and Alert Features: Includes options for coloring the bars based on the trend direction and displays trade signals with distinct shapes. Additionally, alert conditions are set for both Long and Short signals, enabling traders to stay informed of potential trade opportunities.
Usage:
This indicator is designed for traders of all levels, from beginners to advanced. It can be used for trend following, catching reversals, or as part of a larger trading strategy. The dynamic SL and TP levels aid in managing trades effectively, providing both entry and exit points. However, traders are advised to use this indicator in conjunction with other analysis tools and consider the overall market context for the best results.
Disclaimer:
Trading involves risk, and it's important to do your own research and consider your risk tolerance before using this indicator. This tool is not intended as financial advice.
NSE:BANKNIFTY
NSE:NIFTY
MCX:CRUDEOIL1!

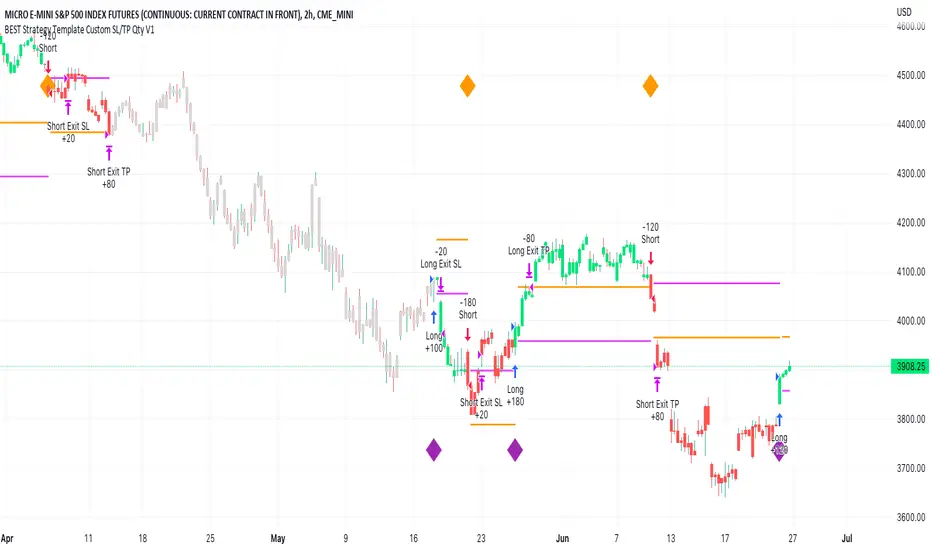
BEST Strategy Template w/ Custom SL/TP Size - EducationalHello traders
I'm getting this question at least once per week: "how to define a custom exit quantity for my stop loss and a different one for my take profit"
Instead of answering every day the same question in my DMs, I've decided to publish an educational strategy template script using this
Features
- Select to use or not the SL and/or TP
- Define how many pips/USD the SL/TP should be set at from the entry
- Define what quantity percentage you want to close at SL and/or at TP (lines 301 to 320 in the code)
- Classical custom trailing stop where the SL is moved to breakeven once the TP is hit
- Get real-time backtesting stats based on the options you've selected
Update
You might not know it yet but from last week (or maybe the week before), the qty/qty_percent from the strategy.exit function refers now to the initial position size (and not the remaining position size like before)
For example:
strategy.exit("EX1", qty_percent = 50, stop = constant)
strategy.exit("EX2", qty_percent = 20, stop = constant)
What happened before
After "EX1" reaches SL levels, "EX2" exits 20% from the % of the remaining position size.
If the initial position size = 100 contracts
EX1 exits 50 contracts
EX2 exits 20% of 50 contracts = 10 contracts
What's happening now
After "EX1" reaches SL levels, "EX2" exits 20% from the % of the original position size.
If the initial position size = 100 contracts
EX1 exits 50 contracts
EX2 exits 20 (20% of 100 contracts) contracts
I think this is an improvement and I really enjoy this new behavior.
See you in a few days with another post :)
ALL THE BEST
Dave
Dynamic TP Based on RR - Position ToolSimple indicator that automatically plots the take-profit (TP) level based on the below inputs:
- Entry price
- Stop-loss (SL)
- Risk-to-reward (RR)
The long/short-position drawing tools are simple enough to use, but wanted something that will automatically plot the TP instead. Couldn't find anything basic and free of extra features so built this instead.
This is how I use it.
1 (optional): Use the long/short-position drawing tool to plot the entry and stop-loss levels
2: Enable the indicator and enter the inputs
- Entry
- SL
- RR
3: The TP will automatically plot. Change the RR to your liking.

XRP Non-Stop Strategy (TP 25% / SL 15%)XRP Non-Stop Strategy (TP 25% / SL 15%) is a continuous long-side trading system designed specifically for XRP. The strategy uses an EMA-based trend filter (EMA20/EMA50) to confirm bullish conditions before entering a long position. Each trade applies a fixed +25% Take Profit target and a −15% Stop Loss, calculated dynamically from the entry price.
When a trade closes—whether by TP or SL—the strategy automatically re-enters on the next qualifying signal, enabling uninterrupted position cycling.
Features include:
• EMA-based trend confirmation
• Dynamic TP/SL visualization on the chart
• Clear BUY and EXIT markers
• Dedicated alert conditions for automation

Pearson SL/TP📘 Description
Pearson SL/TP — Advanced Correlation-Based Strategy with Full Risk Management
The Pearson SL/TP indicator is an advanced market analysis tool that combines Pearson correlation, volatility-based stop/target levels, and dynamic signal strength evaluation.
It is designed for traders who want to visualize potential momentum shifts and risk/reward zones in a single, integrated chart.
🔍 Core Concept
This script measures the **Pearson correlation coefficient between recent price movements and time progression, highlighting potential trend exhaustion or momentum reversals when the correlation reaches extreme values.
* High positive correlation (near +1) → price moving steadily upward → possible overbought condition.
* High negative correlation (near -1) → price moving steadily downward → possible oversold condition.
When these extremes are reached, and confirmed by several internal filters, the script generates LONG or SHORT signals with fully calculated Stop Loss and Take Profit levels.
⚙️ Main Features
📈 Signal Generation
* Uses Pearson correlation as a primary indicator of trend intensity.
* Detects potential reversal zones when correlation crosses user-defined thresholds.
* Optional divergence confirmation enhances signal reliability.
💰 Risk Management
* Stop Loss (SL) and Take Profits (TP1 & TP2) automatically adapt to volatility using the ATR (Average True Range).
* Dynamic risk/reward ratios help assess trade quality.
* Adjustable multipliers let you fine-tune your risk parameters.
🧠 Signal Strength Analysis
Each signal is graded from Weak to Very Strong based on four factors:
1. Volume activity
2. Trend alignment
3. Pearson momentum
4. Correlation change intensity
🎨 Visualization
* Overbought / Oversold background zones
* Signal arrows (LONG / SHORT)
* SL / TP** price levels and labels
* Interactive dashboard** displaying:
* Current Pearson value
* Market state (Overbought / Oversold / Neutral)
* Signal strength
* Latest trade data (Entry, SL, TP1, TP2, Risk:Reward)
🔔 Alerts
Built-in alerts for:
* Confirmed LONG / SHORT signals
* Bullish / Bearish divergences
🧩 Customization
All major parameters — including **Pearson length, thresholds, ATR multipliers, and visual options — are fully customizable.
This allows you to adapt the indicator to any market, timeframe, or trading style.

EMA Dual with SL/TP ATR basedDouble EMA with cross and direction display.
Calculate stop loss / take profit based on ATR
If entering is not in the recognize direction also SL/TP is display (inversed values)
SL is 2xATR and TP is 4xAT by default - can be change
Also, SL/TP can be calculated at cross or at actual - see the table.

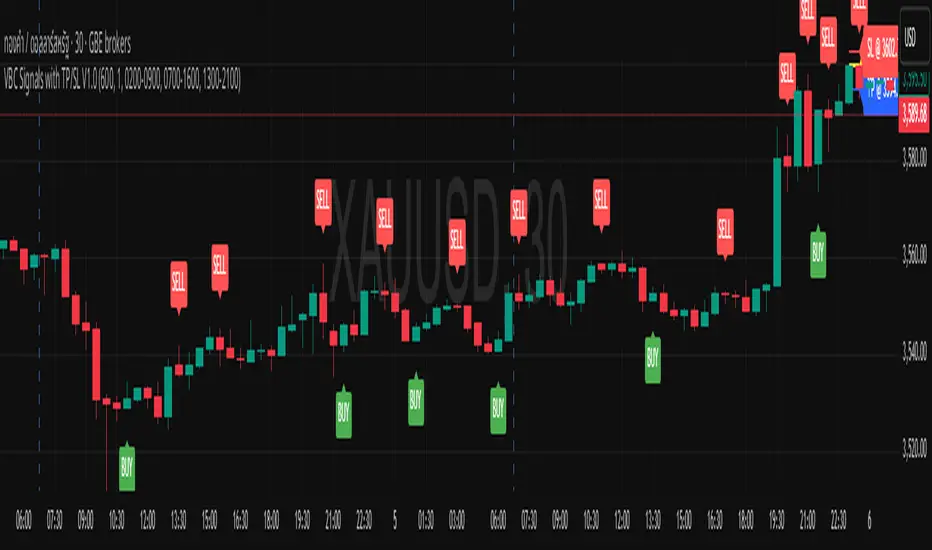
VBC Signals with TP/SL V1.0This script was based on volume break candle theory.
VBC has a very simple idea. It uses the principle that if the price of the XAUUSD asset rises above a specified range of at least 600 points (configuarable) continuously, and a candle breaks the upward trend, a signal will be generated to sell. The entry principle is to enter at the price at the last bullish candle with TP300 SL300.
On the other hand, if the price of xauusd falls below the specified level of 600 points and a candle breaks the price down by 1 candle, a BUY signal will occur, and the ENTRY and TP SL will use the same values as the SELL signalใ
How it works:
SELL SIGNAL : When the asset price rises above 600 points continuously and a "SELL" signal occurs, place a limit sell order at the pair of green and red bars that formed the signal, specifying a TP of 300 and SL of 300.
BUY SIGNAL : When the asset price falls more than 600 points continuously and a "BUY" signal occurs, place a limit sell order at the double bar pattern of the red and green bars that formed the signal, specifying a TP of 300 and a SL of 300.
Disclaimer: This script is for educational purposes only. It does not constitute financial advice. Always do your own research before making trading decisions.
NOTE: For certain XAUUSD of certain broker (for instance XAUUSD on OANDA), the signal might found to often, just multiple the threshold by 10, then 600 will be come 6000